COVID-19 Biopharmaceutical Innovation and Industry Appropriation
-
Tomas J. Philipson
 ,
A. Mark Fendrick
,
A. Mark Fendrick

Abstract
The rapid emergence of vaccines and therapeutics in response to the onset of the coronavirus (COVID-19) pandemic demonstrated the value of medical innovation. These advances not only led to enhanced patient welfare by reducing the disease’s mortality and morbidity but also reduced the need for costly prevention measures, such as cuts in economic activity. This paper offers the first estimate of the portion of economic value generated by these medical innovations that was appropriated as earnings by the innovating companies, measured by the ratio of company earnings to the overall societal value generated by the innovations. To estimate the value and appropriation of COVID-19 innovations, one must necessarily make assumptions about what disease-specific and preventive activity would have been in the absence of these new innovations. To obtain robustness in our findings across such scenarios, we estimate industry appropriation across a wide range of counterfactual scenarios that would occur under no innovation. These scenarios include previous assessments of the contributing subparts of the value generated by the innovations. Our primary finding is that, within the large range of these counterfactual scenarios, upper-bound measures of the proportion of value appropriated by the industry ranged from 0.2 % to 4.6 % of the value generated by the vaccine and treatment innovations. Even though these are upper bound appropriation rates, they are significantly lower than those documented for other significant health sciences innovations. This suggests that COVID-19 vaccines and treatments were remarkable, not only in their swift development but also in the considerable societal value they provided, which extended far beyond the rewards to the innovating companies.
1 Introduction
The onset of the Coronavirus disease (COVID-19) elicited an urgent response in medical innovation, marked by the development of new vaccines and therapeutics. This swift innovation enhanced welfare by reducing the mortality and morbidity associated with the disease and, in unprecedented ways, by mitigating costly prevention measures such as cuts in economic activity. This paper provides the first estimate of the share of the value generated by this rapid innovation that was appropriated as earnings by the innovating companies. This issue is important in general, and for COVID-19 innovation, given the ongoing debate about the profitability of the industry in relation to the value of the products it creates. Our primary finding is that, across a series of counterfactual scenarios spanning the previous literature on innovation effects, industry appropriation ranged from 0.04 % to 2.6 % of the value generated by the vaccine and treatment innovations.
The paper is outlined as follows: Section 2 reviews the existing literature on the proportion of value captured by innovative companies relative to the value they generate. In Section 3, we document the sales revenue of the COVID-19 innovations and explain why we use them as upper bounds on earnings, given that research and development (R&D) and manufacturing cost, though government subsidized, lower earnings below revenue levels. Section 4 explores the value of these innovations and the upper bounds on the share appropriated as earnings by the innovating companies. To estimate this appropriation, we consider the effects of the innovations on health and preventive measures, making assumptions about what might have happened without the innovation. For robustness, this paper adopts the approach of estimating industry appropriation across a wide range of counterfactual scenarios, which includes previous assessments of the subparts of the value generated by the innovations. Specifically, our scenarios included possibilities where, in the absence of innovation, excess deaths would have increased by 50 %–100 %, accompanied by hypothetical quarterly declines in real GDP growth of up to 2 %. We then totalled the benefits from the range of avoided deaths and reduced economic losses to estimate the societal value of innovations. Industry appropriation was then calculated by dividing the upper bounds of earnings by these societal values across the range of counterfactual scenarios. We find that appropriation ranged between 0.2 % and 2.6 % for vaccine producers and 0.5 %–4.6 % for treatment producers. These low levels of appropriation stem from the fact that the innovations not only reduced disease incidence but also lessened the need for costly preventive activities such as reduced economic activity. In Section 5, we discuss the limitations of our analysis. Section 6 provides a concluding discussion.
2 Literature Review of the Value of Innovation Accruing to Innovators
The share of societal value generated by medical innovation, particularly how much of this value goes to the companies that develop these innovations, has been previously studied in various contexts, including various drugs and vaccines. This section reviews the existing research on the share of societal value generated from medical innovation that goes to innovators. The main findings from these studies are summarized in Appendix A.
Initial investigations by Philipson and Jena found that for HIV/AIDS therapies introduced post-1996, innovators captured only 5 % of the total value created (Philipson and Jena 20006a, 2006b). Conversely, Kremer and Snyder found a significantly higher appropriation, 44 %, for the same disease starting from 2003, with consumers receiving 16 % of the social surplus, and the remaining 41 % attributed to the deadweight loss due to pricing above marginal cost (Kremer and Snyder 2018).
Philipson et al. studied the social value of guideline-recommended vaccines for 14 childhood diseases in the United States (Philipson et al. 2017). They estimated a lifetime social value of $184.1 billion for these vaccines, with manufacturers accruing 1.8 % ($3.4 billion) in net profits, while the rest benefited society. Focusing on the 2017 United States birth cohort, Carrico et al. estimated disease-related averted costs at $63.6 billion, while vaccination costs were $8.5 billion (Carrico et al. 2022). Herlihy et al. estimated worldwide HPV vaccine sales from 2006 to 2014 to be $14.1 billion, with manufacturers capturing $11.2 billion, or about 10 % of the social surplus (Herlihy, Hutubessy, and Jit 2016).
Kirson et al. estimated the societal economic value of COVID-19 vaccines for the United States to be $5 trillion but did not quantify the portion captured by the producers (Kirson et al. 2022). Grabowski et al. observed that for statin therapy from 1987 to 2008, consumers captured 76 % of the total social value, leaving 24 % for innovators (Grabowski et al. 2012). Lindgren and Jonsson estimated that producers appropriated 20–43 % of the social surplus during the on-patent period, which dropped to 1 % post exclusivity loss (Lindgren and Jönsson 2012). Carlsson et al. and Camejo et al. provide similar findings for simvastatin in different regions and timeframes: the producer surplus was 5 % of the total surplus (Camejo et al. 2014; Carlsson and Jönsson 2017).
Lakdawalla et al. estimated that innovations in cancer survival between 1988 and 2000 generated roughly $1.9 trillion in social value, with 5–19 % captured by healthcare providers and pharmaceutical companies (Lakdawalla et al. 2010). Garrison et al. found the manufacturer surplus to range from 24 to 71 %, depending on societal willingness-to-pay thresholds for trastuzumab in breast cancer treatment (Garrison Jr 2010; Garrison Jr and Veenstra 2009). Lakdawalla et al. estimated that 5–19 % of the social returns from cancer drugs was captured by innovators (Lakdawalla et al. 2010). Hult and Philipson found a median appropriation of 6–27 % for drugs on the supply side (Hult and Philipson 2023). Jena and Philipson[1] found a median appropriation of around 15 % (Jena and Philipson 2008). Although these studies show some variation, they collectively suggest that only a small minority of the total value of innovation is appropriated by innovators.
3 Revenues from COVID-19 Related Products
This section reviews the literature and evidence related to the revenues of companies producing COVID-19 vaccines and treatments. Due to the challenges in assessing proprietary R&D costs and the significant public subsidies for such expenses provided by Operation Warp Speed (OWS) and the Biomedical Advanced Research and Development Authority (BARDA), we concentrate on revenue as an upper bound estimate of earnings, assuming that total R&D and production costs, after accounting for subsidies, were positive. For vaccine producers, we estimate revenues based on two sources: sales data from the Kaiser Family Foundation (KFF) and financial reports submitted to the Securities and Exchange Commission (SEC) (Kates, Cox, and Michaud 2023). Our findings indicate that vaccine producers generated total revenues of $25.6 billion and $56.7 billion using the two methods, respectively. For treatment producers, we exclusively use financial SEC reports for our analysis, which show aggregate revenues of $33.3 billion.
3.1 Revenues for Vaccine Manufacturers
We consider four vaccine producers as a part of our sample: Pfizer, Moderna, Johnson & Johnson, and AstraZeneca. According to data reported by KFF, that measures federal purchases of vaccines between June 2020 and September 2022, we find that the sales price of Pfizer’s vaccine averaged $23.3, a high of $24.6 and low of $19.5, with 655 million doses sold, and its revenue implied was $14.4 billion (Kates, Cox, and Michaud 2023). Similarly, Moderna’s vaccine had an average price of $17.6 with 566 million doses sold, yielding a revenue of $8.55 billion. Johnson & Johnson’s vaccine had an average price of $10 with 100 million doses sold, with a revenue of $1 billion (Kates, Cox, and Michaud 2023). AstraZeneca had an average price of $5.3 with 300 million doses, yielding revenue of $1.6 billion (Kates, Cox, and Michaud 2023). The aggregate revenue across all four companies from federal purchases was $25.6 billion.
We complemented the KFF data with a second way to assess revenues from the quarterly financial SEC reports filed by these public companies (Kates, Cox, and Michaud 2023). We examine results from the first quarter of 2020 to the end of the second quarter of 2023. Over these 14 quarters, Pfizer’s revenue was $14.9 billion, Moderna’s revenue was $8.4 billion, Johnson & Johnson’s was revenue $0.65 billion, and AstraZeneca’s revenue was $0.45 billion (AstraZeneca 2020a, 202b, 2020c, 2020d, 2021a, 2021b, 2021c, 2021d, 2022a, 2022b, 2022c, 2022d, 2023a, 2023b, Johnson and Johnson 2022, 2023; Moderna 2021, 2022; Pfizer Inc. 2021, 2022a, 2022b, 2022c, 2022d, 2023). Thus, the aggregate revenues of Moderna and AstraZeneca obtained from company reports were substantially different from the KFF data. This variation can be attributed to KFF only measuring federal purchases, while the company reports from the SEC include both federal and commercial purchases.
3.2 Revenues for Treatment Manufacturers
For therapeutics, we use the revenue data from companies’ SEC reports and news releases (see Appendix B for more information). For time periods when data on the sales of a treatment was unavailable, we used linear interpolation to estimate revenues. We consider the impact by examining five major treatments: Veklury, Regen-Cov, Bamlanivimab and Etesevimab, Paxlovid, and Lagevrio. Pricing and doses information is summarized in Table 1 below.
Prices and doses sold across treatments (Gottlieb et al. 2022; Eli Lilly and Company 2021a, 2021b, 2021c, 2021d, 2022a, 2022b, 2022c, 2022d, 2023a, 2023b; Mishra 2021; Regeneron Pharmaceuticals Inc 2020, 2021a, 2021b, 2022a, 2022b, 2022c, 2022d, 2022e, 2022f, 2022g, 2023).a
| Company/drug name | Company revenue (in $ billions) | Price per dose (source) | Number of doses sold (in millions) |
|---|---|---|---|
| Gilead/Veklury | 7.59 | $1,560 (Gottlieb et al. 2022) | 4.86 |
| Regeneron/REGEN-COV | 6.01 | $2,100 (Regeneron Pharmaceuticals Inc 2021a, Regeneron Pharmaceuticals Inc 2021b) | 2.86 |
| Lilly/Bamlanivimab & Etesevimab | 5.01 | $3,750 (Eli Lilly and Company 2021a, Eli Lilly and Company 2021b, Eli Lilly and Company 2021c, Eli Lilly and Company 2021d) | 1.34 |
| Pfizer/Paxlovid | 12.63 | $530 (Mishra 2021) | 23.58 |
| Merck/Lagevrio | 2.16 | $700 (Mishra 2021) | 3.08 |
-
aThe COVID-19 related revenues have been sourced from each company’s quarterly financial results.
Veklury (remdesivir) generated $7.6 billion in sales revenue, at $1,560 per treatment course (Gottlieb et al. 2022; Labban 2020). We calculate that this means 4.9 million people received one course of Veklury.
Regen-Cov (casirivimab and imdevimab) produced revenues of $5.6 billion, at $2,100 per treatment dose (Regeneron Pharmaceuticals Inc 2020, 2021a, 2021b, 2022a, 2022b, 2022c, 2022d, 2022e, 2022f, 2022g, 2023). This means around 2.7 million courses were administered.
Bamlanivimab and Etesevimab, whose authorization was revoked by the FDA, had a sales revenue of $5 billion at a price of $3,750 per treatment course (Eli Lilly and Company 2021a, 2021b, 2021c, 2021d, 2022a, 2022b, 2022c, 2022d, 2023a, 2023b; GlobalData Healthcare 2023c; US Food and Drug Administration 2021). Since the company reports sales revenue for the entire category of COVID-19 antibodies, we assume this revenue is equivalent to the sales revenue for Bamlanivimab and Etesevimab. We estimate that approximately 1.3 million courses were administered.
Paxlovid, which received its authorization later during the period, had a total revenue of $12.6 billion at $530 per course (Katella 2023; Mishra 2021; US Department of Health and Human Services 2023). We estimate that 23.7 million courses of Paxlovid were administered.
Lagevrio had a total reported revenue of $2.2 billion at $700 per course (GoodRx. Lagevrio (molnupiravir) 2023; Mishra 2021; US Department of Health and Human Services 2023). Approximately 3.1 million courses of Lagevrio were administered.
3.3 Trends in Product Revenues
The average quarterly COVID-19-related revenue stood at $634 million, with a peak of $7,952 million recorded by Pfizer in Q3 2022 (Pfizer Inc., 2021a, 2022, 2022b, 2022c, 2022d, 2023). The general trend shows an initial rise followed by a fall. Most firms saw an initial jump in revenue in 2021, followed by a gradual decline after Q2 2022. Figure 1 presents the quarterly COVID-19-related revenue reported by firms between Q1 2020 and Q1 2023.
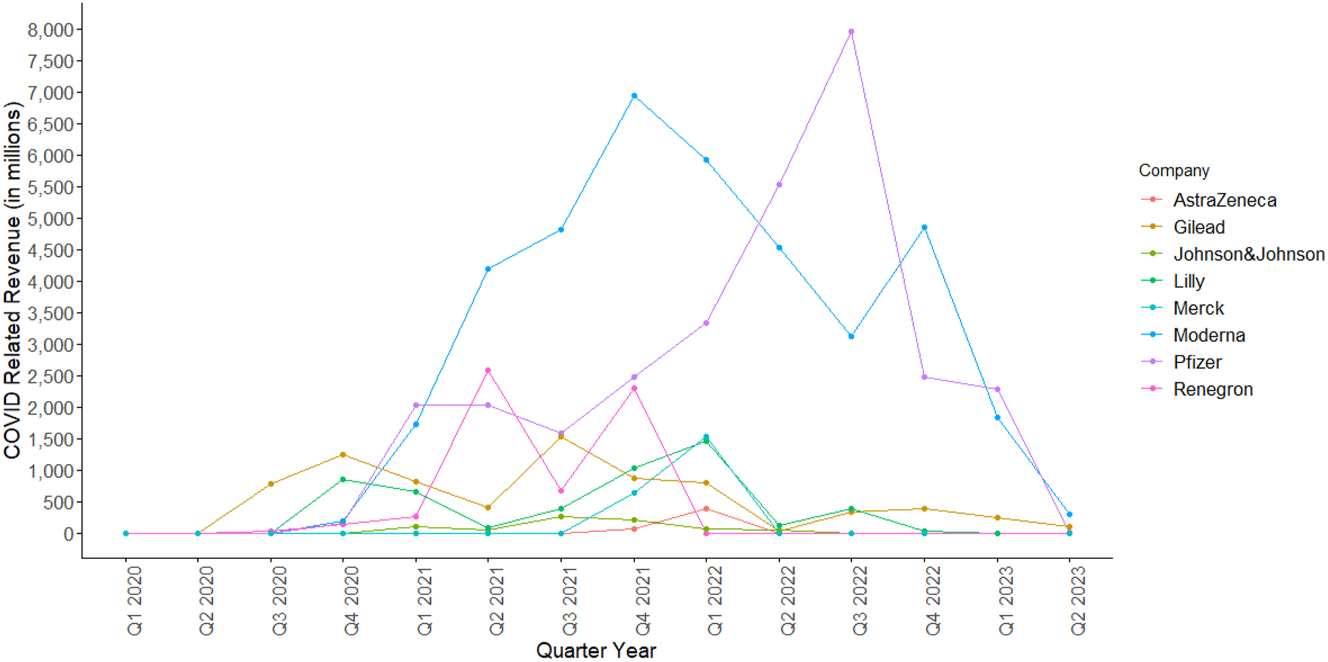
Company level COVID-Related Revenue in Millions per Quarter between Q1 2020 and Q2 2023 (AstraZeneca 2020a; 2020b, 2020d, 2020e, 2021a, 2021b, 2021c, 2021d, 2022a, 2022b, 2022c, 2022d, 2023a, 2023b; Eli Lilly and Company 2021a, 2021b, 2021c, 2021d, 2022a, 2022b, 2022c, 2022d, 2023a, 2023b; Gilead Sciences 2020, 2022a, 2022b, 2022c, 2022d, 2023a, 2023b; Johnson and Johnson 2022, 2023; Merck & Co. Inc. 2021a, 2021b, 2022a, 2022b, 2022c, 2023a, 2022d, 2023b; Moderna 2021, 2022; Pfizer Inc., 2021, 2022a, 2022b, 2022c, 2022c, 2023; Regeneron Pharmaceuticals Inc 2020, 2021a, 2021b, 2022a, 2022b, 2022c, 2022d, 2022e, 2022f, 2022g; 2023). Source: (1) AstraZeneca: Data from AstraZeneca (AstraZeneca 2020a, 2020b, 2020c, 2020d, 2021a, 2021b, 2021c, 2021d, 2022a, 2022b, 2022c, 2022d, 2023a, 2023b). (2) Gilead: Data from Gilead (Gilead Sciences 2020, 2022a, 2022b, 2022c, 2022d, 2023a, 2023b). (3) Johnson & Johnson: Data from Johnson & Johnson (2022, 2023). (4) Lilly: Data from Lilly (Eli Lilly and Company 2021a, 2021b, 2021c, 2021d, 2022a, 2022b, 2022c, 2022d, 2023a, 2023b). (5) Merck: Data from Merck (Merck & Co. Inc. 2021a, 2021b, 2022a, 2022b, 2022c, 2023a, 2022d, 2023b). (6) Moderna: Data from Moderna (2021, 2022). (7) Pfizer: Data from Pfizer (Pfizer Inc. 2021a, 2022a, 2022b, 202c, 2022d, 2023). (8) Regeneron: Data from Regeneron (Regeneron Pharmaceuticals Inc 2020, 2021a, 2021b, 2022a, 2022b, 2022c, 2022d, 2022e, 2022f, 2022g, 2023).
4 Value of COVID-19 Medical Innovation and Upper Bounds on Industry Appropriations
This section presents our estimates of the overall value of the new COVID-19 innovations across a wide range of counterfactual scenarios, considering what may have occurred in the absence of the innovations. Section 4.1 covers vaccines, while Section 4.2 focuses on therapeutic treatments, and finally Section 4.3 provides broader discussion of the macroeconomic value generated by these innovations, distinguishing it from a microeconomic perspective.
4.1 Value of COVID-19 Vaccine Innovation
Given that vaccines help reduce excess mortality and prevent cuts in economic activities, we estimate the societal value of such innovation as the sum of excess deaths averted and the avoided losses in Gross Domestic Product (GDP).
Our measures aim to capture the traditional social surplus measures of an innovation defined as consumers willing to pay above the costs of production of the goods they consume. Our method measures this surplus through two channels. The first is through the population’s willingness to pay for reduced mortality from the medical innovation using traditional willingness to pay measures of the value of a statistical life or life year. The relative size of this willingness to pay compared to sales therefore aims to capture traditional surplus measures. (Monetizing the value of QALYs gained would be another way of getting the willingness to pay but data limitations on QALYs prevents our use of this.) The second is the economic value (in terms of GDP) of the economic activity regained through the medical innovation lowering the health risks from those activities. As is always the case, GDP measures sales and not surplus, so it serves as an approximation of the social surplus generated by increased economic activity. For several demand systems and cost structures, it is proportional to social surplus.
Our baseline numbers, derived from the Centers for Disease Control and Prevention (CDC) excess death data, are labelled as ‘actual’ (Centers for Disease Control and Prevention 2023). However, due to the lack of counterfactual data in the time frame evaluated, we constructed multiple counterfactuals to assess how our results would vary and to ensure robustness in findings across scenarios.
We created two counterfactuals for value derived from avoided deaths. We estimated the economic losses of the excess deaths of COVID-19 without COVID-19 vaccines by multiplying the number of excess deaths by the Value of a Statistical Life (VSL) of $11.4 million used by the Department of Health and Human Services (HHS) (U.S. Department of Health and Human Services 2021). The first counterfactual assumes that 50 % more excess deaths would have occurred without vaccines, while the second assumes a 100 % increase. These counterfactuals are in line with excess death rate estimates from other papers.
We considered three counterfactual losses in economic activity without the vaccines, by assuming real GDP growth would decrease by 0.5 %, 1 %, and 2 % quarterly if there were no effective vaccines. These trends are depicted in Figures 2 and 3, while the corresponding values are presented in Table 2. These figures are lower than those predicted by Mulligan, who estimates a monetized welfare effect of 25.4 % negative impact on GDP for the entirety of the lockdown (Mulligan 2021). This metric includes non-market losses and measures GDP levels rather than growth, making it higher than our counterfactual losses. Besides, the absence of vaccines could also have significantly impacted the healthcare labor supply. The potential reduction in available healthcare workers due to illness or unwillingness to face occupational risks could further decrease GDP and exacerbate public health outcomes, thereby intensifying the economic and societal impacts of the pandemic. This leads us to overestimate appropriation relative to such losses absent innovation.
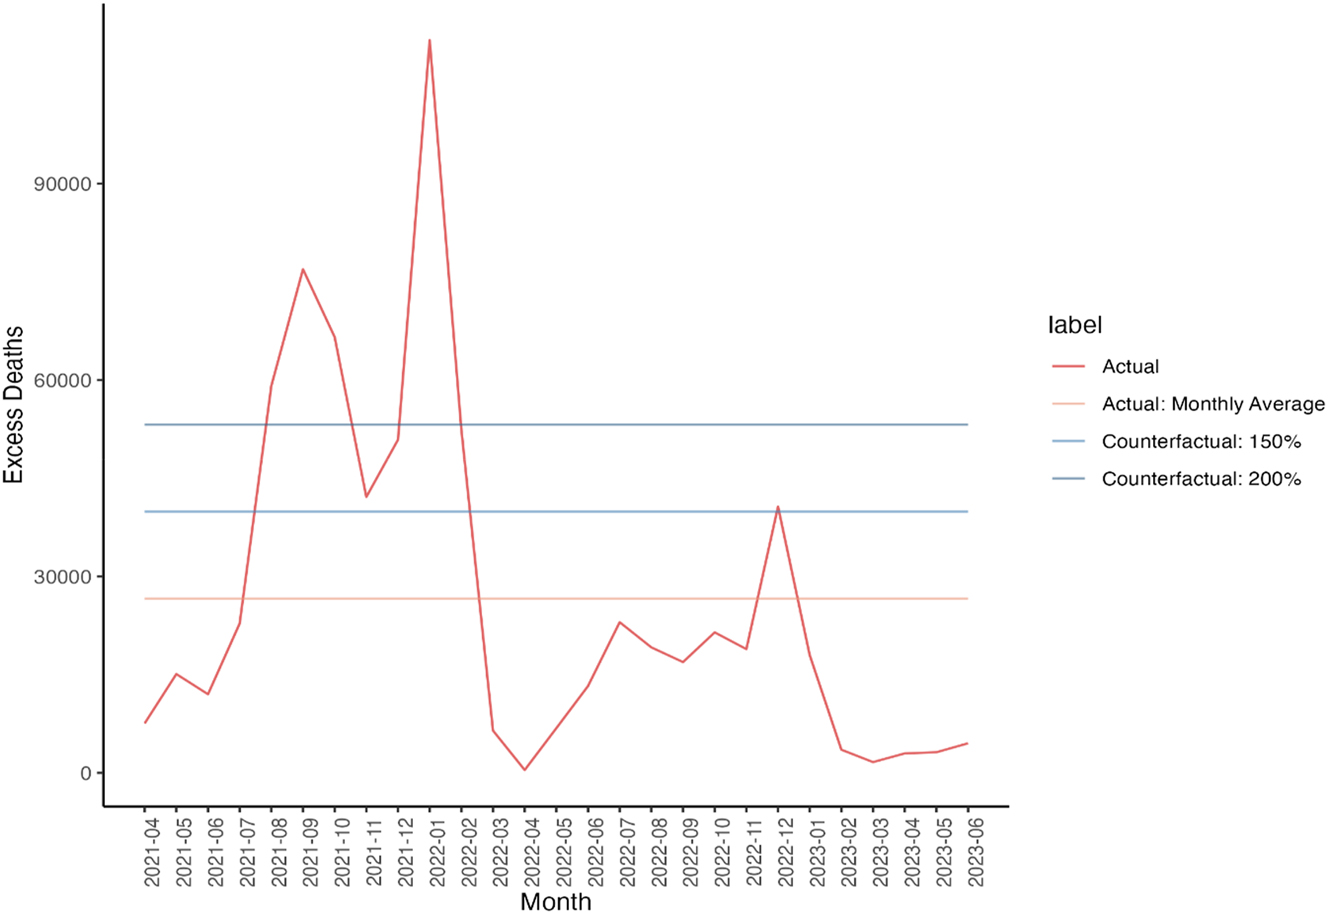
Counterfactual Excess Deaths (Centers for Disease Control and Prevention 2023). Source: (1) Centers for Disease Control and Prevention (CDC) excess death data (Centers for Disease Control and Prevention 2023).
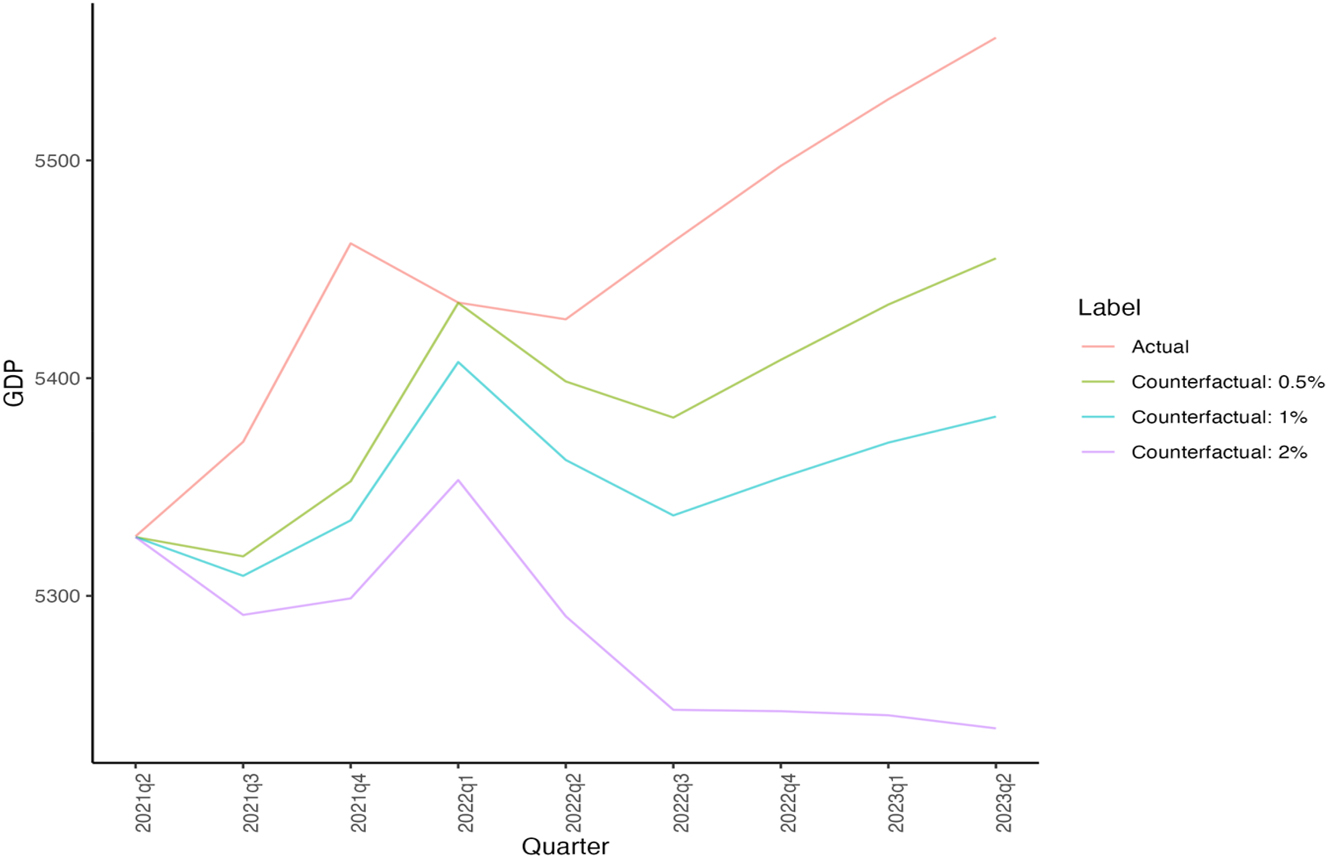
Counterfactual GDP Growth (World Bank 2023). Source: (1) GDP (World Bank 2023).
Value of vaccines and treatments under different counterfactuals (Centers for Disease Control and Prevention 2023; World Bank 2023).
| Excess death counterfactuals | Value of excess deaths ($ trillion) | GDP loss counterfactuals | Avoided economic losses ($ trillion) |
|---|---|---|---|
| 50 % | 4.09 | 0.5 % | 0.56 |
| 100 % | 8.19 | 1 % | 0.88 |
| – | – | 2 % | 1.53 |
-
Source: (1) Centers for Disease Control and Prevention (CDC) excess death data (Centers for Disease Control and Prevention 2023). (2) GDP (World Bank 2023).
Industry appropriation refers to the ratio of a company’s earnings to the overall societal value generated by its innovations. To calculate the societal value, we combined the value of both avoided deaths and averted economic losses for each counterfactual scenario in the absence of effective vaccines. Our analysis, which is summarized below in Table 3, shows that the societal value varies significantly across different counterfactual scenarios, ranging from $2.3 trillion to $12.5 trillion. We then computed the proportion of company revenues – used as an upper bound on earnings – relative to the societal values for each scenario. The estimated upper bounds on industry appropriation, as detailed in Table 4, range from 0.2 % to 2.6 %.
Industry appropriation under different counterfactuals: Sum of values (Centers for Disease Control and Prevention 2023; World Bank 2023).a,b
| Decrease in GDP/excess deaths | 50 % (in trillions) | 100 % (in trillions) |
|---|---|---|
| 0.5 % | 2.28 | 4.56 |
| 1 % | 3.61 | 7.22 |
| 2 % | 6.25 | 12.50 |
-
Source: (1) Centers for Disease Control and Prevention (CDC) excess death data (Centers for Disease Control and Prevention 2023). (2) GDP (World Bank 2023). aED50 and ED100 correspond to the counterfactuals with 50 % and 100 % excess deaths respectively. bGDP 0.5, 1, and 2 correspond to counterfactuals with 0.5 %, 1 %, and 2 % GDP growth rate reduction quarterly.
Industry appropriation under different counterfactuals (Centers for Disease Control and Prevention 2023; World Bank 2023).
| No-innovation scenario | Societal value of innovations ($ trillion) | Total appropriation across 4 vaccines (KFF) (%) | Total appropriation across 4 vaccines (quarterly reports) (%) |
|---|---|---|---|
| ED50 + GDP 0.5 | 2.28 | 1.32 | 2.63 |
| ED50 + GDP 1 | 3.61 | 0.83 | 1.66 |
| ED50 + GDP 2 | 6.25 | 0.48 | 0.96 |
| ED100 + GDP 0.5 | 4.56 | 0.66 | 1.32 |
| ED100 + GDP 1 | 7.22 | 0.42 | 0.83 |
| ED100 + GDP 2 | 12.50 | 0.24 | 0.48 |
-
Source: (1) Centers for Disease Control and Prevention (CDC) excess death data (Centers for Disease Control and Prevention 2023). (2) GDP (World Bank 2023). The COVID-19 related revenues have been sourced from each company’s quarterly financial results.
Our assumed range of counterfactuals covers specific aspects of losses discussed in previous analyses. For instance, our quarterly GDP growth rate varies between −0.5 % and −2 %, corresponding to an annual GDP growth rate that ranges from −2 % to −8 %. Hafner et al. estimated the global cost of COVID-19 in the absence of an effective vaccine to be $3.4 trillion per year, with the United States potentially losing approximately 2.2 % of its GDP annually without effective vaccines (Hafner et al. 2022). The estimated growth rates from other studies also fall within the range covered by our assumptions.
Similarly, for excess deaths, Fitzpatrick et al. found that without vaccination, there may have been approximately 3.2 million deaths, representing an excess of approximately 2.5 million deaths (77 %) in the United States (Fitzpatrick et al. 2022). Agrawal et al. found that the vaccination potentially reduced the death rate by approximately 2.4 million excess deaths globally between December 2020 and December 2021, while the United States avoided 429,486 excess deaths (Agrawal, Sood, and Whaley 2023). When Agrawal used excess deaths to estimate the pandemic’s true effect, this estimate increased eightfold to 19.8 million deaths prevented by effective vaccination, indicating that vaccination was responsible for a 63 % reduction in total deaths (Agrawal, Sood, and Whaley 2023). Other studies assessed the effect of vaccination over shorter windows. For instance, Steele et al. found that the vaccination was estimated to avoid 58 % of expected deaths in adults 18 years or older in the United States between December 2020 and September 2021 (Steele et al. 2022). In the United States, Yamana et al. indicated that vaccination prevented an additional 120,000 deaths (about 30 %) between December 2020 to May 2021, while Vilches et al. reported that vaccination prevented 240,797 excess deaths (about 59 %) between December 2020 and June 2021 (Vilches et al. 2022; Yamana et al. 2023).
Our research encompasses the range of estimated excess death rates found in other studies, with counterfactual scenarios accounting for up to 100 % excess mortality.
4.2 Value of COVID-19 Therapeutics Innovation
We also examine COVID-19 treatments from the period prior to the start of mass vaccination in April 2021 up to the latest data available from Q1 2023, focusing on their direct health impact. We estimate that all treatments combined prevented 0.3 million deaths, which have an economic value of $3.36 trillion, assuming a VSL of $11.4 million (U.S. Department of Health and Human Services 2021). Our assessment indicates that manufacturers have captured between 0.5 % and 4.6 % of the drugs’ direct health value through their innovation, which is summarized in Table 5.
Avoided deaths across treatments (Dougan et al. 2021; Gottlieb et al. 2022; Hammond et al. 2022; Jayk Bernal et al. 2022; Weinreich et al. 2021).
| Company/drug name | Number of doses (in millions) | Efficacy rate | Implied number of avoided deaths and hospitalizations (in millions) | Avoided deaths (in millions) | Economic value of avoided deaths (in $ trillions) |
|---|---|---|---|---|---|
| Gilead/Veklury | 4.86 | 4.6 % | 0.22 | 0.03 | 0.36 |
| Regeneron/REGEN-COV | 2.86 | 2.92 % | 0.08 | 0.01 | 0.14 |
| Lilly/Bamlanivimab & Etesevimab | 1.34 | 5.03 % | 0.07 | 0.01 | 0.11 |
| Pfizer/Paxlovid | 23.68 | 6.24 % | 1.48 | 0.21 | 2.41 |
| Merck/Lagevrio | 3.08 | 6.8 % | 0.21 | 0.03 | 0.34 |
-
Source: (1) Gilead/Veklury: Efficacy data from Gottlieb et al. (2022). (2) Regeneron/REGEN-COV: Efficacy data from Weinrich et al. (2021). (3) Lilly/Bamlanivimab & Etesevimab: Efficacy data from Dougan et al. (2021). (4) Pfizer/Paxlovid: Efficacy data from Hammond et al. (2022). (5) Merck/Lagevrio: Efficacy data from Jayk Bernal et al. (2022).
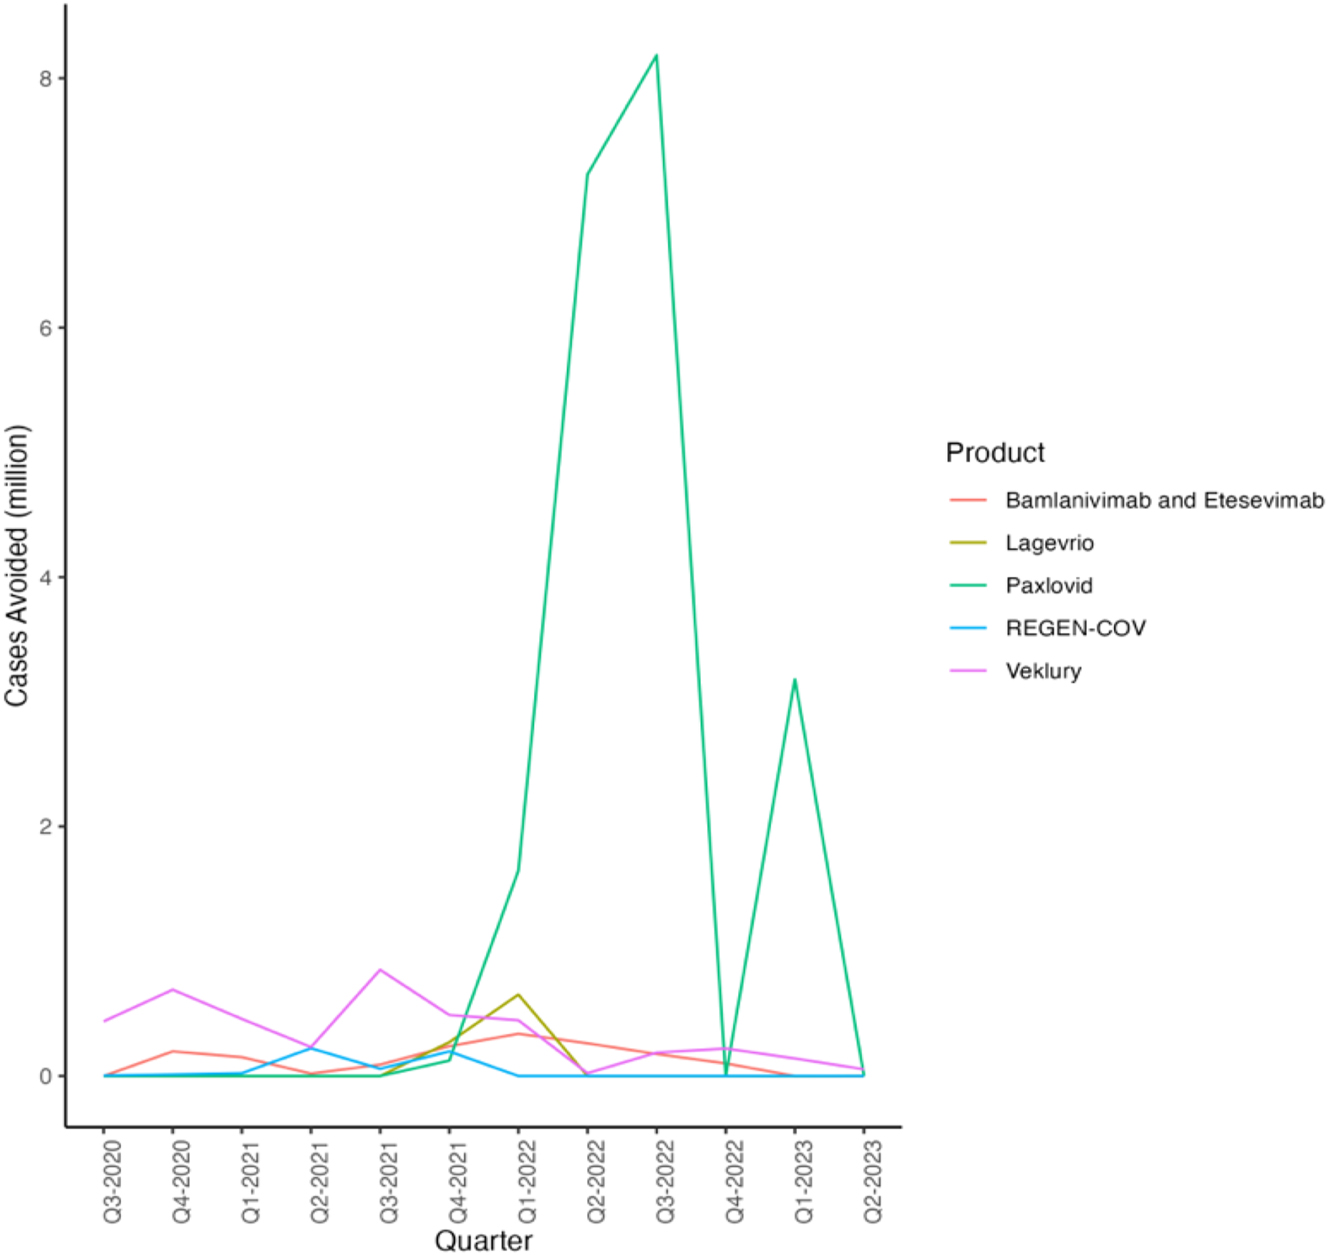
We consider the impact by examining five major treatments: Veklury, Regen-Cov, Bamlanivimab and Etesevimab, Paxlovid, and Lagevrio. To calculate their health effect, we first estimate the total volume of treatments administered and then use the reported effectiveness of each treatment multiplied by its volume to determine the aggregate health impact. The usage trends for each treatment are depicted in Figure 4. However, Lagevrio experienced negative sales in the most recent quarter according to our findings. According to the company, this decrease can be attributed to lower cases of COVID-19 in both the United Kingdom and the United States, along with changes in exchange rates. Given the controversy surrounding behavioural responses to therapeutics, we omit discussing their impact on GDP to provide a conservative estimate.
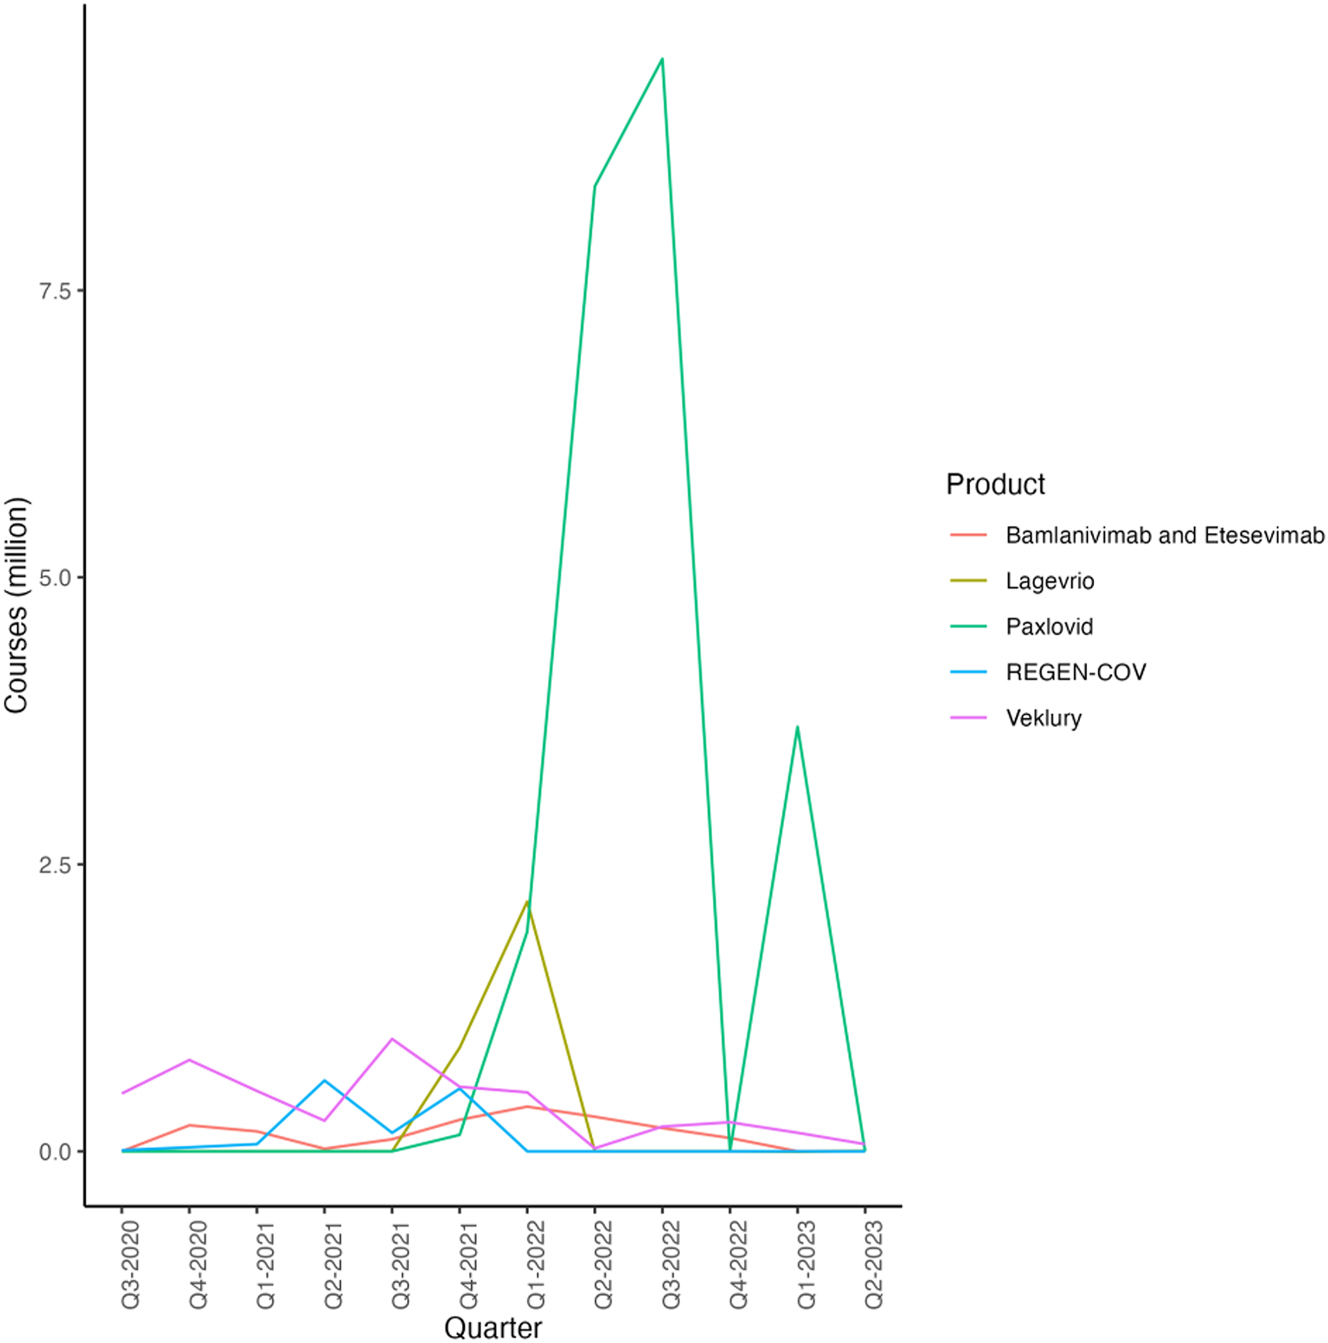
Treatment Courses Administered by Quarter and Product (Dougan et al. 2021; Eli Lilly and Company 2021a, 2021b, 2021c, 2021d, 2022a, 2022b, 2022c, 2022d, 2023a, 2023b; Gottlieb et al. 2022; Jayk Bernal et al. 2022; Merck & Co. Inc., 2021a, 2021b, 2022a, 2022b, 2022c, 2022d, 2023a, 2023b; Pfizer Inc. 2021a, 2022a, 2022b, 2022c, 2022c, 2023; Regeneron Pharmaceuticals Inc 2020, 2021a, 2021b, 2022a, 2022b, 2022c, 2022d, 2022e, 2022f, 2022g, 2023; Weinreich et al. 2021). Source: (1) Gilead/Veklury: Financial data from Gilead (Gilead Sciences 2022a, 2022b, 2022c, 2022d, 2023a, 2023b; Weinreich et al. 2021) and efficiency data from Gottlieb et al. (2022). (2) Lilly/Bamlanivimab & Etesevimab: Financial data from Lilly (Eli Lilly and Company 2021a, 2021b, 2021c, 2021d, 2022a, 2022b, 2022c, 2022d, 2023a, 2023b) and efficiency data from Dougan et al. (2021) and efficiency data from Jayk Bernal et al. (2022). (3) Merck/Legevrio: Financial data from Merck (Merck & Co. Inc., 2021a, 2021b, 2022a, 2022b, 2022c, 2023a, 2022d, 2023b) and efficiency data from Jayk Bernal et al. (2022). (4) Pfizer/Paxlovid: Financial data from Pfizer (Pfizer Inc., 2021, 2022a, 2022b, 2022c, 2022d, 2023) and efficiency data from Hammond et al. (Merck & Co. Inc., 2021a). (5) Regeneron/REGEN-COV: Financial data from Regeneron (Regeneron Pharmaceuticals Inc 2020, 2021a, 2021b, 2022a, 2022b, 2022c, 2022d, 2022e, 2022f, 2022g, 2023) and efficiency data from Weinreich et al. (2021).
Next, using the average probability of 30-day death from hospitalization across all age groups as reported by Jovanoski et al., we arrive at a 30-day probability of death following hospitalization due to COVID-19 at 14.3 % (Jovanoski et al. 2022). We apply this probability to all cases except those treated with Regen-Cov to estimate the number of deaths avoided by all therapeutic treatments. This produces a conservative estimate, as the average probability may underestimate the likelihood of death for different age groups, such as senior patients, and assumes that all other treatments merely avoided hospitalizations. Lastly, we value these lives assuming a VSL of $11.4 million (U.S. Department of Health and Human Services 2021).
To illustrate our method using hypothetical figures, consider a treatment that generates $1 million in sales revenue, priced at $100 per course. Therefore, we estimate 10,000 courses were administered to 10,000 patients. Assume the treatment had an absolute risk of hospitalization and deaths of 20 % for the placebo group. This would imply an absolute reduction in the risk of hospitalization and deaths by 10 %, resulting in 1,000 prevented hospitalizations and deaths. Among these, applying the 14.3 % probability of death following hospitalization, as determined by Jovanoski et al., we can infer that approximately 143 deaths were prevented (Jovanoski et al. 2022). It is critical to note, however, that our estimates may not fully capture the actual health impact due to unreported rebates and subsidies which are included in the sales revenue but not reported in the list price of the treatment. These factors could introduce a downward bias in our estimated health effects. Consequently, the economic value of the 143 avoided deaths, calculated using a VSL of $11.4 million, amounts to $1.63 billion. This example demonstrates our approach to quantifying the direct health benefits and economic value of COVID-19 treatments, highlighting the potential for significant societal impact (U.S. Department of Health and Human Services 2021).
We estimate that approximately 4.9 million people received one course of Veklury, produced by Gilead Sciences, by dividing the total revenue by the price per course of treatment (Gilead Sciences 2020, 2022a, 2022b, 2022c, 2022d, 2023a, 2023b). Each treatment course is associated with a 4.6 %[2] absolute reduction in the risk of hospitalization and death (Gottlieb et al. 2022). Thus, multiplying by the health effect, we estimate around 0.22 million hospitalizations and deaths to be avoided by Veklury. Veklury helped avoid 0.03 million deaths which are valued at $0.36 trillion.
Regeneron’s Regen-Cov reduces the absolute risk of hospitalization or death by 3.3 % (Weinreich et al. 2021).[3] Consequently, around 2.9 million courses were administered, leading to an estimated 0.096 million hospitalizations or deaths avoided by Regen-Cov. This results in 0.01 million avoided deaths, valued at $0.14 trillion.
One treatment course of Lilly’s Bamlanivimab and Etesevimab reduces a patient’s risk of hospitalization and death by 4.8 % (Dougan et al. 2021).[4] Based on this efficacy, we estimate that out of the approximately 1.3 million courses administered, roughly 0.07 million hospitalizations and deaths were avoided. This results in 0.01 million avoided deaths, valued at $0.11 trillion.
According to reports, Pfizer’s Paxlovid is reported to reduce a patient’s risk of hospitalization or death by 6.3 % (Hammond et al. 2022).[5] Based on this efficacy, we estimate that out of the approximately 23.7 million courses administered, around 1.5 million cases of hospitalization and fatalities were avoided. This results in 0.21 million avoided deaths, valued at $2.41 trillion.
Merck’s Lagevrio, which is reported to reduce a patient’s risk of hospitalization or death by 6.8 %,[6] was administered in approximately 3.1 million courses, resulting in about 0.21 million avoided hospitalizations or deaths (Jayk Bernal et al. 2022; Merck & Co. Inc., 2021a, 2021b, 2022a, 2022b, 2022c, 2022d, 2023a, 2023b). This means 0.03 million deaths were avoided valued at $0.34 trillion.
Summing up the avoided deaths from the therapeutics discussed above, we conclude that approximately 0.3 million deaths were prevented, collectively valued at $3.4 trillion, assuming a VSL of $11.4 million (U.S. Department of Health and Human Services 2021).
By March 2023, there have been 676.6 million COVID-19 cases reported in the United States according to Johns Hopkins University (JHU) (Johns Hopkins University 2023). Given that the population of the United States is approximately 332 million, this indicates an average of more than 2 infections per person. The overall trend of avoided hospitalization or deaths from all treatments can be seen in Figure 5, which resembles the figures in Figure 4, as the estimated avoided hospitalizations and deaths are proportional in number to the courses administered.
Hospitalization or Deaths Avoided by Quarter and Product (Dougan et al. 2021; Gottlieb et al. 2022; Hammond et al. 2022; Jayk Bernal et al. 2022; Weinreich et al. 2021). Source: (1) Gilead/Veklury: Efficiency data from Gottlieb et al. (2022). (2) Lilly/Bamlanivimab & Etesevimab: Efficiency data from Dougan et al. (2021). (3) Merck/Legevrio: Efficiency data from Jayk Bernal et al. (2022). (4) Pfizer/Paxlovid: Efficiency data from Hammond et al. (2022). (5) Regeneron/REGEN-COV: Efficiency data from Weinreich et al. (2021).
In Table 6, the revenues for companies manufacturing treatments are considered alongside the value generated by each company. The data shows that the appropriation of these revenues by treatment manufacturers ranges from 0.5 % to 4.6 %. Since we do not consider costs incurred by manufacturers, this is an upper bound on the share appropriated by treatment manufacturers. This proportion appears to be higher than the estimated industry appropriation for vaccine producers, which ranges from 0.2 % to 2.6 % across various counterfactual scenarios.
Appropriation across therapeutics (Dougan et al. 2021; Gottlieb et al. 2022; Hammond et al. 2022; Jayk Bernal et al. 2022; Weinreich et al. 2021).
| Company/drug name | Covid-19 therapeutic revenue ($ billion) | Estimated value from avoided deaths ($ trillion) | Appropriation (%) |
|---|---|---|---|
| Gilead/Veklury | 7.59 | 0.36 | 2.11 |
| Regeneron/REGEN-COV | 6.01 | 0.14 | 4.30 |
| Lilly/Bamlanivimab & Etesevimab | 5.01 | 0.11 | 4.57 |
| Pfizer/Paxlovid | 12.55 | 2.41 | 0.52 |
| Merck/Lagevrio | 2.16 | 0.34 | 0.63 |
-
Source: (1) Gilead/Veklury: Efficacy data from Gottlieb et al. (2022). (2) Regeneron/REGEN-COV: Efficacy data from Weinrich et al. (2021). (3) Lilly/Bamlanivimab & Etesevimab: Efficacy data from Dougan et al. (2021). (4) Pfizer/Paxlovid: Efficacy data from Hammond et al. (2022). (5) Merck/Lagevrio: Efficacy data from Jayk Bernal et al. (2022).
4.3 Broader Macroeconomic Impacts of COVID-19 Innovations
While the preceding analysis focuses on direct health and GDP impacts, the true societal value of COVID-19 innovations also extends into a macroeconomic perspective, such as:
Economic Stabilization: Innovations allowed economies to reopen safely, preserving jobs, reducing business closures, and maintaining global supply chains.
Workforce Productivity: By preventing severe illness and death, innovations minimized workforce absenteeism and ensured the continuity of critical sectors.
Educational Opportunity: Vaccines and treatments reduced the need for school closures, mitigating the long-term impacts of educational disruption on human capital.
The macro view emphasizes the widespread and structural impacts of innovations, such as stabilizing economies and maintaining societal functionality during crises. In contrast, the micro view focuses on individual or disease-specific outcomes, such as the economic value of improvements in cancer survival or cardiovascular disease, potentially underestimating the broader societal value.
5 Limitations
In this paper, we focus exclusively on the health-GDP impacts of the pandemic. Consequently, we do not address other important aspects that may affect our overall findings. Generally, these limitations seem to imply lower levels of appropriations than reported. For instance, Yamana et al. found that the reduction in hospitalizations enabled by vaccines and treatments was associated with substantial healthcare cost savings (Yamana et al. 2023). However, our analysis does not account for the effects of reduced hospitalization on worker productivity and educational outcomes, such as fewer absentee days.
Additionally, we do not quantify the impact of educational disruptions or the adverse effects on mental health and well-being resulting from the pandemic. The transition to remote learning led to significant educational losses and a decline in educational quality. Research has documented a deterioration in mental health, with increased rates of depression, anxiety, and social difficulties, particularly among students and young people. These nonmarket aspects are critical for understanding the full scope of the pandemic’s impact on society, as they are not captured in traditional GDP measurements.
The reduction of preventive measures, such as the shutdown of nonessential businesses, also affects the nonmarket sector, including activities like education and skill development. With schools closed, over 70 million children and young adults were unable to engage in normal learning activities, and many others missed out on skill accumulation during their early career stages. This reduction in market inputs lowers the productivity of the nonmarket sector, resulting in welfare costs estimated by Mulligan of about $7 trillion per year of shutdown. This literature may again suggest that our appropriation estimates are upper bounds (Mulligan 2021).
Our study’s estimates are also constrained by certain methodological limitations. Given that production costs associated with a particular drug were proprietary, our estimates based on product revenues are an upper bound. Additionally, most studies measure reduced risk of deaths and hospitalizations, but not deaths alone. Therefore, we extrapolate and estimate the avoided deaths. Our counterfactuals are wide in range but arbitrarily chosen but in a way such that they cover a variety of scenarios considered in past analyses. Lastly, reported revenues earned by the company are usually through negotiated prices, which are typically lower than list prices. Thus, our estimates may underestimate the number of doses sold and consequently the economic value of avoided deaths, leading us to overestimate appropriation.
Furthermore, COVID-19 vaccines accelerated the use of mRNA technology more broadly, which is now being advanced in cancer treatment, gene therapies for other diseases, and other areas. The follow-on social value from these innovations was not considered in our analysis. Additionally, this new mRNA technology not only may create significant insurance value, referring to the future benefits from being able to rapidly develop, manufacture, and deploy vaccines in response to future pandemics, but also demonstrates the strategic value of public-private partnerships. This collaboration model has proven its efficacy in accelerating drug development and approval while ensuring safety and effectiveness. The successful deployment of mRNA vaccines has established a precedent that, if replicated in future health crises, could expedite similar processes and support economic stability. Therefore, these aspects of the mRNA technology suggest that the levels of appropriation – the returns that innovators capture from their investments – may be underestimated, as the true value extends beyond immediate financial gains to include long-term contributions to global health security and strategic partnership frameworks.
6 Concluding Discussion
The swift development and deployment of vaccines and therapeutics during the COVID-19 pandemic have underscored the essential clinical and economic role of medical innovation in addressing critical health crises. These advancements not only enhanced patient outcomes by reducing mortality and morbidity associated with the disease but also lessened the dependence on costly preventive strategies, such as cuts in economic activity.
Building on insights from the comprehensive research on parts of the pandemic’s extensive impacts, our study offers a thorough analysis of industry appropriation – the portion of the societal value from innovation that accrues as earnings to innovators (UNESCO 2021; United Nations World Tourism Organization (UNWTO), 2022; World Bank 2023). We considered a wide range of counterfactual scenarios in the absence of innovation, including increased mortality rates and economic downturns. We also attempt to capture the elusive nature of earnings by correlating them with the more tangible metric of revenue. Under these robust and conservative assumptions, industry appropriation of the value generated by the innovations varied between 0.2 % and 2.6 % for vaccine producers and 0.04 %–0.40 % for treatment producers. These appropriation percentages are considerably lower than those in the existing evidence base for other medical innovations, as detailed in our study.
In conclusion, our findings indicate that the industry appropriation for COVID-19 medical innovations is modest compared to previous estimates for innovations in vaccines and medical treatments of other disease categories, indicating the significant value generated by these rapidly developed new COVID-19 innovations.
Funding source: Regeneron Inc
Acknowledgments
We would like to express our sincere gratitude to all those who provided invaluable support and assistance during the completion of this project. Our deepest thanks go to Kira Fujibayashi, Heather E. Johnson, and Yier Ling for their contributions and thoughtful reviews. Research assistance from Heather Johnson is greatly appreciated.
Appendix A: List of Company Reports and News Releases
Appendix B: Literature on Pharmaceutical Innovation
| Author | Category | Country | Results |
|---|---|---|---|
| Philipson et al. (2017) | Childhood Vaccination | U.S. |
|
| Carrico et al. (2022) | Childhood Vaccination | U.S. |
|
| Herlihy et al. (2016) | Papillomavirus Vaccine | Global |
|
| Kirson et al. (2022) | COVID-19 Vaccine | U.S. |
|
| Grabowski et al. (2012) | Statin Therapy | U.S. |
|
| Lindgren and Jönsson (2012) | Statin Therapy | Sweden |
|
| Camejo et al. (2014) | Statin Therapy | England and Wales |
|
| Carlsson and Jönsson (2017) | Statin Therapy | Europe |
|
| Berdud et al. (2023) | Statin Therapy | U.K. and Sweden |
|
| Hult and Philipson (2023) | General | Global |
|
| Philipson and Jena (2006) | HIV | U.S. |
|
| Kremer and Snyder (2018) | HIV | Global |
|
| Garrison et al. (2010) | Cancer | U.S. |
|
| Lakdawalla et al. (2010) | Cancer | U.S. |
|
| Jena and Philipson (2008) | Medical Technologies | Global |
|
| Mulligan (2021) | General | U.S. |
|
References
Agrawal, V., N. Sood, and C. M. Whaley. 2023. The Impact of the Mis COVID-19 Vaccination Campaign on All-Cause Mortality. National Bureau of Economic Research. No. w31812.10.3386/w31812Search in Google Scholar
AstraZeneca. 2020. Full-Year 2020 Results Announcement. Available at: https://www.astrazeneca.com/content/dam/az/PDF/2020/full-year/Full-year_2020_results_announcement.pdf (accessed August 8, 2024).Search in Google Scholar
AstraZeneca. 2020. Year-to-date and Q3 2020 Results Announcement. Available at: https://www.astrazeneca.com/content/dam/az/PDF/2020/q3/Year-to-date_and_Q3_2020_results_announcement.pdf (accessed August 8, 2024).Search in Google Scholar
AstraZeneca. 2020. H1 2020 Results Announcement. Available at: https://www.astrazeneca.com/content/dam/az/PDF/2020/h1-2020/H1_2020_results_announcement.pdf. (accessed August 8, 2024).Search in Google Scholar
AstraZeneca. 2020. Q1 2020 Results Announcement. Available at: https://www.astrazeneca.com/content/dam/az/PDF/2020/q1-2020/Q1_2020_results_announcement.pdf (accessed August 8, 2024).Search in Google Scholar
AstraZeneca. 2021. Full-year 2021 Results Announcement. Available at: https://www.astrazeneca.com/content/dam/az/PDF/2021/full-year/Full-year-2021-results-announcement.pdf. (accessed August 8, 2024).Search in Google Scholar
AstraZeneca. 2021. Year-to-date and Q3 2021 Results Announcement. Available at: https://www.astrazeneca.com/content/dam/az/PDF/2021/q3/Year-to-date_and_Q3_2021_results_announcement.pdf (accessed August 8, 2024).Search in Google Scholar
AstraZeneca. 2021. H1 2021 Results Announcement. Available at: https://www.astrazeneca.com/content/dam/az/PDF/2021/h1-2021/H1_2021_results_announcement.pdf (accessed August 8, 2024).Search in Google Scholar
AstraZeneca. 2021. Q1 2021 Results Announcement. Available at: https://www.astrazeneca.com/content/dam/az/PDF/2021/q1-2021/Q1_2021_results_announcement.pdf (accessed August 8, 2024).Search in Google Scholar
AstraZeneca. 2022. Full-year and Q4 2022 Results Announcement. Available at: https://www.astrazeneca.com/content/dam/az/PDF/2022/fy/Full-year-and-Q4-2022-results-announcement.pdf (accessed August 8, 2024).Search in Google Scholar
AstraZeneca. 2022. Year-to-date and Q3 2022 Results Announcement. Available at: https://www.astrazeneca.com/content/dam/az/PDF/2022/Q3/Year-to-date_and_Q3_2022_results_announcement.pdf (accessed August 8, 2024).Search in Google Scholar
AstraZeneca. 2022. H1 2022 Results Announcement. Available at: https://www.astrazeneca.com/content/dam/az/PDF/2022/h1-2022/H1-2022-results-announcement.pdf (accessed August 8, 2024).Search in Google Scholar
AstraZeneca. 2022. Q1 2022 Results Announcement. Available at: https://www.astrazeneca.com/content/dam/az/PDF/2022/q1-2022/Q1-2022-results-announcement.pdf (accessed August 8, 2024).Search in Google Scholar
AstraZeneca. 2023. H1 and Q2 2023 Results Announcement. Available at: https://www.astrazeneca.com/content/dam/az/PDF/2023/h1/H1-and-Q2-2023-results-announcement.pdf (accessed August 8, 2024).Search in Google Scholar
AstraZeneca. 2023. Q1 2023 Results Announcement. Available at: https://www.astrazeneca.com/content/dam/az/PDF/2023/q1/Q1-2023-results-announcement.pdf (accessed August 8, 2024).Search in Google Scholar
Berdud, M., N. Wallin-Bernhardsson, B. Zamora, P. Lindgren, and A. Towse. 2023. “The Allocation of the Economic Value of Second-Generation Antipsychotics over the Product Life Cycle: The Case of Risperidone in Sweden and the United Kingdom.” Value in Health 26 (3): 328–35. https://doi.org/10.1016/j.jval.2022.11.022.Search in Google Scholar
Camejo, R. R., C. McGrath, M. Miraldo, and F. Rutten. 2014. “Distribution of Health-Related Social Surplus in Pharmaceuticals: An Estimation of Consumer and Producer Surplus in the Management of High Blood Lipids and COPD.” The European Journal of Health Economics 15: 439–45. https://doi.org/10.1007/s10198-013-0484-1.Search in Google Scholar
Carlsson, K. S., and B. Jönsson. 2017. “Valuing New Medicines in the Early 21st Century.” Nord J Health Econ 5 (1): 7–22. https://doi.org/10.5617/njhe.5538.Search in Google Scholar
Carrico, J., E. M. La, S. E. Talbird, Y. T. Chen, M. K. Nyaku, C. Carias, C. E. Mellott, G. S. Marshall, and C. S. Roberts. 2022. “Value of the Immunization Program for Children in the 2017 U.S. Birth Cohort.” Pediatrics 150 (3). https://doi.org/10.1542/peds.2021-056007.Search in Google Scholar
Centers for Disease Control and Prevention. 2023. Excess Deaths Associated with COVID-19. https://data.cdc.gov/NCHS/Excess-Deaths-Associated-with-COVID-19/xkkf-xrst.Search in Google Scholar
Dougan, M., A. Nirula, M. Azizad, B. Mocherla, R. L. Gottlieb, P. Chen, C. Hebert et al.. 2021. “Bamlanivimab Plus Etesevimab in Mild or Moderate Covid-19.” New England Journal of Medicine 385 (15): 1382–92. https://doi.org/10.1056/NEJMoa2102685.Search in Google Scholar
Eli Lilly and Company. 2021a. Eli Lilly Reports Financial Results. Published online: https://investor.lilly.com/static-files/3f6bab4d-8180-453a-9789-27cf0928ceac.Search in Google Scholar
Eli Lilly and Company. 2021b.Eli Lilly Reports Financial Results. Published online: https://investor.lilly.com/static-files/85c7b553-6cf3-4251-9063-4bac96721daf.Search in Google Scholar
Eli Lilly and Company. 2021c. Eli Lilly Reports Financial Results. Published online: https://investor.lilly.com/static-files/e53693be-0326-42c0-b785-35c3cb17a549.Search in Google Scholar
Eli Lilly and Company. 2021d. Eli Lilly Reports Financial Results. Published online: https://investor.lilly.com/static-files/a0b77c52-a997-41c1-9534-5f465903a0b4.Search in Google Scholar
Eli Lilly and Company. 2022a. Eli Lilly Reports Financial Results. Published online: https://investor.lilly.com/static-files/4e7b7f6a-de44-49b0-8726-18a416bed95a.Search in Google Scholar
Eli Lilly and Company. 2022b. Eli Lilly Reports Financial Results. Published online: https://investor.lilly.com/static-files/3360aaee-1ae1-4c5b-b0b4-cb62cacb4ef7.Search in Google Scholar
Eli Lilly and Company. 2022c. Eli Lilly Reports Financial Results. Published online: https://investor.lilly.com/static-files/64069270-d844-42bb-aaf6-6e46b5406cfd.Search in Google Scholar
Eli Lilly and Company. 2022d. Eli Lilly Reports Financial Results. Published online: https://investor.lilly.com/static-files/66411962-437c-488d-9d6d-ec777de09940.Search in Google Scholar
Eli Lilly and Company. 2023a. Eli Lilly Reports Financial Results. Published online: https://investor.lilly.com/static-files/778eddb6-e688-420f-98cf-fade89e63aed.Search in Google Scholar
Eli Lilly and Company. 2023b. Eli Lilly Reports Financial Results. Published online: https://investor.lilly.com/static-files/1df8cab7-5fa8-4eb4-b72d-a93efb1dac56.Search in Google Scholar
Garrison Jr, L. P., and D. L. Veenstra. 2009. “The Economic Value of Innovative Treatments over the Product Life Cycle: The Case of Targeted Trastuzumab Therapy for Breast Cancer.” Value in Health 12 (8): 1118–23. https://doi.org/10.1111/j.1524-4733.2009.00572.x.Search in Google Scholar
Fitzpatrick, M. C., S. M. Moghadas, A. Pandey, and A. P. Galvani. 2022. Two Years of U.S. COVID-19 Vaccines Have Prevented Millions of Hospitalizations and Deaths. The Commonwealth Fund. https://www.commonwealthfund.org/blog/2022/two-years-covid-vaccines-prevented-millions-deaths-hospitalizations.Search in Google Scholar
Garrison Jr, L. P. 2010. “Rewarding Value Creation to Promote Innovation in Oncology: The Importance of Considering the Global Product Life Cycle.” The Oncologist 15 (Suppl 1): 49–57. https://doi.org/10.1634/theoncologist.2010-S1-49.Search in Google Scholar
Gilead Sciences. 2020. Gilead Sciences Announces Third Quarter 2020 Financial Results. Published October 28, 2020: https://www.gilead.com/news-and-press/press-room/press-releases/2020/10/gilead-sciences-announces-third-quarter-2020-financial-results.Search in Google Scholar
Gilead Sciences. 2022a. Gilead Sciences Announces Fourth Quarter and Full Year 2021 Financial Results. Published February 1, 2022: https://www.gilead.com/news-and-press/press-room/press-releases/2022/2/gilead-sciences-announces-fourth-quarter-and-full-year-2021-financial-results.10.1016/j.fopow.2021.03.008Search in Google Scholar
Gilead Sciences. 2022b. Gilead Sciences Announces First Quarter 2022 Financial Results. Published April 28, 2022: https://www.gilead.com/news-and-press/press-room/press-releases/2022/4/gilead-sciences-announces-first-quarter-2022-financial-results.Search in Google Scholar
Gilead Sciences. 2022c. Gilead Sciences Announces Second Quarter 2022 Financial Results. Published August 2, 2022: https://www.gilead.com/news-and-press/press-room/press-releases/2022/8/gilead-sciences-announces-second-quarter-2022-financial-results.Search in Google Scholar
Gilead Sciences. 2022d. Gilead Sciences Announces Third Quarter 2022 Financial Results. Published October 27, 2022: https://www.gilead.com/news-and-press/press-room/press-releases/2022/10/gilead-sciences-announces-third-quarter-2022-financial-results.Search in Google Scholar
Gilead Sciences. 2023a. Gilead Sciences Announces Fourth Quarter and Full Year 2022 Financial Results. Published February 2, 2023: https://www.gilead.com/news-and-press/press-room/press-releases/2023/2/gilead-sciences-announces-fourth-quarter-and-full-year-2022-financial-results.Search in Google Scholar
Gilead Sciences. 2023b. Gilead Sciences Announces First Quarter 2023 Financial Results. Published April 27, 2023: https://www.gilead.com/news-and-press/press-room/press-releases/2023/4/gilead-sciences-announces-first-quarter-2023-financial-results.Search in Google Scholar
GlobalData Healthcare. 2023c. Vast Majority of Healthcare Professionals Believed that COVID-19 Had Greatest Impact on Digital Transformation, Reveals GlobalData Survey. Published online November 13, 2023: https://www.globaldata.com/media/pharma/vast-majority-healthcare-professionals-believed-covid-19-greatest-impact-digital-transformation-reveals-globaldata-survey/.Search in Google Scholar
GoodRx. 2023. Lagevrio (molnupiravir). GoodRx. https://www.goodrx.com/lagevrio/what-is.Search in Google Scholar
Gottlieb, R. L., C. E. Vaca, R. Paredes, J. Mera, B. J. Webb, G. Perez, G. Oguchi et al.. 2022. “Early Remdesivir to Prevent Progression to Severe Covid-19 in Outpatients.” New England Journal of Medicine 386 (4): 305–15. https://doi.org/10.1056/NEJMoa2116846.Search in Google Scholar
Grabowski, D. C., D. N. Lakdawalla, D. P. Goldman, M. Eber, L. Z. Liu, T. Abdelgawad, A. Kuznik, M. E. Chernew, and T. Philipson. 2012. “The Large Social Value Resulting from the Use of Statins Warrants Steps to Improve Adherence and Broaden Treatment.” Health Affairs 31 (10): 2276–85. https://doi.org/10.1377/hlthaff.2011.1120.Search in Google Scholar
Hafner, M., E. Yerushalmi, C. Fays, E. Dufresne, and C. Van Stolk. 2022. “COVID-19 and the Cost of Vaccine Nationalism.” Rand Health Q 9 (4): 15.Search in Google Scholar
Hammond, J., H. Leister-Tebbe, A. Gardner, P. Abreu, W. Bao, W. Wisemandle, M. Baniecki et al.. 2022. “Oral Nirmatrelvir for High-Risk, Non-Hospitalized Adults with Covid-19.” New England Journal of Medicine 386 (15): 1397–408. https://doi.org/10.1056/NEJMoa2118542.Search in Google Scholar
Herlihy, N., R. Hutubessy, and M. Jit. 2016. “Current Global Pricing for Human Papillomavirus Vaccines Brings the Greatest Economic Benefits to Rich Countries.” Health Affairs 35 (2): 227–34. https://doi.org/10.1377/hlthaff.2015.1411.Search in Google Scholar
Hult, K. J., and T. J. Philipson. 2023. “The Value of Medical Innovation versus Industry Rewards.” Value in Health 26 (3): 320–7. https://doi.org/10.1016/j.jval.2022.12.001.Search in Google Scholar
Jayk Bernal, A., M. M. Gomes da Silva, D. B. Musungaie, E. Kovalchuk, A. Gonzalez, V. Delos Reyes, A. Martín-Quirós et al.. 2022. “Molnupiravir for Oral Treatment of Covid-19 in Non-hospitalized Patients.” New England Journal of Medicine 386 (6): 509–20. https://doi.org/10.1056/NEJMoa2116044.Search in Google Scholar
Jena, A. B., and T. J. Philipson. 2008. “Cost-effectiveness Analysis and Innovation.” Journal of Health Economics 27 (5): 1224–36. https://doi.org/10.1016/j.jhealeco.2008.05.010.Search in Google Scholar
Johns Hopkins University. 2023. Covid-19 Dashboard. Johns Hopkins University. https://coronavirus.jhu.edu/map.html.Search in Google Scholar
Johnson & Johnson. 2022. Johnson & Johnson Reports Q4 and Full-Year 2022 Results. Johnson & Johnson. https://johnsonandjohnson.gcs-web.com/static-files/ca8c3ac2-15ab-4f8d-9693-f604d50be358 (accessed July 25, 2024).Search in Google Scholar
Johnson & Johnson. 2023. Johnson & Johnson Reports Q1 2023 Results. Johnson & Johnson. https://johnsonandjohnson.gcs-web.com/static-files/193ef6f3-7acf-4ab2-979e-44cdb7120d41.Search in Google Scholar
Jovanoski, N., A. Kuznik, U. Becker, M. Hussein, and A. Briggs. 2022. “Cost-effectiveness of Casirivimab/imdevimab in Patients with COVID-19 in the Ambulatory Setting.” J Manag Care Spec Pharm 28 (5): 555–65. https://doi.org/10.18553/jmcp.2022.28.5.555.Search in Google Scholar
Katella, K. 2023. “13 Things to Know about Paxlovid.” In The Latest COVID-19 Pill. Yale Medicine. https://www.yalemedicine.org/news/13-things-to-know-paxlovid-covid-19#:∼:text=How%20often%20do%20I%20take,out%20the%20pills%20as%20needed.Search in Google Scholar
Kates, J., C. Cox, and J. Michaud. 2023. How Much Could COVID-19 Vaccines Cost the U.S. After Commercialization? Kaiser Family Foundation. https://www.kff.org/coronavirus-covid-19/issue-brief/how-much-could-covid-19-vaccines-cost-the-u-s-after-commercialization/.Search in Google Scholar
Kirson, N., E. Swallow, J. Lu, M. Mesa-Frias, B. Bookhart, J. Maynard, Y. Shivdasani, and P. Lefebvre. 2022. “The Societal Economic Value of COVID-19 Vaccines in the United States.” Journal of Medical Economics 25 (1): 119–28. https://doi.org/10.1080/13696998.2022.2026118.Search in Google Scholar
Kremer, M., and C. M. Snyder. 2018. “Preventives versus Treatments Redux: Tighter Bounds on Distortions in Innovation Incentives with an Application to the Global Demand for HIV Pharmaceuticals.” Review of Industrial Organization 53: 235–73. https://doi.org/10.1007/s11151-018-9621-4.Search in Google Scholar
Labban, M. 2020. “The Case of Remedesivir: How Do You Calculate the Cost of a Pandemic Drug?” In Pharm Technol. https://www.pharmaceutical-technology.com/pricing-and-market-access/remdesivir-calculate-the-cost-of-a-pandenmic-drug-html/?cf-view.Search in Google Scholar
Lakdawalla, D. N., E. C. Sun, A. B. Jena, C. M. Reyes, D. P. Goldman, and T. J. Philipson. 2010. “An Economic Evaluation of the War on Cancer.” Journal of Health Economics 29 (3): 333–46. https://doi.org/10.1016/j.jhealeco.2010.02.006.Search in Google Scholar
Lindgren, P., and B. Jönsson. 2012. “Cost-effectiveness of Statins Revisited: Lessons Learned about the Value of Innovation.” The European Journal of Health Economics 13: 445–50. https://doi.org/10.1007/s10198-011-0315-1.Search in Google Scholar
Merck & Co. Inc. 2021a. Supplement to Merck Earnings News Release 3Q. Published online: https://s21.q4cdn.com/488056881/files/doc_financials/2021/q3/Supplement-to-Merck-Earnings-News-Release-3Q-2021.pdf.Search in Google Scholar
Merck & Co. Inc. 2021b. Supplement to Merck Earnings News Release 4QFY. Published online: https://s21.q4cdn.com/488056881/files/doc_financials/2021/q4/Supplement-to-Merck-Earnings-News-Release-4QFY-2021.pdf.Search in Google Scholar
Merck & Co. Inc. 2022a. Supplement to Merck Earnings News Release 1Q. Published online: https://s21.q4cdn.com/488056881/files/doc_financials/2022/q1/Supplement-to-Merck-Earnings-News-Release-1Q22.pdf.Search in Google Scholar
Merck & Co. Inc. 2022b. Third Quarter 2022 Financial Highlights Package. Published online: https://s21.q4cdn.com/488056881/files/doc_financials/2022/q3/Third-Quarter-2022-Financial-Highlights-Package.pdf.Search in Google Scholar
Merck & Co. Inc. 2022c. Merck Announces Fourth Quarter and Full Year 2022 Financial Results. Published online: https://www.merck.com/news/merck-announces-fourth-quarter-and-full-year-2022-financial-results/.Search in Google Scholar
Merck & Co. Inc. 2022d. Financial Highlights Package 4Q and FY 2022. Published online: https://s21.q4cdn.com/488056881/files/doc_financials/2022/q4/Financial-Highlights-Package-4Q-and-FY-2022.pdf.Search in Google Scholar
Merck & Co. Inc. 2023a. Merck Announces First Quarter 2023 Financial Results. Published online: https://www.merck.com/news/merck-announces-first-quarter-2023-financial-results/.Search in Google Scholar
Merck & Co. Inc. 2023b. Financial Highlights Package 1Q 2023. Published online: https://s21.q4cdn.com/488056881/files/doc_financials/2023/q1/Financial-Highlights-Package-1Q23.pdf.Search in Google Scholar
Mishra, M. 2021. U.S. To Buy 10 mln courses of Pfizer’s COVID-19 Pill for $5.3 bln. Reuters. https://www.reuters.com/business/healthcare-pharmaceuticals/us-govt-buy-10-mln-courses-pfizers-covid-19-pill-529-bln-2021-11-18/.Search in Google Scholar
Moderna. 2021. Moderna Reports Second Quarter Fiscal Year 2021. Moderna. https://www.sec.gov/Archives/edgar/data/1682852/000119312521236922/d209372dex991.htm.Search in Google Scholar
Moderna. 2022. Moderna Annual Report. Moderna. https://d18rn0p25nwr6d.cloudfront.net/CIK-0001682852/30137103-e96d-4637-a252-2992aa472869.pdf.Search in Google Scholar
Mulligan, C. B. 2021. “Economic Activity and the Value of Medical Innovation during a Pandemic.” Journal of Benefit-Cost Analysis: 1–21. https://doi.org/10.1017/bca.2021.5.Search in Google Scholar
Mulligan, C. B. 2021. “Peltzman Revisited: Quantifying 21st-Century Opportunity Costs of FDA Regulation.” National Bureau of Economic Research: w29574. https://doi.org/10.3386/w29574.Search in Google Scholar
Pfizer Inc. 2021. Q4 2021 Financial Results. Published online: https://s28.q4cdn.com/781576035/files/doc_financials/2021/q4/Q4-2021-PFE-Earnings-Release.pdf.Search in Google Scholar
Pfizer Inc. 2022. Q1 2022 Financial Results. Published online: https://s28.q4cdn.com/781576035/files/doc_financials/2022/q1/Q1-2022-PFE-Earnings-Release.pdf.Search in Google Scholar
Pfizer Inc. 2022. Q2 2022 Financial Results. Published online: https://s28.q4cdn.com/781576035/files/doc_financials/2022/q2/Q2-2022-PFE-Earnings-Release.pdf.Search in Google Scholar
Pfizer Inc. 2022. Q3 2022 Financial Results. Published online: https://s28.q4cdn.com/781576035/files/doc_financials/2022/q3/Q3-2022-PFE-Earnings-Release.pdf.10.1016/j.fopow.2022.10.011Search in Google Scholar
Pfizer Inc. 2022. Q4 2022 Financial Results. Published online: https://s28.q4cdn.com/781576035/files/doc_financials/2022/q4/Q4-2022-PFE-Earnings-Release.pdf.10.1016/j.fopow.2022.02.017Search in Google Scholar
Pfizer Inc. 2023. Q1 2023 Financial Results. Published online: https://s28.q4cdn.com/781576035/files/doc_financials/2023/q1/Q1-2023-PFE-Earnings-Release.pdf.Search in Google Scholar
Philipson, T. J., and A. B. Jena. 2006. “Dividing the Benefits from Medical Breakthroughs.” Milken Review 8 (1): 46–56.Search in Google Scholar
Philipson, T., and A. B. Jena. 2006. “Who Benefits from New Medical Technologies? Estimates of Consumer and Producer Surpluses for HIV/AIDS Drugs.” Forum Health Econ Policy 9 (2). https://doi.org/10.2202/1558-9544.1005.Search in Google Scholar
Philipson, T. J., J. T. Snider, A. Chit, S. Green, P. Hosbach, T. Tinkham Schwartz, Y. Wu, and W. M. Aubry. 2017. “The Social Value of Childhood Vaccination in the United States.” American Journal of Managed Care 23 (1): 41–7.Search in Google Scholar
Regeneron Pharmaceuticals Inc. 2020. Regeneron Reports Third Quarter 2020 Financial and Operating Results. Published online November 5, 2020: https://investor.regeneron.com/news-releases/news-release-details/regeneron-reports-third-quarter-2020-financial-and-operating.Search in Google Scholar
Regeneron Pharmaceuticals Inc. 2021a. Regeneron Reports Fourth Quarter and Full Year 2020 Financial and Operating Results. Published online February 5, 2021: https://investor.regeneron.com/news-releases/news-release-details/regeneron-reports-fourth-quarter-and-full-year-2020-financial.Search in Google Scholar
Regeneron Pharmaceuticals Inc. 2021b. Regeneron Reports First Quarter 2021 Financial and Operating Results. Published online May 6, 2021: https://investor.regeneron.com/news-releases/news-release-details/regeneron-reports-first-quarter-2021-financial-and-operating.Search in Google Scholar
Regeneron Pharmaceuticals Inc. 2022a. Regeneron Reports Second Quarter 2022 Financial and Operating Results. Published online: https://newsroom.regeneron.com/news-releases/news-release-details/regeneron-reports-second-quarter-2022-financial-and-operating (August 3, 2022).Search in Google Scholar
Regeneron Pharmaceuticals Inc. 2022b. Regeneron Reports Third Quarter 2022 Financial and Operating Results. Published online November 3, 2022: https://newsroom.regeneron.com/news-releases/news-release-details/regeneron-reports-third-quarter-2022-financial-and-operating.Search in Google Scholar
Regeneron Pharmaceuticals Inc. 2022c. Regeneron Reports Fourth Quarter and Full Year 2022 Financial and Operating Results. Published online February 3, 2023: https://newsroom.regeneron.com/news-releases/news-release-details/regeneron-reports-fourth-quarter-and-full-year-2022-financial.Search in Google Scholar
Regeneron Pharmaceuticals Inc. 2022d. Regeneron Reports First Quarter 2022 Financial and Operating Results. Published online May 4, 2022: https://newsroom.regeneron.com/news-releases/news-release-details/regeneron-reports-first-quarter-2022-financial-and-operating.Search in Google Scholar
Regeneron Pharmaceuticals Inc. 2022e. Regeneron Reports Second Quarter 2022 Financial and Operating Results. Published online August 3, 2022: https://newsroom.regeneron.com/news-releases/news-release-details/regeneron-reports-second-quarter-2022-financial-and-operatin.Search in Google Scholar
Regeneron Pharmaceuticals Inc. 2022f. Regeneron Reports Third Quarter 2022 Financial and Operating Results. Published online November 3, 2022: https://newsroom.regeneron.com/news-releases/news-release-details/regeneron-reports-third-quarter-2022-financial-and-operating.Search in Google Scholar
Regeneron Pharmaceuticals Inc. 2022g. Regeneron Reports Fourth Quarter and Full Year 2022 Financial and Operating Results. Published online February 3, 2023: https://newsroom.regeneron.com/news-releases/news-release-details/regeneron-reports-fourth-quarter-and-full-year-2022-financial.10.1016/j.fopow.2023.02.013Search in Google Scholar
Regeneron Pharmaceuticals Inc. 2023. Regeneron Reports First Quarter 2023 Financial and Operating Results. Published online May 4, 2023: https://investor.regeneron.com/news-releases/news-release-details/regeneron-reports-first-quarter-2023-financial-and-operating.Search in Google Scholar
Steele, M. K., A. Couture, C. Reed, D. Iuliano, M. Whitaker, H. Fast, A. J. Hall et al.. 2022. “Estimated Number of COVID-19 Infections, Hospitalizations, and Deaths Prevented Among Vaccinated Persons in the U.S., December 2020 to September 2021.” JAMA Network Open 5 (7). https://doi.org/10.1001/jamanetworkopen.2022.20385.Search in Google Scholar
U.S. Department of Health and Human Services. 2021. Appendix D: Value of Statistical Life Update. HHS Guidelines. Published July 2021: https://aspe.hhs.gov/sites/default/files/2021-07/hhs-guidelines-appendix-d-vsl-update.pdf.Search in Google Scholar
UNESCO. 2021. Learning Losses from COVID-19 School Closures Could Impoverish a Whole Generation. UNESCO. https://www.unesco.org/en/articles/learning-losses-covid-19-school-closures-could-impoverish-whole-generation.Search in Google Scholar
United Nations World Tourism Organization (UNWTO). 2022. Impact Assessment of the COVID-19 Outbreak on International Tourism. https://www.unwto.org/impact-assessment-of-the-covid-19-outbreak-on-international-tourism.Search in Google Scholar
US Department of Health and Human Services. 2023. Paxlovid (nirmatrelvir co-packaged with ritonavir). HHS. https://aspr.hhs.gov/COVID-19/Therapeutics/Products/Paxlovid/Pages/default.aspx (accessed July 25, 2024).Search in Google Scholar
US Department of Health and Human Services. 2023. Lagevrio (molnupiravir). HHS. https://aspr.hhs.gov/COVID-19/Therapeutics/Products/Lagevrio/Pages/default.aspx (accessed July 25, 2024).Search in Google Scholar
US Food and Drug Administration. 2021. Coronavirus (COVID-19) Update: FDA Revokes Emergency Use Authorization for Monoclonal Antibody Bamlanivimab. US FDA. Published April 16: https://www.fda.gov/news-events/press-announcements/coronavirus-covid-19-update-fda-revokes-emergency-use-authorization-monoclonal-antibody-bamlanivimab.Search in Google Scholar
Vilches, T. N., S. M. Moghadas, P. Sah, M. C. Fitzpatrick, A. Shoukat, A. Pandey, and A. P. Galvani. 2022. “Estimating COVID-19 Infections, Hospitalizations, and Deaths Following the U.S. Vaccination Campaigns during the Pandemic.” JAMA Network Open 5 (1). https://doi.org/10.1001/jamanetworkopen.2021.42725.Search in Google Scholar
Weinreich, D. M., S. Sivapalasingam, T. Norton, S. Ali, H. Gao, R. Bhore, J. Xiao et al.. 2021. “REGEN-COV Antibody Combination and Outcomes in Outpatients with Covid-19.” New England Journal of Medicine 385 (23). https://doi.org/10.1056/NEJMoa2108163.Search in Google Scholar
World Bank. 2023. GDP (Current US$). Published: https://data.worldbank.org/indicator/NY.GDP.MKTP.CD.Search in Google Scholar
Yamana, T. K., S. Bhatia, R. Li, M. Di Fusco, F. J. Angulo, M. M. Moran, F. Khan, D. L. Swerdlow, and J. Shaman. 2023. “The Impact of COVID-19 Vaccination in the U.S.: Averted Burden of SARS-COV-2-Related Cases, Hospitalizations, and Deaths.” PLoS One 18 (4). https://doi.org/10.1371/journal.pone.0275699.Search in Google Scholar
© 2025 the author(s), published by De Gruyter, Berlin/Boston
This work is licensed under the Creative Commons Attribution 4.0 International License.
Articles in the same Issue
- Frontmatter
- Articles
- COVID-19 Biopharmaceutical Innovation and Industry Appropriation
- The Muslim Ban and Preventive Care for Children of Middle Eastern Ancestry
Articles in the same Issue
- Frontmatter
- Articles
- COVID-19 Biopharmaceutical Innovation and Industry Appropriation
- The Muslim Ban and Preventive Care for Children of Middle Eastern Ancestry