Two Approaches for Measuring Treatment Value Under Uncertainty: Estimating Insurance Value and Risk Preferences in Neurology
-
Jason Shafrin

 ,
Kyi-Sin Than
,
Kyi-Sin Than

Abstract
Neurological conditions adversely impact patients and society due to both quality-of-life decrements and high financial burden. Traditional cost effectiveness methods, however, may undervalue neurological treatments by assuming patients are risk neutral. This study seeks first to quantify insurance value for hypothetical treatments that delay the (i) cognitive and (ii) physical impairments of neurological conditions. Moreover, this study also measures risk preferences over neurological health states to inform parameterization of generalized risk-adjusted cost effectiveness (GRACE) analyses. Two national surveys – one evaluating cognitive impairments and the other mobility impairments – were administered to U.S. residents aged ≥21 years between July 2023 to November 2023. First, a multiple random staircase design was used to elicit respondents’ willingness-to-pay (WTP) for coverage of a hypothetical, new treatment that delayed the progression of cognitive or mobility impairments relative to the standard of care. Insurance value was calculated as the share of the stated preference estimated WTP that exceeded the expected quality-adjusted life year (QALY)-based value assuming risk neutrality. Second, to measure risk aversion, respondents were asked to (i) estimate health-related quality of life (HRQoL) for cognitive and mobility impairment health states using a visual analog scale, and (ii) choose between two hypothetical treatments with probabilistically varying across outcomes following the Holt and Laury (Holt, C. A., and S. K. Laury. 2002. “Risk Aversion and Incentive Effects.” American Economic Review 92 (5): 1644–55). Respondents’ indifference points were inferred from survey responses and used to estimate relative risk aversion (RRA) assuming a constant relative risk aversion utility function. Among n = 295 respondents meeting inclusion criteria for the cognitive survey, 64.9 % were female and the average age was 51 years (SD = 16). WTP for generous insurance coverage of a new treatment delaying cognitive impairment was $646.88 per year compared to $260.80 calculated under traditional (i.e. risk neutral) cost-effectiveness approaches, implying a risk-adjusted cost effectiveness threshold of $248,037 per QALY. Respondents were risk averse over cognitive impairment outcomes, with mean RRA of 1.49 (95 % CI: [1.29, 1.68]). Among the 259 respondents meeting the inclusion requirement for the mobility survey 51.0 % were female and the average age was 49 years (SD = 16 years). WTP for insurance coverage of a new treatment that would prevent progression of mobility impairments was $671.35 per year compared to $133.23 calculated under traditional cost-effectiveness, implying a risk-adjusted cost effectiveness threshold of $502,193 per QALY. Respondents were risk averse over mobility outcomes with mean RRA of 0.68 (95 % CI: [0.51, 0.86]). Due to insurance value, respondents exhibited high willingness to pay for treatments that reduced cognitive and mobility impairments caused by neurological conditions. Individuals were risk averse over both cognitive- and mobility-related neurology health states.
1 Introduction
In the United States, neurological conditions pose a significant burden to patients with stroke, Alzheimer’s disease, other dementias, and migraines accounting for a combined 8.9 million disability-adjusted life years (Feigin et al. 2021). Over 600 neurological conditions severely impact pediatric and adult patient health-related quality of life (HRQoL) through physical, cognitive, and emotional impairments (Cella et al. 2011; Thakur et al. 2016; Stroke 2024). The treatment and management of neurological conditions also impose a significant financial burden on patients and the healthcare system. In the United States (U.S.), total costs for patients with functional neurological disorders total $1.07 billion per year (Stephen et al. 2021). Management of neurological disorders often requires specialized care and complex diagnostics, and in many clinical settings patients lack access to these diagnostics, treatments, and resources (Ningrum and Kung 2023).
The progression of many prevalent and severe neurological conditions can be broadly described by progressively worsening cognitive and mobility impairments (Perez et al. 2007). Alzheimer’s disease is the most common neurodegenerative disease causing memory loss, disorientation, and loss of social judgement (Joe and Ringman 2019). Patients diagnosed with Alzheimer’s disease experience poor quality of life, especially in later stages of the disease, and a mean survival from diagnosis of 5.8 years (Neumann et al. 1999; Ekman et al. 2007; Liang et al. 2021). Parkinson’s disease is the second most common neurodegenerative disease and is associated with motor symptoms and cognitive impairments (Hoehn and Yahr 1967; Marta Gwinn 2013; Neurosciences 2024). Parkinson’s patients experience axial tremor in earlier stages of the disease and progress to more severe forms of disability leading patients to be confined to a wheelchair or bedridden and reliant on caregivers (Hoehn and Yahr 1967; Service 2023). In addition, approximately 80 % of Parkinson’s patients develop cognitive impairment during the course of their disease (Neurosciences 2024). In recent years, several disease-modifying therapies for severe neurological conditions have received FDA-approval. In 2021, aducanumab received FDA accelerated approval for the treatment of early Alzheimer’s disease, followed by lecanemab in 2023 (Brockmann et al. 2023; FDA 2023). Patients with Parkinson’s disease rely heavily on dopaminergic drugs to alleviate disease symptoms, but several novel therapeutic agents are under development addressing newly discovered mechanisms of pathology such as SNCA, LRRK2, and PARK7 (Dong et al. 2016).
While traditional cost effectiveness approaches assume treatment value is independent of disease severity, other approaches – such as stated preference estimates of “insurance value” and use of generalized risk-adjusted cost effectiveness analysis (GRACE) – allow for treatment value to vary based on disease severity due to risk preferences (Lakdawalla and Phelps 2021, 2022). Specifically, insurance value recognizes that individuals at risk for severe diseases in the future may have a relatively high willingness to pay for treatments to improve health outcomes (Lakdawalla et al, 2018). The reason for this high valuation is that new treatments not only improve quality of life and survival outcomes, but also reduce the variance in health outcomes between the healthy and sick disease states. This reduction in health risk is more highly valued when individuals are more risk averse across health outcomes. While insurance value has previously been quantified using stated preference surveys, GRACE incorporates insurance value within cost effectiveness modeling techniques (Lakdawalla and Phelps 2021, 2022, 2023). In 2023, the Institute for Clinical and Economic review named GRACE as a key methodological advancement for addressing the limitations of QALYs when valuing treatments for severe disease (Institute for Clinical and Economic Review 2023). When allowing for diminishing marginal returns under GRACE, 17 of 20 proposed treatments were found to be cost-effectives, compared to eight under traditional cost effectiveness (Lakdawalla et al. 2023). Although these methodological advancements are an area of growing interest, there currently is limited evidence on the impact of GRACE on value assessment. Moreover, to accurately measure the health economic benefits of treatment, GRACE requires empirical estimates of relative risk aversion (RRA) over quality-of-life health states. While there have been some estimates of this RRA parameter (Mulligan et al. 2024), RRA has not been estimated over health states specifically related to cognitive and mobility impairments.
Given recent innovations and continued investments in research and development of treatments for neurological diseases combined with the methodological advancements in value assessment, this study seeks to quantify the insurance value of two hypothetical, disease-modifying treatments that delay progression of cognitive or mobility impairments caused by neurological conditions and elicit neurology-specific risk-aversion estimates over cognitive and mobility impairment health states that could be applied in GRACE.
2 Methods
2.1 Study Design
This study conducted two stated-preference surveys (one for cognitive impairment and one for mobility impairment, hereafter the “cognitive survey” and “mobility survey”). Besides the informed consent form and questions for the inclusion criteria, both surveys had four primary modules: HRQoL ranking, insurance value, relative risk aversion, and respondent characteristics.
2.1.1 Health State Quality of Life Ranking
To assess respondents’ perceived utility for each health state, a visual analog scale (VAS) was presented to each respondent to measure their HRQoL for each cognitive or mobility health state (Hayes and Patterson 1921; Parkin and Devlin 2006; Oddershede et al. 2014). The cognitive survey anchored progression of neurological conditions to the cognitive impairments and staging described by the Clinical Dementia Rating (CDR) scale, which describes the cognitive and functional decline of patients with dementia across six categories (Berg 1984). The CDR defines cognitive and functional decline according to five health states: no cognitive impairment, mild cognitive impairment, mild dementia, moderate dementia, and severe dementia (Berg 1984). The mobility survey relied upon four simplified mobility impairment health states anchored to the Expanded Disability Status Scale (EDSS), which is used in the clinical staging of multiple sclerosis patients (Kurtzke 1983). Mobility impairment health states were defined as minimally impaired, able to walk with aid, confined to a wheelchair, and bedridden. A description of how mobility impairment health states were mapped to the EDSS and other neurological staging scales can be found in the online Appendix.
While the baseline approach relied on HRQoL values from literature, the VAS scale was used to evaluate individual HRQoL values. While literature-based approaches (e.g., time trade-off or standard gamble approach) are more accurate than VAS and are more commonly used in value assessment, individualized HRQoL values are necessary if there is significant heterogeneity in HRQoL valuations across individuals. For this survey, the VAS was selected for its ease of use and low cognitive burden, which mitigated the potential for respondents to be overly fatigued prior to beginning the insurance value or risk aversion survey modules. An example ranking question is shown in online Appendix Figure 1.
2.1.2 Insurance Value
In both surveys, insurance value was elicited as respondent willingness-to-pay (WTP) for generous insurance coverage of a hypothetical, novel treatment that delayed disease progression. The survey questions followed a multiple random staircase design, which estimates respondent WTP by adjusting the range of possible WTP, based on prior respondent selections, and offering the next choice to the respondent as the midpoint of the updated range (Gracely et al. 1988; Shafrin et al. 2021). Survey respondents were presented with these estimates in six questions which mitigated respondent fatigue, increased respondent engagement, and minimized the margin of error for estimating respondent WTP. Respondents were presented with two hypothetical insurance plans: Plan 1, which did not have additional monthly premium (i.e., $0 incremental premium) but covered only conventional supportive care for cognitive or mobility impairment, and Plan 2, which added coverage for a hypothetical disease modifying therapy that delayed progression of neurological conditions for an additional monthly premium payment. In the cognitive survey, the treatment delayed the onset of dementia from mild cognitive impairment by one year – calibrated from a FDA-approved disease modifying treatment (Van Dyck et al. 2023). In the mobility survey, respondents were asked to consider a 25 % delay in progression of their mobility impairment, calibrated to a FDA-approved treatment of primary progressive multiple sclerosis (Montalban et al. 2017). The initial premium payment for the novel hypothetical treatment was set to $25.00 per month in the cognitive survey and $11.00 per month in the physical survey as described in the statistical analyses section. A respondent’s final selection was used as the estimate for their monthly WTP. The first questions of the random staircase design for both surveys are shown in Figure 1.
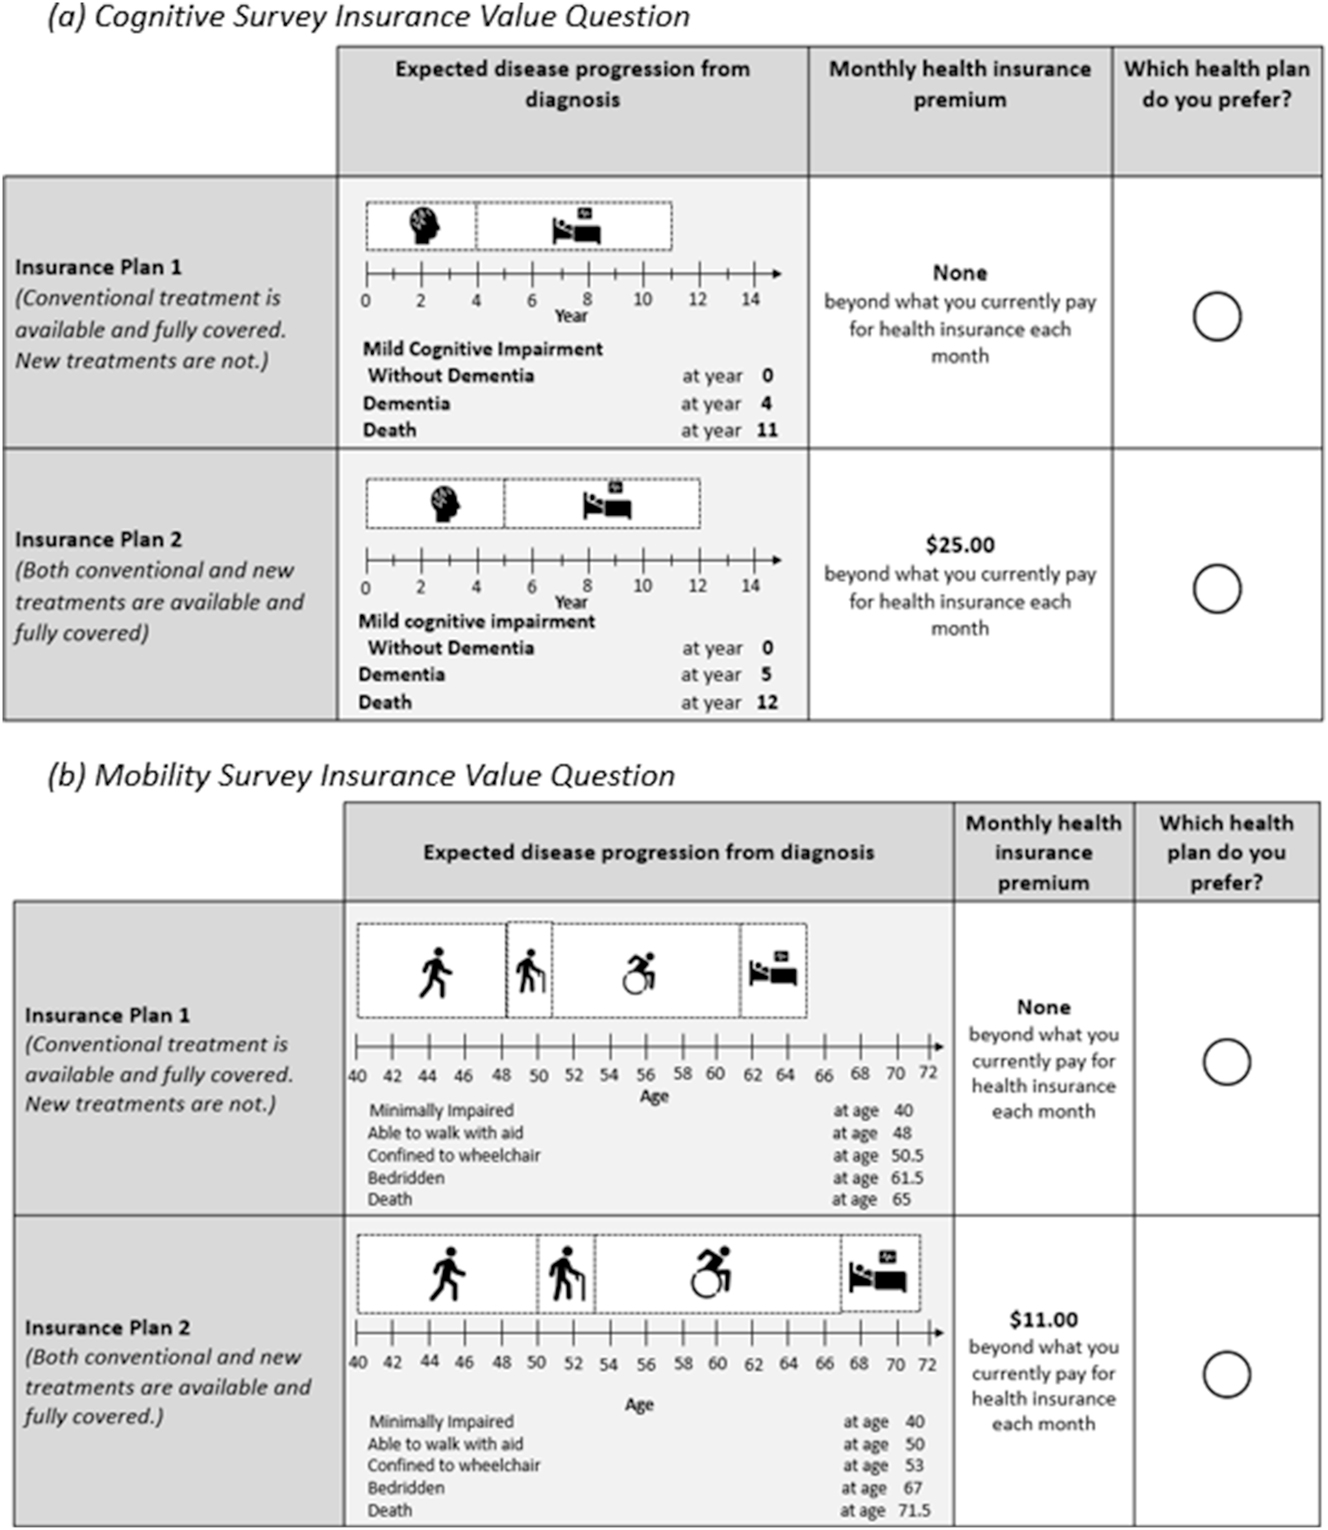
Insurance value sample questions.
2.1.3 Relative Risk Aversion
RRA was elicited from respondents following an approach developed by Holt and Laury (2002). The Holt and Laury approach has traditionally been used to measure risk aversion over financial outcomes, but has been applied to measure risk aversion over health outcomes as well (Holt and Laury 2002; Galizzi et al. 2016; Arrieta et al. 2017; Brooks et al. 2018; Guiso et al. 2018). In both surveys, respondents were shown two hypothetical treatments with uncertain outcomes across four health states. Treatment A was the less risky therapy with outcomes split across the 2nd and 3rd ranked health states (based on HRQoL); treatment B was the risky treatment with outcomes split across the best and worst health states. The Holt and Laury procedure begins with one treatment being strictly better (i.e., dominated) than the other by guaranteeing a 100 % probability in a better health state in the following year. As the module progresses, the probabilistic outcomes of each health state update so that the expected utility of the initial strictly preferred treatment monotonically decreases, while the expected utility of the alternative treatment monotonically increases. Figure 2 provides examples of this module from both surveys. An example table of the probability sequence from the mobility survey can be found in online Appendix Table 2.

Relative risk aversion sample questions.
2.2 Population and Survey Administration
For inclusion in each survey, respondents were required to be 21 years of age or older, fluent in English, and provide informed consent to take part in the study. In addition, individuals who did not select dominated options in the risk aversion module were excluded from the survey. Participants were recruited from a panel of the U.S. general population (Sago 2024). Respondents who took part in both surveys were compensated with cash-value gift cards. Both surveys received institutional review board (IRB) approval from Advarra and were administered from July 21, 2023 to November 27, 2023.
The cognitive and mobility surveys were pilot tested in a moderated environment with eight and four respondents for cognitive and mobility surveys, respectively, prior to being administered to the full general population sample. Based on pilot tests, modifications in both surveys included more detailed instructions in the RRA module and simplification of the CDR scale description in the cognitive survey.
In both surveys, the RRA module was administered to half of the participants beginning with treatment A dominating while the other half began with treatment B dominating. This procedure mitigated the possibility that the question order biased RRA elicitation.
2.3 Statistical Analyses
2.3.1 Insurance Value
Insurance value was calculated as the difference in respondent WTP for the hypothetical treatment and the risk-neutral ex-ante expected value of treatment. Formally insurance value, as a percentage of treatment value, was defined according to Equation (1).
where WTP i is an individual respondent’s annual WTP for access to the hypothetical intervention and N is the number of respondents in the sample. The cognitive survey had an initial, additional monthly premium of $25.00 per month and the mobility survey had an initial, additional monthly premium of $11.00 per month. The monthly WTP in both surveys could range from $0 per month to $100 per month. This approach follows the methodology from previously published estimates of insurance value. (Shafrin et al. 2021, 2023)
The initial monthly premiums presented to respondents represented the risk-neutral, ex-ante willingness to pay computed using conventional cost-effectiveness thresholds. Formally, the expected value of treatment (E (Tx)) was defined by Equation (2).
where p(D) represents the annual U.S. incidence of neurological conditions that cause cognitive or mobility impairments. The incidence for cognitive impairment caused by neurological conditions was derived from a 5-year, cumulative incidence rate for dementia in the U.S. of 0.4 %. (Satizabal et al. 2016) The incidence for mobility impairment caused by neurological conditions was calculated as the weighted average of U.S. incidence of multiple sclerosis, Parkinson’s disease, and myasthenia gravis using U.S. prevalence of each disease as weights. (Sharma et al. 2018; Dresser et al. 2021; Ou et al. 2021) The resulting incidence was 0.076 %. QALYs for the treatment and comparator were computed from the respective health outcome distributions in Figure 1, literature-based HRQoL estimates for cognitive and mobility impairments, and a standard discount rate of 3 %. (Ekman et al. 2007; Hawton and Green 2016) WTP for a QALY was assumed to follow a cost-effectiveness threshold of $100,000 frequently relied upon by traditional CEA studies and value assessment frameworks, such as the Institute for Clinical and Economic Review (Emre 2003; Institute for Clinical and Economic Review 2020).
2.3.2 Relative Risk Aversion
Among respondents in the surveys who changed treatment selection once (e.g., selected treatment B in Figure 2 instead of treatment A), the point at which the respondent switched was used to identify an indifference point in the respondent’s utility function. First, the question where a participant switched from treatment A to treatment B was identified and the probabilities of each health state resulting from treatment A and treatment B were recorded. Second, both surveys’ assumed utility took the functional form of a constant relative risk aversion (CRRA) utility function. Third, the HRQoL estimates used in the cognitive survey were from the published results of a general population survey using a time-trade-off design and the identical CDR health states used in the current survey (Ekman et al. 2007). In the mobility survey, individual respondent HRQoL ratings from the VAS module were used to parameterize each respondent’s CRRA utility function, because no literature-based HRQoL estimates were available for the simplified health states used in this survey. To be comparable with literature-based estimates for HRQoL, the scores provided by respondents in the VAS module were divided by 100. Formally, expected utility was defined by Equation (3).
where EURRA(x) is the expected utility of a treatment, p(x) is the probability of each health state in the following year, U(x) is the utility of that health state, and α is the RRA parameter. Finally, a recursive algorithm was employed to solve for a α such that the difference in expected utility between the two treatments was 0. Respondents who did not switch until the risky treatment strictly dominated the initial were imputed a maximum risk aversion value of 4.0.Online Appendix Table 2 provides a detailed example of this process. Once RRA had been computed, the distribution of risk preferences was plotted as a histogram with an approximated smoothed distribution overlayed.
2.4 Sensitivity Analyses
Five sensitivity analyses were applied to the insurance value estimates. First, insurance value results were stratified by respondent characteristics including, age, income, sex, and prior experience with neurological conditions. Second, the sample was reweighted to match the 2020 U.S. Census. Third, insurance value was also computed assuming the delay in disease progression did not confer any survival gain to patients. Fourth, insurance value was computed when considering different cost effectiveness thresholds used in value assessments conducted from a U.S. healthcare perspective (Institute for Clinical and Economic Review 2020; Institute for Clinical and Economic Review 2023; Shafrin et al. 2024). Fifth, prospect theory decisions weights – rather than actual probabilities – were used to account for respondents over- or under-estimating the annual incidence of neurological conditions (Tversky and Kahneman 1992).
Multiple sensitivity analyses were performed to ensure the robustness of RRA estimates. RRA estimates were stratified by patient characteristics and prior risk-seeking and avoidance behavior. In addition, for individuals who switched between the safe and risky options multiple times, different algorithms (e.g., first switch, last switch, midpoint of switches) were used to estimate risk aversion. Third, RRA was calculated using alternate HRQoL estimates (e.g., Alzheimer’s disease patient-reported HRQoL and survey respondent-reported HRQoL for the cognitive survey; literature-based and survey average health state HRQoL for the mobility survey) (Neumann et al. 1999). Finally, for the cognitive survey only, RRA was computed after re-scaling respondent HRQoL estimates to account for the impact of cognitive decline on patient perception of disease severity (Landeiro et al. 2020).
3 Results
3.1 Respondent Characteristics
Among 912 (cognitive survey) and 600 (mobility survey) respondents who met the inclusion criteria, 295 and 259 respondents were included in the statistical analysis, respectively, after applying post-hoc exclusion criteria to ensure data quality. Exclusions were applied for ranking two health states as equally severe (n = 121 for cognitive and n = 116 for mobility), failure to select treatments in the RRA module that were strictly preferred under any relative risk aversion (n = 457 for cognitive and n = 199 for mobility), and switching treatment choices more than three times (n = 39 for cognitive and n = 26 for mobility).
The average age of respondents was 51.5 years (SD = 16.0) in the cognitive survey and 49.3 years (SD = 16.1) in the mobility survey. Both samples had a slight majority of female respondents (cognitive: 54.2 %, physical 51.0 %), a largely white population (cognitive: 85.4 %, physical: 82.5 %), and were similar to the 2020 U.S. Census on marital status and educational attainment. A smaller proportion of respondents had income above $100,000 per year compared to the U.S. Census (cognitive: 23.3 %, physical: 21.6 % vs. 33.6 % U.S.). Over half (50.2 %) of cognitive survey respondents had prior disease experience with neurological conditions, while 76.1 % of physical survey respondents had no prior disease experience (Table 1). See online Appendix Table 3 for a detailed table of respondent characteristics.
Respondent characteristics.
| Metric | Cognitive | Mobility | ||
|---|---|---|---|---|
| N/mean | %/SD | N/mean | %/SD | |
| Age | 51.1 | 16.0 | 49.3 | 16.1 |
|
|
||||
| 18–24 | 18 | 6.1 % | 8 | 3.1 % |
| 25–34 | 38 | 12.9 % | 51 | 19.7 % |
| 35–44 | 51 | 17.3 % | 47 | 18.1 % |
| 45–54 | 53 | 18.0 % | 52 | 20.1 % |
| 55–64 | 69 | 23.4 % | 44 | 17.0 % |
| ≥ 65 | 66 | 22.4 % | 57 | 22.0 % |
|
|
||||
| Gender | ||||
|
|
||||
| Male | 131 | 44.4 % | 126 | 48.6 % |
| Female | 160 | 54.2 % | 132 | 51.0 % |
| Non-binary or prefer not to answer | 4 | 1.4 % | 1 | 0.4 % |
|
|
||||
| Marital status | ||||
|
|
||||
| Married | 133 | 45.1 % | 133 | 51.4 % |
| Never married | 101 | 34.2 % | 90 | 34.7 % |
| Divorced | 43 | 14.6 % | 24 | 9.3 % |
| Widowed/separated | 18 | 6.1 % | 12 | 4.6 % |
|
|
||||
| Race | ||||
|
|
||||
| Native American | 5 | 1.7 % | 10 | 3.9 % |
| Asian/Pacific islander | 25 | 8.5 % | 9 | 3.5 % |
| Black | 18 | 6.1 % | 37 | 14.3 % |
| White | 252 | 85.4 % | 213 | 82.2 % |
| Prefer not to answer | 6 | 2.0 % | 4 | 1.5 % |
|
|
||||
| Income | ||||
|
|
||||
| ≤$9,999 | 15 | 5.1 % | 20 | 7.7 % |
| $10,000–$49,999 | 92 | 31.2 % | 81 | 31.3 % |
| $50,000–$74,999 | 68 | 23.1 % | 52 | 20.1 % |
| $75,000–$99,999 | 42 | 14.2 % | 45 | 17.4 % |
| $100,000–$149,000 | 37 | 12.5 % | 36 | 13.9 % |
| ≥$150,000 | 32 | 10.8 % | 20 | 7.7 % |
| Not reported | 9 | 3.1 % | 5 | 1.9 % |
|
|
||||
| Education | ||||
|
|
||||
| High school or less | 34 | 11.5 % | 34 | 13.2 % |
| Some college | 51 | 17.3 % | 56 | 21.6 % |
| Associates degree | 36 | 12.2 % | 28 | 10.8 % |
| College or more | 112 | 38.0 % | 94 | 36.3 % |
3.2 Insurance Value
In both the cognitive and mobility survey respondents valued having medical innovations available that improved the HRQoL of neurological conditions, should they be diagnosed in the future.
The majority of cognitive survey respondents (82.0 %) were willing to pay more than the risk-neutral, ex-ante premium of $25.00 per month, and mean monthly WTP was $53.91. The distribution of monthly WTP was left skewed and 14.9 % of cognitive respondents selected the maximum monthly premium of $100 in the insurance value survey module, implying that the true WTP may be higher. Annually, members of the U.S. general population were willing to pay $386.08 more than the expected value of treatment ($260.80) implying that 59.68 % of treatment value is accounted for by the WTP of healthy members of the general population. This WTP imputes a cost-effectiveness threshold of $248,037 per QALY for the treatment of cognitive impairments caused by neurological conditions (Table 2).
Insurance value results.
| Survey | WTP, monthly [A] | WTP, annual [B] = [A] x 12 | Expected value, annual [C] | Difference [D] = [B] − [C] | Insurance value [E] = [D] ÷ [B] | Implied cost effectiveness threshold |
|---|---|---|---|---|---|---|
| Cognitive | $53.91 | $646.88 | $260.80 | $386.08 | 59.68 % | $2,48,037 |
| Mobility | $55.95 | $671.35 | $133.23 | $538.12 | 80.16 % | $5,02,193 |
The majority of mobility survey respondents (81.9 %) were willing to pay more than the risk-neutral, ex-ante premium of $11.00 per month, and mean monthly WTP was $55.95. The distribution of monthly WTP was also left skewed and 35.7 % of mobility survey respondents selected the maximum monthly premium of $100 in the insurance value survey module, implying that the true WTP may be higher. Annually, members of the U.S. general population were willing to pay $538.12 more per month than the expected value of treatment ($133.23) implying that 80.16 % of treatment value is accounted for by the WTP of healthy members of the general population. This WTP imputes a cost-effectiveness threshold of $502,193 per QALY for the treatment of mobility impairments caused by neurological conditions (Figure 3).
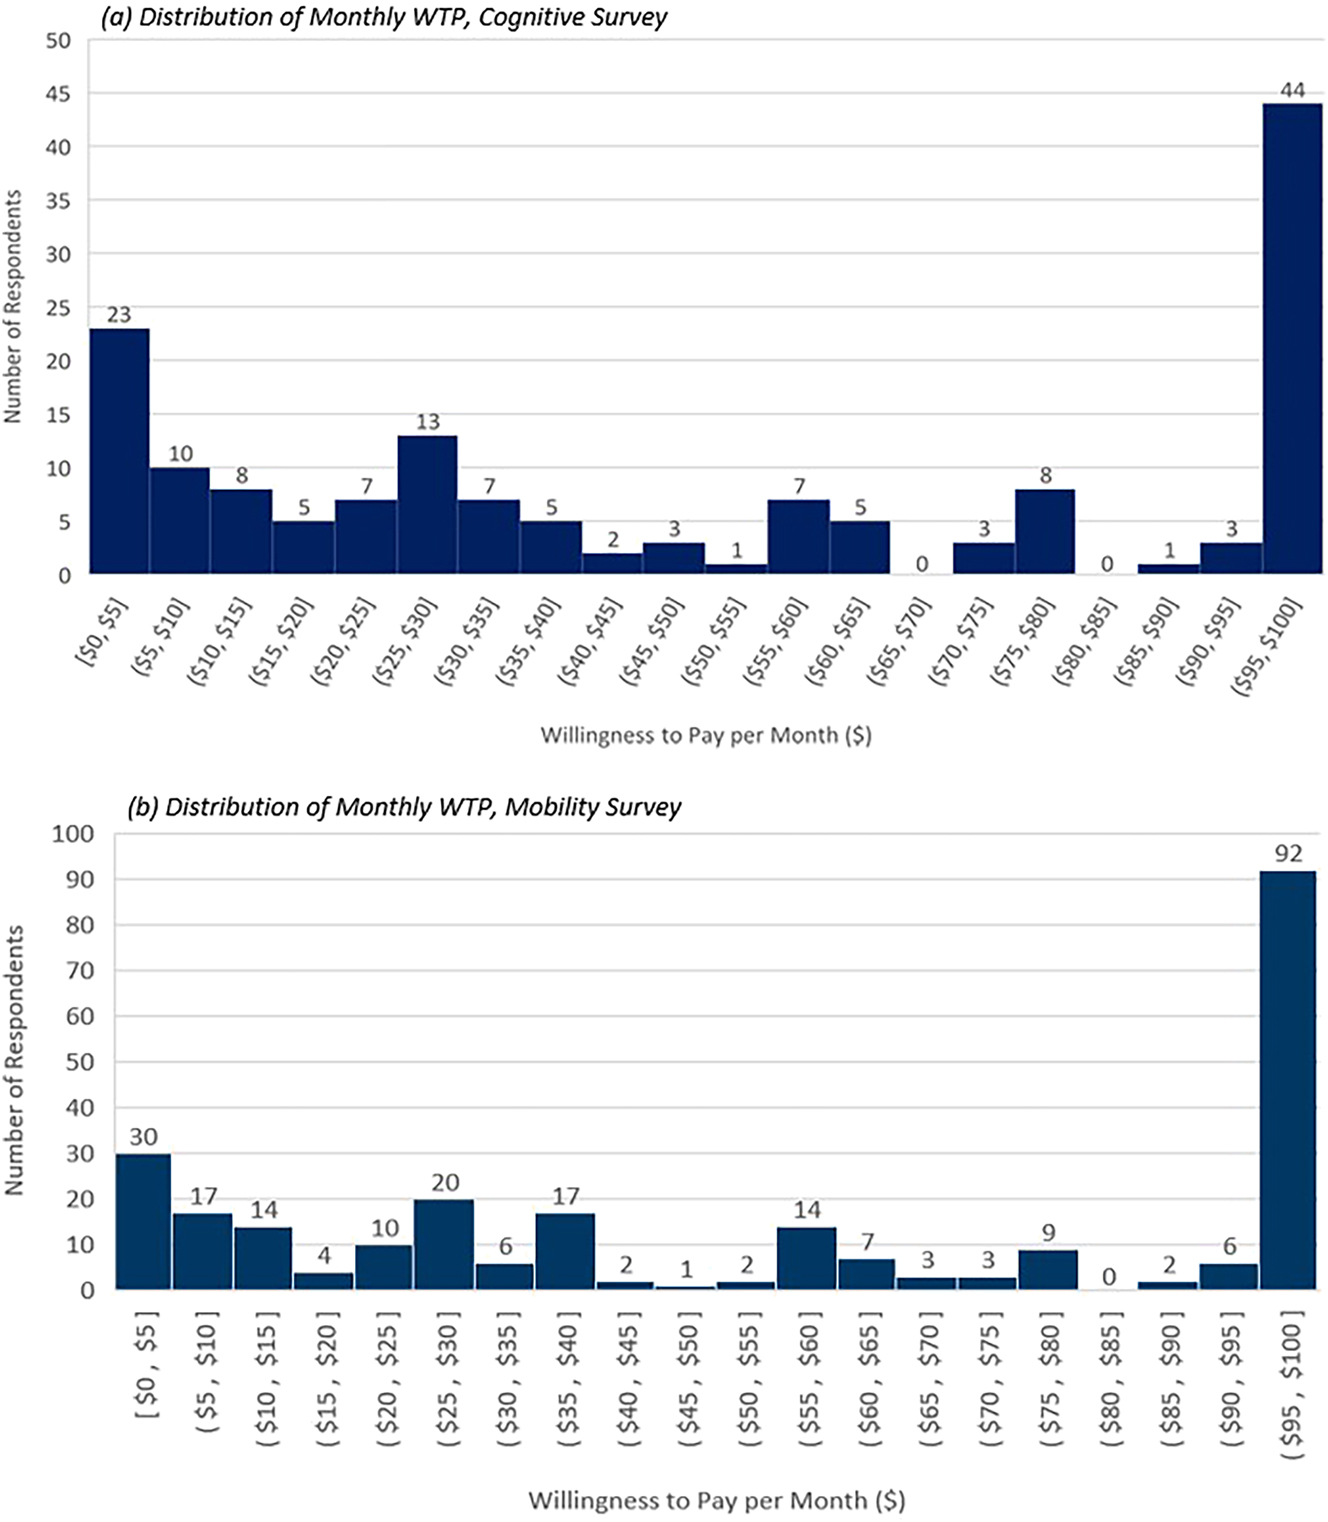
Distribution of respondent willingness-to-pay.
3.3 Relative Risk Aversion
In both the cognitive and mobility surveys, members of the U.S. general population were risk averse over neurological health outcomes. In the cognitive survey, 85.9 % of respondents were risk averse (RRA > 0) with a mean RRA of 1.487 (95 % CI: [1.292, 1.681]). In the mobility survey, 62.5 % of respondents were risk averse with a mean RRA of 0.680 (95 % CI: [0.506, 0.855]). Cognitive survey RRA was left skewed while physical results were approximately normally distributed despite a concentration of respondents exhibiting high levels of risk aversion (Figure 4). Risk aversion estimates were driven in part by respondents in both the cognitive and mobility surveys ranking the perceived HRQoL of CDR and mobility impairment health states as worse compared to estimates in the literature. Respondents also reported a greater variance in HRQoL decrement between CDR and mobility impairment health states (Online Appendix Table 2).

Distribution of relative risk aversion.
When applied to methodological advancements in value assessment, such as GRACE, the existence of risk aversion corroborates the use of higher WTP thresholds when treating severe disease as observed in the insurance value results (Section 3.2). Figure 5 plots the severity ratio, or a healthy member of the general population’s perception of disease severity, used by GRACE to compute risk and severity-adjusted WTP for severe disease (Lakdawalla and Phelps 2021). As the HRQoL loss caused by neurological conditions increases, the impact of treating a severe disease increases under GRACE compared to what is assumed by traditional cost effectiveness (Lakdawalla and Phelps 2021). Using the RRA estimates from each survey (cognitive: 1.487, mobility: 0.680) and assuming a mean patient HRQoL of 0.50, the value of the “R” multiplier in the GRACE model would be 2.8× larger, compared to traditional cost effectiveness, for cognitive impairments and 1.6× larger for mobility impairments (Figure 5).
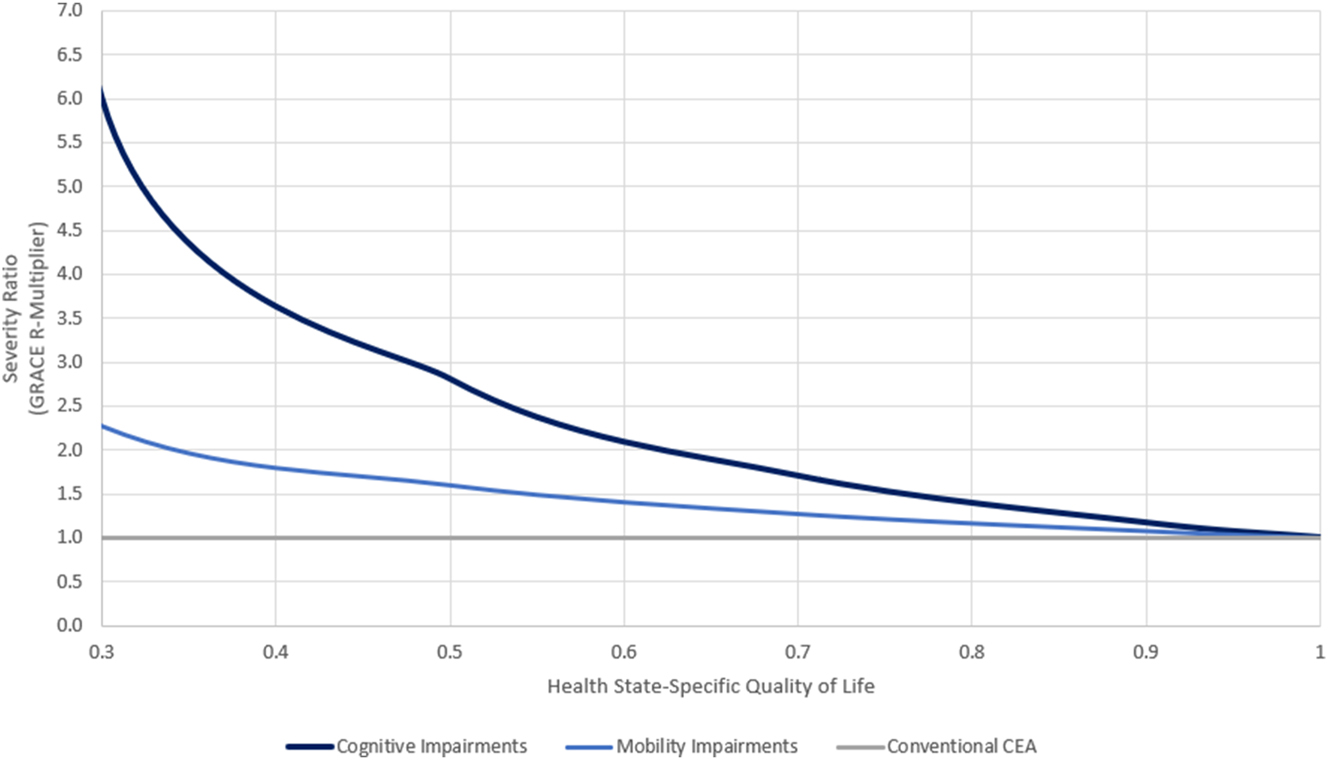
Implied severity ratios for survey RRA results based on (Lakdawalla and Phelps 2021).
3.4 Sensitivity
The results of sensitivity analyses demonstrated that this study provided robust estimates of insurance value for neurological conditions. Insurance value did not differ materially by respondent characteristics, Census re-weighting, or assuming the treatment did not confer a survival gain in either the cognitive or mobility survey (Online Appendix Tables 5–7). Insurance value was proportional to the assumed cost effectiveness threshold use to compute the ex-ante premium (Online Appendix Table 8). When using cumulative decision weights to control for participants over-weighting annual disease incidence, insurance value was positive for all gamma values ≥0.85 in both surveys (Online Appendix Table 9).
Respondents aged 35–44 years were less risk averse compared to other age groups in the cognitive survey (RRA = 0.839 vs. 1.613) (Online Appendix Table 10). Mobility survey RRA did not differ by respondent characteristics (Online Appendix Table 11). In both surveys, RRA estimates were sensitive to the health state HRQoL used, including rescaling to literature estimates in the cognitive survey, but insensitive to the indifference point selected to calculate RRA (Online Appendix Tables 12–15). In both surveys, RRA estimates were insensitive to re-weighting to match the U.S. Census (Online Appendix Tables 16 and 17).
4 Discussion
Recent methodological advances in healthcare have highlighted the importance of incorporating risk preferences into health technology assessment (HTA) (Sanders et al. 2016; Lakdawalla et al. 2018; Prados et al. 2022). This study builds upon a growing body of research eliciting risk preferences over HRQoL outcomes and the additional value of treating severe diseases such as neurological conditions (Liu et al. 2016; Esposito and Hassoun 2017; Lakdawalla et al. 2017, 2018; Lakdawalla and Phelps 2021, 2022, 2023; Nielsen et al. 2021; Prados et al. 2022; Shafrin et al. 2023; Mulligan et al. 2024). Previous efforts measuring insurance value for oncology products, gene therapies, and relapse remitting multiple sclerosis interventions found that the majority of treatment value was due to the WTP of healthy members of the general population (Liu et al. 2016; Shafrin et al. 2021, 2023). The neurology-specific estimates of insurance value produced in this study were slightly lower compared to those for cancer and Duchenne muscular dystrophy, but higher than previous estimates for multiple sclerosis.
This study provides the first published estimates for risk aversion over neurological quality of life health states. In both surveys, respondents were risk averse over neurological health states and risk aversion estimates were higher for cognitive impairments compared to mobility impairments (1.487 vs. 0.680). At baseline, the cognitive RRA estimate relied on patient-elicited HRQoL estimates, which have been shown to deviate from the HRQoL estimates of their care-partners, as patients may fail to recognize their cognitive decline (Landeiro et al. 2020). When using respondent-provided HRQoL scores as a sensitivity analysis, respondents were less risk-averse over cognitive outcomes (cognitive RRA: 0.561 and 0.538; mobility RRA: 0.680) compared to mobility outcomes. Previous estimates of risk aversion over health were either estimated from populations outside the U.S. or were not disease specific (Attema et al. 2016; Mulligan et al. 2024). General risk aversion estimates from a survey of the U.S. population were lower (0.282) than those found in this study and produced estimates for multiple utility functions (compared to CRRA) (Mulligan et al. 2024). However, these estimates relied upon generic HRQoL tradeoffs rather than neurology-specific scenarios, and elicited risk preferences over HRQoL values of 0.20 and higher. By comparison, neurologic conditions present patients with HRQoL levels lower than 0.20 in the most severe health states and members of the general population may be more risk-averse over higher levels of HRQoL loss (Ekman et al. 2007; Hawton and Green 2016; Barnett et al. 2019). Unlike estimates from the financial economics literature, this study did not find a correlation between risk preferences and demographic covariates, such as race and gender (Holt and Laury 2002; Fehr-Duda et al. 2006; Guiso et al. 2018).
HTAs reviewing therapeutics for neurological indications, such as GRACE, can use the risk-aversion estimates provided in this study to incorporate the value of treating severe disease and reducing uncertainty in health outcomes. GRACE addresses some limitations of current value assessment frameworks, which assume patient utility curves are linear (risk-neutral) and therefore undervalue the survival gains for patients with severe disease, but requires disease-specific risk aversion estimates to accurately capture the value of medical innovation (Esposito and Hassoun 2017; Lakdawalla et al. 2018; Lakdawalla and Phelps 2022). Payers and policy makers can use the insurance value results of this study to capture societal benefits of neurological innovation in value-based pricing and cost effectiveness thresholds as current reliance on static estimates of WTP for health improvements ignore disease severity (Gyrd-Hansen 2005). Future research could provide indication and treatment-specific estimates for risk aversion and insurance value.
This study is subject to several limitations. First, risk aversion estimates in this study were shown to be sensitive to health state-specific HRQoL estimates, and the symptoms of neurological conditions often make patient-reported HRQoL unreliable (Landeiro et al. 2020). Second, while this study focused on cognitive and mobility impairments, in practice the symptoms of neurological conditions include other disease-specific measurements of disability including other dimensions such as ocular muscular control, fatigue, tremor, and incontinence (Hoehn and Yahr 1967; Kurtzke 1983; America 2024). Third, neurological conditions primarily affect the HRQoL of patients and their caregivers, yet this study surveys members of the general population. This can cause respondent-perceived HRQoL to deviate for patient-elicited estimates for severe disease. In fact, 55.6 % of cognitive survey respondents rated the HRQoL of severe dementia as 0.0 (mean HRQoL = 0.06), compared to patient estimates which have a mean of 0.38 (Neumann et al. 1999; Landeiro et al. 2020). Fourth, this study relied on a VAS to assess respondent-perceived HRQoL despite the VAS being regarded as less precise than other choice-based valuation techniques (Neumann et al. 1999). VAS sensitivity was evaluated through the use of alternative HRQoL estimates to compute RRA results. Fifth, respondent attrition in the RRA module was higher than previously published surveys estimating relative risk aversion, but this is likely due to the current surveys including additional modules on respondent HRQoL rating and insurance value in addition to relative risk aversion (Mulligan et al. 2024). Sixth, the use of CRRA utility possess some limitations, such as requiring preferences be constant over all HRQoL levels, and emerging evidence suggests general population risk preferences may differ based on baseline HRQoL (Mulligan et al. 2024). Finally, this study relies on stated, rather than revealed, preferences as the surveys asked respondents to make choices over hypothetical options. While contingent valuations have been widely used in healthcare literature, it is unclear whether these studies produce higher or lower estimates relative to revealed preference methods (Carson et al. 1996; Kennedy 2002; Steigenberger et al. 2022). A series of sensitivity analyses were used to ensure respondents did not over or under-estimate their WTP or risk aversion.
5 Conclusions
This study produced neurology-specific estimates of risk preferences and insurance value through two stated preference surveys. Members of the U.S. general population were risk averse over the HRQoL outcomes caused by cognitive and physical impairments that broadly describe the symptoms and progression of neurological conditions. Under the GRACE framework, this would imply that treatments for severe neurological conditions should be valued more highly than under traditional cost-effectiveness analysis which assumes risk neutrality. Moreover, using a stated preference survey approach, this study found that the majority of value for a treatment which delayed disease progression for either cognitive or mobility impairments was attributable to insurance value. In short, incorporating risk preferences into health technology assessment for treatments for neurological conditions is likely to have a material impact on estimated treatment value.
Funding source: Genentech
-
Research funding: This work was supported by Genentech (http://dx.doi.org/10.13039/100004328).
References
America, M. G. F. o. 2024. Clinical Classification of MG, 2024. Myasthenia Gravis Foundation of America. https://media-now.aapmr.org/wp-content/uploads/2021/03/09202604/Myasthenia-Gravis-Table-3.pdf (accessed February 7, 2024).Search in Google Scholar
Arrieta, A., A. García-Prado, P. González, and J. L. Pinto-Prades. 2017. “Risk Attitudes in Medical Decisions for Others: An Experimental Approach.” Health Economics 26 (S3): 97–113, https://doi.org/10.1002/hec.3628.Search in Google Scholar
Attema, A. E., W. B. Brouwer, O. l’Haridon, and J. L. Pinto. 2016. “An Elicitation of Utility for Quality of Life Under Prospect Theory.” Journal of Health Economics 48 (1): 121–34, https://doi.org/10.1016/j.jhealeco.2016.04.002.Search in Google Scholar
Barnett, C., V. Bril, and A. Bayoumi. 2019. “EQ-5D-5L and SF-6D Health Utility Index Scores in Patients with Myasthenia Gravis.” European Journal of Neurology 26 (3): 452–9. https://doi.org/10.1111/ene.13836.Search in Google Scholar
Berg, L. 1984. “Clinical Dementia Rating.” The British Journal of Psychiatry 145 (3): 339. https://doi.org/10.1192/s0007125000118082.Search in Google Scholar
Brockmann, R., J. Nixon, B. L. Love, and I. Yunusa. 2023. “Impacts of FDA Approval and Medicare Restriction on Antiamyloid Therapies for Alzheimer’s Disease: Patient Outcomes, Healthcare Costs, and Drug Development.” Lancet Regional Health Americas 20: 100467, https://doi.org/10.1016/j.lana.2023.100467.Search in Google Scholar
Brooks, C., I. Sangiorgi, C. Hillenbrand, and K. Money. 2018. “Why Are Older Investors Less Willing to Take Financial Risks?” International Review of Financial Analysis 56: 52–72. https://doi.org/10.1016/j.irfa.2017.12.008.Search in Google Scholar
Carson, R. T., N. E. Flores, K. M. Martin, and J. L. Wright. 1996. “Contingent Valuation and Revealed Preference Methodologies: Comparing the Estimates for Quasi-Public Goods.” Land Economics 72 (1): 80–99, https://doi.org/10.2307/3147159.Search in Google Scholar
Cella, D., C. Nowinski, A. Peterman, D. Victorson, D. Miller, J.-S. Lai, et al.. 2011. “The Neurology Quality-Of-Life Measurement Initiative.” Archives of physical medicine and rehabilitation 92 (10): S28–S36. https://doi.org/10.1016/j.apmr.2011.01.025.Search in Google Scholar
Dong, J., Y. Cui, S. Li, and W. Le. 2016. “Current Pharmaceutical Treatments and Alternative Therapies of Parkinson’s Disease.” Current Neuropharmacology 14 (4): 339–55. https://doi.org/10.2174/1570159x14666151120123025.Search in Google Scholar
Dresser, L., R. Wlodarski, K. Rezania, and B. Soliven. 2021. “Myasthenia Gravis: Epidemiology, Pathophysiology and Clinical Manifestations.” Journal of Clinical Medicine 10 (11): 2235. https://doi.org/10.3390/jcm10112235.Search in Google Scholar
Ekman, M., J. Berg, A. Wimo, L. Jönsson, and C. McBurney. 2007. “Health Utilities in Mild Cognitive Impairment and Dementia: A Population Study in Sweden.” International Journal of Geriatric Psychiatry: A Journal of the Psychiatry of Late Life and Allied Sciences 22 (7): 649–55. https://doi.org/10.1002/gps.1725.Search in Google Scholar
Emre, M. 2003. “Dementia Associated with Parkinson’s Disease.” The Lancet Neurology 2 (4): 229–37. https://doi.org/10.1016/s1474-4422(03)00351-x.Search in Google Scholar
Esposito, L., and N. Hassoun. 2017. “Measuring Health Burden Without Discriminating Against the Disabled.” Journal of Public Health 39 (3): 633–9. https://doi.org/10.1093/pubmed/fdw072.Search in Google Scholar
FDA. 2023. FDA Converts Novel Alzheimer’s Disesae Treatment to Traditional Approval. https://www.fda.gov/news-events/press-announcements/fda-converts-novel-alzheimers-disease-treatment-traditional-approval.Search in Google Scholar
Fehr-Duda, H., M. De Gennaro, and R. Schubert. 2006. “Gender, Financial Risk, and Probability Weights.” Theory and Decision 60 (2): 283–313, https://doi.org/10.1007/s11238-005-4590-0.Search in Google Scholar
Feigin, V. L., T. Vos, F. Alahdab, A. M. L. Amit, T. W. Bärnighausen, E. Beghi, et al.. 2021. “Burden of Neurological Disorders Across the US from 1990-2017: A Global Burden of Disease Study.” JAMA Neurology 78 (2): 165–76. https://doi.org/10.1001/jamaneurol.2020.4152.Search in Google Scholar
Galizzi, M. M., M. Miraldo, C. Stavropoulou, and M. Van Der Pol. 2016. “Doctor–patient Differences in Risk and Time Preferences: A Field Experiment.” Journal of Health Economics 50 (1): 171–82, https://doi.org/10.1016/j.jhealeco.2016.10.001.Search in Google Scholar
Gracely, R. H., L. Lota, D. Walter, and R. Dubner. 1988. “A Multiple Random Staircase Method of Psychophysical Pain Assessment.” Pain 32 (1): 55–63. https://doi.org/10.1016/0304-3959(88)90023-1.Search in Google Scholar
Guiso, L., P. Sapienza, and L. Zingales. 2018. “Time Varying Risk Aversion.” Journal of Financial Economics 128 (3): 403–21. https://doi.org/10.1016/j.jfineco.2018.02.007.Search in Google Scholar
Gyrd-Hansen, D. 2005. “Willingness to Pay for a QALY: Theoretical and Methodological Issues.” Pharmaco Economics 23 (5): 423–32, https://doi.org/10.2165/00019053-200523050-00002.Search in Google Scholar
Hawton, A., and C. Green. 2016. “Health Utilities for Multiple Sclerosis.” Value in Health 19 (4): 460–8. https://doi.org/10.1016/j.jval.2016.01.002.Search in Google Scholar
Hayes, M., and D. Patterson. 1921. “Experimental Development of the Graphic Scale.” Psychology Bullettin 18 (2): 98–9.Search in Google Scholar
Hoehn, M. M., and M. D. Yahr. 1967. “Parkinsonism: Onset, Progression, and Mortality.” Neurology 17 (5): 427. https://doi.org/10.1212/wnl.17.5.427.Search in Google Scholar
Holt, C. A., and S. K. Laury. 2002. “Risk Aversion and Incentive Effects.” The American Economic Review 92 (5): 1644–55. https://doi.org/10.1257/000282802762024700.Search in Google Scholar
Institute for Clinical and Economic Review. 2020. 2020–2023 Value Assessment Framework. Institute for Clinical and Economic Review. https://icer.org/wp-content/uploads/2020/10/ICER_2020_2023_VAF_102220.pdf.Search in Google Scholar
Institute for Clinical and Economic Review. 2023. Value Assessment Framework. Institute for Clinical and Economic Review. https://icer.org/our-approach/methods-process/value-assessment-framework/.Search in Google Scholar
Joe, E., and J. M. Ringman. 2019. “Cognitive Symptoms of Alzheimer’s Disease: Clinical Management and Prevention.” BMJ 367. https://doi.org/10.1136/bmj.l6217.Search in Google Scholar
Kennedy, C. A. 2002. “Revealed Preference Valuation Compared to Contingent Valuation: Radon-Induced Lung Cancer Prevention.” Health Economics 11 (7): 585–98. https://doi.org/10.1002/hec.724.Search in Google Scholar
Kurtzke, J. F. 1983. “Rating Neurologic Impairment in Multiple Sclerosis: An Expanded Disability Status Scale (EDSS).” Neurology 33 (11): 1444. https://doi.org/10.1212/wnl.33.11.1444.Search in Google Scholar
Lakdawalla, D. N., J. A. Doshi, L. P. GarrisonJr, C. E. Phelps, A. Basu, and P. M. Danzon. 2018. “Defining Elements of Value in Health Care–A Health Economics Approach: An ISPOR Special Task Force Report [3].” Value in Health 21 (2): 131–9. https://doi.org/10.1016/j.jval.2017.12.007.Search in Google Scholar
Lakdawalla, D., A. Malani, and J. Reif. 2017. “The Insurance Value of Medical Innovation.” Journal of Public Economics 145 (1): 94–102, https://doi.org/10.1016/j.jpubeco.2016.11.012.Search in Google Scholar
Lakdawalla, D. N., and C. E. Phelps. 2021. “Health Technology Assessment with Diminishing Returns to Health: The Generalized Risk-Adjusted Cost-Effectiveness (GRACE) Approach.” Value in Health 24 (2): 244–9. https://doi.org/10.1016/j.jval.2020.10.003.Search in Google Scholar
Lakdawalla, D. N., and C. E. Phelps. 2022. “A Guide to Extending and Implementing Generalized Risk-Adjusted Cost-Effectiveness (GRACE).” The European Journal of Health Economics 23 (3): 433–51. https://doi.org/10.1007/s10198-021-01367-0.Search in Google Scholar
Lakdawalla, D. N., and C. E. Phelps. 2023. “The Generalized Risk-Adjusted Cost-Effectiveness (GRACE) Model for Measuring the Value of Gains in Health: An Exact Formulation.” Journal of Benefit-Cost Analysis 14 (1): 44–67. https://doi.org/10.1017/bca.2023.6.Search in Google Scholar
Lakdawalla, Darius, Charles, E. Phelps, Stella, Arndorfer, Devin, Incerti, and Neal, Masia. 2023. Getting the Math Right when Measuring the Value of New Medicines. White Paper. No Patient Left Behind. https://www.nopatientleftbehind.org/resource-materials/4wrddq4u40fbg0gvodo7lpynk207a4.Search in Google Scholar
Landeiro, F., S. Mughal, K. Walsh, E. Nye, J. Morton, and H. Williams, et al.. 2020. “Health-related Quality of Life in People with Predementia Alzheimer’s Disease, Mild Cognitive Impairment or Dementia Measured with Preference-Based Instruments: A Systematic Literature Review.” Alzheimer’s Research & Therapy 12 (154): 1–14, https://doi.org/10.1186/s13195-020-00723-1.Search in Google Scholar
Liang, C.-S., D.-J. Li, F.-C. Yang, P.-T. Tseng, A. F. Carvalho, B. Stubbs, et al.. 2021. “Mortality Rates in Alzheimer’s Disease and Non-alzheimer’s Dementias: A Systematic Review and Meta-Analysis.” The Lancet Healthy Longevity 2 (8): e479–e488. https://doi.org/10.1016/s2666-7568(21)00140-9.Search in Google Scholar
Liu, Y., J. J. Shim, D. Lakdawalla, J. Sussell, and A. Chung. 2016. “Reconsidering the Economic Value of Multiple Sclerosis Therapies.” American Journal of Managed Care 22 (11): e368–e374.Search in Google Scholar
Marta Gwinn, M. 2013. “Genetics, Coffee Consumption, and Parkinson’s Disease.” Genomics & Precision Health, https://www.cdc.gov/genomics/hugenet/casestudy/parkinson/parkcoffee_view.htm#:∼:text=Parkinson’s%20disease%20(PD)%20is%20the,is%20common%20at%20later%20stages (accessed January 7, 2024).Search in Google Scholar
Montalban, X., S. L. Hauser, L. Kappos, D. L. Arnold, A. Bar-Or, G. Comi, et al.. 2017. “Ocrelizumab Versus Placebo in Primary Progressive Multiple Sclerosis.” New England Journal of Medicine 376 (3): 209–20. https://doi.org/10.1056/nejmoa1606468.Search in Google Scholar
Mulligan, K., D. Baid, J. N. Doctor, C. E. Phelps, and D. N. Lakdawalla. 2024. “Risk Preferences over Health: Empirical Estimates and Implications for Medical Decision-Making.” Journal of Health Economics 94 (1): 102857, https://doi.org/10.1016/j.jhealeco.2024.102857.Search in Google Scholar
Neumann, P. J., K. M. Kuntz, J. Leon, S. S. Araki, R. C. Hermann, M.-A. Hsu, et al.. 1999. “Health Utilities in Alzheimer’s Disease: A Cross-Sectional Study of Patients and Caregivers.” Medical care 37 (1): 27–32. https://doi.org/10.1097/00005650-199901000-00005.Search in Google Scholar
Neurosciences, W. I. f. 2024. “Parkinson’s Disease Dementia.” https://memory.ucsf.edu/dementia/parkinsons/parkinson-disease-dementia (accessed January 7, 2024).Search in Google Scholar
Nielsen, J. S., D. Gyrd-Hansen, and T. Kjær. 2021. “Sample Restrictions and the Elicitation of a Constant Willingness to Pay Per Quality Adjusted Life Year.” Health Economics 30 (5): 923–31. https://doi.org/10.1002/hec.4236.Search in Google Scholar
Ningrum, D. N. A., and W.-M. Kung. 2023. “Challenges and Perspectives of Neurological Disorders.” Brain Sciences 13 (4): 676. https://doi.org/10.3390/brainsci13040676.Search in Google Scholar
Oddershede, L., J. J. Andreasen, and L. Ehlers. 2014. “Estimation of Utility Values from Visual Analog Scale Measures of Health in Patients Undergoing Cardiac Surgery.” ClinicoEconomics and Outcomes Research (6): 21–7. https://doi.org/10.2147/ceor.s55899.Search in Google Scholar
Ou, Z., J. Pan, Z. Wang, D. Duan, D. Yu, and H. Nong. 2021. “Global Trends in the Incidence, Prevalence, and Years Lived with Disability of Parkinson’s Disease in 204 Countries/Territories from 1990 to 2019.” Frontiers in Public Health 9 (1): 776847, https://doi.org/10.3389/fpubh.2021.776847.Search in Google Scholar
Parkin, D., and N. Devlin. 2006. “Is There a Case for Using Visual Analogue Scale Valuations in Cost-Utility Analysis?” Health Economics 15 (7): 653–64. https://doi.org/10.1002/hec.1086.Search in Google Scholar
Perez, L., J. Huang, L. Jansky, C. Nowinski, D. Victorson, A. Peterman, et al.. 2007. “Using Focus Groups to Inform the Neuro-QOL Measurement Tool: Exploring Patient-Centered, Health-Related Quality of Life Concepts across Neurological Conditions.” Journal of Neuroscience Nursing 39 (6): 342–53. https://doi.org/10.1097/01376517-200712000-00005.Search in Google Scholar
Prados, M. J., Y. Liu, H. Jun, J. Lam, and S. Mattke. 2022. “Projecting the Long-Term Societal Value of a Disease-Modifying Treatment for Alzheimer’s Disease in the United States.” Alzheimer’s & Dementia 18 (1): 142–51. https://doi.org/10.1002/alz.12578.Search in Google Scholar
Sago. 2024. Adaptive Solutions, Confident Solutions. https://sago.com/en/ (accessed January 7, 2024).Search in Google Scholar
Sanders, G. D., P. J. Neumann, A. Basu, D. W. Brock, D. Feeny, M. Krahn, et al.. 2016. “Recommendations for Conduct, Methodological Practices, and Reporting of Cost-Effectiveness Analyses: Second Panel on Cost-Effectiveness in Health and Medicine.” JAMA 316 (10): 1093–103. https://doi.org/10.1001/jama.2016.12195.Search in Google Scholar
Satizabal, C. L., A. S. Beiser, V. Chouraki, G. Chêne, C. Dufouil, and S. Seshadri. 2016. “Incidence of Dementia over Three Decades in the Framingham Heart Study.” New England Journal of Medicine 374 (6): 523–32. https://doi.org/10.1056/nejmoa1504327.Search in Google Scholar
Service, U. N. H. 2023. Parkinson’s Disease. https://www.nhs.uk/conditions/parkinsons-disease/causes (accessed February 7, 2024).Search in Google Scholar
Shafrin, J., J. Kim, J. T. Cohen, L. P. Garrison, D. A. Goldman, J. A. Doshi, et al.. 2024. “Valuing the Societal Impact of Medicines and Other Health Technologies: A User Guide to Current Best Practices.” In Forum for Health Economics and Policy. De Gruyter.10.1515/fhep-2024-0014Search in Google Scholar
Shafrin, J., S. G. May, L. M. Zhao, K. Bognar, Y. Yuan, J. R. Penrod, et al.. 2021. “Measuring the Value Healthy Individuals Place on Generous Insurance Coverage of Severe Diseases: A Stated Preference Survey of Adults Diagnosed with and without Lung Cancer.” Value in Health 24 (6): 855–61. https://doi.org/10.1016/j.jval.2020.06.021.Search in Google Scholar
Shafrin, J., S. Thahir, A. Klimchak, I. F. Audhya, L. Sedita, and J. Romley. 2023. “P1 Quantifying the Insurance and Altruism Value for Rare Diseases: A Case Study for Duchenne Muscular Dystrophy.” Value in Health 26 (6): S1. https://doi.org/10.1016/j.jval.2023.03.014.Search in Google Scholar
Sharma, K., F. Bittner, and J. Kamholz. 2018. “Epidemiology of Multiple Sclerosis in the United States (P1. 140).” Neurology 90 (15_supplement): P1. 140. https://doi.org/10.1212/wnl.90.15_supplement.p1.140.Search in Google Scholar
Steigenberger, C., M. Flatscher-Thoeni, U. Siebert, and A. M. Leiter. 2022. “Determinants of Willingness to Pay for Health Services: A Systematic Review of Contingent Valuation Studies.” The European Journal of Health Economics 23 (9): 1455–82. https://doi.org/10.1007/s10198-022-01437-x.Search in Google Scholar
Stephen, C. D., V. Fung, C. I. Lungu, and A. J. Espay. 2021. “Assessment of Emergency Department and Inpatient Use and Costs in Adult and Pediatric Functional Neurological Disorders.” JAMA Neurology 78 (1): 88–101. https://doi.org/10.1001/jamaneurol.2020.3753.Search in Google Scholar
Stroke, N. I. O. N. D. A. 2024. “All Disorders.” https://www.ninds.nih.gov/health-information/disorders.Search in Google Scholar
Thakur, K. T., E. Albanese, P. Giannakopoulos, N. Jette, M. Linde, M. J. Prince, et al.. 2016. “Neurological Disorders.” Disease Control Priorities 4: 87–107. https://doi.org/10.1596/978-1-4648-0426-7_ch5.Search in Google Scholar
Tversky, A., and D. Kahneman. 1992. “Advances in Prospect Theory: Cumulative Representation of Uncertainty.” Journal of Risk and Uncertainty 5 (4): 297–323, https://doi.org/10.1007/bf00122574.Search in Google Scholar
Van Dyck, C. H., C. J. Swanson, P. Aisen, R. J. Bateman, C. Chen, M. Gee, et al.. 2023. “Lecanemab in Early Alzheimer’s Disease.” New England Journal of Medicine 388 (1): 9–21. https://doi.org/10.1056/nejmoa2212948.Search in Google Scholar
Supplementary Material
This article contains supplementary material (https://doi.org/10.1515/fhep-2024-0038).
© 2025 the author(s), published by De Gruyter, Berlin/Boston
This work is licensed under the Creative Commons Attribution 4.0 International License.