The Impact of Biopharmaceutical Innovation on Disability, Social Security Recipiency, and Use of Medical Care of U.S. Community Residents, 1998–2015
-
Frank R. Lichtenberg


Abstract
This study seeks to analyze the overall impact that biopharmaceutical innovation had on disability, Social Security recipiency, and the use of medical services of U.S. community residents during the period 1998–2015. We test the hypothesis that the probability of disability, Social Security recipiency, and medical care utilization associated with a medical condition is inversely related to the number of drug classes previously approved for that condition. We use data from the 1998–2015 waves of the Medical Expenditure Panel Survey and other sources to estimate probit models of an individual’s probability of disability, Social Security recipiency, and medical care utilization. The effect of biopharmaceutical innovation is identified by differences across over 200 medical conditions in the growth in the lagged number of drug classes ever approved. 18 years of previous biopharmaceutical innovation is estimated to have reduced: the number of people who were completely unable to work at a job, do housework, or go to school in 2015 by 4.5%; the number of people with cognitive limitations by 3.2%; the number of people receiving SSI in 2015 by 247 thousand (3.1%); and the number of people receiving Social Security by 984 thousand (2.0%). Previous innovation is also estimated to have caused reductions in home health visits (9.2%), inpatient events (5.7%), missed school days (5.1%), and outpatient events (4.1%). The estimated value in 2015 of some of the reductions in disability, Social Security recipiency, and use of medical care attributable to previous biopharmaceutical innovation ($115 billion) is fairly close to 2015 expenditure on drug classes that were first approved by the FDA during 1989–2006 ($127 billion). However, for a number of reasons, the costs are likely to be lower, and the benefits are likely to be larger, than these figures.
Funding source: U.S. Social Security Administration
Award Identifier / Grant number: NB21-02
Acknowledgment
This research was supported by the Social Security Administration as a project (NB21-02) of the Research and Disability Research Center of the National Bureau of Economic Research.
Appendix A
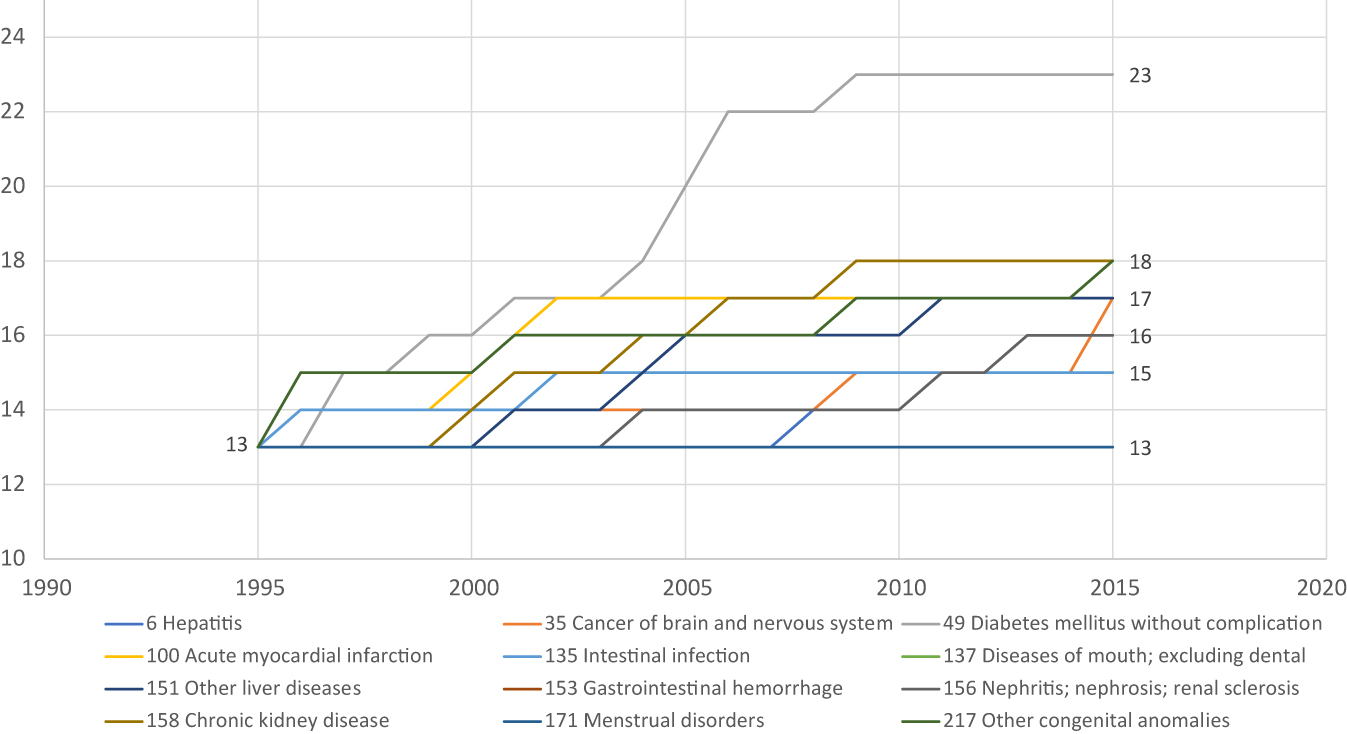
Number of WHO ATC4 chemical subgroups ever FDA-approved for 12 diseases, 1995–2015.Source: Author’s calculations based on data in DrugCentral 2021 online drug compendiumand Thériaquedatabase.
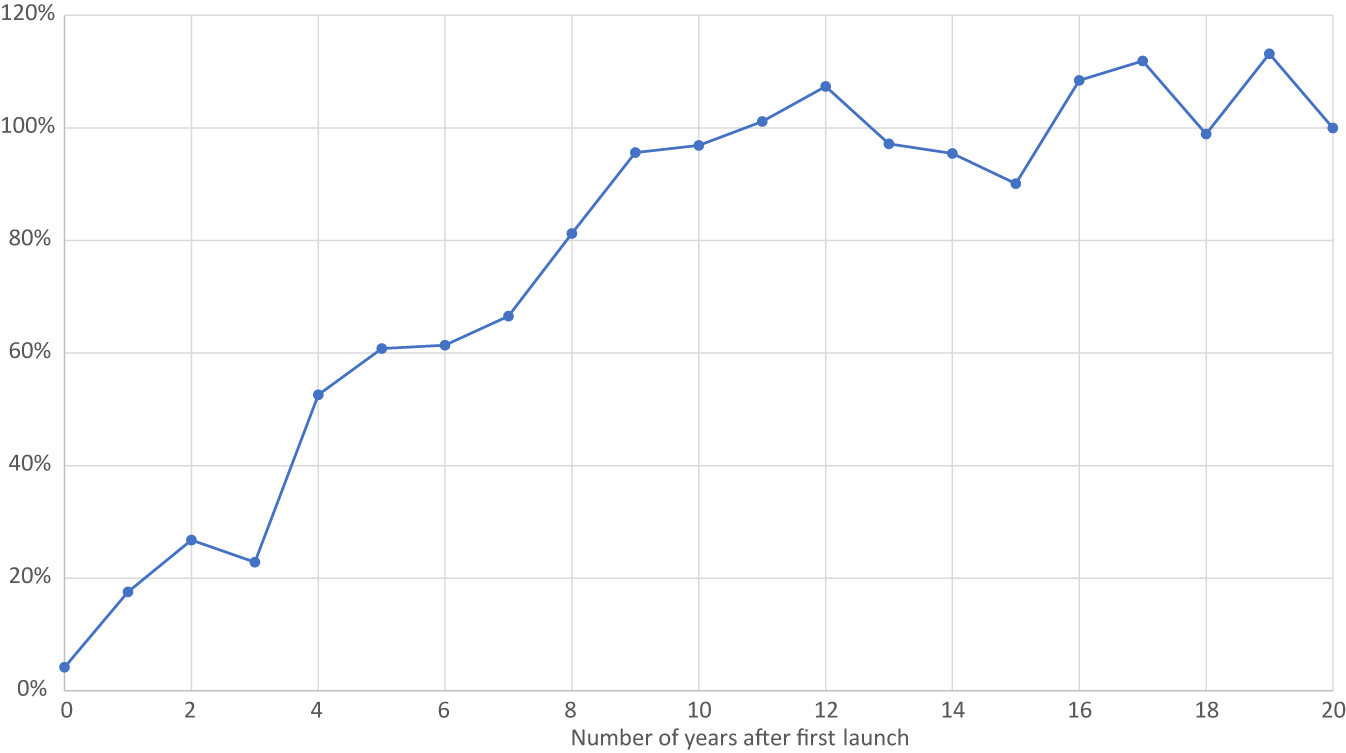
Mean utilization of a drug class N years after first launch, relative to utilization of the drug class 20 years after first launch.
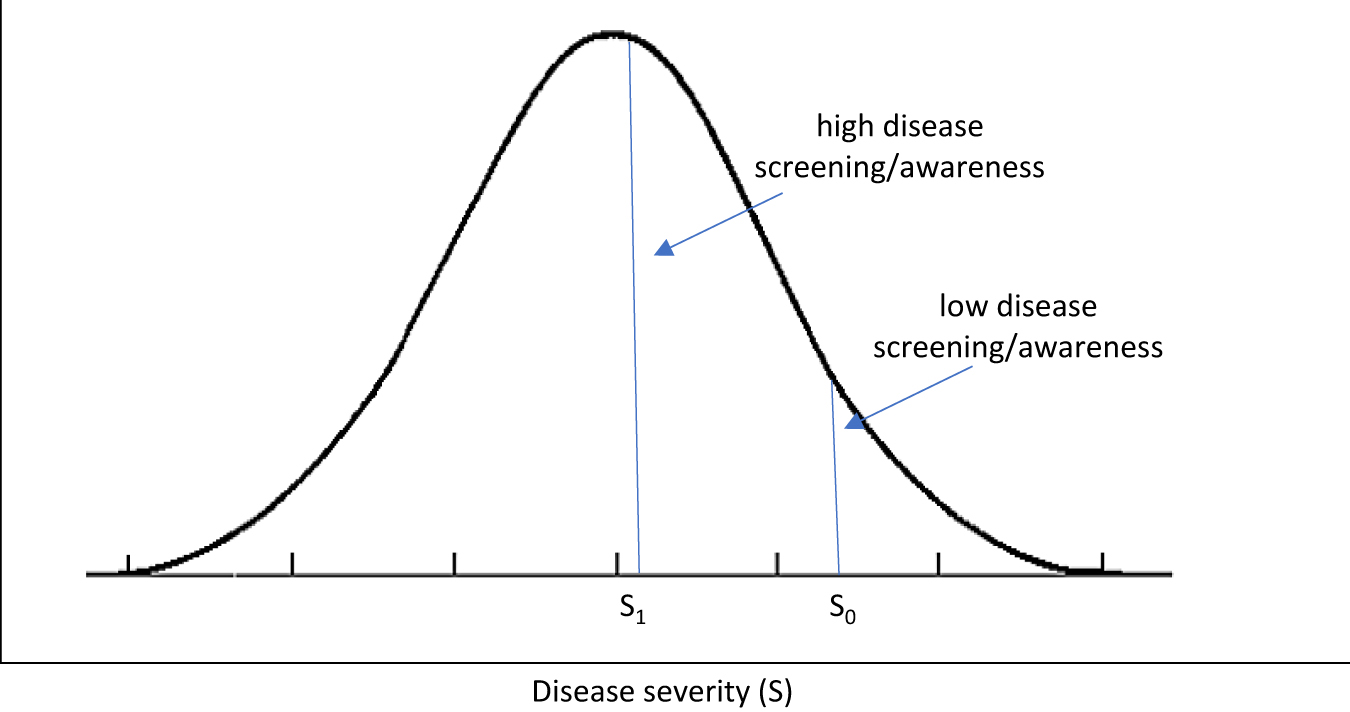
Effect of disease screening/awareness on measured prevalence and mean severity.
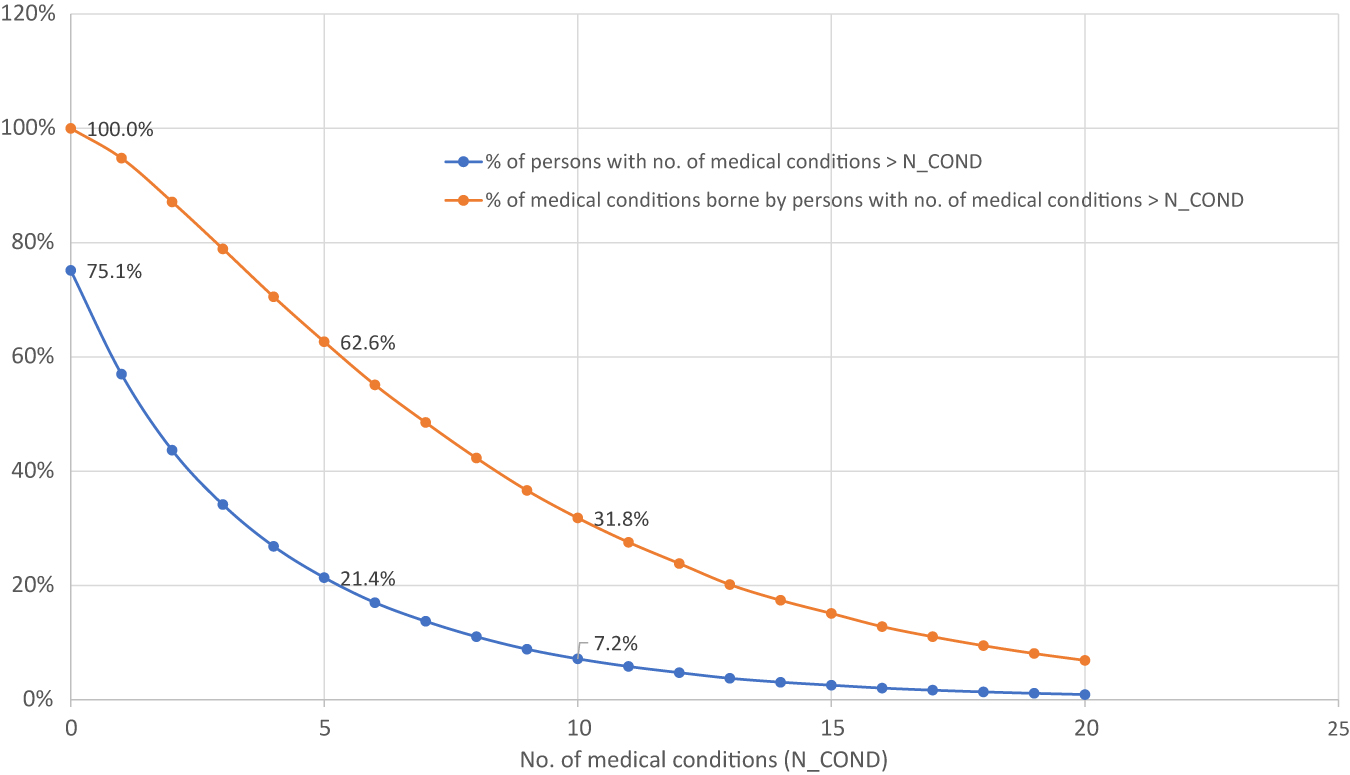
Distributions of persons and medical conditions by number of medical conditions borne by person, 2015.
Comparison of features of present study of disability in the U.S. to features of previous study of disability in 11 European countries.
| Previous studya | Present study | |
|---|---|---|
| 2-way fixed effects design | Medical condition and country in a single year (2015) | Medical condition and year in a single country (USA) |
| Year(s) | 2015 | 1998–2015 |
| Countries | 11 European countries | USA |
| Micro vs. aggregate data | Aggregate | Micro |
| Ages | 50 and over | All ages |
| Mean age | 67.8 | 35.2 |
| Number of persons | 45,592 | 375,828 |
| Number of conditions | 31 | 216 |
| Number of person-conditions | 62,424 | 1,654,906 |
| Pharmaceutical innovation measure | No. of drugs | No. of drug classes |
| Person-level disability measures | Yes | Yes |
| Allow effect of innovation to depend on no. of conditions? | No | Yes |
| Condition-specific disability measures | No | Yes |
| Condition-specific healthcare utilization measures | No | Yes |
-
aLichtenberg FR (2019). The impact of access to prescription drugs on disability in 11 European countries. Disability and Health Journal 12(3): 375–386 (July). https://www.sciencedirect.com/science/article/pii/S1936657419300032.
20 most prevalent ICD-9-CM codes, 2015.
| ICD-9-CM | LABEL | UNWEIGHTED | WEIGHTED |
|---|---|---|---|
| ALL medical conditions | 123,227 | 1,304,448,051 | |
| 401 | ESSENTIAL HYPERTENSION* | 6998 | 70,782,716 |
| 272 | DIS OF LIPOID METABOLISM* | 5264 | 56,623,122 |
| 719 | JOINT DISORDER NEC & NOS* | 4607 | 47,528,038 |
| 780 | GENERAL SYMPTOMS* | 4259 | 42,813,122 |
| 460 | ACUTE NASOPHARYNGITIS | 3573 | 34,823,002 |
| 300 | NEUROTIC DISORDERS* | 2683 | 31,451,613 |
| 724 | BACK DISORDER NEC & NOS* | 2576 | 27,934,066 |
| 311 | DEPRESSIVE DISORDER NEC | 2568 | 27,251,249 |
| 250 | DIABETES MELLITUS* | 3035 | 27,198,700 |
| 477 | ALLERGIC RHINITIS* | 2504 | 24,648,523 |
| 493 | ASTHMA* | 2422 | 22,238,337 |
| 716 | ARTHROPATHIES NEC/NOS* | 1975 | 20,464,658 |
| 729 | OTHER SOFT TISSUE DIS* | 1711 | 16,433,772 |
| 786 | RESP SYS/OTH CHEST SYMP* | 1820 | 16,347,247 |
| 959 | INJURY NEC/NOS* | 1611 | 16,345,147 |
| 473 | CHRONIC SINUSITIS* | 1227 | 15,950,107 |
| 715 | OSTEOARTHROSIS ET AL* | 1349 | 15,887,094 |
| V68 | ADMINISTRATIVE ENCOUNTER* | 1320 | 14,425,007 |
| 782 | SKIN/OTH INTEGUMENT SYMP* | 1301 | 13,523,776 |
| 414 | OTH CHR ISCHEMIC HRT DIS* | 1046 | 11,513,206 |
-
https://www.meps.ahrq.gov/data_stats/download_data/pufs/h180/h180app2.html. NOTE: ‘*’ indicates collapsing of fully specified codes to 3-digit code categories.
Estimates of β mid,k and β high,k (from eq. (3)) from models of 10 person-level disability and Social Security recipiency measures.
| Row | lag (k) | β mid,k | β high,k | ||||||
|---|---|---|---|---|---|---|---|---|---|
| Coef. | Std. Err. | z | P > |z| | Coef. | Std. Err. | z | P > |z| | ||
|
|
A. Has any limitation |
||||||||
| 1 | 0 | −0.072 | 0.096 | −0.75 | 0.46 | −0.076 | 0.096 | −0.79 | 0.43 |
| 2 | 3 | −0.073 | 0.076 | −0.97 | 0.33 | −0.077 | 0.076 | −1.01 | 0.31 |
| 3 | 6 | −0.089 | 0.044 | −2.03 | 0.04 | −0.092 | 0.044 | −2.11 | 0.04 |
| 4 | 9 | −0.079 | 0.037 | −2.14 | 0.03 | −0.082 | 0.036 | −2.27 | 0.02 |
| 5 | 12 | −0.047 | 0.039 | −1.21 | 0.23 | −0.051 | 0.039 | −1.32 | 0.19 |
| 6 | 15 | 0.000 | 0.040 | 0.01 | 1.00 | −0.004 | 0.040 | −0.11 | 0.92 |
|
|
|||||||||
|
|
B. Has any limitation work/housework/school |
||||||||
| 7 | 0 | −0.102 | 0.102 | −1.00 | 0.32 | −0.060 | 0.100 | −0.60 | 0.55 |
| 8 | 3 | −0.127 | 0.066 | −1.93 | 0.05 | −0.085 | 0.064 | −1.32 | 0.19 |
| 9 | 6 | −0.094 | 0.041 | −2.30 | 0.02 | −0.051 | 0.040 | −1.29 | 0.20 |
| 10 | 9 | −0.074 | 0.031 | −2.40 | 0.02 | −0.031 | 0.030 | −1.03 | 0.30 |
| 11 | 12 | −0.044 | 0.035 | −1.26 | 0.21 | −0.001 | 0.035 | −0.04 | 0.97 |
| 12 | 15 | −0.008 | 0.037 | −0.22 | 0.83 | 0.034 | 0.037 | 0.93 | 0.35 |
|
|
|||||||||
|
|
C. Has limitation in physical functioning |
||||||||
| 13 | 0 | −0.092 | 0.096 | −0.96 | 0.34 | −0.064 | 0.095 | −0.68 | 0.50 |
| 14 | 3 | −0.093 | 0.062 | −1.49 | 0.14 | −0.064 | 0.061 | −1.05 | 0.29 |
| 15 | 6 | −0.089 | 0.033 | −2.70 | 0.01 | −0.060 | 0.033 | −1.84 | 0.07 |
| 16 | 9 | −0.052 | 0.025 | −2.04 | 0.04 | −0.024 | 0.025 | −0.93 | 0.35 |
| 17 | 12 | −0.033 | 0.029 | −1.14 | 0.26 | −0.005 | 0.029 | −0.19 | 0.85 |
| 18 | 15 | 0.008 | 0.035 | 0.22 | 0.83 | 0.035 | 0.035 | 1.01 | 0.31 |
|
|
|||||||||
|
|
D. Has cognitive limitations |
||||||||
| 19 | 0 | −0.125 | 0.099 | −1.26 | 0.21 | −0.089 | 0.098 | −0.91 | 0.36 |
| 20 | 3 | −0.127 | 0.063 | −2.02 | 0.04 | −0.090 | 0.061 | −1.48 | 0.14 |
| 21 | 6 | −0.113 | 0.041 | −2.73 | 0.01 | −0.076 | 0.040 | −1.88 | 0.06 |
| 22 | 9 | −0.096 | 0.035 | −2.71 | 0.01 | −0.058 | 0.035 | −1.67 | 0.09 |
| 23 | 12 | −0.070 | 0.038 | −1.85 | 0.07 | −0.033 | 0.037 | −0.88 | 0.38 |
| 24 | 15 | −0.044 | 0.032 | −1.37 | 0.17 | −0.006 | 0.031 | −0.20 | 0.84 |
|
|
|||||||||
|
|
E. In fair or poor health |
||||||||
| 25 | 0 | −0.127 | 0.105 | −1.21 | 0.23 | −0.107 | 0.103 | −1.04 | 0.30 |
| 26 | 3 | −0.135 | 0.065 | −2.07 | 0.04 | −0.115 | 0.063 | −1.83 | 0.07 |
| 27 | 6 | −0.104 | 0.053 | −1.95 | 0.05 | −0.084 | 0.052 | −1.61 | 0.11 |
| 28 | 9 | −0.080 | 0.052 | −1.55 | 0.12 | −0.061 | 0.051 | −1.19 | 0.24 |
| 29 | 12 | −0.044 | 0.052 | −0.84 | 0.40 | −0.024 | 0.051 | −0.47 | 0.64 |
| 30 | 15 | −0.034 | 0.039 | −0.87 | 0.39 | −0.015 | 0.039 | −0.37 | 0.71 |
|
|
|||||||||
|
|
F. Unable to work |
||||||||
| 31 | 0 | −0.113 | 0.125 | −0.90 | 0.37 | −0.052 | 0.123 | −0.42 | 0.67 |
| 32 | 3 | −0.158 | 0.079 | −2.00 | 0.05 | −0.096 | 0.077 | −1.25 | 0.21 |
| 33 | 6 | −0.133 | 0.041 | −3.28 | 0.00 | −0.071 | 0.040 | −1.79 | 0.07 |
| 34 | 9 | −0.118 | 0.035 | −3.36 | 0.00 | −0.056 | 0.035 | −1.61 | 0.11 |
| 35 | 12 | −0.071 | 0.039 | −1.83 | 0.07 | −0.009 | 0.038 | −0.24 | 0.81 |
| 36 | 15 | −0.025 | 0.041 | −0.61 | 0.54 | 0.037 | 0.040 | 0.93 | 0.35 |
|
|
|||||||||
|
|
G. Completely unable to do activity |
||||||||
| 37 | 0 | −0.155 | 0.103 | −1.51 | 0.13 | −0.110 | 0.101 | −1.09 | 0.27 |
| 38 | 3 | −0.178 | 0.055 | −3.24 | 0.00 | −0.133 | 0.053 | −2.49 | 0.01 |
| 39 | 6 | −0.114 | 0.040 | −2.85 | 0.00 | −0.069 | 0.040 | −1.75 | 0.08 |
| 40 | 9 | −0.092 | 0.033 | −2.79 | 0.01 | −0.046 | 0.032 | −1.43 | 0.15 |
| 41 | 12 | −0.059 | 0.035 | −1.65 | 0.10 | −0.013 | 0.035 | −0.38 | 0.71 |
| 42 | 15 | −0.027 | 0.036 | −0.75 | 0.45 | 0.018 | 0.036 | 0.51 | 0.61 |
|
|
|||||||||
|
|
H. Receives SSI |
||||||||
| 43 | 0 | −0.063 | 0.075 | −0.84 | 0.40 | −0.032 | 0.073 | −0.43 | 0.67 |
| 44 | 3 | −0.061 | 0.052 | −1.17 | 0.24 | −0.030 | 0.051 | −0.59 | 0.56 |
| 45 | 6 | −0.076 | 0.039 | −1.95 | 0.05 | −0.044 | 0.039 | −1.15 | 0.25 |
| 46 | 9 | −0.074 | 0.031 | −2.40 | 0.02 | −0.042 | 0.030 | −1.40 | 0.16 |
| 47 | 12 | −0.011 | 0.036 | −0.30 | 0.77 | 0.021 | 0.036 | 0.59 | 0.56 |
| 48 | 15 | 0.002 | 0.037 | 0.06 | 0.95 | 0.034 | 0.037 | 0.92 | 0.36 |
|
|
|||||||||
|
|
I. Receives Social Security |
||||||||
| 49 | 0 | −0.025 | 0.063 | −0.40 | 0.69 | −0.006 | 0.061 | −0.09 | 0.93 |
| 50 | 3 | −0.045 | 0.046 | −0.98 | 0.33 | −0.025 | 0.044 | −0.56 | 0.58 |
| 51 | 6 | −0.080 | 0.026 | −3.06 | 0.00 | −0.060 | 0.026 | −2.35 | 0.02 |
| 52 | 9 | −0.062 | 0.022 | −2.74 | 0.01 | −0.041 | 0.022 | −1.85 | 0.06 |
| 53 | 12 | −0.057 | 0.020 | −2.91 | 0.00 | −0.037 | 0.020 | −1.89 | 0.06 |
| 54 | 15 | −0.022 | 0.021 | −1.03 | 0.30 | −0.001 | 0.021 | −0.07 | 0.94 |
|
|
|||||||||
|
|
J. Is retired |
||||||||
| 55 | 0 | 0.072 | 0.030 | 2.41 | 0.02 | 0.073 | 0.030 | 2.45 | 0.01 |
| 56 | 3 | 0.087 | 0.030 | 2.90 | 0.00 | 0.088 | 0.030 | 2.95 | 0.00 |
| 57 | 6 | 0.018 | 0.025 | 0.73 | 0.46 | 0.019 | 0.025 | 0.76 | 0.45 |
| 58 | 9 | 0.006 | 0.022 | 0.25 | 0.80 | 0.006 | 0.022 | 0.27 | 0.78 |
| 59 | 12 | 0.001 | 0.020 | 0.05 | 0.96 | 0.002 | 0.020 | 0.08 | 0.94 |
| 60 | 15 | 0.003 | 0.022 | 0.13 | 0.90 | 0.003 | 0.022 | 0.15 | 0.88 |
Estimates of the reduction in disability, Social Security recipiency, and medical care utilization in 2015 attributable to previous pharmaceutical innovation.
| Row | Person-level measure | lag (k) | β k | ∆mean[ln (CUM_CLASS k )] | Ŷ actual,2015 | Ŷ no_innov,2015 | (Ŷ no_innov,2015/Ŷ actual,2015) − 1 | Actual prevalence (no. of people) in 2015 | Reduction in 2015 prevalence due to previous innovation | ||
|---|---|---|---|---|---|---|---|---|---|---|---|
| Coef. | z | P > |z| | |||||||||
| 1 | A. Has any limitation | 9 | −0.101 | −2.89 | 0.00 | 0.188 | 46.1% | 46.9% | 1.6% | 66,518,606 | 1,087,194 |
| 2 | B. Has any limitation work/housework/school | 9 | −0.088 | −3.21 | 0.00 | 0.188 | 23.9% | 24.4% | 2.2% | 26,114,266 | 565,599 |
| 3 | C. Has limitation in physical functioning | 6 | −0.108 | −3.48 | 0.00 | 0.182 | 29.6% | 30.3% | 2.3% | 35,065,504 | 807,263 |
| 4 | D. Has cognitive limitations | 9 | −0.103 | −3.23 | 0.00 | 0.188 | 13.1% | 13.5% | 3.2% | 14,286,436 | 453,913 |
| 5 | E. In fair or poor health | 3 | −0.158 | −2.66 | 0.01 | 0.149 | 27.9% | 28.7% | 2.9% | 35,023,619 | 1,003,716 |
| 6 | F. Unable to work | 9 | −0.127 | −4.06 | 0.00 | 0.188 | 13.1% | 13.6% | 3.9% | 13,069,508 | 512,337 |
| 7 | G. Completely unable to work at a job, do housework, or go to school | 3 | −0.193 | −4.13 | 0.00 | 0.149 | 15.8% | 16.5% | 4.5% | 16,066,307 | 717,536 |
| 8 | H. Receives SSI | 9 | −0.087 | −3.15 | 0.00 | 0.188 | 7.5% | 7.8% | 3.1% | 7,962,496 | 247,239 |
| 9 | I. Receives Social Security | 12 | −0.070 | −3.73 | 0.00 | 0.244 | 30.8% | 31.4% | 2.0% | 50,188,176 | 984,418 |
| 10 | J. Is retired | 3 | 0.080 | 2.74 | 0.01 | 0.149 | 16.2% | 15.9% | −1.8% | 29,061,321 | −523,648 |
| Condition-specific measure | Actual prevalence (no. of conditions) in 2012 or 2015 | Reduction in 2012 or 2015 prevalence due to previous innovation | |||||||||
| 11 | A. Any bed days? | 6 | −0.182 | −3.11 | 0.00 | 0.182 | 12.2% | 12.9% | 5.6% | 134,426,738 | 7,564,874 |
| 12 | B. Any missed school days? | 0 | −0.240 | −3.26 | 0.00 | 0.107 | 6.5% | 6.8% | 5.1% | 64,262,316 | 3,287,568 |
| 13 | C. Any missed work days? | 0 | −0.128 | −2.16 | 0.03 | 0.107 | 9.8% | 10.0% | 2.5% | 118,108,129 | 2,895,970 |
| 14 | D. Any prescribed medicines? | 6 | 0.150 | 2.12 | 0.03 | 0.182 | 52.5% | 51.4% | −2.1% | 672,272,630 | −13,924,430 |
| 15 | F. Any emergency room visits? | 0 | −0.103 | −3.22 | 0.00 | 0.107 | 5.5% | 5.6% | 2.3% | 65,246,840 | 1,475,112 |
| 16 | G. Any home health visits? | 6 | −0.204 | −4.78 | 0.00 | 0.182 | 2.3% | 2.5% | 9.2% | 24,957,855 | 2,286,640 |
| 17 | H. Any inpatient events? | 3 | −0.159 | −3.19 | 0.00 | 0.149 | 2.5% | 2.6% | 5.7% | 32,072,297 | 1,820,489 |
| 18 | I. Any outpatient events? | 12 | −0.079 | −2.74 | 0.01 | 0.244 | 4.9% | 5.1% | 4.1% | 70,561,790 | 2,857,771 |
-
Ŷ no_innov,2015 = Φ[Φ−1(Ŷ actual,2015) − β k * (mean(ln(CUM_CLASS2015-k )) − mean(ln(CUM_CLASS1997-k )))]. Estimates in bold are statistically significant (p-value < 0.05).
References
Agency for Healthcare Research and Quality. 2022a. MEPS HC-180: 2015 Medical Conditions. Also available at https://www.meps.ahrq.gov/data_stats/download_data/pufs/h180/h180doc.shtml.Suche in Google Scholar
Agency for Healthcare Research and Quality. 2022b. Clinical Classifications Software (CCS) for ICD-9-CM: Appendix C: Multi-Level Diagnoses. Also available at https://www.hcup-us.ahrq.gov/toolssoftware/ccs/AppendixCMultiDX.txt.Suche in Google Scholar
Agency for Healthcare Research and Quality. 2022c. Medical Expenditure Panel Survey Full-Year Consolidated Data Files. Also available at https://www.meps.ahrq.gov/mepsweb/data_stats/download_data_files_results.jsp?cboDataYear=All&cboDataTypeY=1%2CHousehold+Full+Year+File&buttonYearandDataType=Search&cboPufNumber=All&SearchTitle=Consolidated+Data.Suche in Google Scholar
Agency for Healthcare Research and Quality. 2022d. Medical Expenditure Panel Survey Medical Conditions Files. Also available at https://www.meps.ahrq.gov/mepsweb/data_stats/download_data_files_results.jsp?cboDataYear=All&cboDataTypeY=1%2CHousehold+Full+Year+File&buttonYearandDataType=Search&cboPufNumber=All&SearchTitle=Medical+Conditions.Suche in Google Scholar
Agency for Healthcare Research and Quality. 2022e. Medical Expenditure Panel Survey (MEPS). Also available at https://www.meps.ahrq.gov/mepsweb/.Suche in Google Scholar
Bils, M. 2004. “Measuring The Growth From Better and Better Goods”. NBER working paper no. 10606, July. Also available at https://www.nber.org/papers/w10606.10.3386/w10606Suche in Google Scholar
Bresnahan, T. F., and R. J. Gordon. 1996. The Economics of New Goods. Chicago: University of Chicago Press.10.7208/chicago/9780226074184.001.0001Suche in Google Scholar
Bureau of Labor Statistics. 2022. Quarterly Census of Employment and Wages. Also available at https://www.bls.gov/cew/.Suche in Google Scholar
Centers for Medicare & Medicaid, Services. 2022. National Health Expenditure Accounts. Also available at https://www.cms.gov/Research-Statistics-Data-and-Systems/Statistics-Trends-and-Reports/NationalHealthExpendData/NationalHealthAccountsHistorical.Suche in Google Scholar
Centre National Hospitalier d’Information sur le M é dicament. 2022. Thériaque. Also available at https://www.theriaque.org/apps/contenu/accueil.php.Suche in Google Scholar
Dorsey, E. R. 2010. “Financial Anatomy of Biomedical Research, 2003–2008.” Journal of the American Medical Association 303 (2): 137–43, https://doi.org/10.1001/jama.2009.1987.Suche in Google Scholar
Duflos, G., and F. Lichtenberg. 2012. “Does Competition Stimulate Drug Utilization? The Impact of Changes in Market Structure on US Drug Prices, Marketing and Utilization.” International Review of Law and Economics 32: 95–109, https://doi.org/10.1016/j.irle.2011.08.003.Suche in Google Scholar
FDA, Research. 2022. Review Designation Policy—Priority (P) and Standard (S). Also available at https://www.fda.gov/files/about%20fda/published/Review-Designation-Policy--Priority-%28P%29-and-Standard-%28S%29.pdf.Suche in Google Scholar
Grossman, G. M., and E. Helpman. 1993. Innovation and Growth in the Global Economy. Cambridge: MIT Press.Suche in Google Scholar
Harvard Health. 2019. Are the New Migraine Medications Working? Also available at https://www.chicagotribune.com/sns-201910010001--tms--harvhltl69l1019f-20191001-story.html.Suche in Google Scholar
Huang, Y. P., J. J. Xue, C. Li, X. Chen, H. J. Fu, T. Fei, and P. X. Bi. 2020. “Depression and APOEε4 Status in Individuals with Subjective Cognitive Decline: A Meta-Analysis.” Psychiatry Investigation 17 (9): 858–64, doi:https://doi.org/10.30773/pi.2019.0324.Suche in Google Scholar
Jacquin, A., C. Binquet, O. Rouaud, A. Graule-Petot, B. Daubail, G.-V. Osseby, C. Bonithon-Kopp, M. Giroud, and Y. Béjot. 2014. “Post-Stroke Cognitive Impairment: High Prevalence and Determining Factors in a Cohort of Mild Stroke.” Journal of Alzheimer’s Disease 40 (4): 1029–38, doi:https://doi.org/10.3233/JAD-131580.Suche in Google Scholar
Jovanovic, B., and Y. Yatsenko. 2012. “Investment in Vintage Capital.” Journal of Economic Theory 147 (2): 551–69, https://doi.org/10.1016/j.jet.2010.10.017.Suche in Google Scholar
Kappos, L., A. Bar-Or, B. A. C. Cree, R. J. Fox, G. Giovannoni, R. Gold, P. Vermersch, D. L. Arnold, S. Arnould, T. Scherz, C. Wolf, E. Wallström, and F. Dahlke. 2018. “Siponimod versus Placebo in Secondary Progressive Multiple Sclerosis (EXPAND): A Double-Blind, Randomised, Phase 3 Study.” Lancet 391 (10127): 1263–73, doi:https://doi.org/10.1016/S0140-6736(18)30475-6.Suche in Google Scholar
Lanthier, M., K. L. Miller, C. Nardinelli, and J. Woodcock. 2013. “An Improved Approach to Measuring Drug Innovation Finds Steady Rates of First-In-Class Pharmaceuticals, 1987–2011.” Health Affairs 32 (8): 1433–9, doi:https://doi.org/10.1377/hlthaff.2012.0541.Suche in Google Scholar
Lichtenberg, F. R. 2012. “The Effect of Pharmaceutical Innovation on the Functional Limitations of Elderly Americans: Evidence from the 2004 National Nursing Home Survey.” Advances in Health Economics and Health Services Research 23: 71–99, doi:https://doi.org/10.1108/S0731-2199(2012)0000023006.Suche in Google Scholar
Lichtenberg, F. R. 2019a. “The Impact of Access to Prescription Drugs on Disability in Eleven European Countries.” Disability and Health Journal 12 (3): 375–86, https://doi.org/10.1016/j.dhjo.2019.01.003.Suche in Google Scholar
Lichtenberg, F. R. 2019b. “The Long-Run Impact of New Medical Ideas on Cancer Survival and Mortality.” Economics of Innovation and New Technology 28 (7): 722–40, https://doi.org/10.1080/10438599.2018.1557421.Suche in Google Scholar
Lichtenberg, F. R. 2021. “Are Drug Prices Subject to Creative Destruction? Evidence from the U.S., 1997–2017.” Health Economics 30 (8): 1910–32, doi:https://doi.org/10.1002/hec.4283.Suche in Google Scholar
Lichtenberg, F. R. 2022. “The Effect of Pharmaceutical Innovation on Longevity: Evidence from the U.S. And 26 High-Income Countries.” Economics and Human Biology 46, https://doi.org/10.1016/j.ehb.2022.101124.Suche in Google Scholar
National Cancer Institute. 2021. Enhancing Drug Discovery and Development. Also available at: https://www.cancer.gov/research/areas/treatment/enhancing-drug-discovery.Suche in Google Scholar
NIH National Institute on Aging. 2022. What Is Mild Cognitive Impairment? Also available at https://www.nia.nih.gov/health/what-mild-cognitive-impairment.Suche in Google Scholar
Pizer, S. D., A. B. Frakt, and L. I. Iezzoni. 2009. “Uninsured Adults with Chronic Conditions or Disabilities: Gaps in Public Insurance Programs.” Health Affairs 28, https://doi.org/10.1377/hlthaff.28.6.w1141.Suche in Google Scholar
Prince, M., V. Patel, S. Saxena, M. Maj, J. Maselko, M. R. Phillips, and A. Rahman. 2007. “No Health without Mental Health.” Lancet 370 (9590): 859–77, doi:https://doi.org/10.1016/s0140-6736(07)61238-0.Suche in Google Scholar
Sampat, B., and F. R. Lichtenberg. 2011. “What Are the Respective Roles of the Public and Private Sectors in Pharmaceutical Innovation?” Health Affairs 30 (2): 332–9, https://doi.org/10.1377/hlthaff.2009.0917.Suche in Google Scholar
Technology News and Literature. 2011. Drug Reduces Stroke Victim Brain Inflammation, Disability. Also available at http://sciencebusiness.technewslit.com/?p=3009.Suche in Google Scholar
University of New Mexico, Division of Translational Informatics. 2021. DrugCentral 2021 Online Drug Compendium. Also available at https://drugcentral.org/.Suche in Google Scholar
Wang, G., and W. Li. 2020. “Diabetes as a Risk Factor for Abnormal Cognition Development.” Journal of Alzheimer’s Disease Reports 4 (1): 237–42, https://doi.org/10.3233/ADR-200181.Suche in Google Scholar
Whitman, K., G. L. Reznik, and D. Shoffner. 2011. “Who Never Receives Social Security Benefits?” Social Security Bulletin 71 (2), https://www.ssa.gov/policy/docs/ssb/v71n2/v71n2p17.html.Suche in Google Scholar
Wikipedia. 2022. Anatomical Therapeutic Chemical Classification System. Also available at https://en.wikipedia.org/wiki/Anatomical_Therapeutic_Chemical_Classification_System.Suche in Google Scholar
World Health Organization. 2022. ATC Structure and Principles. Also available at https://www.whocc.no/atc/structure_and_principles/.Suche in Google Scholar
© 2022 Walter de Gruyter GmbH, Berlin/Boston