
Statistical investigation of pivotal physical and chemical factors on the performance of ceramic-based microbial fuel cells
-
Vajihe Yousefi


Abstract
The performance of four different commercial ceramic separators is inspected using response surface methodology (RSM). The thickness (A), porosity (B), SiO2 (C), and Al2O3 (D) contents of ceramics are statistically significant (P-value<0.05) for both responses of the maximum power density (MPD) and the coulombic efficiency (CE). The interactions of AB and AC have significant influences on the MPD. For highly porous ceramics, including the unglazed wall ceramic (MFC-UGWC, 30.45% porosity) and Yellow ceramic (MFC-Y, 28.9% porosity), the MPD and CE are boosted by raising the thickness of membranes. The MPD and CE values have been enhanced from 225.07 to 321.11 mW/m2 and from 51 to 68%, respectively, by thickening the UGWC from 3 to 9 mm. Similarly, the power performance and CE of the MFC-Y have been grown by 32% and 148.6%, respectively. However, both the MPD and CE responses have been reduced from 106.89 to 57.65 mW/m2 and from 29 to 18.3% for the denser unglazed floor ceramic (UGFC, 11% porosity) as a consequence of thickness increment from 3 to 6 mm. Furthermore, the chemical composition of ceramics has a crucial impact on the overall performance. Richer ceramics in SiO2 are utilized, the higher performance is achieved.
Introduction
The severe crises of clean water and energy signalize the critical demand for the development of ground-breaking green technologies like the microbial fuel cell (MFC) systems which can take advantage of simultaneous bio-electricity generation and treatment of wastewaters (Logan 2008; Pandit et al. 2021; Rozendal et al. 2008; Savla et al. 2020a, 2020b; Tan et al. 2021). Moreover, the unique potential of bioelectrochemical systems (BESs) like MFCs for the removal or recovery of complex organic contaminants, which cannot be treated effectively using the conventional methods, attracted much attention recently (Ahmad et al. 2021). Typically, MFC systems are constructed by two distinct compartments for the anode and cathode electrodes which are separated by proton exchange membranes (PEM). The degradation of the available substrates in the wastewater by the exo-electrogenic bacteria generates electrons, protons, CO2, and sufficient energy for the growth of bacteria in the anode chamber. The produced electrons and protons are respectively conveyed via the external circuit and the PEM towards the cathode electrode, where the oxygen reduction reaction (ORR) is accomplished finally (Logan 2008; Logan et al. 2006).
The overall performance of MFC systems could be influenced by the proficiency of each part in the abovementioned process, includes the engineering-related factors or various environmental conditions (Jung and Pandit 2019). In addition to the selection of suitable MFC architecture, the implementation of appropriate material and design for the electrodes and their current collectors is of great importance (Jung, Kim, and Koo 2018; Kang et al. 2017; Nam et al. 2017, 2018, 2020). Furthermore, the sufficient accommodation of anodic biofilm as the key component of BESs is related to a vast variety of parameters such as the influent substrate types and concentration, pH and temperature, the presence of toxic components, the external load etc. (Gurung et al. 2012; Jung 2012; Jung and Regan 2007; Jung, Mench, and Regan 2011; Jung et al. 2012, 2011; Tran, Kim, and Jung 2022). The cathodic ORR is the other determinant bottleneck that limited the MFC performance. Several researches have been focused on finding a well-suited and cost-effective catalysts to enhance the cathodic reaction performance (Dange et al. 2022; Koo and Jung 2021; Koo et al. 2019; Nam et al. 2018; Priyadarshini et al. 2021; Savla et al. 2020).
However, the commercialization and development of the promising MFC technology still far more than the expected level owing to various engineering and economic obstacles, namely the expensive and not-efficient catalysts and PEMs (Pandit, Savla, and Jung 2020). Numerous types of membranes have been examined for MFC application yet. Nonetheless, a well-suited and cost-effective separator has not been discovered so far (Gajda, Greenman, and Ieropoulos 2018; Tan et al. 2021). Recently, ceramic and clayware separators received much attention due to their superior physical and chemical specifications, which introduced them as viable options for MFC scale-up and wastewater treatment utilization (Ahilan, Wilhelm, and Rezwan 2018; Cheraghipoor et al. 2019, 2021; Khalili, Mohebbi-Kalhori, and Afarani 2017; Rodríguez et al. 2021; Winfield et al. 2016; Yousefi, Mohebbi-kalhori, and Samimi 2017a, 2017b, 2018, 2019, 2020; Yousefi et al. 2016).
Nevertheless, the performance of ceramic-based MFCs is influenced by many abundant factors such as thickness, porosity, proton conductivity, water uptake capacity, oxygen diffusion rate, the types and amounts of clay minerals, and the chemical composition of ceramic membranes. Several research studies have been conducted to identify or optimize the main affecting parameters on the proficiency of MFCs regarding the electricity generation or wastewater treatment viewpoints (James 2022; Merino-Jimenez et al. 2019; Salar-García et al. 2019). It has been reported that the quality of ceramic membrane could be enhanced by adjusting the firing cycle (time and temperature), type and size distribution of raw clay materials, or using cation exchanger minerals (Cheraghipoor et al. 2021; İssi et al. 2017; Saleiro and Holanda 2012; Yousefi, Mohebbi-kalhori, and Samimi 2017a, 2017b). For example, Merino-Jimenez et al. (2019) explored the influence of the water absorption and the changes in the firing cycle of fine fire clay ceramics on the ohmic resistance, the ionic conductivity, and the power generation capability of urine-fed MFCs. The inspection of the effect of iron phase content and different sintering temperatures of ceramic membranes reveals a compelling role of iron oxide for the structural porosity increment and mitigation of the negative effect of the high sintering temperature on the electricity generation performance of MFCs (Salar-García et al. 2021). Also, the implementation of acid or alkali pretreatment techniques over the ceramic membranes remarkably boosted the overall performance of MFCs both in terms of electricity generation, and wastewater treatment quality (Cheraghipoor et al. 2019; Das et al. 2020). Furthermore, the MFC performance was remarkably enhanced by applying nano-clay/chitosan nanocomposites over the ceramic separator owing to the improved oxygen barrier capability and the boosted proton conductivity of ceramics (Yousefi, Mohebbi-Kalhori, and Samimi 2018, 2020). The influence of ceramic thickness was also inquired using the electrochemical impedance spectroscopy (EIS) approach (Yousefi, Mohebbi-Kalhori, and Samimi 2019).
Besides, the conventional one-factor-at-time (OFAT) method is unable to investigate different aspects of complicated systems, especially the vital interactions between the interconnected parameters. In such cases, the implementation of a statistical modeling approach like the response surface methodology (RSM) could provide several advantages over the OFAT technique, such as saving time and materials and encompassing the interactions between multiple factors. In this respect, Raychaudhuri and Behera (2020) reviewed the studies that were utilized the statistical modeling techniques for complex BESs and particularly MFC systems. Moreover, Salar-García et al. (2019) employed the RSM technique with a three level Box–Behnken design to identify the relative importance of three different operating parameters on the performance of Urine-fed MFCs. The results of statistical analysis revealed the higher significance of anode area and external resistance load factors compared to the ceramic thickness. Further, Sugumar, Kugarajah, and Dharmalingam (2022) implemented a Box–Behnken (BB) design to optimize the values of three operational factors, including the filler concentration, membrane thickness, and anode surface area for the MFCs that contained a novel nanocomposite membrane made of Sulphonated Zinc Oxide Nano Rods. Also, they have similarly optimized the values of substrate type, external resistance load, and catalyst loading rate for the tubular MFC with the nanocomposite membrane reinforced by Sulphonated Titanium Nanotubes (Sugumar and Dharmalingam 2022).
This research aims to statistically survey the most prominent physical and chemical features, including thickness, porosity, and chemical composition of ceramic separators, along with their interactions. The performance of the Red commercial unglazed ceramic (MFC-R) has compared to the results of our previously published research which have performed using other commercial unglazed ceramics. It must be noticed that the thoroughly identical design and operational conditions have been implemented in all MFC experiments. To the best of the author’s knowledge, this is the first study that encompasses the combined effects of physical and chemical specifications of commercial ceramic membranes on the overall performance of the MFC system.
Materials and methods
A dual-chambered cubic design has been used for the MFCs, similar to the previous studies (Yousefi, Mohebbi-Kalhori, and Samimi 2017a; Yousefi, Mohebbi-Kalhori, and Samimi 2018, 2019, 2020). The anode electrode was made of four-ply carbon cloth pieces (total surface of about 480 cm2, Pantex®35, Zoltek Co. Ltd., USA) suspended from a stainless-steel plate (ca. 84 cm2) as the anodic current collector. A folded-up carbon cloth cathode (ca. 262.5 cm2) was held closely nearby the ceramic membrane using a bent stainless-steel rod (2 mm diameter and 50 cm length) as the cathodic collector. Four different types of commercial unglazed ceramics were utilized to separate the anodic and cathodic compartments. The abbreviation of Y has been used for the Yellow ceramic, R for the Red ceramic, UGWC for the unglazed wall ceramic, and UGFC for the unglazed floor ceramic membranes, respectively. The MFCs are nominated based on their ceramic membrane type, followed by the ceramic thickness value in millimeters. For example, MFC-Y-9 represents the MFC system which contains the 9 mm thick Yellow ceramic. The data values for two ceramic types of UGWC, and UGFC have been obtained from the study of Khalili, Mohebbi-Kalhori, and Afarani (2017), which was implemented a thoroughly identical MFC system with the present research. The operational conditions of MFC systems include the type and flowrate of the anodic substrate, temperature, and pH have been adjusted the same for all the experiments. The un-processed wastewater from the septic plant of Sistan and Baluchestan University (Zahedan, Iran) is continuously supplied as the anodic influent (35 ± 5 °C), and the penetrated catholyte through the ceramic is aerated by an aquarium pump, to ensure sufficient oxygen saturation for the cathodic ORR. The thickness, porosity, and chemical compositions of ceramic separators are considered as the main influencing parameters on the overall performance of the MFCs.
The open-circuit voltage (OCV) and the current (obtained from the closed-circuit voltage [CCV] by inserting the external resistance of Rext = 100 Ω in the circuit and calculated via the Ohm’s Law of I = V/Rext) are regularly recorded using an automatic data acquisition system (USB-4704, Advantech Co., Ltd). Polarization tests are carried out manually by changing the external resistance from 45,000 to 10 Ω and calculating the current and power densities according to Ohm’s Law (CD = V/ARext, PD = V2/ARext) normalized by the ceramic separator surface (A). The coulombic efficiency (CE) was calculated by Equation (1):
where F is the Faraday constant, Va is the volume of the anodic chamber, and ∆COD represents the removed COD during the MFC experiment. The obtained data were analyzed using Design Expert 7.0, Stat-Ease, Inc. (trial version) program including analyses of variance (ANOVA) to find out the significant factors among the variables. The porosity of samples is estimated according to ASTM C373-88 using the Archimedes method using 3–5 random samples, and the average values are reported here. The chemical composition of ceramics is analyzed through X-ray fluorescence analysis (XRF-OXFORD INSTRUMENTS ED 2000). In addition, structure analysis of ceramics is performed using the XRD technique (Bruker Advance D8).
Results and discussion
The electricity generation of the ceramic-based microbial fuel cells
The electricity generation performance of MFCs is the most critical approach that must be studied carefully. The OCV, V and current (mA) generation (Rext = 100 Ω) trends of the MFCs during the time are depicted in Figure 1A and B, respectively. The number in the parenthesis after the name of MFCs represents the replications of each experiment. Each experiment was replicated at least two times and prolonged for about 350 h. However, since the OCV and current generation values became relatively stabled after about 140 h, the period between 0 and 140 h has been depicted here.
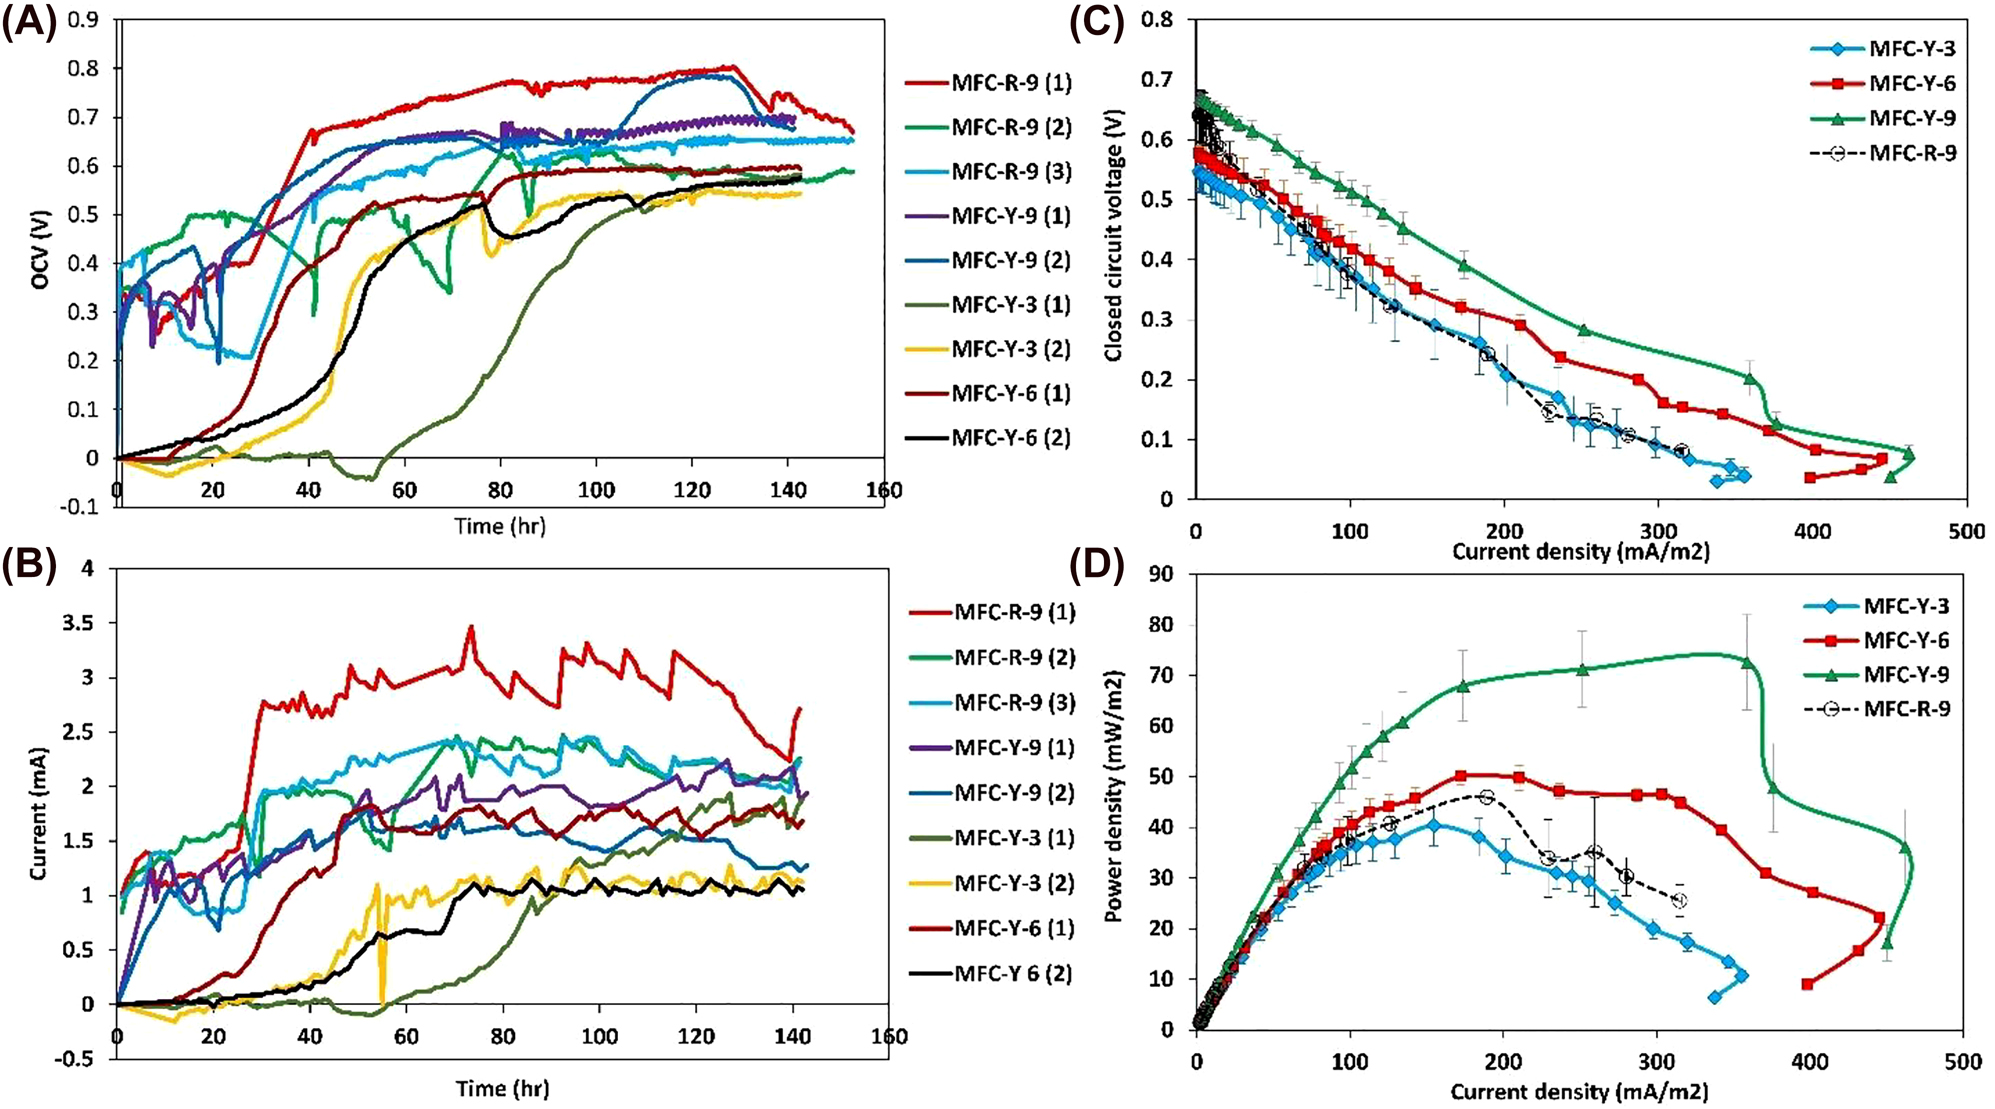
The electricity generation of the MFCs: (A) the open-circuit voltage (OCV), (B) the current generation, (C) the voltage versus the current density during the polarization test, and (D) the power density versus current density during the polarization test.
As can be seen, the voltage and current values of all the MFCs with the 9 mm thick ceramics (MFC-Y-9, MFC-R-9) are increased rapidly during the first 40 h of experiments, when the exo-electrogenic bacteria are in the growth phase, and the electricity generation is enhanced by the formation of biofilms over the electrodes, consequently. Thereinafter, the electricity generation of the MFCs did not change significantly and almost reached stable values, except for a few occasional losses owing to the probable sludge clogging. However, the voltage and current generation have been postponed between 40 and 60 h for MFC-Y-3, and between 20 and 40 h for MFC-Y-6, then increased gradually afterward. The excess diffusion of oxygen through the thinner ceramics towards the anode chamber, which interferes with the growth of anaerobic exo-electrogenic bacteria, could be responsible for the delay.
Comparatively, MFC-R-9 produced higher current values (2.80 ± 0.58 mA) than MFC-Y-9 (1.91 ± 0.3 mA). Presumably, due to the better oxygen barrier capability of the denser Red ceramic than the more porous Yellow ceramic, which provides an acceptable anoxic environment in the anode chamber of MFC-R-9. Although increasing the ceramic porosity improves the proton conductivity of the separator, on the other hand, it could eventuate in the extra oxygen permeation from the cathode to the anode compartment, subsequently interfering with the growth of anaerobic microorganisms in the anode chamber. Moreover, the CE of MFC-R-9 (38.44 ± 7.61%) is also higher than the value of MFC-Y-9 (27.58 ± 4.2%).
Furthermore, the average values of the CCV, V and the power density (PD, mW/m2) versus the current density of the MFCs during the polarization test are displayed in Figure 1C and D. The voltages of the MFCs are subjected to the polarization losses including the activation, ohmic, and mass transfer losses. As depicted in Figure 1C, a rapid voltage drop is occurred at the first section of the polarization curve, i.e., for the low current density part which is attributed to the activation losses. Thereafter, a nearly linear decrease in voltage at the middle part of the polarization curve can be observed owing to the ohmic overpotential in the MFC systems, which is attributed to the resistance of internal parts such as the electrodes, current collectors, and electrolytes. Finally, another rapid voltage drop is taking place at a high-current density region as a result of faster anodic substrate oxidation than the rate of electron transportation to the electrode surface, assigned as the mass transfer overpotential. As can be seen in Figure 1C, MFC-R-9 has higher activation overpotential than MFC-Y-9. Subsequently, the ohmic losses is rather similar for these two ceramic-based MFCs, but MFC-Y-9 shows a relatively higher mass transfer losses at the high-current densities compared to MFC-R-9. Moreover, the comparison of the maximum power and current densities in Figure 1D reveals the higher electricity generation performance using 9 mm thick Yellow ceramic (72.54 ± 10.42 mW/m2, 462.22 ± 21.37 mA/m2) than the values obtained by the Red ceramic with the same thickness (45.94 ± 5.67 mW/m2, 315.1 ± 27.63 mA/m2). Though MFC-Y-6 has lower OCV and takes more time to reach stable conditions, it generates a higher PD than MFC-R-9, owing to the lesser ohmic resistance of this MFC. However, MFC-R-9 has outperformed the thinnest Yellow ceramic (MFC-Y-3) because of uncontrolled oxygen diffusion toward the anode chamber.
Statistical optimization results
MFCs are highly complicated systems that could be influenced by several parameters, including the architecture design, membranes, electrodes, catalysts, the influent substrate, and anodic microbial consortia. Moreover, the MFC performance could be investigated regarding the distinct and complementary viewpoints like boosting the electricity generation performance or enhancing the wastewater treatment capability of the MFC system. In the present study, the combination of the chemical (ceramic composition) and physical (thickness and porosity) specifications of different ceramic-ware membranes have been statistically examined to find the main influencing features of ceramics on the overall performance of the MFCs. Table 1 shows the critical factors and their experimental levels in this study. Three levels of 3, 6, and 9 mm have been adjusted for the thickness of four types of commercial unglazed ceramics (with different porosity and chemical composition) which created four levels for the porosity and the chemical composition components of the ceramics. The RSM has been applied for this statistical study. However, the RSM analysis did not perform based on the commonly designed experiments like the central composite (CCD), Box–Behnken, or D-Optimal designs. Therein, the utilized ceramic membranes have been adopted from the available unglazed ceramic biscuits in the market and were not hand-made. Hence, the levels for the porosity and the chemical composition factors have been specified based on the existing characteristics of the commercial ceramic biscuits. Therefore, the Historical data interface from the response surface method has been selected that provides an option for adjusting the levels of RSM factors to the available experimental data.
The main factors and the experimental levels of them used in the present statistical investigation.
| Type of variable | Variables | Symbol | Experimental variable levels | ||||
|---|---|---|---|---|---|---|---|
| Physical specification | Thickness (mm) | A | 3 | 6 | 9 | ||
| Porosity (%) | B | 11.0 | 21.45 | 28.94 | 30.45 | ||
| Chemical ceramic composition | SiO2 (w/w%) | C | 65.7 | 68.4 | 70.13 | 72.46 | |
| Al2O3 (w/w%) | D | 10.65 | 10.95 | 14.59 | 16.75 | ||
| Fe2O3 (w/w%) | E | 2.36 | 2.71 | 7.41 | 8.03 | ||
| K2O (w/w%) | F | 1.68 | 2.26 | 2.36 | 2.53 | ||
| CaO (w/w%) | G | 1.48 | 5.1 | 7.23 | 10.43 | ||
| MgO (w/w%) | H | 0.79 | 0.85 | 1.03 | 1.88 | ||
| TiO2 (w/w%) | J | 0.35 | 0.57 | 0.79 | 0.95 | ||
Besides, the maximum power density (MPD) and the CE of the MFCs have been adopted as the responses of the statistical investigation. As regards, the current generation and wastewater treatment features of the MFCs are inherently considered in the CE and power generation performance, and thereby they cannot be perceived as independent responses. Hence, two distinct ANOVA have been done separately for the MPD and the CE of the MFCs as the main responses of the present study. The experimental values of the independent factors and responses of the present study are exhibited in Table 2. All the experiments were performed at least two times and their average values are reported here.
The experimental values of the independent variables and the responses of the statistical investigation.
| MFC | Separator | Thickness (mm) | Porosity (%) | Ceramic composition (w/w%) | R in (Ω) | MPD (mW/m2) | MCD (mA/m2) | CE (%) | Ref | ||||||
|---|---|---|---|---|---|---|---|---|---|---|---|---|---|---|---|
| SiO2 | Al2O3 | Fe2O3 | K2O | CaO | MgO | TiO2 | |||||||||
| MFC-Y-9-1 | Yellow | 9 | 28.94 | 68.46 | 10.95 | 2.71 | 1.68 | 7.23 | 1.88 | 0.57 | 559.3 | 63.76 | 465.22 | 30.55 | Yousefi, Mohebbi-Kalhori, and Samimi (2019) |
| MFC-Y-9-2 | Yellow | 9 | 28.94 | 68.46 | 10.95 | 2.71 | 1.68 | 7.23 | 1.88 | 0.57 | 559.3 | 50.06 | 481.31 | 24.61 | |
| MFC-Y-3-1 | Yellow | 3 | 28.94 | 68.46 | 10.95 | 2.71 | 1.68 | 7.23 | 1.88 | 0.57 | 649.2 | 40.37 | 352.41 | 10.79 | |
| MFC-Y-3-2 | Yellow | 3 | 28.94 | 68.46 | 10.95 | 2.71 | 1.68 | 7.23 | 1.88 | 0.57 | 649.2 | 45.81 | 367.41 | 11.34 | |
| MFC-Y-6-1 | Yellow | 6 | 28.94 | 68.46 | 10.95 | 2.71 | 1.68 | 7.23 | 1.88 | 0.57 | 601.2 | 50.01 | 441.26 | 14.87 | |
| MFC-Y-6-2 | Yellow | 6 | 28.94 | 68.46 | 10.95 | 2.71 | 1.68 | 7.23 | 1.88 | 0.57 | 601.2 | 54.87 | 467.12 | 15.96 | |
| MFC-R-9-1 | Red | 9 | 21.45 | 65.7 | 14.59 | 8.03 | 2.36 | 5.1 | 1.03 | 0.79 | 635.2 | 42.78 | 292.96 | 45.68 | Present study |
| MFC-R-9-2 | Red | 9 | 21.45 | 65.7 | 14.59 | 8.03 | 2.36 | 5.1 | 1.03 | 0.79 | 635.2 | 50.8 | 332.03 | 34.91 | |
| MFC-R-9-3 | Red | 9 | 21.45 | 65.7 | 14.59 | 8.03 | 2.36 | 5.1 | 1.03 | 0.79 | 635.2 | 44.25 | 320.31 | 34.73 | |
| UGWC-3-1 | UGWC | 3 | 30.45 | 72.46 | 10.65 | 2.36 | 2.53 | 10.43 | 0.79 | 0.35 | 79.9 | 225.07 | 1067.7 | 51 | Khalili, Mohebbi-Kalhori, and Afarani (2017) |
| UGWC-6-2 | UGWC | 6 | 30.45 | 72.46 | 10.65 | 2.36 | 2.53 | 10.43 | 0.79 | 0.35 | 91.7 | 272.01 | 1588.22 | 58 | |
| UGWC9-3 | UGWC | 9 | 30.45 | 72.46 | 10.65 | 2.36 | 2.53 | 10.43 | 0.79 | 0.35 | 100.6 | 321.11 | 1433.89 | 68 | |
| UGFC-3-4 | UGFC | 3 | 11 | 70.13 | 16.75 | 7.41 | 2.26 | 1.48 | 0.85 | 0.95 | 265.7 | 106.89 | 636.57 | 29 | |
| UGFC-6-5 | UGFC | 6 | 11 | 70.13 | 16.75 | 7.41 | 2.26 | 1.48 | 0.85 | 0.95 | 653.2 | 57.65 | 302.21 | 18.3 | |
The first response of the statistical analysis: maximum power density (MPD)
The results of ANOVA for the MPD of the MFCs are presented in Table 3. The Model F-value of 840.95 implies that the model is statistically significant. There is a chance of 0.01% that this large quantity of “Model F-Value” could take place due to noise. Moreover, considering the “P-value” of less than 0.05 for the variables of Thickness (A), Porosity (B), SiO2 (C), and Al2O3 (D) contents of ceramic as well as the interaction terms of AB and AC, reveals their viable significance on the electrical performance of the ceramic-based MFCs. The P-value of 0.8736 (P-value>0.05) for the “Lack of fit” parameter, which compares the residual and pure errors from the replicated experimental design points, implies the non-significant lack of fit relative to the pure error. Furthermore, a highly close value of the coefficient of determination (R2 = 0.9986) to the unit and the reasonable agreement of the “Adjusted R2” (0.9974) and the “Predicted R2” (0.9563) corroborated the acceptable correlation of the observed and predicted values. Further, the “Adequate Precision” of 80.489, implies an adequate signal-to-noise ratio. Overall, the obtained model can reliably be employed to navigate the design space. Finally, the following mathematical expressions were produced from the statistical analysis to exhibit the correlation between the MPD and the significant factors of the analysis, in terms of the codded (Eq. (2)) and the actual values of parameters (Eq. (3)):
and
where t, p, Si, and Al represent the thickness (mm), porosity (%), SiO2 (w/w%), and Al2O3 (w/w%) contents of ceramic membranes, respectively.
The results of ANOVA analysis for the first response of statistical investigation (MPD).
| Source | Sum of Squares | df | Mean Square | F-value | P-value | Sig |
|---|---|---|---|---|---|---|
| Model | 1.194E+005 | 6 | 19,897.82 | 840.95 | <0.0001 | Significant |
| A-thickness | 807.99 | 1 | 807.99 | 34.15 | 0.0006 | |
| B-porosity | 21,350.16 | 1 | 21,350.16 | 902.33 | <0.0001 | |
| C-SiO2 | 81,995.26 | 1 | 81,995.26 | 3465.38 | <0.0001 | |
| D-Al 2 O 3 | 20,746.14 | 1 | 20,746.14 | 876.80 | <0.0001 | |
| AB | 2474.64 | 1 | 2474.64 | 104.59 | <0.0001 | |
| AC | 1638.30 | 1 | 1638.30 | 69.24 | <0.0001 | |
| Residual | 165.63 | 7 | 23.66 | |||
| Lack of fit | 8.72 | 2 | 4.36 | 0.14 | 0.8736 | Not significant |
| Pure error | 156.91 | 5 | 31.38 | |||
| Cor total |
1.196E+005 |
13 |
|
|
||
| R 2 = 0.9986 | Adj R2 = 0.9984 | |||||
-
Values in italics: (A) is the thickness of ceramic separator, (B) is the porosity of the ceramic membrane, (C) represents the silica contents of ceramic separator, and (D) indicates the Al2O3 concentration in the ceramic separators.
The normality assumption is estimated by constructing a normal probability plot of the residuals. Here, the linearity of the normal probability plot for the MPD confirms an acceptable normal distribution of errors in this statistical investigation (Figure 2A). Moreover, a close agreement between the experimental results and the predicted values by the model indicates the adequacy of the model equation for the prediction of MPD values in the design criteria (Figure 2C). Also, including the internally studentized values between the lateral cutoff values of 3 and −3 shows no outlier in the residual values (Figure 2B). The Box-Cox plot shows the natural logarithm (ln) of the residual sum of square (SS) against lambda, with the current value of 1.0 and the optimum value equal to 1.4 (Figure 2D). Considering the lambda value is placed in the confidence interval region (the minimum and maximum confidence interval values of 0.52 and 1.89, respectively) that is very close to the optimum value, the data do not require any transformation based on the Box-Cox plot.
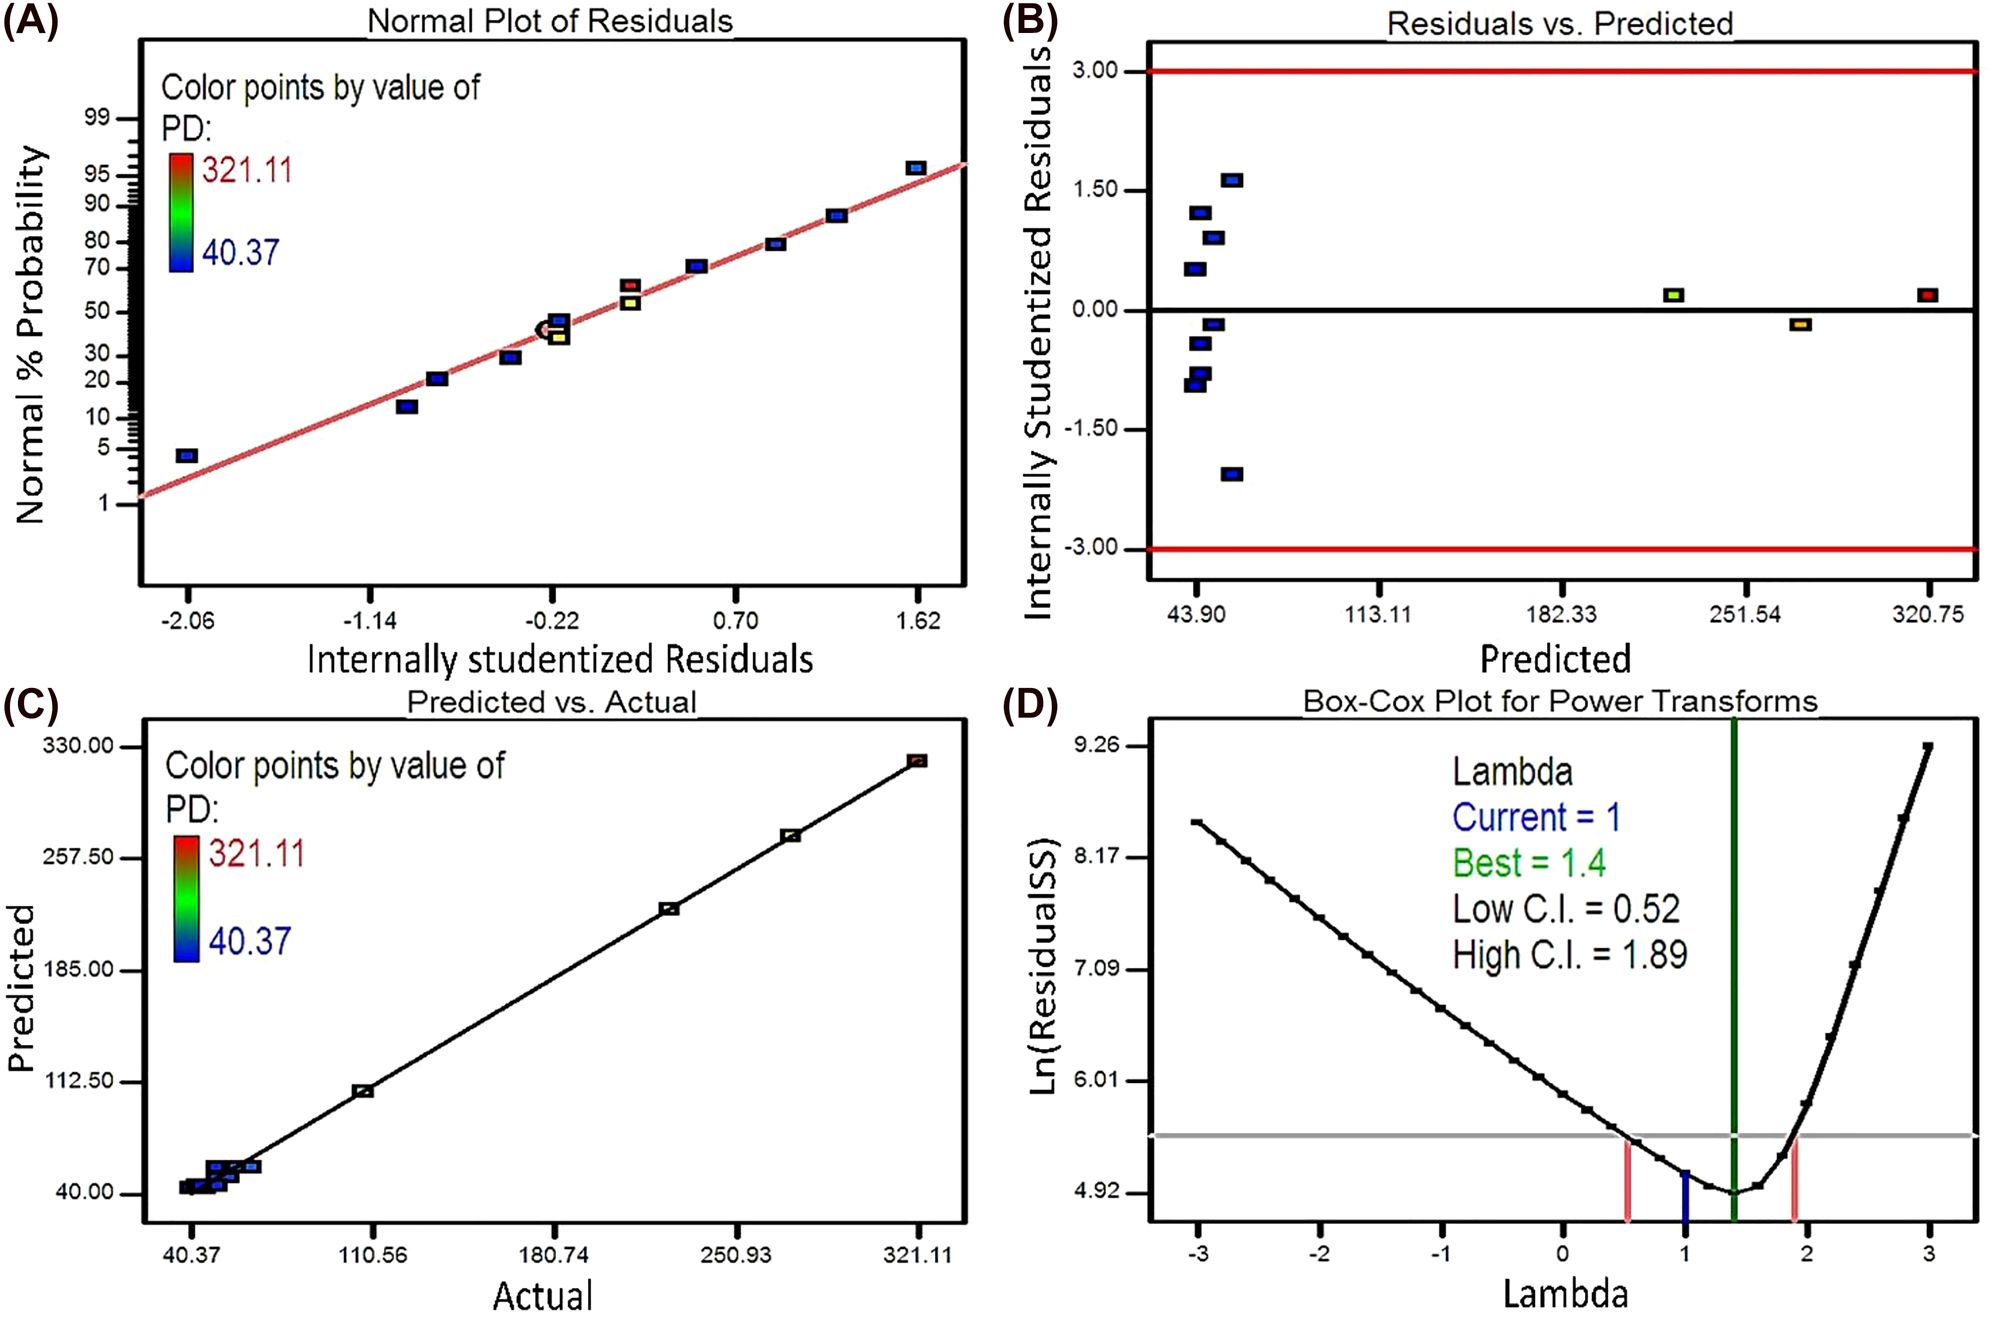
The diagnosis plots for the first model response of MPD: (A) the normal probability plot, (B) the internally studentized residuals versus the predicted values, (C) the predicted versus actual values, (D) the Box-Cox plot.
The second response of the statistical analysis: coulombic efficiency (CE)
The results of ANOVA analysis for the second response, i.e., CE of the MFCs, demonstrates the significant effect (P-value<0.05) of Thickness (A), Porosity (B), SiO2 (C), and Al2O3 (D) content of ceramic separators. As demonstrated by Table 4, none of the interactions between the parameters has any significant influence on the CE of the MFCs. The F-value of 30.90 accompanied by the P-value of lower than 0.0001 has implied the model significance. In other words, there is only a 0.01% probability that the high “Model F-Value” could occur due to noise. Moreover, the P-value of 0.1774 for the “Lack of Fit” exhibits the not significant lack of fit relative to the pure error, and there is a 17.74% chance that the F-value of 2.44 could happen as a result of noise. Also, the highly adjacent values of R2 (0.9321) and Adjusted R2 (0.9019) to the unit, accompanied by a reasonable agreement of Adjusted R2 with the predicted R2 (0.8590), demonstrate a good correlation of the actual and predicted values obtained by the model. Furthermore, the large value of adequate precision (16.238) indicates a competent signal-to-noise ratio.
The analysis of variance (ANOVA) for the second response (CE) of the statistical investigation.
| Source | Sum of squares | df | Mean square | F-value | P-value | |
|---|---|---|---|---|---|---|
| Model | 3930.63 | 4 | 982.66 | 30.90 | < 0.0001 | Significant |
| A-thickness | 307.12 | 1 | 307.12 | 9.66 | 0.0126 | |
| B-porosity | 1598.73 | 1 | 1598.73 | 50.27 | < 0.0001 | |
| C-SiO 2 | 3082.91 | 1 | 3082.91 | 96.93 | < 0.0001 | |
| D-Al 2 O 3 | 1649.38 | 1 | 1649.38 | 51.86 | < 0.0001 | |
| Residual | 286.25 | 9 | 31.81 | |||
| Lack of fit | 189.22 | 4 | 47.31 | 2.44 | 0.1774 | not significant |
| Pure error | 97.03 | 5 | 19.41 | |||
| Cor total |
4216.88 |
13 |
|
|
|
|
| R 2 = 0.9321 | Adj R2 = 0.9019 | |||||
-
Values in italics: (A) is the thickness of ceramic separator, (B) is the porosity of the ceramic membrane, (C) represents the silica contents of ceramic separator, and (D) indicates the Al2O3 concentration in the ceramic separators.
Finally, the following mathematical correlations were derived to predict the relationship between the CE of MFCs and the significant influencing parameters of “Thickness” (A), “Porosity” (B), “SiO2” (C), and “ Al2O3” (D) contents of ceramic membranes, regarding the coded (Eq. (4)) and the factual factors (Eq. (5)):
where t, p, Si, and Al, abbreviations respectively show the thickness (mm), porosity (%), SiO2 (w/w%), and Al2O3 (w/w%) contents of ceramic separators.
Furthermore, the diagnosis plots for the CE response of the present study are inquired to ensure the sufficiency of model correlation. Firstly, the almost linear normal probability plot authenticates the assumption of normally distributed errors (Figure 3A). Besides, the internally studentized residuals have values between 3 and −3 (Figure 3B), and reasonable conformity of the experimental values with the predicted ones indicates the admissible correlation of the model in the design criteria (Figure 3C). The Box-Cox plot for the equation model of CE demonstrates that the current value of lambda (equal to 1.0) is adjacent to the optimum value of 0.87, and is included in the confidence interval region (between the −0.14 and 1.7), thereby no transformation is needed for the data (Figure 3D).
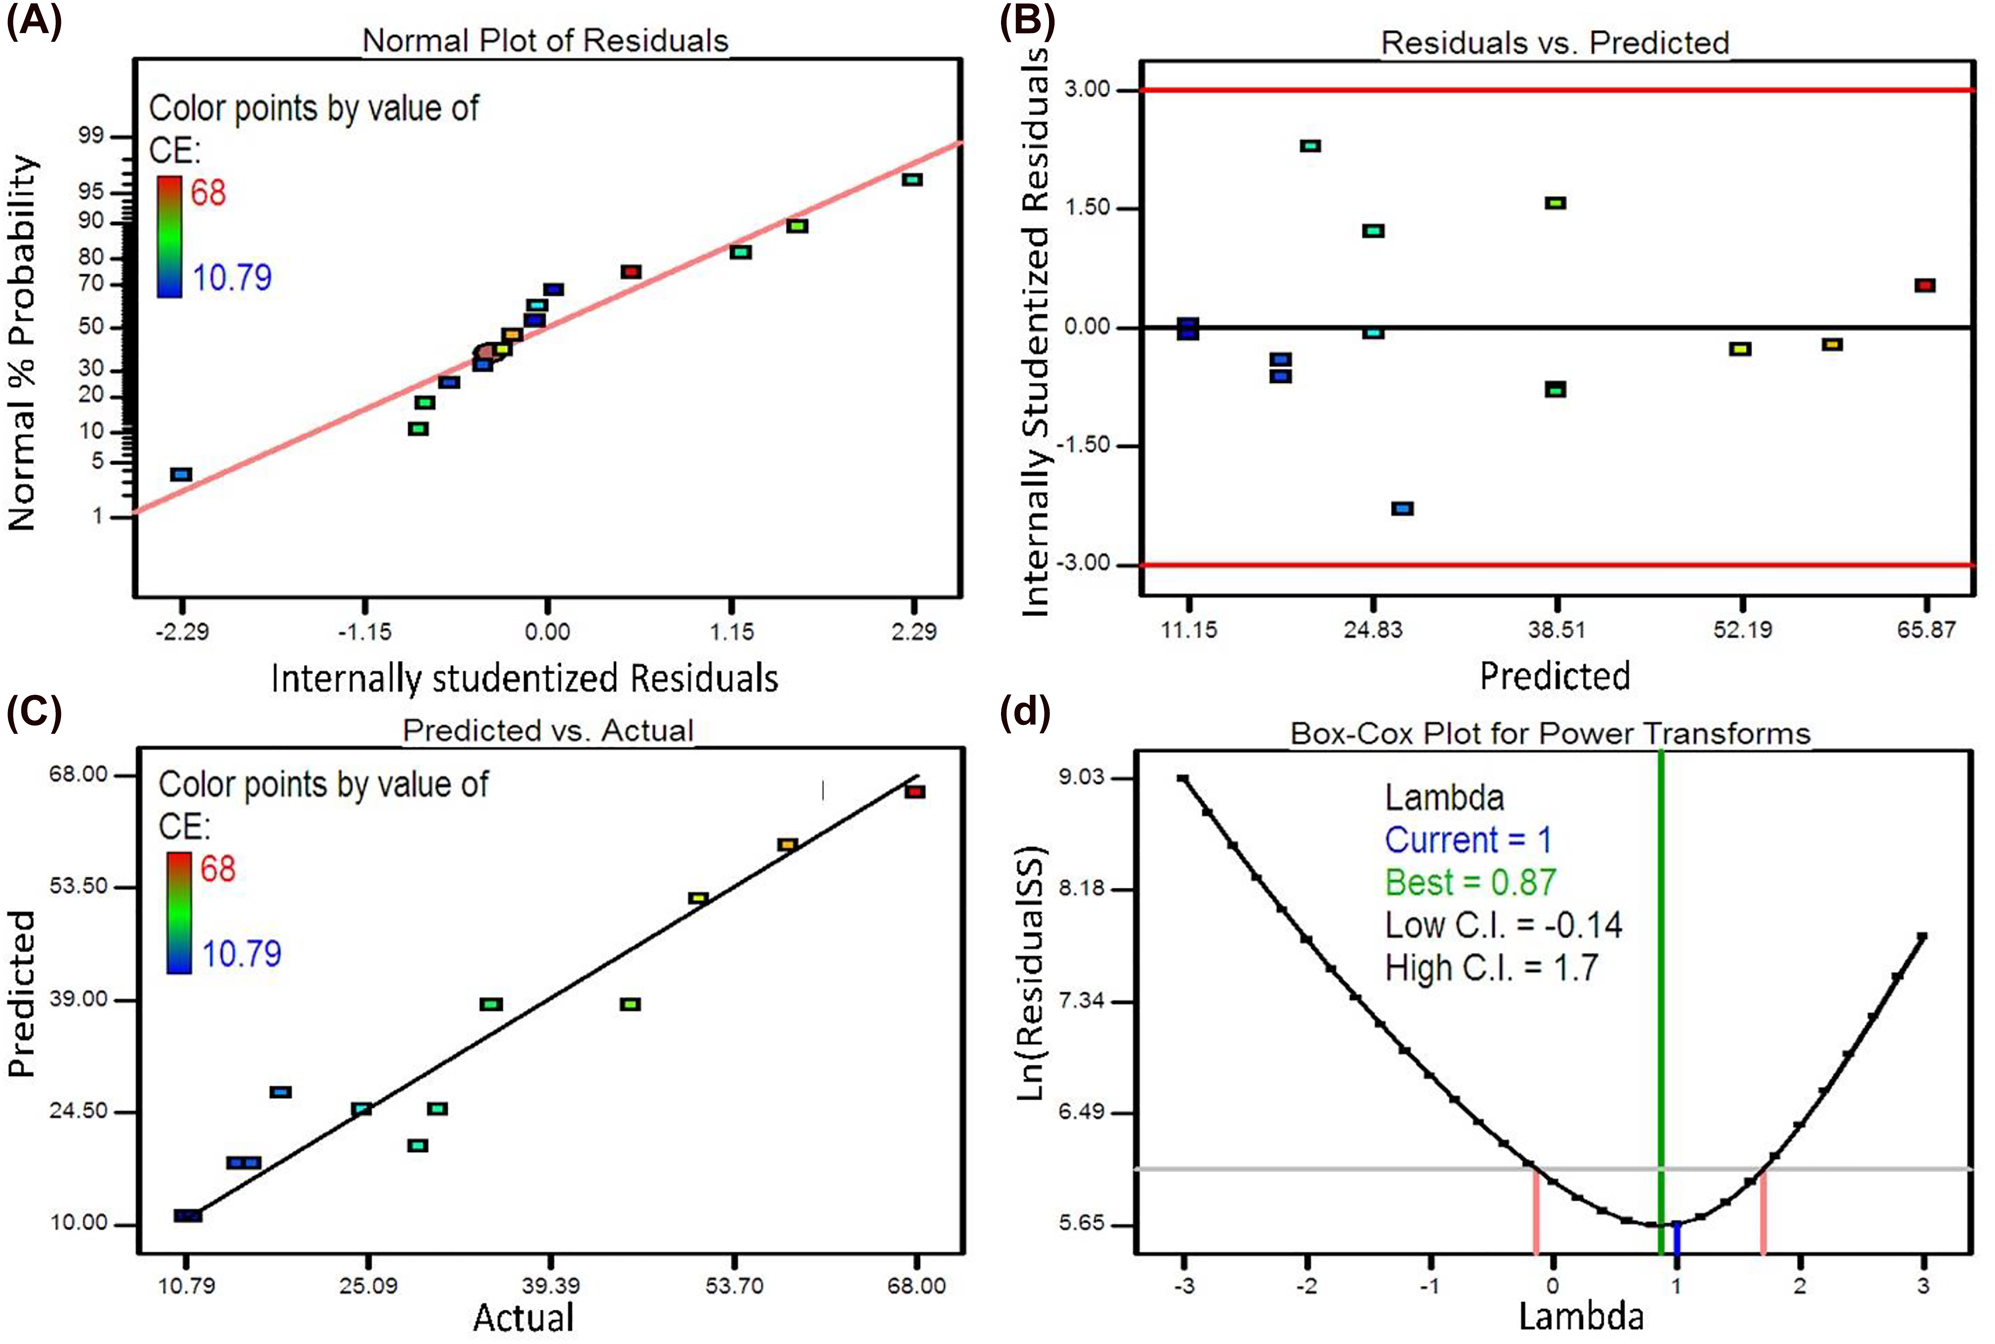
The diagnosis plots for the second model response of CE: (A) the normal probability plot, (B) the internally studentized residuals versus the predicted values, (C) the predicted versus actual values, (D) the Box-Cox plot.
Wastewater treatment efficiencies
The wastewater treatment performance of the MFCs has been estimated based on the BOD and COD removal ratios. The influent wastewater was similar for all the MFCs, with the average influent COD and BOD of 1200 ± 95 and 540 ± 24 mg/l, respectively. From Table 5, the highest BOD and COD removal efficiencies are acquired using the yellow ceramic membrane (more than 85% removal of both the COD and BOD). Subsequently, the dense floor ceramics, including the Red ceramic and UGFC, are in the second place by more than 80% removal of COD and BOD. Finally, the most porous ceramic membrane, i.e., UGWC, acquired the lowest wastewater treatment efficiency amongst all the ceramic membranes.
The wastewater treatment efficiencies of the MFCs.
| MFC | Ceramic membrane | Thickness (mm) | COD-out (mg/l) | COD removal (%) | BOD-out (mg/l) | BOD removal (%) | Reference |
|---|---|---|---|---|---|---|---|
| MFC-Y-3 | Yellow ceramic | 3 | 27 | 97.75 | 11 | 97.96 | Yousefi, Mohebbi-Kalhori, and Samimi (2019) |
| MFC-Y-6 | Yellow ceramic | 6 | 28 | 97.67 | 9 | 98.33 | |
| MFC-Y-9 | Yellow ceramic | 9 | 137 | 88.58 | 75 | 86.11 | |
| MFC-R-9 | Red ceramic | 9 | 195 | 83.75 | 105 | 80.56 | This study |
| UGWC-3 | UGWC | 3 | 244 | 79.67 | 65 | 87.96 | Khalili, Mohebbi-Kalhori, and Afarani (2017) |
| UGWC-6 | UGWC | 6 | 400 | 66.67 | 135 | 75 | |
| UGWC-9 | UGWC | 9 | 600 | 50 | 140 | 74.07 | |
| UGFC-3 | UGFC | 3 | 205 | 82.92 | 67 | 87.59 | |
| UGFC-6 | UGFC | 6 | 221 | 81.58 | 70 | 87.04 |
Moreover, the treatment proficiency was more or less enhanced by decreasing the wall thickness of the ceramic membranes, particularly for the UGWC and the yellow ceramics. This augmentation of substrate removal efficiency may be related to the addition of aerobic cathodic degradation to the anaerobic mechanism of substrate elimination due to the higher permission of substrates through the thinner ceramic separators. In this respect, Winfield et al. (2013) reported that increasing the moisture transmission to the cathode surface via the clayware membranes was consequently amended the wastewater treatment proficiency of air-cathode MFCs.
The investigation of the effect of prominent factors on the performance of MFCs
The thickness of ceramic separators
The thickness of ceramic membrane has been investigated in several MFC studies (Salar-García et al. 2019; Winfield et al. 2016; Yousefi, Mohebbi-Kalhori, and Samimi 2017). The higher thickness of ceramic resulted in the increment of the distance between the anode and the cathode electrodes, thereby increasing the ohmic losses of MFCs. However, some researchers reported that the thicker ceramic membrane did not necessarily cause lower electrical productivity in the MFC systems. In this respect, Winfield et al. (2013) indicated that the MFC with the thicker earthenware separator outperformed the thinner terracotta membranes owing to the greater water absorption capacity, which can significantly assist the proton conductivity of the earthenware membrane. Similarly, the investigation of the performance of ceramic-based MFCs using the EIS analysis confirmed that raising the thickness of ceramic separators has not an inevitably adverse effect on the electricity generation yield of MFC systems. Although the utilization of the thicker ceramic increased the ohmic resistance, the charge transfer resistance was decreased compared to the values obtained by thinner ceramics, probably owing to the superior oxygen barrier capability and hence the better accommodation of the anodic biofilm in the case of the thicker ceramic membrane (Yousefi, Mohebbi-Kalhori, and Samimi 2019).
In the present study, the statistical results indicate the significance of ceramic thickness on power production (P-value = 0.0006) and CE (P-value = 0.0126) of the MFCs. However, a comparison of the P-values for all the influencing parameters cleared that the importance of thickness (A) is lower than the other parameters, including the porosity (B), the SiO2 (C), and Al2O3 (D) contents of the ceramic membranes (Tables 3 and 4).
Figure 4 exhibits the thickness effect of different investigated ceramics on the MPD and CE of MFCs. As can be seen, the performance of different ceramic types has not similar trend regarding their thicknesses. The MPD and CE of MFC-Y (ceramic porosity of 28.9%) are amended from 43.09 to 56.91 mW/m2, and from 11.1 to 27.6%, respectively. Similarly, for the most porous unglazed wall ceramic (UGWC, porosity of 30.45%), both MPD and CE responses are enhanced from 225.07 to 321.11 mW/m2 and from 51% to 68%, respectively, by increasing the ceramic thickness from 3 to 9 mm. Likewise, the current densities of these extensively porous ceramics are boosted, from 359.91 to 473.26 mA/m2 for MFC-Y and from 1067.7 to 1433.89 mA/m2 for MFC-UGWC, by thickening of the ceramic membranes. While for the denser unglazed floor ceramic (UGFC, porosity of 11%), both the MPD and CE values have been reduced from 106.89 mW/m2 and 29% to 57.65 mW/m2 and 18.3%, respectively, by elevating the ceramic thickness from 3 to 6 mm. These differences in the MFC performance alteration regarding the ceramic thickness are probably related to the different oxygen blockage capabilities of ceramics with distinct porosities. In such a way that elevating the ceramic thickness of highly porous ceramics limited the oxygen transmission through the membrane, hence the MFC performance was improved as a result of providing a more anoxic anodic compartment. Whereas in the case of the denser ceramic separator with tolerable oxygen barrier ability, the overall performance of the MFC has been diminished owing to raising the electrode’s distance and ohmic resistance by amplifying the thickness.
![Figure 4:
The effect of ceramic thickness on the maximum power density (MPD (mW/m2), columns in the chart, left axis) and the coulombic efficiency (CE [%], dashed lines in the chart, right axis) for three different ceramic types (Yellow ceramic, MFC-Y, Red columns, and lines), unglazed wall ceramic (UGWC, blue columns, and purple lines), and unglazed floor ceramic (UGFC, green columns, and lines)).](/document/doi/10.1515/ehs-2021-0073/asset/graphic/j_ehs-2021-0073_fig_014.jpg)
The effect of ceramic thickness on the maximum power density (MPD (mW/m2), columns in the chart, left axis) and the coulombic efficiency (CE [%], dashed lines in the chart, right axis) for three different ceramic types (Yellow ceramic, MFC-Y, Red columns, and lines), unglazed wall ceramic (UGWC, blue columns, and purple lines), and unglazed floor ceramic (UGFC, green columns, and lines)).
The porosity of ceramic separators
The selection of appropriate porosity for the ceramic separator is of great importance for the efficient performance of MFCs. Though the employment of a highly porous ceramic membrane may result in excess oxygen and substrate leakage between the MFC chambers, it could ensure an adequate proton transfer through the membrane via the vehicular mechanism.
Though a highly porous ceramic separator may result in excess oxygen and substrate leakage between the MFC chambers, having a ceramic with sufficient porosity can ensure an adequate proton transfer through the membrane via the vehicular mechanism (Yousefi, Mohebbi-Kalhori, and Samimi 2017). In this context, Ghadge and Ghangrekar (2015) reported that the very porous clayware separator produced an inadequate CE and volumetric PD owing to the uncontrolled oxygen and substrate crossovers between the MFC chambers. In contrast, Pasternak et al., who studied the performance of four different ceramics as the separator of MFCs, observed the lowest power productivity for the most compact membrane (Alumina, porosity <1%). Besides the insufficient proton conductivity of the Alumina membrane, it has an extremely low porosity which hinders the water hydration of the air-cathode surface, and subsequently, the overall MFC performance was declined (Pasternak, Greenman, and Ieropoulos 2016).
In the current study, the results of the statistical analysis confirmed the significant effect of porosity on the power production (P-value<0.0001) and the CE (P-value<0.0001) of MFCs (Tables 3 and 4). Figure 5 depicts the effect of different porosities of ceramics on the MFC performance. The value of MPD is marginally enhanced by increasing the porosity from 21.45% (for the Red ceramic) to 28.94% (for the Yellow ceramic), subsequently, it has been ascended sharply for higher porosity of 30.45% (for UGWC). The CE of the MFCs has a rather similar trend, except for the minor decrease for the yellow ceramic (28.94%). However, it must be considered that these different porosities are attributed to the various ceramics with dissimilar chemical compositions and specifications. Therefore, the overperformance of the UGWC compared to the other ceramics may ascribe to its different chemical composition and proton conductivity, not to its higher porosity.
![Figure 5:
The effect of ceramic porosity on the maximum power density (MPD, the columns in the chart, left axis) and the coulombic efficiency (CE [%], red dashed lines in the chart, right axis); different porosities are attributed to distinct ceramic types: the Red ceramic (MFC-R, 21.45%), the Yellow ceramic (MFC-Y, 28.94%), and the unglazed wall ceramic (UGWC, 30.45%).](/document/doi/10.1515/ehs-2021-0073/asset/graphic/j_ehs-2021-0073_fig_015.jpg)
The effect of ceramic porosity on the maximum power density (MPD, the columns in the chart, left axis) and the coulombic efficiency (CE [%], red dashed lines in the chart, right axis); different porosities are attributed to distinct ceramic types: the Red ceramic (MFC-R, 21.45%), the Yellow ceramic (MFC-Y, 28.94%), and the unglazed wall ceramic (UGWC, 30.45%).
The chemical composition of ceramic membranes
The chemical composition, type, and amount of clay minerals that have been used for ceramic production have an inevitable effect on the applicability of ceramics as the membrane of MFCs. The total amount of exchangeable cations in the soil, i.e., the cation exchange capacity (CEC), is directly correlated with the proton conductivity of ceramic membranes. The results of statistical analysis indicate that the concentration of SiO2 (C) and Al2O3 (D) has a significant effect (P-value<0.0001) on the power generation and the CE of the MFCs. While, the concentration of the other components, including Fe2O3, K2O, CaO, MgO, and TiO2, does not recognize as significant parameters (Tables 3 and 4). Therefore, the relative importance of the silica and aluminum contents on the proton conduction rate of ceramics, consequently, on the overall performance of MFCs, is revealed.
In this respect, Ghadge et al. (2014) observed that the ceramic made of the red soil (rich in aluminum and silica) generated a higher volumetric PD compared to the black soil clayware (containing more calcium, iron, and magnesium). Pasternak, Greenman, and Ieropoulos (2016) have investigated the applicability of four distinct ceramics as the MFC separators. They obtained higher power proficiency for the Earthenware and pyrophyllite ceramics which contained more silica concentrations. Moreover, Raychaudhuri et al. employed the modified clayware ceramic membranes with different silica contents. They gained not only a higher volumetric PD (60.4%) and CE (48.5%) for the modified ceramics (30% silica) compared to the bare clayware membrane, but also the COD and phenol removal efficiencies had inevitable improvements, subsequently. They concluded that the addition of hygroscopic silica modifiers enhanced the hydration properties and thereby the proton conductivity of soil which has a critical role in lowering the internal resistance and boosting the power productivity of the MFCs (Raychaudhuri, Sahoo, and Behera 2021). Cheraghipour et al. studied the effect of SiO2 addition into two samples of acid-leached and un-processed native soil implemented for ceramic fabrication. The augmentation of non-leached Kalporgan soil with 30% SiO2 eventuated an extreme decrease in internal resistance from 977.36 to 115.96 Ω, boosting the power density by 15 folds and improving the CE from 27 to 79%. However, considering the supereminent increase in the micro-porosity of the ceramic during the acid leaching modification, the addition of silica did not show a drastic enhancement of the MFC performance in the case of the acid-leached soil (Cheraghipoor et al. 2021).
The effect of ceramic composition on the MPD and CE of the MFCs with different thicknesses of 9 mm and 6 mm are represented in Figure 6A and B. Seemingly, the MPD and CE values did not alter significantly (P-value<0.05) by the increase of SiO2 content of ceramics from 65.70 to 68.46%, but further increasing the SiO2 weight percent to 72.46%, obviously enhanced the MPD and the CE of the MFCs for both the 9 and 6 mm thick ceramics. The investigation of the slope of polarization curves for the MFCs with different SiO2 contents (Figure 1C and D) revealed that increasing the silica content of ceramics resulted in the decrement of internal resistance (Table 2), probably owing to the enhancement of proton conductivity. The internal resistance of 635.2 Ω for the Red ceramic (MFC-R, 9 mm) with the lowest silica content (65.7 w/w%) has been reduced to the value of 559.3 Ω for the Yellow ceramic (MFC-Y, 9 mm) with 68.46 w/w% of silica. Further increment of SiO2 content to 72.46 w/w% for the UGWC eventuated in the lowest internal resistance of 100.6 Ω among the 9 mm thick ceramics. This reduction of internal resistance may attribute to the elevated proton conductivity of ceramic separators because of a higher amount of SiO2 in the ceramic composition. However, the definite influence of the silica content of ceramics on the internal resistance constituents, i.e., the ohmic, the charge transfer, and the diffusional impedances, could be determined using EIS analysis.
![Figure 6:
The effect of SiO2 and Al2O3 contents of ceramic membranes on the maximum power density (MPD (mW/m2), the blue columns in the charts, left axis) and the coulombic efficiency (CE [%], red dashed lines in the charts, right axis); (A) Thickness = 9 mm, (B) Thickness = 6 mm.](/document/doi/10.1515/ehs-2021-0073/asset/graphic/j_ehs-2021-0073_fig_016.jpg)
The effect of SiO2 and Al2O3 contents of ceramic membranes on the maximum power density (MPD (mW/m2), the blue columns in the charts, left axis) and the coulombic efficiency (CE [%], red dashed lines in the charts, right axis); (A) Thickness = 9 mm, (B) Thickness = 6 mm.
Conclusions
The combined effect of prominent physical and chemical specifications of ceramics on the power production and CE of MFCs has been investigated by ANOVA analysis. The thickness and porosity of ceramics and the concentration (w/w%) of SiO2 and Al2O3 are statistically significant (P-value <0.05). While, the concentration of other components of ceramics (including the Fe2O3, K2O, CaO, MgO, and TiO2) have no significant contribution to the power productivity and CE of the MFCs with 95% confidence. Moreover, the interactions between the thickness and porosity (AB) and between the thickness and SiO2 content of ceramics (AC) have a significant effect on the power generation of MFC systems. Increasing the thickness for highly porous ceramic membranes, i.e., MFC-Y (the porosity of 28.94%) and UGWC (30.45% porosity), improved the power production and CE due to the delimitation of the excess oxygen transportation through the ceramic pores providing a more anaerobic anodic environment for the growth of exo-electrogenic bacteria. Whereas, raising the thickness of the densest ceramic (UGFC, the porosity of 11%) was decreased the power production and CE of the MFC systems, owing to the unnecessary increasing the electrode distance. Furthermore, increasing the SiO2 content and simultaneously reducing the Al2O3 concentration of ceramics was immensely improved the MFC performance regards both power generation and CE.
Funding source: University of Sistan and Baluchestan http://dx.doi.org/10.13039/501100018730
Award Identifier / Grant number: 932/2/1006
Award Identifier / Grant number: Grant number 932/2/1006
-
Author contributions: The author has accepted responsibility for the entire content of this submitted manuscript and approved submission.
-
Research funding: This research was supported by the University of Sistan and Baluchestan (Grant number 932/2/1006).
-
Conflict of interest statement: The author declares no conflicts of interest regarding this article.
References
Ahilan, V., M. Wilhelm, and K. Rezwan. 2018. “Porous Polymer Derived Ceramic (PDC)-montmorillonite-H3PMo12O40/SiO2 Composite Membranes for Microbial Fuel Cell (MFC) Application.” Ceramics International 44 (16): 19191–9, https://doi.org/10.1016/j.ceramint.2018.07.138.Search in Google Scholar
Ahmad, A., M. Priyadarshani, S. Das, and M. M. Ghangrekar. 2021. “Role of Bioelectrochemical Systems for the Remediation of Emerging Contaminants from Wastewater: A Review.” Journal of Basic Microbiology 62 (3–4): 201–22, doi:https://doi.org/10.1002/jobm.202100368.Search in Google Scholar PubMed
Cheraghipoor, M., D. Mohebbi-Kalhori, M. Noroozifar, and M. T. Maghsoodlou. 2019. “Comparative Study of Bioelectricity Generation in a Microbial Fuel Cell Using Ceramic Membranes Made of Ceramic Powder, Kalporgan’s Soil, and Acid Leached Kalporgan’s Soil.” Energy 178: 368–77, https://doi.org/10.1016/j.energy.2019.04.124.Search in Google Scholar
Cheraghipoor, M., D. Mohebbi-Kalhori, M. Noroozifar, and M. T. Maghsoodlou. 2021. “Production of Greener Energy in Microbial Fuel Cell with Ceramic Separator Fabricated Using Native Soils: Effect of Lattice and Porous SiO2.” Fuel 284: 118938, https://doi.org/10.1016/j.fuel.2020.118938.Search in Google Scholar
Dange, P., N. Savla, S. Pandit, R. Bobba, S.-P. Jung, P.-K. Gupta, M. Sahni, and R. Prasad. 2022. “A Comprehensive Review on Oxygen Reduction Reaction in Microbial Fuel Cells.” Journal of Renewable Materials 10 (3): 665–97.10.32604/jrm.2022.015806Search in Google Scholar
Das, I., S. Das, S. Sharma, and M. M. Ghangrekar. 2020. “Ameliorated Performance of a Microbial Fuel Cell Operated with an Alkali Pre-treated Clayware Ceramic Membrane.” International Journal of Hydrogen Energy 45 (33): 16787–98, https://doi.org/10.1016/j.ijhydene.2020.04.157.Search in Google Scholar
Gajda, I., J. Greenman, and I. A. Ieropoulos. 2018. “Recent Advancements in Real-World Microbial Fuel Cell Applications.” Current Opinion in Electrochemistry 11: 78–83, https://doi.org/10.1016/j.coelec.2018.09.006.Search in Google Scholar PubMed PubMed Central
Ghadge, A. N., and M. M. Ghangrekar. 2015. “Development of Low Cost Ceramic Separator Using Mineral Cation Exchanger to Enhance Performance of Microbial Fuel Cells.” Electrochimica Acta 166: 320–8.10.1016/j.electacta.2015.03.105Search in Google Scholar
Gurung, A., J. Kim, S. Jung, B.-H. Jeon, J. E. Yang, and S.-E. Oh. 2012. “Effects of Substrate Concentrations on Performance of Serially Connected Microbial Fuel Cells (MFCs) Operated in a Continuous Mode.” Biotechnology Letters 34 (10): 1833–9, https://doi.org/10.1007/s10529-012-0979-3.Search in Google Scholar PubMed
Ghadge, A. N., M. Sreemannarayana, N. Duteanu, and M. M. Ghangrekar. 2014. “Influence of Ceramic Separator’s Characteristics on Microbial Fuel Cell Performance.” Journal of Electrochemical Science and Engineering 4 (4): 315–26.10.5599/jese.2014.0047Search in Google Scholar
İssi, A., N. Derin Coşkun, V. Tiryaki, and V. Uz. 2017. “Casting and Sintering of a Sanitaryware Body Containing Fine Fire Clay (FFC).” Journal of the Australian Ceramic Society 53 (1): 157–62.10.1007/s41779-016-0020-8Search in Google Scholar
James, A. 2022. “Ceramic-microbial Fuel Cell (C-MFC) for Waste Water Treatment: A Mini Review.” Environmental Research 210: 112963, https://doi.org/10.1016/j.envres.2022.112963.Search in Google Scholar PubMed
Jung, S.-H., Y.-H. Ahn, S.-E. Oh, J.-H. Lee, K.-T. Cho, Y.-J. Kim, M.-W. Kim, J.-M. Shim, and M.-S. Kang. 2012. “Impedance and Thermodynamic Analysis of Bioanode, Abiotic Anode, and Riboflavin-Amended Anode in Microbial Fuel Cells.” Bulletin of the Korean Chemical Society 33 (10): 3349–54, https://doi.org/10.5012/BKCS.2012.33.10.3349.Search in Google Scholar
Jung, S. 2012. “Impedance Analysis of Geobacter Sulfurreducens PCA, Shewanella Oneidensis MR-1, and Their Coculture in Bioeletrochemical Systems.” International Journal of Electrochemical Science 7: 11091–100, https://doi.org/10.6084/m9.figshare.16768795.v1.Search in Google Scholar
Jung, S. P., and S. Pandit. 2019. “Chapter 3.1 - Important Factors Influencing Microbial Fuel Cell Performance.” In Microbial Electrochemical Technology, edited by S. V. Mohan, S. Varjani, and A. Pandey, 377–406. Amsterdam: Elsevier.10.1016/B978-0-444-64052-9.00015-7Search in Google Scholar
Jung, S., and J. M. Regan. 2007. “Comparison of Anode Bacterial Communities and Performance in Microbial Fuel Cells with Different Electron Donors.” Applied Microbiology and Biotechnology 77 (2): 393–402, https://doi.org/10.1007/s00253-007-1162-y.Search in Google Scholar PubMed
Jung, S., and J. M. Regan 2011. “Influence of External Resistance on Electrogenesis, Methanogenesis, and Anode Prokaryotic Communities in Microbial Fuel Cells.” Applied and Environmental Microbiology 77 (2): 564–71, https://doi.org/10.1128/AEM.01392-10.Search in Google Scholar PubMed PubMed Central
Jung, S., M. M. Mench, and J. M. Regan. 2011. “Impedance Characteristics and Polarization Behavior of a Microbial Fuel Cell in Response to Short-Term Changes in Medium pH.” Environmental Science & Technology 45 (20): 9069–74, https://doi.org/10.1021/es201737g.Search in Google Scholar PubMed
Jung, S. P., E. Kim, and B. Koo. 2018. “Effects of Wire-type and Mesh-type Anode Current Collectors on Performance and Electrochemistry of Microbial Fuel Cells.” Chemosphere 209: 542–50, https://doi.org/10.1016/j.chemosphere.2018.06.070.Search in Google Scholar PubMed
Kang, H., J. Jeong, P. L. Gupta, and S. P. Jung. 2017. “Effects of Brush-Anode Configurations on Performance and Electrochemistry of Microbial Fuel Cells.” International Journal of Hydrogen Energy 42 (45): 27693–700, https://doi.org/10.1016/j.ijhydene.2017.06.181.Search in Google Scholar
Khalili, H.-B., D. Mohebbi-Kalhori, and M. S. Afarani. 2017. “Microbial Fuel Cell (MFC) Using Commercially Available Unglazed Ceramic Wares: Low-Cost Ceramic Separators Suitable for Scale-Up.” International Journal of Hydrogen Energy 42 (12): 8233–41, https://doi.org/10.1016/j.ijhydene.2017.02.095.Search in Google Scholar
Koo, B., and S. P. Jung. 2021. “Improvement of Air Cathode Performance in Microbial Fuel Cells by Using Catalysts Made by Binding Metal-Organic Framework and Activated Carbon through Ultrasonication and Solution Precipitation.” Chemical Engineering Journal 424: 130388, https://doi.org/10.1016/j.cej.2021.130388.Search in Google Scholar
Koo, B., S.-M. Lee, S.-E. Oh, E. J. Kim, Y. Hwang, D. Seo, J. Y. Kim, Y. H. Kahng, Y. W. Lee, S.-Y. Chung, S.-J. Kim, J. H. Park, and S. P. Jung. 2019. “Addition of Reduced Graphene Oxide to an Activated-Carbon Cathode Increases Electrical Power Generation of a Microbial Fuel Cell by Enhancing Cathodic Performance.” Electrochimica Acta 297: 613–22, https://doi.org/10.1016/j.electacta.2018.12.024.Search in Google Scholar
Logan, B. E. 2008. Microbial Fuel Cells. New Jersey: John Wiley & Sons.10.1002/9780470258590Search in Google Scholar
Logan, B. E., B. Hamelers, R. Rozendal, U. Schroder, J. Keller, S. Freguia, P. Aelterman, W. Verstraete, and K. Rabaey. 2006. “Microbial Fuel Cells: Methodology and Technology.” Environmental Science & Technology 40 (17): 5181–92, https://doi.org/10.1021/es0605016.Search in Google Scholar PubMed
Merino-Jimenez, I., F. Gonzalez-Juarez, J. Greenman, and I. Ieropoulos. 2019. “Effect of the Ceramic Membrane Properties on the Microbial Fuel Cell Power Output and Catholyte Generation.” Journal of Power Sources 429: 30–7, https://doi.org/10.1016/j.jpowsour.2019.04.043.Search in Google Scholar PubMed PubMed Central
Nam, T., H. Kang, S. Pandit, S.-H. Kim, S. Yoon, S. Bae, and S. P. Jung. 2020. “Effects of Vertical and Horizontal Configurations of Different Numbers of Brush Anodes on Performance and Electrochemistry of Microbial Fuel Cells.” Journal of Cleaner Production 277: 124125, https://doi.org/10.1016/j.jclepro.2020.124125.Search in Google Scholar
Nam, T., S. Son, B. Koo, H. V. Hoa Tran, J. R. Kim, Y. Choi, and S. P. Jung. 2017. “Comparative Evaluation of Performance and Electrochemistry of Microbial Fuel Cells with Different Anode Structures and Materials.” International Journal of Hydrogen Energy 42 (45): 27677–84, https://doi.org/10.1016/j.ijhydene.2017.07.180.Search in Google Scholar
Nam, T., S. Son, E. Kim, H. V. H. Tran, B. Koo, H. Chai, J. Kim, S. Pandit, A. Gurung, S.-E. Oh, E. J. Kim, Y. Choi, and S. P. Jung. 2018. “Improved Structures of Stainless Steel Current Collector Increase Power Generation of Microbial Fuel Cells by Decreasing Cathodic Charge Transfer Impedance.” Environmental Engineering Research 23 (4): 383–9, https://doi.org/10.4491/eer.2017.171.Search in Google Scholar
Pandit, S., N. Savla, and S. P. Jung. 2020. “16 - Recent Advancements in Scaling up Microbial Fuel Cells.” In Integrated Microbial Fuel Cells for Wastewater Treatment, edited by R. Abbassi, A. K. Yadav, F. Khan, and V. Garaniya, 349–68. Oxford: Butterworth-Heinemann.10.1016/B978-0-12-817493-7.00016-3Search in Google Scholar
Pandit, S., N. Savla, J. M. Sonawane, A. M. D. Sani, P. K. Gupta, A. S. Mathuriya, A. K. Rai, D. A. Jadhav, S. P. Jung, and R. Prasad. 2021. “Agricultural Waste and Wastewater as Feedstock for Bioelectricity Generation Using Microbial Fuel Cells: Recent Advances.” Fermentation 7 (3): 169.10.3390/fermentation7030169Search in Google Scholar
Pasternak, G., J. Greenman, and I. Ieropoulos. 2016. “Comprehensive Study on Ceramic Membranes for Low-Cost Microbial Fuel Cells.” ChemSusChem 9 (1): 88–96, https://doi.org/10.1002/cssc.201501320.Search in Google Scholar PubMed PubMed Central
Priyadarshini, M., A. Ahmad, S. Das, and M. M. Ghangrekar. 2021. “Metal Organic Frameworks as Emergent Oxygen-Reducing Cathode Catalysts for Microbial Fuel Cells: A Review.” International Journal of Environmental Science and Technology, https://doi.org/10.1007/s13762-021-03499-5.Search in Google Scholar
Raychaudhuri, A., and M. Behera 2020. “Review of the Process Optimization in Microbial Fuel Cell Using Design of Experiment Methodology.” Journal of Hazardous, Toxic, and Radioactive Waste 24 (3): 04020013, https://doi.org/10.1061/(ASCE)HZ.2153-5515.0000503.Search in Google Scholar
Raychaudhuri, A., R. N. Sahoo, and M. Behera. 2021. “Application of Clayware Ceramic Separator Modified with Silica in Microbial Fuel Cell for Bioelectricity Generation during Rice Mill Wastewater Treatment.” Water Science and Technology 84 (1): 66–76, https://doi.org/10.2166/wst.2021.213.Search in Google Scholar PubMed
Rodríguez, J., L. Mais, R. Campana, L. Piroddi, M. Mascia, J. Gurauskis, A. Vacca, and S. Palmas. 2021. “Comprehensive Characterization of a Cost-Effective Microbial Fuel Cell with Pt-Free Catalyst Cathode and Slip-Casted Ceramic Membrane.” International Journal of Hydrogen Energy 46 (51): 26205–23, doi:https://doi.org/10.1016/j.ijhydene.2021.01.066.Search in Google Scholar
Rozendal, R. A., H. V. M. Hamelers, K. Rabaey, J. Keller, and C. J. N. Buisman. 2008. “Towards Practical Implementation of Bioelectrochemical Wastewater Treatment.” Trends in Biotechnology 26 (8): 450–9, https://doi.org/10.1016/j.tibtech.2008.04.008.Search in Google Scholar PubMed
Salar-García, M. J., A. de Ramón-Fernández, V. M. Ortiz-Martínez, D. Ruiz-Fernández, and I. Ieropoulos. 2019. “Towards the Optimisation of Ceramic-Based Microbial Fuel Cells: A Three-Factor Three-Level Response Surface Analysis Design.” Biochemical Engineering Journal 144: 119–24, https://doi.org/10.1016/j.bej.2019.01.015.Search in Google Scholar PubMed PubMed Central
Salar-García, M. J., X. A. Walter, J. Gurauskis, A. de Ramón Fernández, and I. Ieropoulos. 2021. “Effect of Iron Oxide Content and Microstructural Porosity on the Performance of Ceramic Membranes as Microbial Fuel Cell Separators.” Electrochimica Acta 367: 137385, https://doi.org/10.1016/j.electacta.2020.137385.Search in Google Scholar PubMed PubMed Central
Saleiro, G., and J. Holanda. 2012. “Processing of Red Ceramic Using a Fast-Firing Cycle.” Cerâmica 58 (347): 393–9.10.1590/S0366-69132012000300018Search in Google Scholar
Savla, N., S. Khilari, S. Pandit, and S. P. Jung. 2020a. “Effective Cathode Catalysts for Oxygen Reduction Reactions in Microbial Fuel Cell.” In Bioelectrochemical Systems: Vol. 1 Principles and Processes, edited by P. Kumar, and C. Kuppam, 189–210. Singapore: Springer Singapore.10.1007/978-981-15-6872-5_9Search in Google Scholar
Savla, N., S. Pandit, N. Khanna, A. S. Mathuriya, and S. P. Jung. 2020b. “Microbially Powered Electrochemical Systems Coupled with Membrane-Based Technology for Sustainable Desalination and Efficient Wastewater Treatment.” Journal of Korean Society of Environmental Engineers 42 (7): 360–80, https://doi.org/10.4491/KSEE.2020.42.7.360.Search in Google Scholar
Sugumar, M., and S. Dharmalingam. 2022. “Statistical Assessment of Operational Parameters Using Optimized Sulphonated Titanium Nanotubes Incorporated Sulphonated Polystyrene Ethylene Butylene Polystyrene Nanocomposite Membrane for Efficient Electricity Generation in Microbial Fuel Cell.” Energy 242: 123000, https://doi.org/10.1016/j.energy.2021.123000.Search in Google Scholar
Sugumar, M., V. Kugarajah, and S. Dharmalingam. 2022. “Optimization of Operational Factors Using Statistical Design and Analysis of Nanofiller Incorporated Polymer Electrolyte Membrane towards Performance Enhancement of Microbial Fuel Cell.” Process Safety and Environmental Protection 158: 474–85, https://doi.org/10.1016/j.psep.2021.12.018.Search in Google Scholar
Tan, W. H., S. Chong, H.-W. Fang, K.-L. Pan, M. Mohamad, J. W. Lim, T. J. Tiong, Y. J. Chan, C.-M. Huang, and T. C.-K. Yang. 2021. “Microbial Fuel Cell Technology—A Critical Review on Scale-Up Issues.” Processes 9 (6): 985, https://doi.org/10.3390/pr9060985.Search in Google Scholar
Tran, V. H. H., E. Kim, and S. P. Jung. 2022. “Anode Biofilm Maturation Time, Stable Cell Performance Time, and Time-Course Electrochemistry in a Single-Chamber Microbial Fuel Cell with a Brush-Anode.” Journal of Industrial and Engineering Chemistry 106: 269–78, https://doi.org/10.1016/j.jiec.2021.11.001.Search in Google Scholar
Winfield, J., I. Gajda, J. Greenman, and I. Ieropoulos. 2016. “A Review into the Use of Ceramics in Microbial Fuel Cells.” Bioresource Technology 215: 296–303, https://doi.org/10.1016/j.biortech.2016.03.135.Search in Google Scholar PubMed
Winfield, J., J. Greenman, D. Huson, and I. Ieropoulos. 2013. “Comparing Terracotta and Earthenware for Multiple Functionalities in Microbial Fuel Cells.” Bioprocess and Biosystems Engineering 36 (12): 1913–21, https://doi.org/10.1007/s00449-013-0967-6.Search in Google Scholar PubMed
Yousefi, V., D. Mohebbi-Kalhori, A. Samimi, and M. Salari. 2016. “Effect of Separator Electrode Assembly (SEA) Design and Mode of Operation on the Performance of Continuous Tubular Microbial Fuel Cells (MFCs).” International Journal of Hydrogen Energy 41 (1): 597–606, https://doi.org/10.1016/j.ijhydene.2015.11.018.Search in Google Scholar
Yousefi, V., D. Mohebbi-kalhori, and A. Samimi. 2017a. Domestic Wastewater Treatment in Microbial Fuelcell by Using Commercial Unglazed Wall Ceramic as Proton Exchange Membrane. Paper Presented at the First International Joint Conference on New Trends in Biotechnology.Iran.Search in Google Scholar
Yousefi, V., D. Mohebbi-Kalhori, and A. Samimi. 2017b. “Ceramic-based Microbial Fuel Cells (MFCs): A Review.” International Journal of Hydrogen Energy 42 (3): 1672–90, https://doi.org/10.1016/j.ijhydene.2016.06.054.Search in Google Scholar
Yousefi, V., D. Mohebbi-Kalhori, and A. Samimi. 2018. “Application of Layer-By-Layer Assembled Chitosan/montmorillonite Nanocomposite as Oxygen Barrier Film over the Ceramic Separator of the Microbial Fuel Cell.” Electrochimica Acta 283: 234–47, https://doi.org/10.1016/j.electacta.2018.06.173.Search in Google Scholar
Yousefi, V., D. Mohebbi-Kalhori, and A. Samimi. 2019. “Equivalent Electrical Circuit Modeling of Ceramic-Based Microbial Fuel Cells Using the Electrochemical Impedance Spectroscopy (EIS) Analysis.” Journal of Renewable Energy and Environment 6 (1): 21–8.Search in Google Scholar
Yousefi, V., D. Mohebbi-Kalhori, and A. Samimi. 2020. “Start-up Investigation of the Self-Assembled Chitosan/montmorillonite Nanocomposite over the Ceramic Support as a Low-Cost Membrane for Microbial Fuel Cell Application.” International Journal of Hydrogen Energy 45 (7): 4804–20, https://doi.org/10.1016/j.ijhydene.2019.11.216.Search in Google Scholar
© 2022 Walter de Gruyter GmbH, Berlin/Boston
Articles in the same Issue
- Frontmatter
- Research Articles
- Progress in smart industrial control applied to renewable energy system
- Multi-level energy efficient cooperative scheme for ring based clustering in wireless sensor network
- Optimizing of hybrid renewable photovoltaic/wind turbine/super capacitor for improving self-sustainability
- Feasibility study of a self-consumption photovoltaic installation with and without battery storage, optimization of night lighting and introduction to the application of the DALI protocol at the University of Ibn Tofail (ENSA/ENCG), Kenitra – Morocco
- Regenerative shock absorber using cylindrical cam and slot motion conversion
- Energy efficiency measures and technical-economic study of a photovoltaic self-consumption installation at ENSA Kenitra, Morocco
- The investigation of ferro resonance voltage fluctuation considering load types and damping factors
- Review
- Methods for estimating lithium-ion battery state of charge for use in electric vehicles: a review
- Research Articles
- Experimental investigation for the estimation of the intensity of solar irradiance on oblique surfaces by means of various models
- Statistical investigation of pivotal physical and chemical factors on the performance of ceramic-based microbial fuel cells