Possible Applications of Nanomaterials for Nuclear Fusion Devices
-
Takeo Oku


Abstract
Conditions of nuclear fusion and nuclear fusion devices were described, and some possible applications of nanomaterials for nuclear fusion devices were presented in the present article. Muon-catalyzed fusion is one of methods for nuclear fusion to cause even at room temperature or lower, and protons or heavy ions with huge energy are irradiated to metals such as beryllium or copper, which results in emission of negative or positive charged muons from the metals. An experiment using a pyroelectric power source using lithium tantalite crystal was also reported to achieve nuclear fusion in a desktop-like device. Hydrogen storage is also important for the fusion devices, and the possibility of hydrogen storage in hydrogen storage metallic alloys was studied by diffusion calculation and potential calculation of deuterium fusion. Enhancement of deuterium diffusion in the Pd alloys would be one of the key points for energy materials. Carbon(C)/copper(Cu)-based composite materials with high thermal conductivity and good stability at high temperatures were also developed by adding a small amount of titanium, which has a low enthalpy of alloy formation with C and Cu. These carbon-based materials could be a candidate material for the plasma facing components of fusion devices.
1 Introduction
One of serious issues in natural environment is global warming due to carbon dioxides (CO2), and developments of new energy to surpass conventional fossil fuel have become an important issue. Although solar cells are one of the important methods for solving the energy problems (Oku 2017), energy densities of solar cells are not so high. On the other hands, nuclear fusion produces high energy density, and forms no CO2. Therefore, the nuclear fusion energy is expected as one of the substitutes of fossil fuel in twenty-first century. In the present article, conditions of nuclear fusion and nuclear fusion devices were described, and some possible applications of nanomaterials for nuclear fusion devices were presented.
2 Nuclear Fusion in the Sun
The sun, which provides us with light and energy that is essential for our lives, is one of 2×10¹¹ fixed stars in the galaxy. The sun is a gigantic hydrogen sphere and has a radius (RSun=70×104 km) one hundred times larger than earth’s. Energy emission (L) from the sun is 3.85×1026 W, and its mass M is 2×1030 kg. When the sun was formed 4.5 billion years ago, gravitational energy E was released by its mass M becoming concentrated in one position.
G is a constant of gravitation which corresponds to the energy of one ion or an electron of ~1 keV (~7.7 million K). The current temperature of the core of the sun is estimated to be 16 million K, which is produced by gravitational action. Atoms are divided into electrons and nuclei, which means that the sun is a huge, high-density plasma sphere. The density of the core of the sun is ~160 g cm−3, and half of the mass of the sun is concentrated within one fourth of the radius of the sun.
The nucleus has a positive charge, and nuclei repulse when close to each other. If a kinetic energy higher than the repulsive force is added to the nucleus, two nuclei can collide and become one nucleus through what is called a nuclear fusion reaction. The difference between the binding energy before and after the reaction is emitted as what is called nuclear fusion energy.
In the sun and other fixed stars, a part of their mass is transformed into energy according to the equation of E=mc2. When two protons (p) are fused, 2He might be formed. However, 2He is unstable and emits a positron (e+) to form a neutron (n), which binds with another proton to form deuteron (D) and to emit energy in the amount of 0.42 MeV and an electron neutrino (νe), indicated as follows:
In the first fusion reaction, which took place at the beginning of the universe, deuteron was formed from two proton through the same process that is shown in Figure 1. Since the temperature of the sun is low, this pp fusion reaction is an extremely slow reaction with a time constant of ~10 billion years. A positron binds with an electron immediately to emit an energy of 1.02 MeV. The produced deuteron fuses with proton to form 3He and to emit gamma rays (γ), as follows:
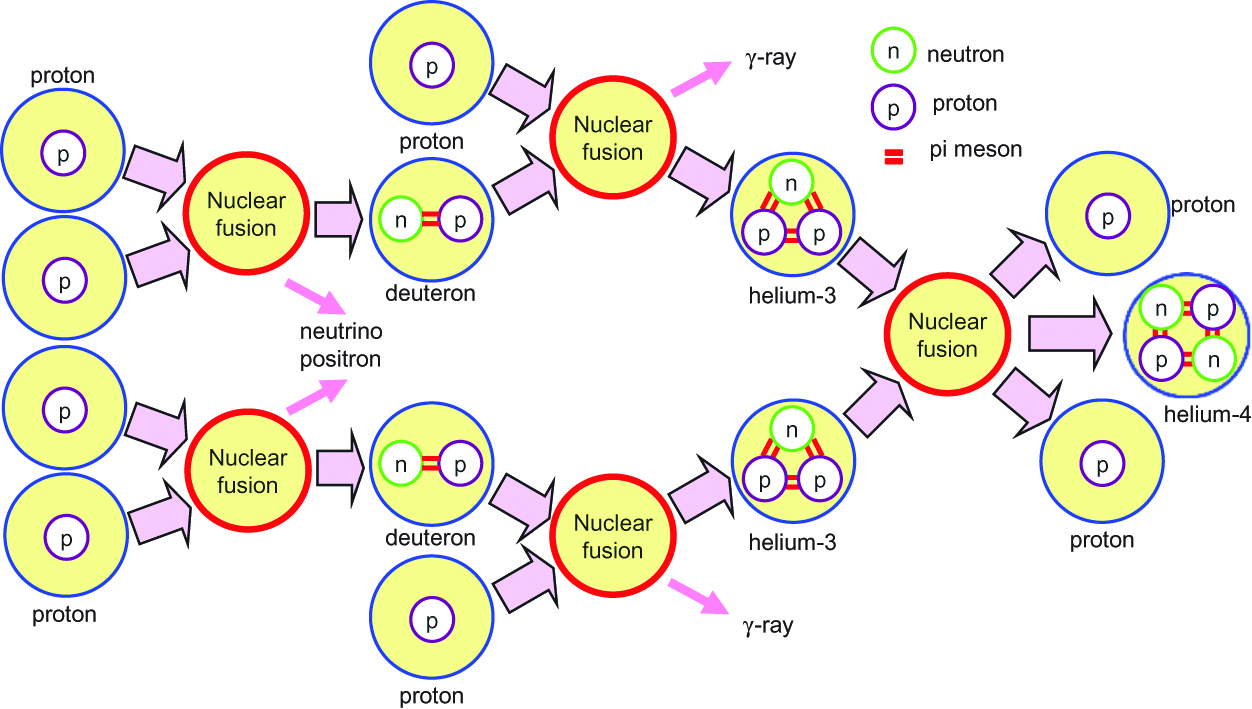
Nuclear fusion at the center of the Sun.
Then, one
In summary,
The energy generated from a proton is 6.55 MeV (26.46/4 MeV) excluding the energy of 0.26 MeV taken away by a neutrino. The enormous number of hydrogen nuclei produced at the beginning of the universe fuse at the center of fixed stars. The combustion efficiency of a proton at the center of the Sun is L/6.55 MeV=3.7×1038 s−1, and protons of 6.2×10¹¹ kg s−1 are transformed into 4He. The mass transformed into energy is 4.4×10⁹ kg s−1, and 6% of protons in the Sun have been consumed over the course of 4.5 billion years. The energy generated at the center arrives at the surface of the sun through radiation and convection, and the temperature of the surface is ~5800 K. An energy of 6.4×10¹¹ J is obtained from 1 g of protons, which corresponds to 15 t of oil. High energy (~5.5 keV) photons generated at the center of the sun produce electrons and positrons near protons and helium nuclei, which also emit photons with lower energy. Thus, photons arrive at the surface of the sun after ~ 105 years of absorption and scattering and are emitted as radiation energy. Therefore, activity conditions of the core of the Sun cannot be observed by light but by neutrinos.
Since 99 % of the power density of the sun is generated within 24 % of the sun’s radius, the power density of the core is ~20 W m−3, which is much smaller than the ~1000 W m−3 of human beings (~100 W / person). Coincidentally, the power of the human heart and human brain is ~1 W and ~30 W,which corresponds to power densities of ~3000 W m−3 and ~20,000 W m−3, respectively.
3 DT and DD Fusion
Three conditions should be fulfilled to achieve nuclear fusion on the Earth: very high temperature on the order of ~108 K; sufficient plasma particle density to increase the collision probability; and sufficient confinement time to hold the plasma within a defined volume. The form of nuclear fusion currently possible in a laboratory is the reaction between two hydrogen isotopes, deuterium (D) and tritium (T). A reaction between deuterium nucleuses would also be possible, called a DD reaction. These reactions are shown in Figure 2, and are represented as follows:
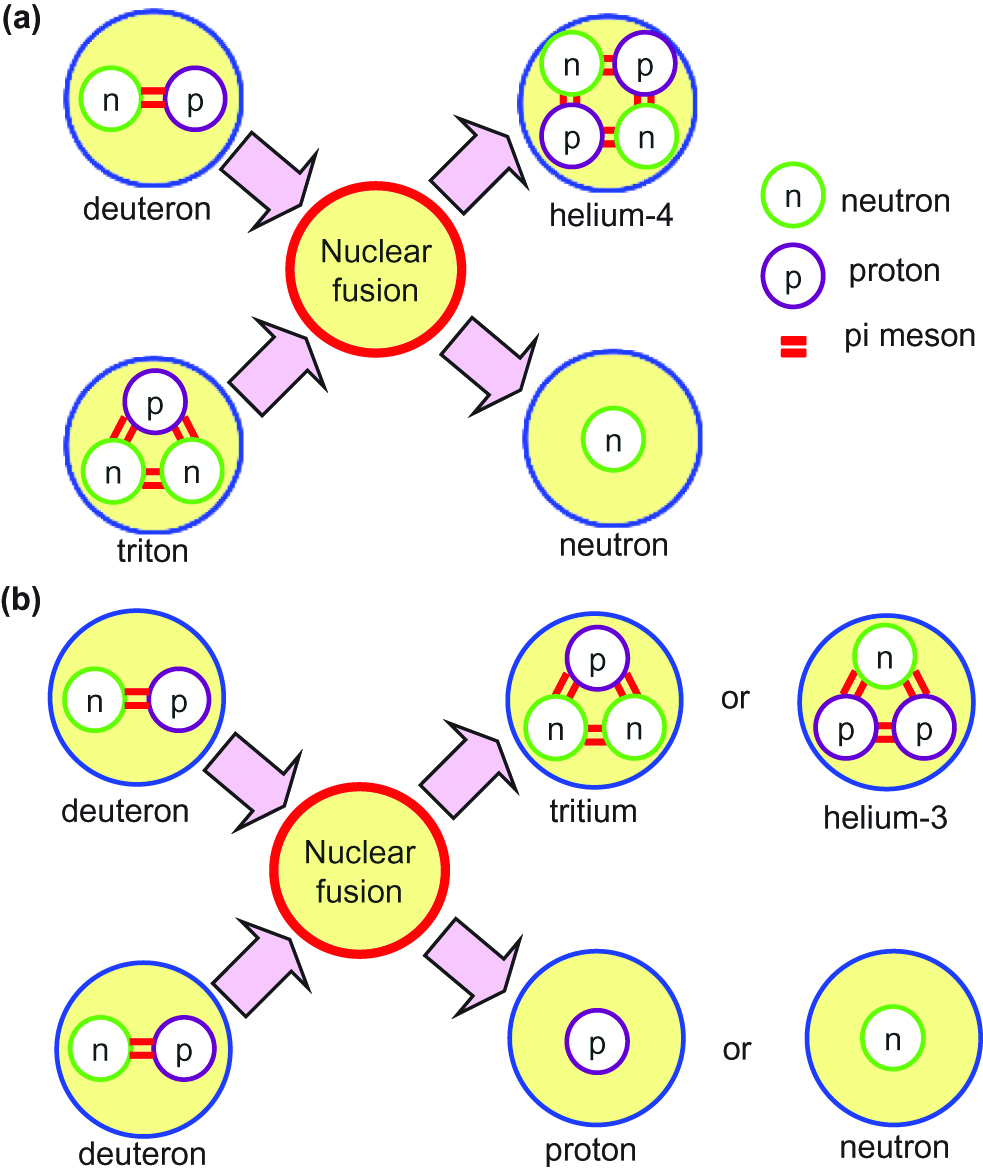
Schematic illustration of (a) DT and (b) DD fusion reactions.
Here, 2D: deuteron, 3T: triton, 1p: proton, and 1n: neutron. The possibilities of the two DD reactions are almost the same, and the average energy generated by DD fusion is 3.65 MeV.
The DT fusion reaction, which is expected to be used in the first practical applications of fusion reactors, produces the highest energy gain at the lowest temperatures. A small amount of tritium is generated only in the upper atmosphere, and tritium is a radioactive isotope with a short life-time, which makes it difficult to extract tritium using contemporary methods. Since fast neutrons are also generated, the design and selection of materials for the reactor is necessary. One of the methods for obtaining tritium would be to utilize the nuclear reaction of lithium with fast neutrons around the reactor.
4 Fusion Conditions
To achieve nuclear fusion, huge energy should be added from outside the reactor. One of the methods to do this involves the collision of atomic nuclei using thermal kinetic energy in what is called a thermonuclear fusion reactor. When a mixture of deuterium and tritium gas is heated above 105 K, they become plasma, which means that they completely separate into ions and electrons –this is often referred to as the fourth state of matter. When the temperature of plasma is increased to 108 K, ions and electrons in the plasma move very fast, which increases the possibility of nuclear fusion caused by the collision of ions. Since the plasma is expanded and scattered at the elevated temperatures, the plasma must be confined during the time required for fusion to take place.
In nuclear fusion, plasma temperature T, plasma density (number of nucleus per volume) n, and plasma confinement time τ should be above a certain level. The conditions for nuclear fusion are as follows:
Characteristics of plasma for nuclear fusion are shown in Figure 3. The condition that the power generated by DT nuclear fusion is equal to the power for heating the plasma is a critical condition for plasma confinement, which is indicated in the figure. High ion temperatures and (confinement time)×(plasma density) are mandatory in order for the plasma confinement to bring deuteron close to triton at a distance below 10−15 m.
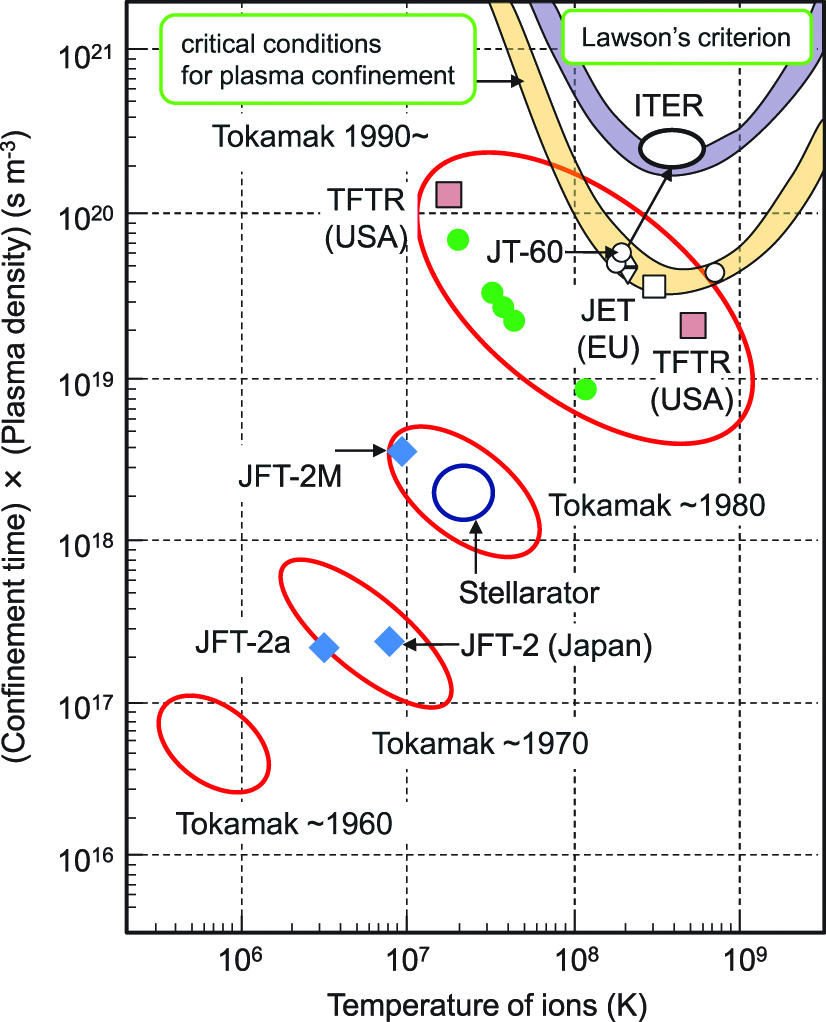
Nuclear fusion and characteristics of plasma.
There are some sources of energy loss in real fusion reactors, and the condition for the self-continued DT reaction in actual fusion reactors is called Lawson’s criterion. Lawson’s criterion indicates that the electric energy obtained from the fusion reactor must be larger than the energy needed for heating the plasma.
The tokamak is an experimental apparatus designed to utilize the energy of nuclear fusion and was first developed by Soviet researchers in the late 1960s. The term “tokamak” comes from a Russian acronym that stands for “toroidal chamber with magnetic coils.” The energy produced by nuclear fusion is absorbed as heat in the vessel walls. The fusion power plant uses this heat to produce steam, turning turbines and generators for the generation of electricity, which is a similar process to that used in conventional power plants. The tokamak has a doughnut-shaped vacuum chamber, in which hydrogen plasma is introduced to fuse and yield energy. Charged particles of the plasma can be confined by the huge magnetic coils placed around the vessel to confine the hot plasma away from the vessel walls.
5 ITER
ITER, which is shown in Figure 4(a), is one of the most advanced international energy projects in the world (ITER). ITER means “The Way” in Latin and is an acronym for the International Thermonuclear Experimental Reactor. 35 nations including Japan, Korea, China, India, Russia, the United States and the countries of the European Union are collaborating to build the world’s largest tokamak-type fusion device in southern France. Thousands of scientists and engineers have contributed to the design of the ITER since the international joint experiment was first launched in 1985. ITER will be the first fusion device to maintain nuclear fusion over long periods of time and will test the integrated technologies and materials necessary for the commercial production of fusion-based electricity.
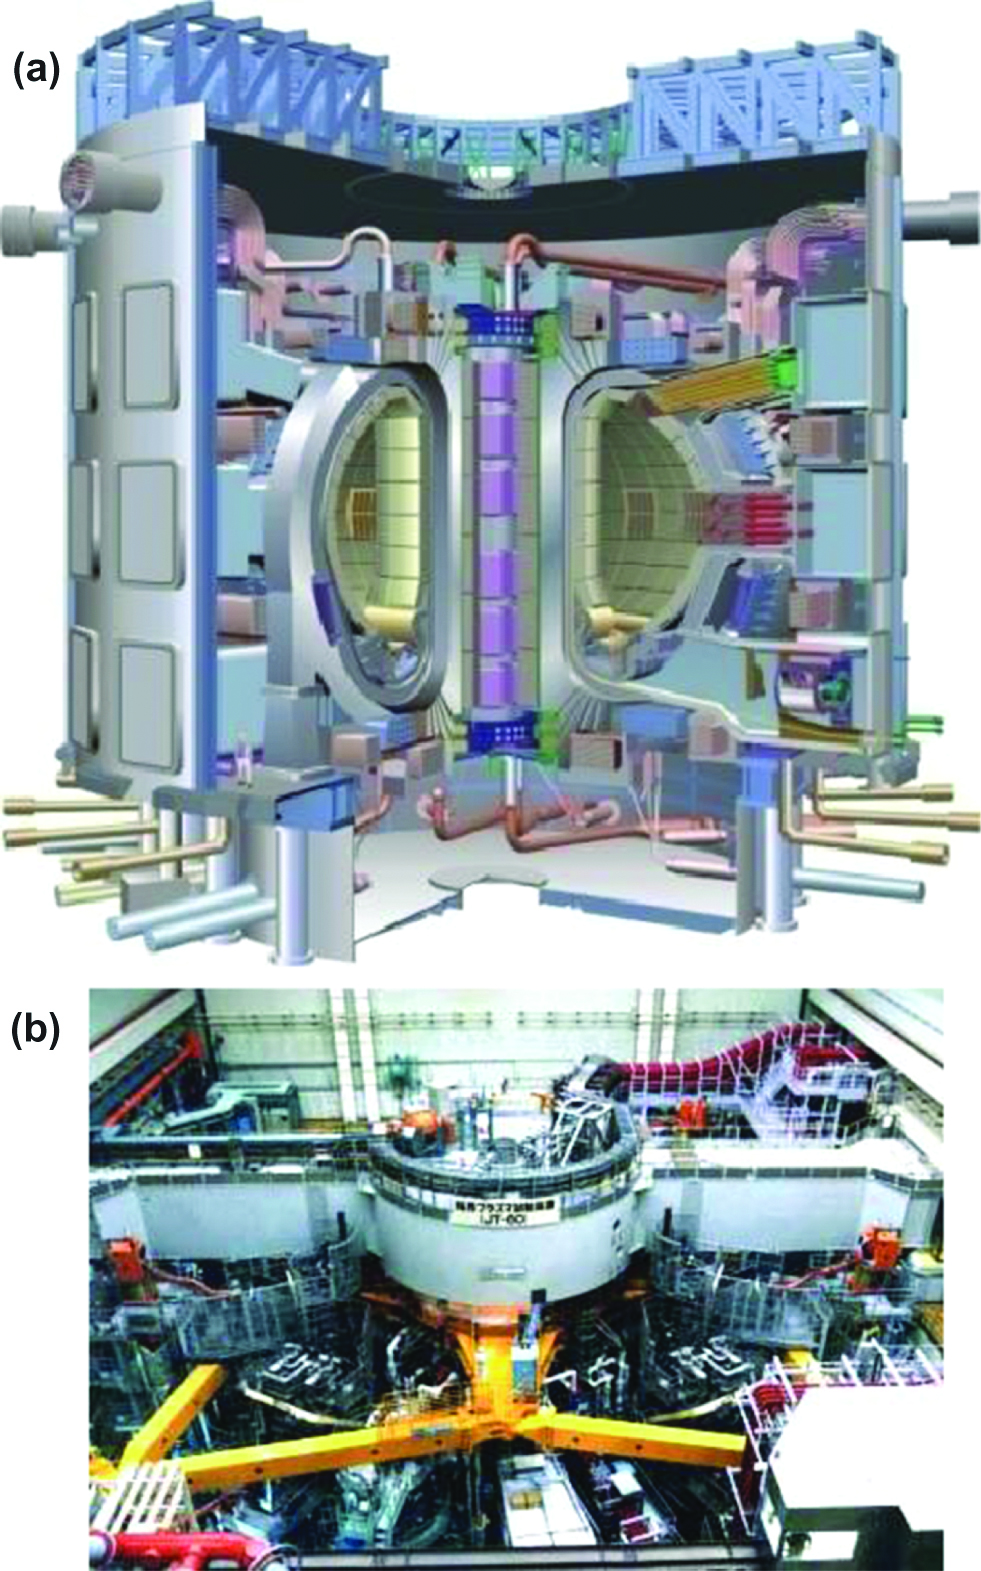
Images of (a) ITER and (b) JT-60 (ITER, JAEA).
The tokamak utilizes magnetic plasma confinement to achieve nuclear fusion, and there are two main problems that still need to be overcome before this method can be implemented commercially. The first is that both deuterium and tritium are isotopes of hydrogen. Tritium is a radioactive isotope that emits beta-rays with a half-life of 12.3 years and forms tritium-heavy water (tritium oxide), causing radioactive pollution. Tritium of about 2 kg is stored in the device. The second is the high energy neutrons generated by DT fusion above 108 K, which leads to the radioactivation of reactor walls and buildings and low level radioactive wastes.
The experimental device ITER is a totally integrated device with various apparatuses including a superconducting magnet for plasma confinement, blanket, diverter, plasma-facing wall, heating, diagnostics, cryogenics and remote maintenance. The ITER is expected to produce 500 MW, making it the first fusion-energy device for practical use. The ITER will bridge the gap between today’s smaller-scale experimental fusion devices and the fusion power plants of the future (ITER). Scientists will be able to study plasma under extreme conditions similar to those expected in a future power plant. The plasma conditions of ITER and the sun are summarized as listed in Table 1.
Comparison of ITER and Sun.
| ITER plasma | Sun | |
|---|---|---|
| Outer diameter (m) | 16.4 | 1.4×10⁹ km |
| Temperature of center (K) | 2×10⁸ | 1.6×10⁷ |
| Density of center (m−3) | 1020 | 1032 |
| Pressure of center (atm) | ~5 | 2.7×10¹¹ |
| Energy density (W m−3) | 6×10⁵ | 0.3 |
| Fusion reaction | DT | pp |
| Mass (g) | 0.35 | 2×1033 |
| Burning time constant (s) | 500 | 3×10¹⁷ (~1010 years) |
The European tokamak JET produced the world record of 16 MWfor fusion power from a total input power of 24 MW, which indicates a fusion energy gain factor (Q) of 0.67. The ITER is designed to produce 500 MWof fusion power from 50 MWof input power, which indicates a ten-fold return on energy (Q=10). Although it is necessary to maintain nuclear fusion for long periods of time in real fusion power plants, plasma with enough pressure for practical use could not be maintained, and the JT-60 in Japan achieved 28.6 seconds (JAEA), as shown in Figure 4(b). One of the important goals of the ITER is to sustain a stable fusion state for 500 seconds for Q=10, and to sustain regular, continued fusion for Q=5.
Although it will be necessary to develop materials that are hardly radioactivated by high neutron irradiation, the quantity of neutrons in the ITER is not sufficient for the material development, and therefore, it is necessary to study the materials for nuclear fusion in other facilities in addition to the ITER. The International Fusion Materials Irradiation Facility (IFMIF) was just opened in Japan in 2016 and is an accelerator-based neutron flux source with a peak at 14 MeV equivalent to the conditions of the deuterium-tritium reactions in a fusion power plant.
6 Muon Catalyzed Fusion
Muon-catalyzed fusion (μCF) is one of methods used in nuclear fusion to allow fusion to take place even at temperatures significantly lower than the temperatures required for thermonuclear fusion, even at room temperature or lower. When an electron is replaced by a muon around the DD or DT molecule to reduce the Coulomb barrier for fusion, the distance between the nuclei is reduced to 1/200 (~10−10 m → 5×10⁻¹³ m). Then, the probability of nuclear fusion is significantly increased even at room temperature (Imao et al. 2008; Knowles et al. 1997).
Muons are similar to electrons, but they are unstable subatomic particles with 207 times more mass compared with electrons. To create muons, protons or heavy ions with huge energies are irradiated onto metals such as beryllium or copper, which results in the emission of negative or positive charged muons from the metals, as shown in Figure 5. π-mesons, which have a lifetime of 0.026 μs before transforming into positrons or electrons, are also generated simultaneously. Since the muon has a short lifetime and many muons cannot be obtained from nature, they are produced by a particle accelerator, which limits the usability of muon-catalyzed nuclear fusion as a practical power source.
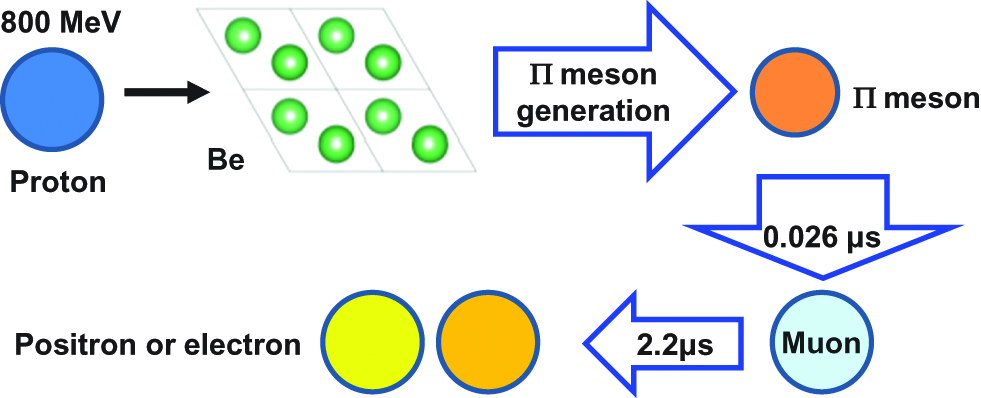
Principle of muon-catalyzed fusion.
Muons become free again after muon-catalyzed fusion and can be used for the fusion cycle. In addition, ~1 % of muons are trapped by 4He (α-particles). Therefore, the information that is most crucial in controlling the cycle is the number of chain reactions of the μCF caused by the first μCF and the probability of muon trapping by α-particles. The fusion probability of one muon is calculated to be ~1000 times larger compared to thermonuclear fusion in a tokamak reactor.
Moreover, each muon has about a 1 % chance of “sticking” to the alpha particle produced by the nuclear fusion of deuteron and triton, removing the “stuck” muon from the catalytic cycle, meaning that each muon can only catalyze at most a few hundred deuterium tritium nuclear fusion reactions. So, these two factors, that muons are prohibitively expensive to make and that they too easily stick to alpha particles, limit muon-catalyzed fusion to remaining a laboratory curiosity. To produce practical muon-catalyzed fusion reactors, a more efficient source of muons and an effective muon-catalysis method are needed.
7 Pyroelectric Fusion
In an experiment using a pyroelectric power source using lithium tantalite (LiTaO3) crystal (Kasatani et al. 2004), it was reported that nuclear fusion had been achieved in a desktop-like device (Naranjo et al. 2005), as shown in Figure 6(a) and (b), respectively. Deuteron beams are generated and accelerated by the pyroelectric effect of LiTaO3 under temperature differences. Pyroelectric fusion is the technique of using pyroelectric crystals to generate high intensity electrostatic fields to accelerate deuterium ions into a metal hydride target containing deuterium with sufficient accelerating energy to cause these ions to produce nuclear fusion. In the experiment, the pyroelectric crystal was heated from −34 to 7 °C, combined with a tungsten needle to produce an electric field of ~25 GV per meter to ionize and accelerate deuterium nuclei into an erbium deuteride target. Then, the two deuterium nuclei fused together to produce a 3He nucleus, a 2.45 MeV neutron and radiation. This technique realized DD fusion without high temperatures and high pressure. Tritium could also be used for the nuclear fusion. Since the apparatus requires far more energy than it produces, it is not suitable for power generation. However, the apparatus is useful as a desktop neutron generator.
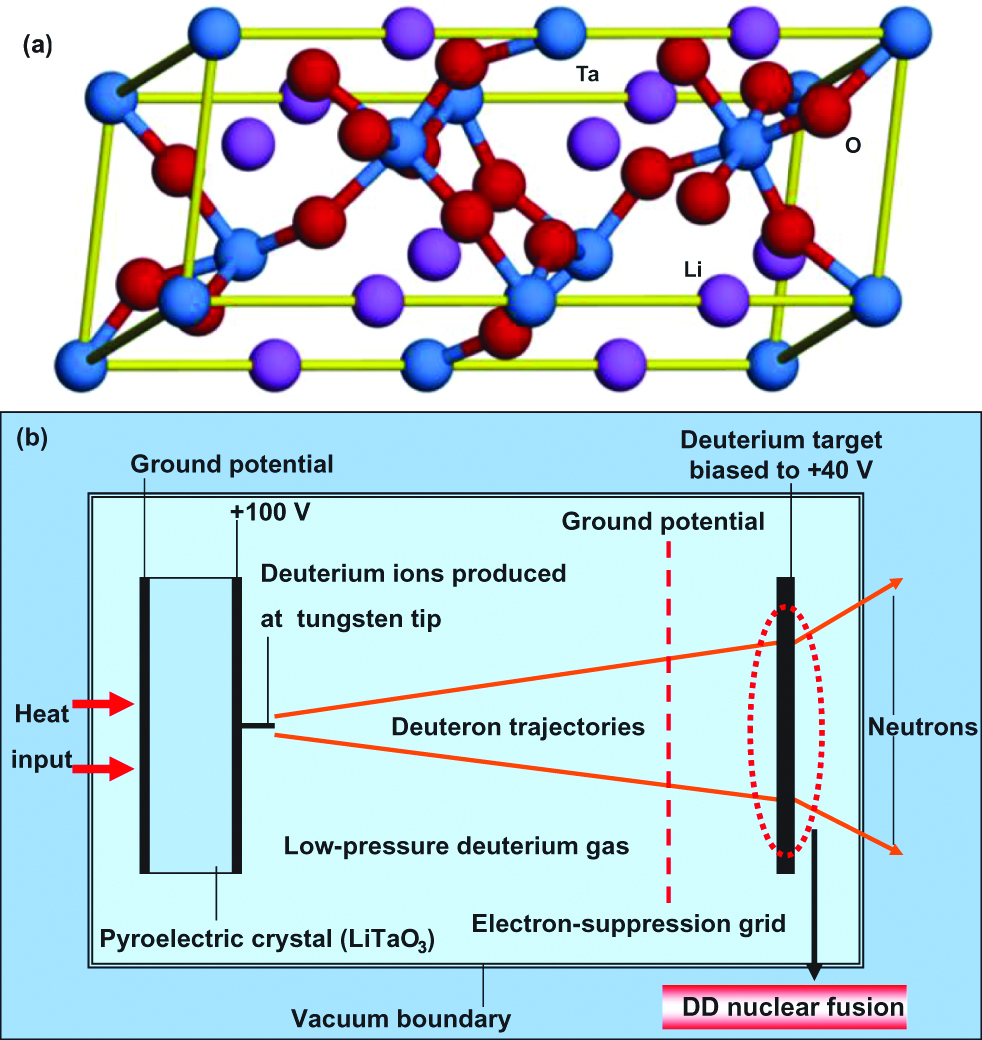
DD nuclear fusion utilizing LiTaO3 pyroelectric crystal.
Figure 7 is relations of the nuclear fusion by Coulomb repulsion, quantum tunneling effect, and the strong nuclear force interaction. In the solid state crystals, the potential barrier between nuclei are narrowed by the screening potential, and nuclear fusion occurs by the quantum tunneling effect.
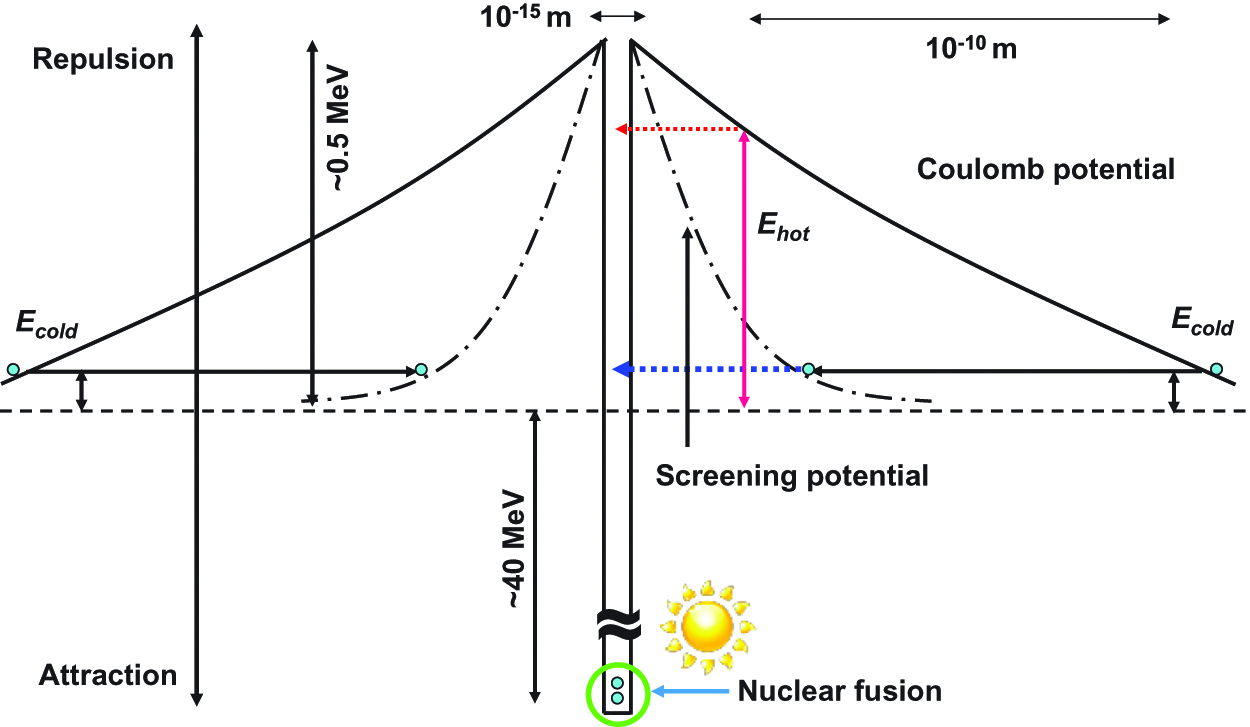
Relations of the nuclear fusion by quantum tunneling effect, and the strong nuclear force interaction.
8 Hydrogen Storage Materials
Clean hydrogen energy is expected to serve as a substitute for fossil fuel in the twenty-first century and a gas storage ability more than 6.5 wt.% is needed for car application according to the US Department of Energy. Although LaNi5H6 is already used as a H2 gas storage material, its storage ability is ~1 wt.% because of the large atomic numbers of La and Ni (Chen et al. 2000; Schlapbach and Züttel 2001; Bowman Jr and Brent 2002). On the other hand, fullerene like materials, which consist of light elements such as boron, carbon and nitrogen, may store more H2 gas compared to metal hydrides. In this chapter, hydrogen gas storage in boron nitride (BN) and carbon (C) nanomaterials are reviewed.
Many works have reported on the hydrogen storage ability of carbon nanotubes, fullerenes and carbon nanomaterials (Dillon et al. 1997; Dujardin et al. 1994; Chen et al. 1999; Liu et al. 1999; Nützenadel et al. 1999; Wu et al. 2000). It has been reported that multi-walled carbon nanotubes could absorb hydrogen from 1 wt.% up to 4.6 wt.%. These results indicate that carbon nanotubes would be a possible candidate for a hydrogen storage material, although further evaluation of hydrogen storage measurements is necessary, and many other studies have reported on H2 gas storage in carbon nanomaterials.
Boron nitride (BN) nanomaterials are also expected to have application because they provide good stability at high temperatures with high electronic insulation in air (Oku et al. 2009). Hydrogen storage in BN nanomaterials has also been studied recently (Zhang et al. 2015; Muthu et al. 2015; Kumar et al. 2015; Oku 2015). It is difficult to absorb hydrogen by physisorption either inside nanotubes or at the interstitial channels of nanotubes at room temperature, which results from the fact that the bonding of physiosorbed hydrogen is too weak to achieve large-scale storage at room temperature. Therefore, chemisorption is considered to be a necessary requirement for hydrogen storage at room temperature. It has been reported that the chemisorption ratio observed at room temperature increases with an increasing alkali/carbon rate. Therefore, if the energy of chemisorption can be lowered, the hydrogen storage ability of carbon and BN nanotubes would be improved.
Various metal alloys have also been developed and investigated, as listed in Table 2 (Schlapbach and Züttel 2001). The crystal structures of LaNiH6 (Halstead 1974), (b) FeTiH0.06 (Reidinger et al. 1982), (c) ZrV2H5.1 (Bogdanova and André 2004), (d) Ti0.35V0.65H1.95 (Hayashi et al. 1986) and (e) Mg2NiH4 (Häussermann et al. 2002) are shown in Figure 8, indicating the existence of various crystal systems Since hydrogen atoms are ordered at special sites in the crystal structures of the hydrogen storage alloys, high hydrogen storage densities are possible. Hydrides of magnesium alloys store ~7 wt.% hydrogen, and titanium, zirconium, palladium and vanadium alloys have also been studied as hydrogen storage materials. Although pure palladium is not superconductive, PdH and PdD are superconductors with transition temperatures Tc of ~9 K and ~11 K, respectively, and the crystal lattice is slightly expanded (Skoskiewicz 1972; Stritzker and Buckel 1972; Eichler et al. 1975; Stritzker 1974; Tripodi et al. 2007). Lithium hydride and sodium borohydride are also good candidates for hydrogen storage. Since these metal alloys bind with hydrogen strongly, high temperatures are required to release the hydrogen content. This energy cost could be reduced by using alloys which consist of elements with larger and smaller binding energies for hydrogen.

Crystal structures of (a) LaNi5H6, (b) FeTiH0.06, (c) ZrV2H5.1, (d) Ti0.35V0.65H1.95 and (e) Mg2NiH4.
Materials and their hydrogen storage.
| Type | Structure | Hydride | wt. % of H | Pressure (MPa) | T (K) |
|---|---|---|---|---|---|
| A | Fm3m | PdH0.6 | 0.56 | 0.0020 | 298 |
| AB5 | P 6 /mmm | LaNi5H6 | 1.37 | 0.2 | 298 |
| AB2 | Fd3m | ZrV2H5.5 | 3.01 | 10–9 | 323 |
| AB2 | Fd3m | TiV2H4 | 2.6 | 1 | 313 |
| AB | Pm3m | FeTiH2 | 1.89 | 0.5 | 303 |
| A2B | P 6222 | Mg2NiH4 | 3.59 | 0.1 | 555 |
| Nano C | ~1.5 | 0.1 | 77 | ||
| Nano BN | ~3 | 0.1 | ~300 |
Nanostructured carbon materials reversibly absorbed 1.5 wt.% hydrogen at 77 K, which agreed with the calculation (Nijkamp et al. 2001). Various metals’ alloys are able to absorb large amounts of hydrogen reversibly, as listed in Table 2. The equilibrium pressure depends on the temperature, which is related to changes in enthalpy and entropy. The entropy change corresponds to the change from molecular hydrogen to dissolved atomic hydrogen and is ~130 J K−1 mol−1 for metal-hydrogen systems (Schlapbach and Züttel 2001). Hydrogen atoms are located at the interstitial site of the crystal lattice. The host metal lattice expands through hydrogen storage, sometimes losing the high symmetry of the crystal lattice (Schlapbach and Züttel 2001). Hydrogen positions have already been described in the chapter on nuclear fusion. The loss of crystal symmetry would also affect the deuterium condensate in Pd.
9 Pd Crystal and Deutrium Condensation
The nuclear fusion phenomena produced in solid and liquid phases with deuterium have been found and attracted a great deal of attention. Naranjo reported an experiment using a pyroelectric power source using LiTaO3 crystal (Figure 6) to achieve nuclear fusion in a desktop-like device (Naranjo, Gimzewski, and Putterman 2005). Other studies on nuclear fusion by muon catalysis were also reported. Although a plan for ITER has been developed and pushed forward, the ITER presents many engineering problems, and is extremely expensive. On the other hand, the nuclear fusion phenomena produced in solid and liquid phases with deuterium have attracted a great deal of attention. In general, nuclear fusion of hydrogen atoms occurs at high temperatures under high pressure. However, condensation fusion at close to room temperatures was reported, and various fundamental studies are still ongoing. Studies on nuclear fusion for hydrogen storage metallic alloys are currently in progress [7–14] (Takahashi et al. 1998; Takahashi and Yabuuchi 2007A; Takahashi 2007B, 2009; Heidenreich et al. 2006; Kayano et al. 1994; Konashi et al. 1996; Bom et al. 2003). Nuclear fusion in condensed matter is expected to have potential as a clean energy source because DD fusion produces only helium-4 and low radioactivity.
There are several characteristics of the condensation fusion:
Smaller amount of neutrons detected in comparison to ordinary nuclear fusion.
Few γ-rays detected.
Deuterium is used for fusion.
Occurrence of fusion in materials with fcc and hcp structures, and no fusion reaction for bcc structure.
4He is the main element generated.
Reproducibility of nucleus change.
Excess heat of 0.1 ~ 1 W cm−2.
The nuclear reaction in hydrogen storage metallic alloys and a cross section of DD nuclear fusion were summarized here. Metallic alloys for hydrogen storage such as palladium were selected for analysis. Using the results mentioned above, the possibility of nuclear fusion in the solid phase was discussed.
The atomic structure model of hydrogen (deuterium) storage Pd is shown in Figure 9(a) (Oku and Kitao 2015). The deuterium injection into the Pd crystal causes a temporal formation of D-cluster restricted by Platonic regular polyhedrons and tetrahedral symmetric condensate (TSC) (Takahashi and Yabuuchi 2007A; Takahashi 2007B, 2009), as shown in Figure 9(b). Four deuterons and four electrons condensate at the T-site by background neutrons in nature, and these background neutrons play a role in promoting the condensation.
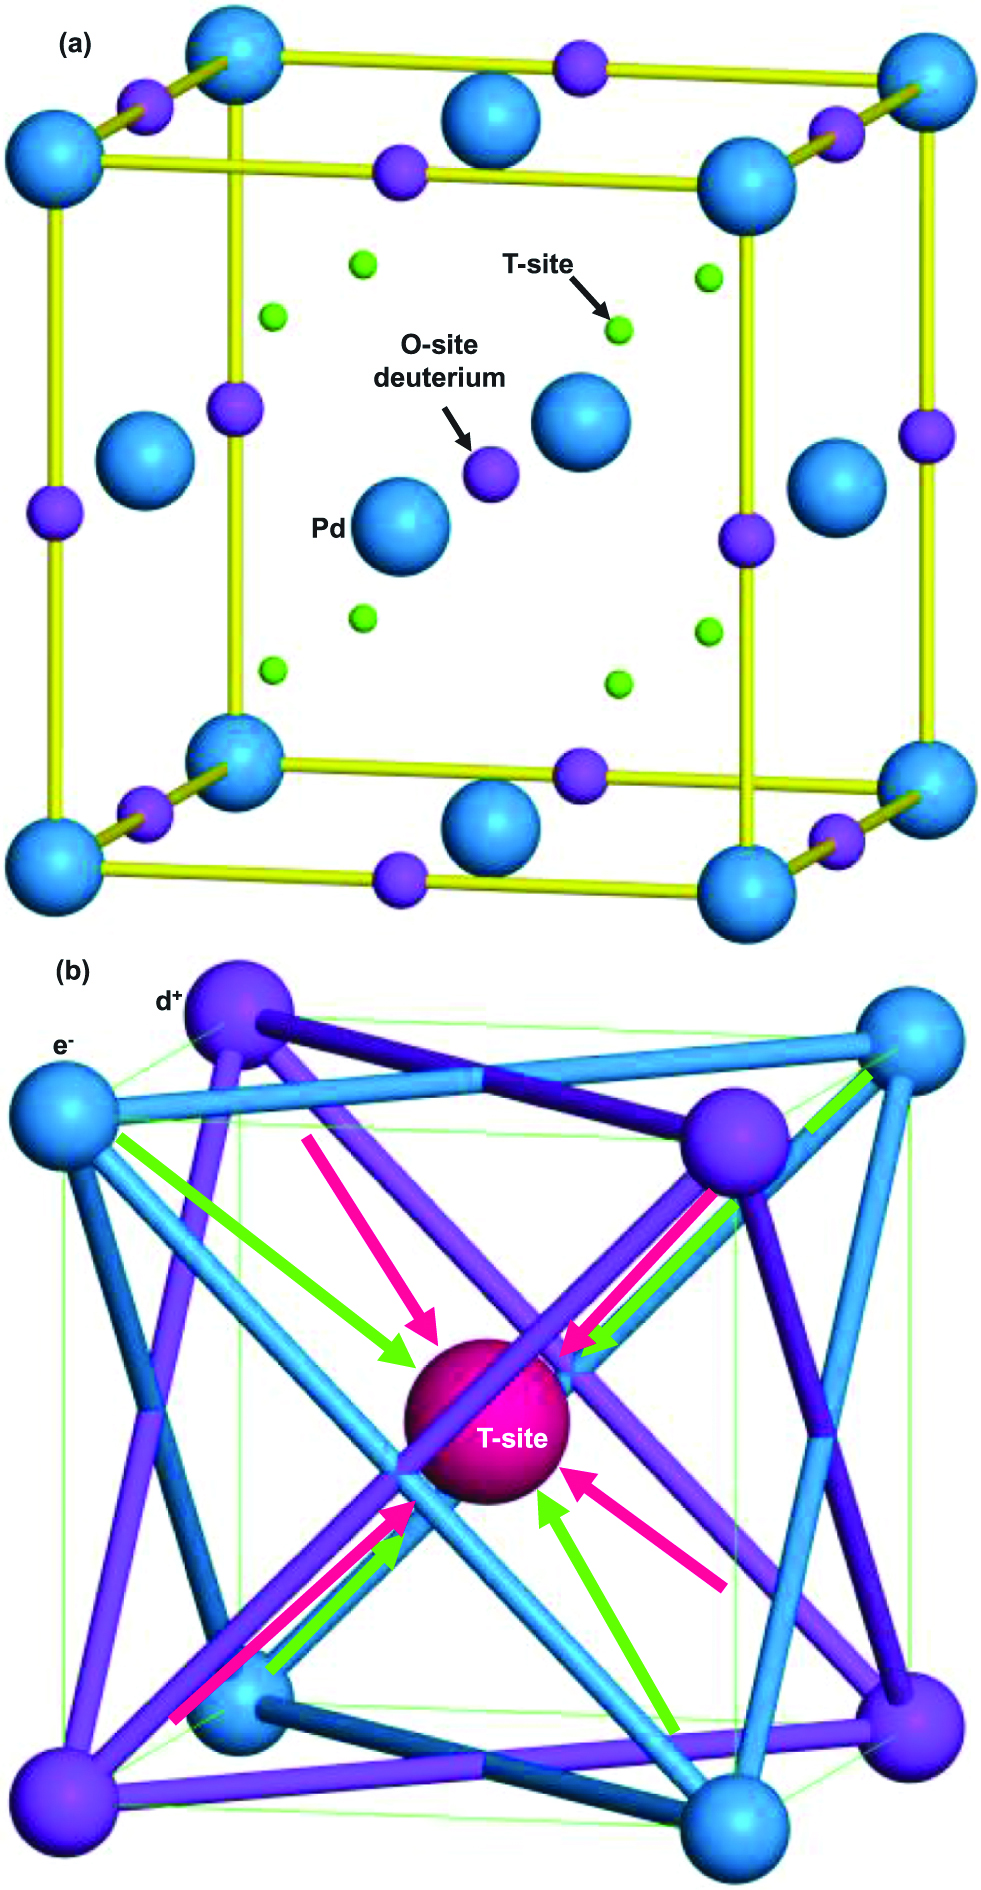
(a) Atomic structure model of PdD. Deuterium atoms are situated at octahedral sites (O-site). Tetrahedral sites (T-site) are also indicated. a=0.389 nm. (b) Schematic illustration of tetrahedral symmetry condensate of four deuterium ions and four electrons around T-site.
The time-dependent TSC-cluster trapping potential was calculated as eq. (11) from the Langevin equation for 4D/TSC based on the heavy mass electronic quasi-particle expansion theory calculation for barrier factors and the fusion rate (Takahashi and Yabuuchi 2007A; Takahashi 2007B, 2009), and the Rdd is expected value of D-D distance.
The fusion rate was calculated by Fermi’s golden rule, and the 4D fusion yield per TSC generation was also calculated (Takahashi 2009). The fusion yield and fusion products of deuterium condensate in PdD are summarized in Table 3 (Takahashi 2007A, 2007B, 2009). Although neutrons and tritium are produced by 2D and 3D condensation, respectively, the fusion yield is not higher than that of 4D condensation of TSC. Instead of TSC, an octahedral symmetric condensate (OSC) model has also been proposed. The calculation indicates that OSC is stable at Rdd=40 pm as the ground states, and the potential was calculated to be c.a. −800 eV.
Fusion reaction of deuterium condensate in PdD.
| Multibody deuterium | Fusion yield (fs–1 cm–3) |
Fusion product (ns–1 cm–3) |
|---|---|---|
| 2D | 1.9 | Neutron: 10 |
| 3D | 1.6×10⁹ | Tritium: 8×10⁸ |
| 4D | 3.1×10¹¹ | Helium: 3×10¹¹ |
On the other hand, the Langevan calculation indicates a lowest potential for TSC of −3500 eV for Rdd=3 fm, as shown in Figure 10. The condensation time was calculated to be 1.4 fs (Takahashi 2009). For Rdd, the deuterons and electrons condensate into an intermediate 8Be. After that, the 8Be collapses into two 4He. This indicates that the TSC model is more suitable for D-cluster condensation. For actual Pd crystals, the deuteron supply is required to preserve the continuous fusion reaction, and the diffusion mechanism of deuterium in the Pd crystal should be investigated.
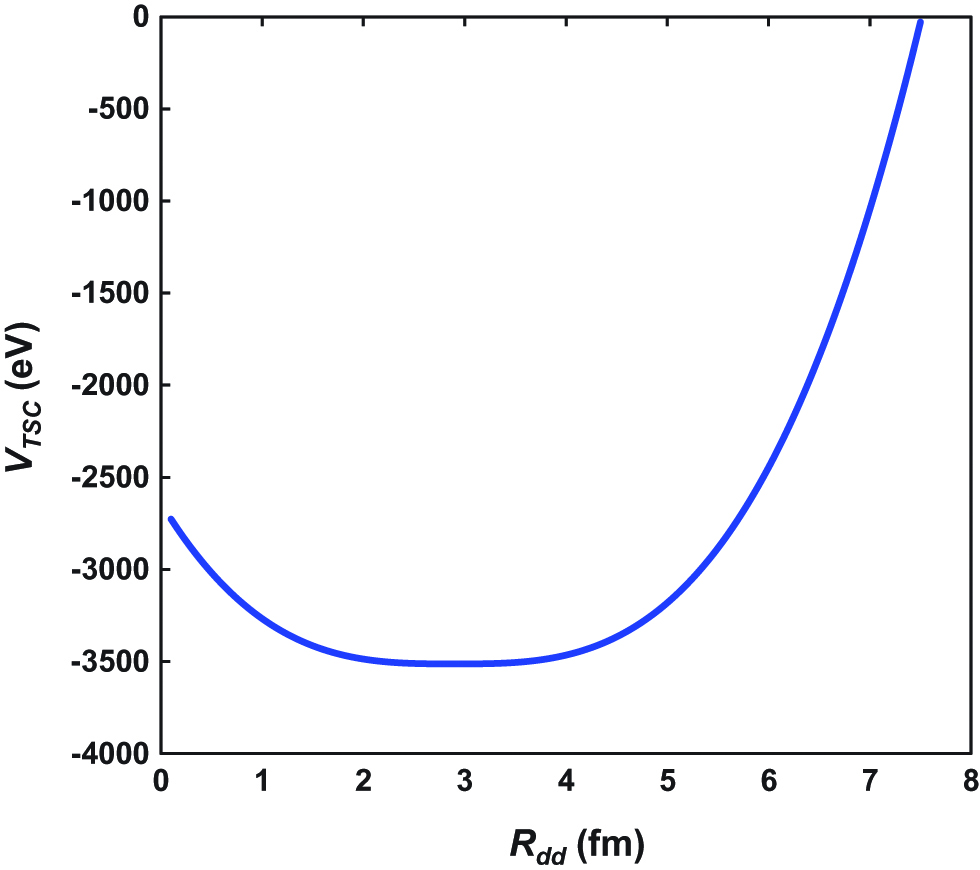
TSC trapping potential at the final stage (TSC-min) of condensation calculated by Langevin equation.
The diffusion coefficient D of deuterium in the Pd crystal was investigated using the data reported in Table 4 and the eq. (12), where D: diffusion coefficient, D0: constant, ED: activation energy, k: Boltzmann constant and T: temperature.
Diffusion of deuterium atoms in fcc metals.
| Metal-D |
Ea
(eV) |
D
0
(10–7 m2 s–1) |
Temperature (K) |
|---|---|---|---|
| Pd-D | 0.21 | 1.7 | 218–333 |
| Ni-D | 0.40 | 4.2 | 220–1273 |
| Cu-D | 0.38 | 7.3 | 723–1073 |
Although the reported data for the Pd-D system was obtained at around room temperature, deuteron diffusion at higher temperatures were estimated by the Flynn-Stoneham eq. (13) based on the thermally activated tunneling mechanism (Oku and Kitao 2015; Flynn and Stoneham 1970; Hirth 1980). The hopping probability W between the nearest deuterium atomic sites is calculated as follows, where the tunneling matrix element J value was estimated from the experimental data.
Then, the diffusion coefficients at higher temperatures are calculated from the following relation:
The nearest D-D distance (d) is equal to the distance of the nearest octahedral-sites, which is 0.2751 nm. The diffusion coefficients of deuterium atoms in Pd as a function of temperature are shown in Figure 11(a). The D values increase as the temperature increases. Figure 11(b) shows the diffusion time of deuterium atoms between the nearest O-sites in Pd, and the transport time of deuterium between the nearest neighboring D atoms in Pd crystal lattice is shown in Figure 12 as a function of temperature (Sugimoto 2006). The diffusion time decreases exponentially as the temperature increases, and then slowly decreases at higher temperatures near the melting point of Pd (1828 K). Therefore, the decrease in the diffusion time of deuteron caused by elevating the temperature is limited.
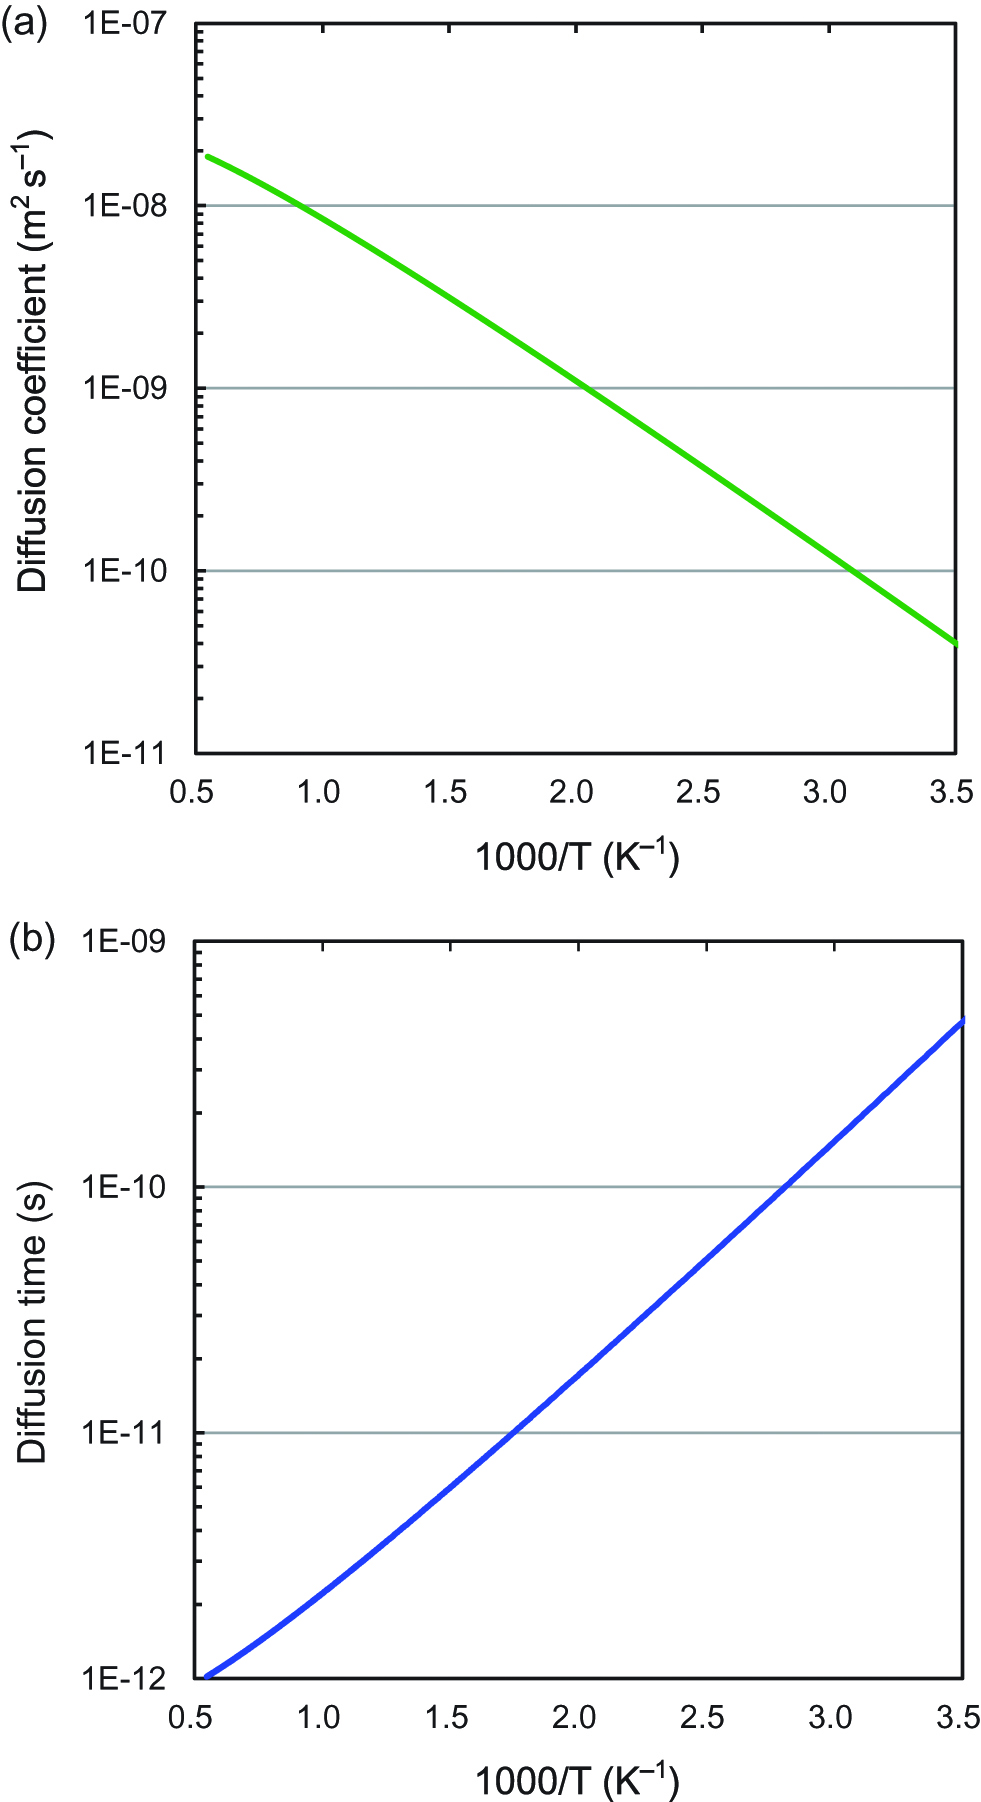
(a) Diffusion coefficient of deuterium atoms in Pd as a function of temperature. (b) Diffusion time of deuterium atoms between the nearest O-sites in Pd.
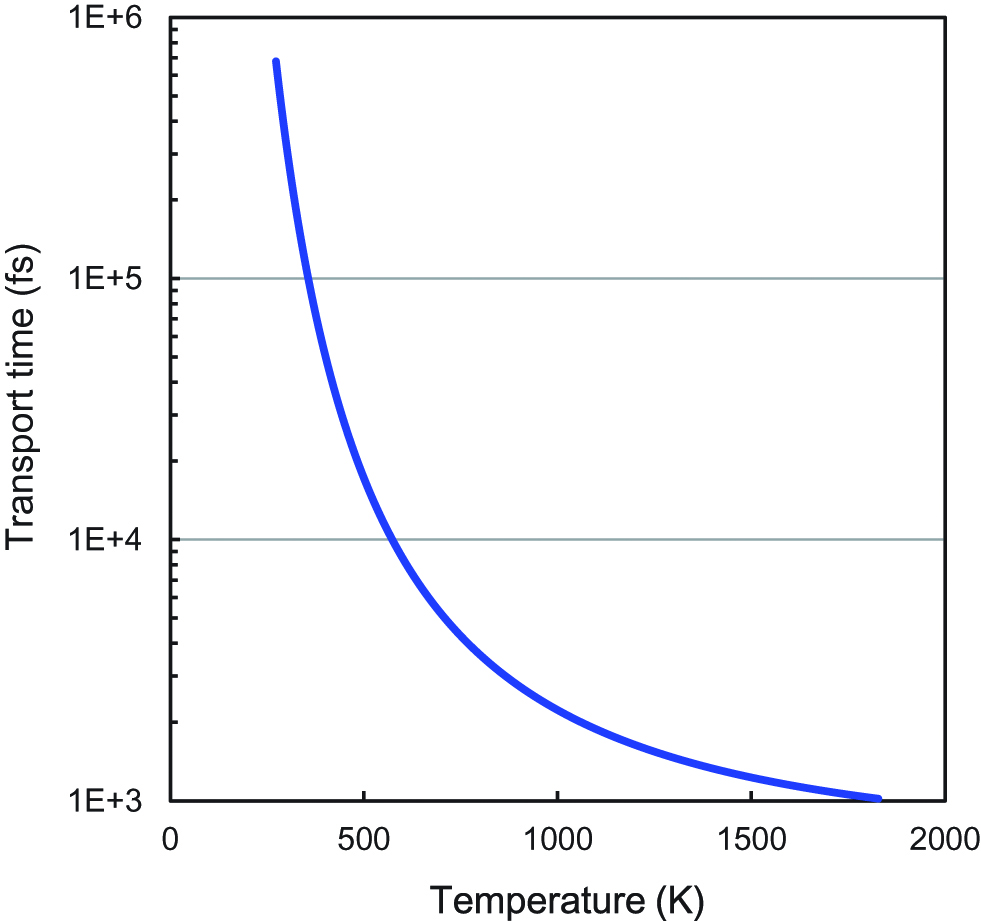
Transport time of deuterium between the nearest neighboring D atoms in Pd crystal lattice as a function of temperature.
To reduce the diffusion time, several approaches can be considered: reducing the activation energy, particle mass m and distance d. If the other elements are introduced into the Pd crystal, a reduction of the barrier energy of deuteron diffusion or an increase in the tunneling probability may be expected. Here, silver (Ag) was introduced into the Pd crystal, and the diffusion coefficients and diffusion time were calculated based on the proposed data (Ozawa et al. 2007), which indicated almost the same values as for the non-Ag doped Pd. Continuous fusion reaction of deuterium was reported for Pd-ZrO2 nanocomposite materials (Kitamura et al. 2009), and further studies on the other elements or other methods might be examined (Grochala and Edwards 2004; Horinouchi et al. 2006; Mitsui et al. 2003; Kusada et al. 2014).
A schematic illustration of tetrahedral symmetric condensate and deuteron diffusion is summarized in Figure 13 (Takahashi 2007B, 2009). At the beginning of the condensation process, tetrahedral clusters of 4d+ and 4e− are formed. After 1.4 fs, an intermediate nucleus 8Be forms from the smallest TSC. Then, the 8Be collapses into two 4He. In order to continue the TSC, the deuterium should be supplied at the deuterium site in the Pd lattice. The diffusion time of deuterium is fairly long (~ 1000 fs) in comparison to the fusion time for the 4D/TSC (1.4 fs), and a continuous fusion reaction may be difficult. Another method should be introduced to promote deuterium diffusion in the Pd crystal for the fusion reaction. Although the Pd element was selected for an analysis of continuous tetrahedral symmetric condensation of deuterium clusters, palladium has the material problem of being scarce and its cost is consequently high. Other hydrogen storage compounds should be investigated in further considering hydrogen diffusion in hydrogen storage materials (Bowman and Brent 2002).
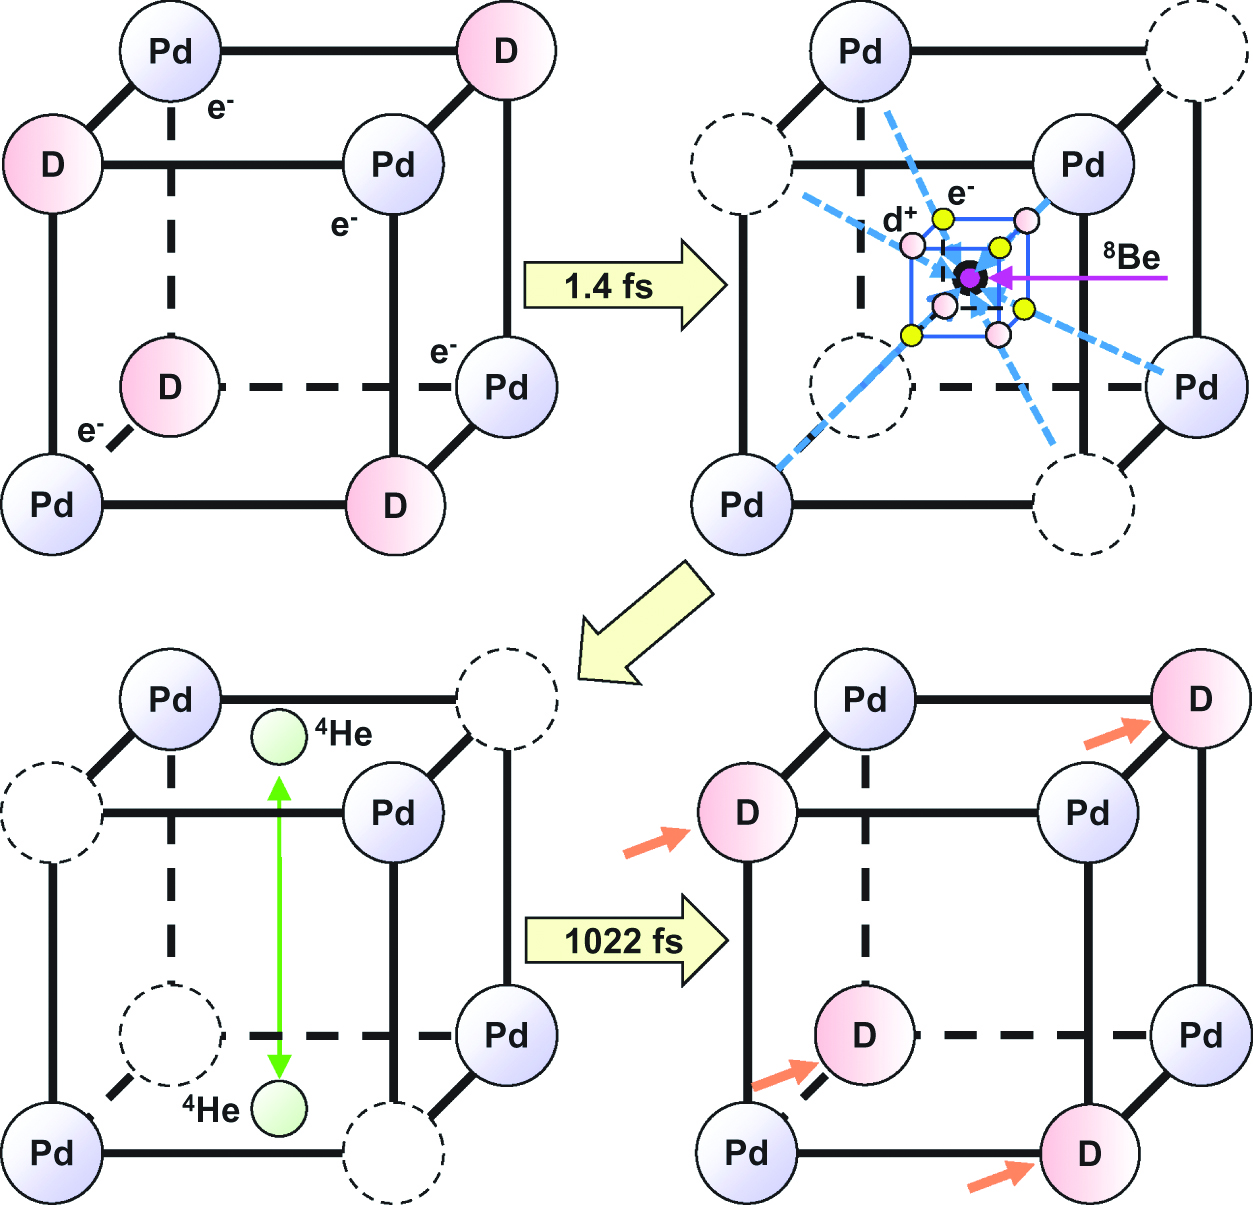
TSC and diffusion model for deuterons in Pd.
The above 4D-TSC model predicted the transitory Bose-Einstein condensate (BEC) and 4He production in microscopic space in hydrogen crystals with high symmetry. When the deuterons are introduced into the Pd lattice, the crystal lattice could expand and lose its tetrahedral symmetry, which might cause a decrease in the deuterium condensates in Pd. Although other theoretical predictions on the BEC condensate and deuteron fusion have been reported (Kim 2009, 2011; Widom and Larsen 2006).
The possibility of hydrogen storage in Pd was studied using a diffusion calculation and a potential calculation on 4D fusion. The nuclear fusion model for the 4D/TSC and diffusion of deuterium in Pd alloys was investigated. The diffusion time of deuterium is fairly long in comparison to the fusion time for 4D/TSC and creating a continuous fusion reaction may be difficult. The diffusion time of deuterium at the Pd-Ag alloy surface was almost the same as that of Pd. Enhancing deuterium diffusion in Pd alloys will be key in developing potential future methods for continuous nuclear fusion or for hydrogen gas storage.
10 Fusion Reactor Materials
Both excellent erosion resistance to high heat loading from plasma and high resistance to radiation damage by high-energy neutrons are required for the plasma facing components used in fusion reactors such as ITER. Although carbon materials have been extensively used for plasma facing components because of carbon’s low atomic number and comparatively high thermal conductivity, its thermal conductivity is quite low at high temperatures such as those that occur during the operation of fusion reactors (Burchell and Oku 1994). Carbon/copper (C/Cu) composite materials have been produced because of the high thermal conductivity of Cu. The thermal conductivity of C/Cu composites was measured and examined at up to 1400 K for fusion applications (Oku, Hiraoka, and Kuroda 1995; Oku et al. 1998), and these measurements showed some improvement in the composites’ thermal conductivity in comparison to C. Although C/Cu composite materials are promising from the standpoint that they have higher thermal conductivity at high temperatures, there are some cases where their thermal conductivity at room temperature becomes smaller than that of the original C/C composite materials. The reason is that the cohesion of the C/Cu interface is poor.
The goals of this study were twofold. The first was to develop carbon-based materials with high thermal conductivity and good stability at high temperatures. For application in fusion devices, Cu was selected as a metallic element because of its high thermal conductivity. The crystal structures of carbon (Su et al. 2006) and copper (Reibold et al. 2006) are shown in Figure 14(a) and (b), respectively. In addition, titanium (Ti) was selected in a small amount as a third element because Ti has low enthalpy (ΔH) in alloy formation with C (ΔH=−156 kJ mol−1) and Cu (ΔH=−40 kJ mol−1) (de Boer et al. 1988), as shown in Figure 14(c). In Figure 14, elements with ΔH values higher than 0 should be removed from the candidates. Although zirconium and hafnium also have low ΔH with C and Cu, Ti has the best cost performance. The addition of Ti to C/Cu composite materials is expected to result in high thermal conductivity due to strong cohesion at the C/Cu interface. The second goal of the study was to understand the heat conduction mechanism of carbon materials by analyzing their microstructure using optical microscopy, transmission electron microscopy and high-resolution electron microscopy. In particular, HREM is a powerful method for investigating the interfacial structures of advanced materials (Oku 2012; Oku 2014).
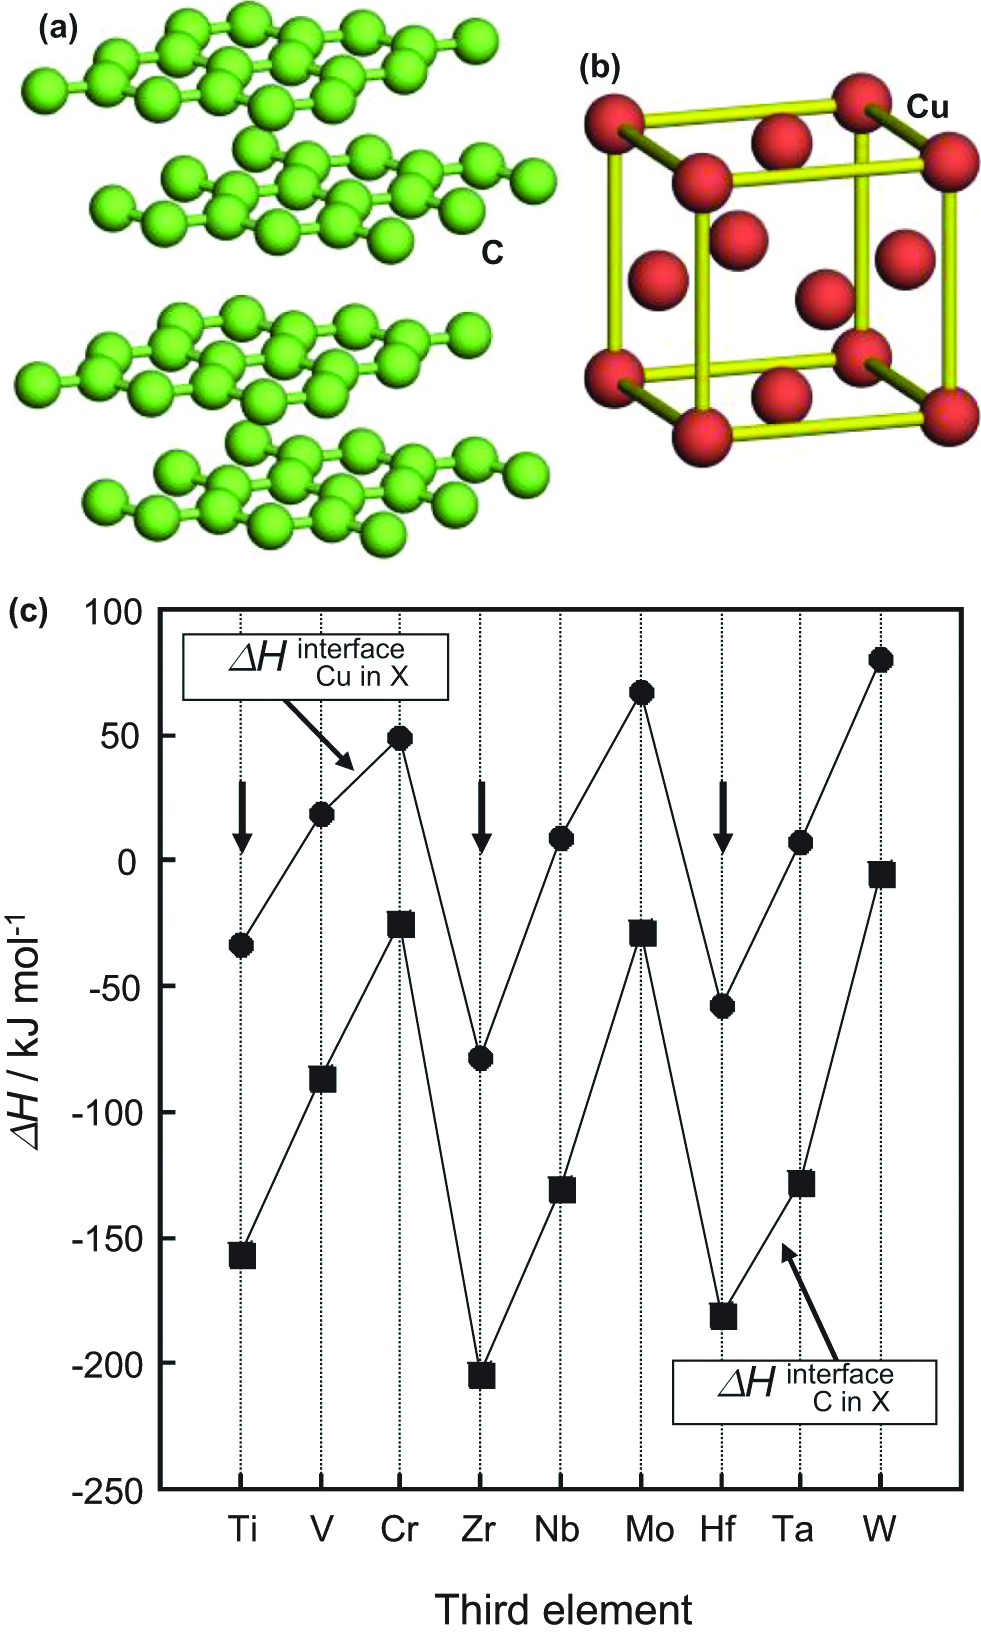
Crystal structures of (a) carbon and (b) copper. (c) Calculated formation enthalpy of refractory elements with C and Cu at the interface.
Nuclear grade fine-grained isotropic graphite (IG-430U, IG) and C/C composite (CX-2002U, CX) were used for the base materials, which are used for the plasma facing components of some fusion devices such as JT-60. Molten Cu and Cu(Ti) were impregnated in these carbon materials at a pressure of 15 MPa. These samples were denoted as IG–Cu, IG–Cu(Ti), CX–Cu and CX–Cu(Ti). The sample compositions were: IG–Cu (33.1 wt.% Cu), IG–Cu(Ti) (36.0 wt.% Cu and 0.8 wt.% Ti), CX–Cu (44.3 wt.% Cu) and CX–Cu(Ti) (48.1 wt.% Cu and 1.1 wt.% Ti) (Oku et al. 1995). CX is a felt type C/C composite, and thermal conduction takes place along the fiber plane of the felt composites. The specimens were 10 mm in diameter and 2–4 mm in thickness. Thermal conductivity measurements were performed in the range of 293–1200 K using a laser flush device for thermal diffusivity and specific heat. The measurement conditions were as follows: laser pulse energy of 0.6 J, pulse width of 0.5 μs, temperature increase of 1.8–2.8 K at room temperature and 0.6–0.8 K at 1000 K.
The temperature dependences for thermal conductivity for the two base carbon materials are shown in Figure 15. Although the thermal conductivity of IG–Cu is larger than that of the original sample at higher temperatures, as shown in Figure 15(a), it is smaller than the original one at room temperature, which could be due to poor cohesion at the C/Cu interface. In order to improve the cohesion between C and Cu, a small amount of Ti was added to the IG–Cu and CX–Cu. A clear increase in thermal conductivity over the measured temperature range and a decrease in temperature dependence are observed in Figure 15(a) and (b). CX is a felt-type C/C composite, and its thermal conductivity measurements were performed in the high thermal conductivity plane, i. e. within the felt layer. In this case, the effect of the addition of titanium to the copper-impregnated material on the thermal conductivity was clear. The reason that the thermal conductivity of CX–Cu is smaller than that of the original material is that insufficient cohesion exists between carbon and copper.
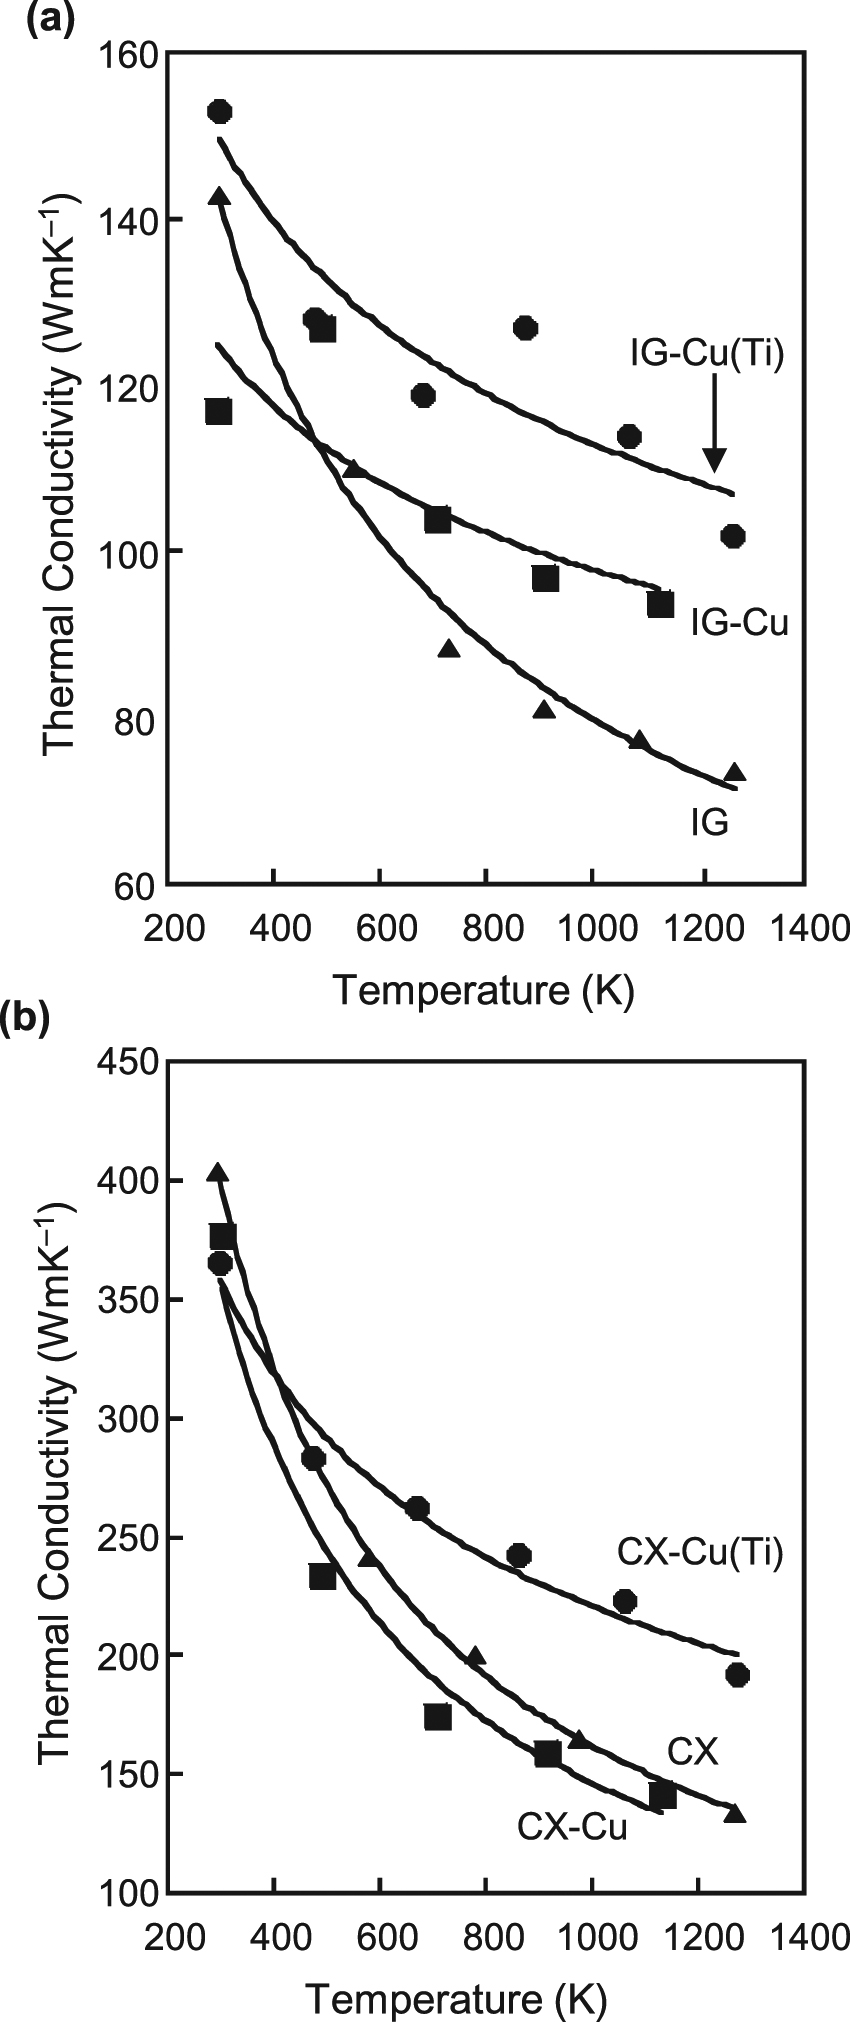
Temperature dependence of thermal conductivity for (a) IG-based composites and (b) CX-based composites.
To observe the morphology of IG–Cu(Ti), which has high thermal conductivity, an optical micrograph of IG–Cu(Ti) was taken as shown in Figure 16(a). Many small Cu grains (20 μm) with white contrast are distributed in the IG–Cu(Ti) sample homogeneously. No change in the optical micrographs and X-ray diffraction patterns was observed after the addition of Ti to C/Cu composite materials. TEM observations were also carried out, as shown in Figure 16(b). Figure 16(b) is a low magnification image of the C/Cu interface in the IG–Cu(Ti) sample. A reaction layer with many grains is observed at the C/Cu interface. The Cu/TiC and TiC/C interfaces are shown in Figure 16(c) and (d), respectively (Oku 2007). The lattice fringes of Cu, CuTi2 and TiC, which were determined by the d-spacings of the lattice fringes, are observed. The grain sizes of the TiC and TiCu2 compounds are 5 nm. The electron diffraction patterns of the C/Cu interface also showed Debye–Scherrer rings corresponding to TiC and CuTi2 in addition to the Cu reflections.

(a) Optical micrograph of IG–Cu(Ti). (b) TEM image, (c), (d) HREM images of the Cu/C interface.
Figure 17 shows the calculated formation enthalpy of Ti–C and Ti–Cu compounds (de Boer et al. 1988; Oku and Oku 2007). The melting points (Tm) of the compounds are also indicated in Figure 17(a) (Massalski 1999). The TiC compound has Ti composition in the range of 32–49 %, which correspond to the compounds of TiC2, Ti3C5, Ti2C3 and TiC.
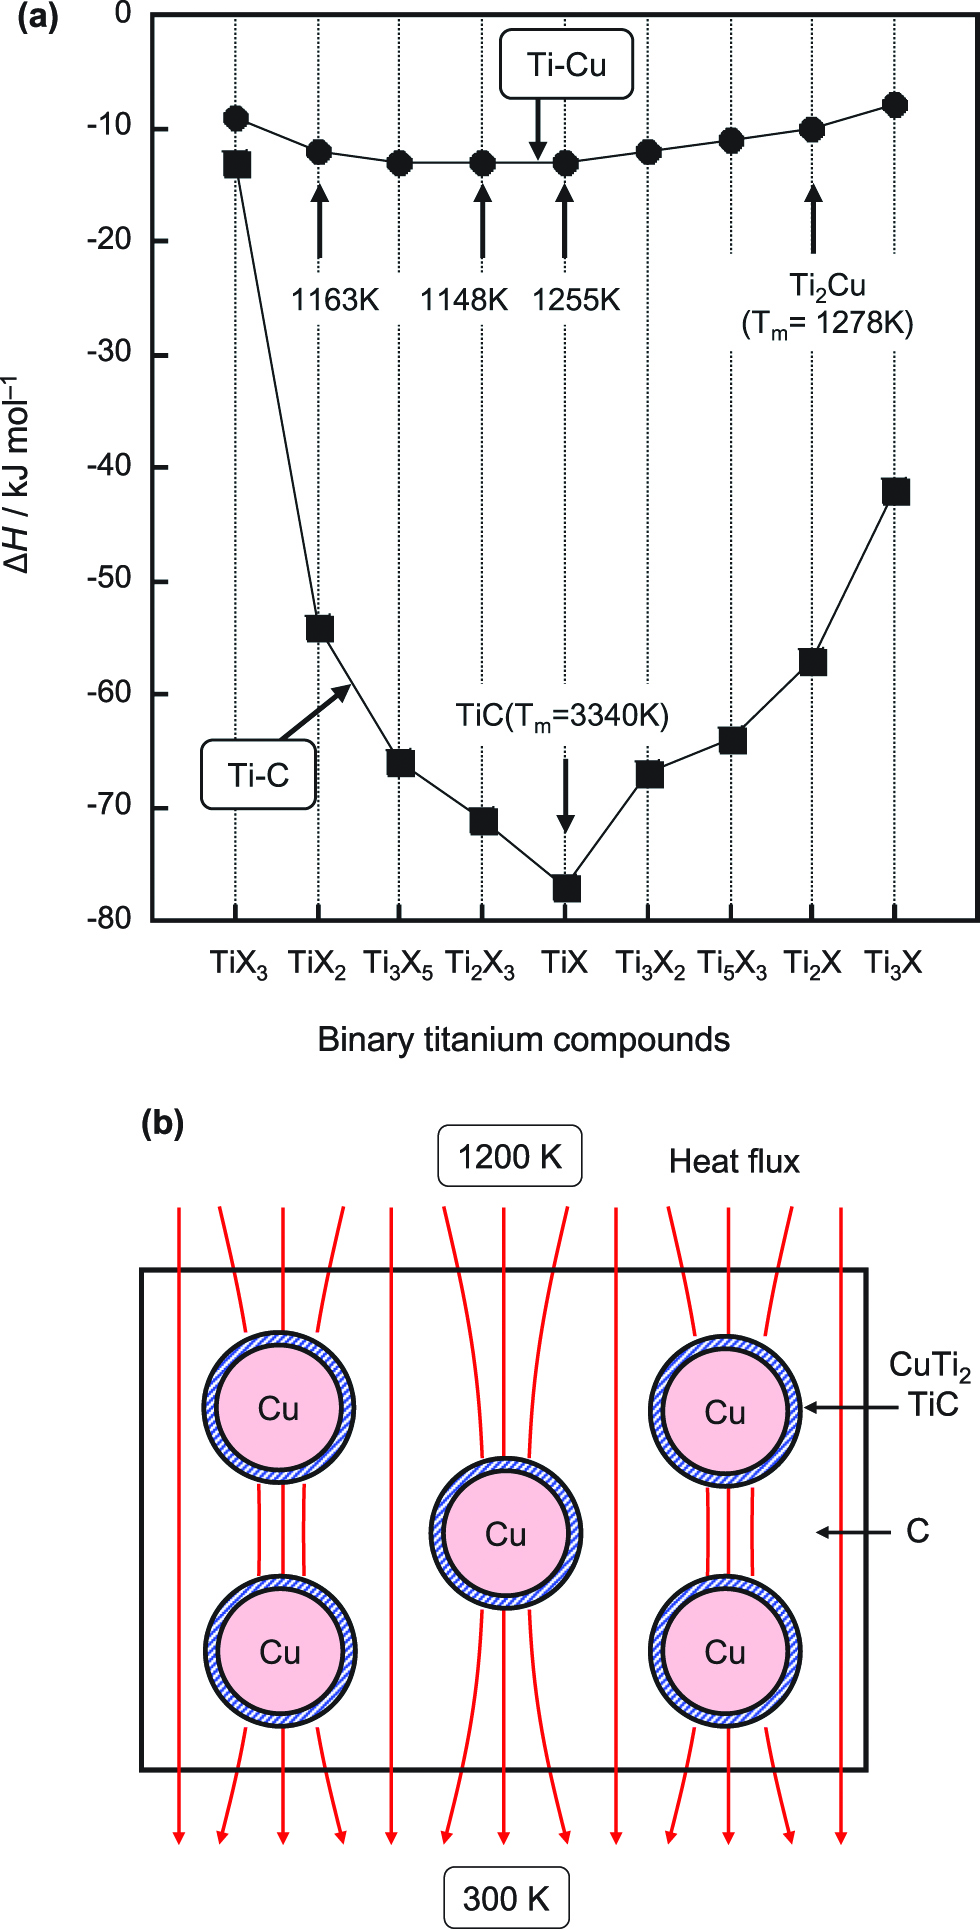
(a) Calculated formation enthalpy of Ti–C and Ti–Cu compounds. Melting points (Tm) of compounds are indicated. (b) Schematic illustration of thermal conduction for C/Cu(Ti) composite materials.
In these compositions, the TiC has the lowest ΔH value as indicated in Figure 17(a), which could result in the formation of TiC. On the other hand, in Ti–Cu compounds, the differences in ΔH values are not so large. The melting points of the Ti–Cu compounds are indicated in Figure 17(a), and the Ti2Cu compound has the highest melting point of 1278 K, which could result in the formation of Ti2Cu at the interface.
The above results indicate that a small amount of titanium reacted with C and Cu to form TiC and TiCu2 compounds, resulting in an increase in thermal conductivity. Figure 17(b) shows a model of thermal conduction for the C/Cu(Ti) composite materials presented in this text. It is believed that thermal energy would pass through both C and C/Cu/C, and that the heat flux is higher around the Cu particles, as shown in Figure 17(b). In particular, thermal conductivity is increased by the addition of a small amount of titanium, which forms TiC and Ti–Cu compounds at the interface. This compound formation would increase cohesion at the C/Cu interface, resulting in high thermal conductivity at high temperatures. The present study indicates that addition of a small amount of a third element with low formation enthalpy with C and Cu will increase the thermal conductivity at high temperatures. The ΔH values can be one of the guidelines for material selection (Oku et al. 1996, 1997, 2004, 2006; Uekubo et al. 1996). Since the element zirconium has the lowest ΔH value with C and Cu, a further increase in thermal conductivity may be possible through the addition of a small amount of zirconium to C/Cu materials.
11 Summary
It is believed that the nuclear fusion energy is expected as one of the substitutes of fossil fuel in twenty-first century. Conditions of nuclear fusion and its devices were described, and possible applications of nanomaterials for nuclear fusion devices were presented. Muon-catalyzed fusion is one of methods for nuclear fusion to cause even at room temperature. The charged muons are produced by heavy ion irradiation to metals such as beryllium or copper with huge energy. A pyroelectric power source using LiTaO3 crystal was applied to achieve nuclear fusion in a desktop-like device. Possibility of hydrogen storage in metallic alloys is also important for the fusion devices. The hydrogen storage in Pd was studied by diffusion calculation and potential calculation of 4D fusion. The nuclear fusion model for the 4D/TSC and diffusion of deuterium in Pd alloys was investigated. Diffusion time of deuterium is fairly longer than the fusion time for the 4D/TSC, and the continuous fusion reaction may be difficult. Diffusion time of deuterium at the Pd-Ag alloy surface was almost the same as that of Pd. Enhancement of deuterium diffusion in the Pd alloys would be one of the key points for possible continuous nuclear fusion and the hydrogen gas storage for energy materials in the future. C/Cu-based materials with high thermal conductivity at high temperatures were developed by adding a small amount of titanium. The isotropic fine-grained nuclear grade graphite and felt type C/C composite, which were impregnated with Cu (36–48 wt.%) and Ti (0.8–1.1 wt.%), provided 1.3 times higher thermal conductivity of 110 and 200 Wm K−1 at 1200 K than the original carbon materials. Microstructural analysis showed that the increase of thermal conductivity was due to the formation of titanium compounds of TiC and CuTi2 at the C/Cu interface, and that the thermal energy could pass through both the C and Cu. The present study indicates that addition of a small amount of a third element with a low enthalpy of alloy formation with C and Cu will further increase the thermal conductivity and the stability of C/Cu-based materials. These carbon-based materials could be a candidate for materials used in the plasma facing components of fusion devices.
Acknowledgements
The author would like to acknowledge Professors Brian D. Josephson and Tatsuo Oku for stimulating the nuclear fusion research. The author also would like to acknowledge Takuya Kitao, Akihiko Nagata, Akira Minowa, Hirokazu Yada, Atsushi Mizuno, Atsushi Suzuki, Kenji Kikuchi, Akito Takahashi, Akira Kitamura, for excellent collaborative works and useful discussion.
-
Conflicts of interest: The authors declare no conflict of interest.
References
Bogdanova, AN, and G. André. 2004. “Phase Transformations in the Solid Solutions ZrV2Hx at High Hydrogen Concentrations (4<X<5).” Journal of Alloys and Compounds 379: 54–59.10.1016/j.jallcom.2004.02.029Search in Google Scholar
Bom, VR, DL Demin, van Eijk Cwe, VV Filchenkov, NN Grafov, VG Grebinnik, KI Gritsaj, et al. 2003. “Measurement of the Temperature Dependence of the ddμ Molecule Formation Rate in Dense Deuterium at Temperatures of 85-790 K.” Journal of Experimental Theoretical Physics 96: 457–464.10.1134/1.1567420Search in Google Scholar
Bowman, RC, Jr, and F Brent. 2002. “Metallic Hydrides I: Hydrogen Storage and Other Gas-Phase Applications.” MRS Bulletin 27: 688–693.10.1557/mrs2002.223Search in Google Scholar
Burchell, TD, and T. Oku. 1994. “Material Properties Data for Fusion Reactor Plasma-Facing Carbon-Carbon Composites.” Atomic and Plasma-Material Interaction Data for Fusion 5: 77–128.Search in Google Scholar
Chen, J, N Kuriyama, HT Takeshita, H Tanaka, T Sakai, and M. Haruta. 2000. “Hydrogen Storage Alloys with PuNi3-type Structure as Metal Hydride Electrodes.” Electrochemical and Solid-State Letters 3: 249–252.10.1149/1.1391115Search in Google Scholar
Chen, P, X Wu, J Lin, and KL. Tan. 1999. “High H2 Uptake by Alkali-Doped Carbon Nanotubes under Ambient Pressure and Moderate Temperatures.” Science 285: 91–93.10.1126/science.285.5424.91Search in Google Scholar PubMed
De Boer, FR, R Boom, WCM Mattens, AR Miedema, and AK. Niessen. 1988. Cohesion in Metals, Transition Metal Alloys. Amsterdam: North-Holland.Search in Google Scholar
Dillon, AC, KM Jones, TA Bekkedahl, H Kiang, DS Bethune, and MJ. Heben. 1997. “Storage of Hydrogen in Single-Walled Carbon Nanotubes.” Nature 386: 377–379.10.1038/386377a0Search in Google Scholar
Dujardin, E, TW Ebbesen, H Hiura, and K. Tanigaki. 1994. “Capillarity and Wetting of Carbon Nanotubes.” Science 265: 1850–1852.10.1126/science.265.5180.1850Search in Google Scholar PubMed
Eichler, A, H Wühl, and B. Stritzker. 1975. “Tunneling Experiments on Superconducting Palladium-Deuterium Alloys.” Solid State Communications 17: 213–216.10.1016/0038-1098(75)90045-9Search in Google Scholar
Flynn, C.P, and AM. Stoneham. 1970. “Quantum Theory of Diffusion with Application to Light Interstitials in Metals.” Physical Reviews B 1: 3966–3978.10.1103/PhysRevB.1.3966Search in Google Scholar
Grochala, W, and PP. Edwards. 2004. “Thermal Decomposition of the Non-Interstitial Hydrides for the Storage and Production of Hydrogen.” Chemical Reviews 104: 1283–1316.10.1021/cr030691sSearch in Google Scholar PubMed
Halstead, TK. 1974. “Proton NMR Studies of Lanthanum Nickel Hydride: Structure and Diffusion.” Journal of Solid State Chemistry 11: 114–119.10.1016/0022-4596(74)90105-4Search in Google Scholar
Häussermann, U, H Blomqvist, and D. Noréus. 2002. “Bonding and Stability of the Hydrogen Storage Material Mg2NiH4.” Inorganic Chemistry 41: 3684–3692.10.1021/ic0201046Search in Google Scholar PubMed
Hayashi, S, K Hayamizu, and O. Yamamoto. 1986. “X-Ray Diffraction and 1H and 51V NMR Study of the Structure of a Ti-V-H Alloy in Relation to Preparation Conditions.” Journal of Less Common Metals 123: 75–84.10.1016/0022-5088(86)90116-5Search in Google Scholar
Heidenreich, A, J Jortner, and I. Last. 2006. “Cluster Dynamics Transcending Chemical Dynamics toward Nuclear Fusion.” Proceedings of the National Academy of Sciences 103: 10589–10593.10.1073/pnas.0508622103Search in Google Scholar PubMed PubMed Central
Hirth, JP. 1980. “Effects of Hydrogen on the Properties of Iron and Steel.” Metallurgical Transactions A 11: 861–890.10.1007/BF02654700Search in Google Scholar
Horinouchi, S, Y Yamanoi, T Yonezawa, T Mouri, and H. Nishihara. 2006. “Hydrogen Storage Properties of Isocyanide-Stabilized Palladium Nanoparticles.” Langmuir 22: 1880–1884.10.1021/la052657+Search in Google Scholar PubMed
Imao, H, K Ishida, N Kawamura, T Matsuzaki, Y Matsuda, A Toyoda, P Strasser, M Iwasaki, and K. Nagamine. 2008. “Density Effect in D-D Muon-Catalyzed Fusion with Ortho- and Para-Enriched D2.” Physics Letters B 658: 120–124.10.1016/j.physletb.2007.10.068Search in Google Scholar
ITER. http://www.iter.org/proj/inafewlinesSearch in Google Scholar
JAEA. http://www.jaea.go.jp/english/index.htmlSearch in Google Scholar
Kasatani, H, H Ootaka, S Aoyagi, A Kimura, and Y. Kuroiwa. 2004. “Charge Density Study on the Ferroelectric Phase in LiTaO3 by Synchrotron Radiation Powder Diffraction.” Ferroelectrics 304: 163–166.10.1080/00150190490457870Search in Google Scholar
Kayano, H, M Teshigawara, K Konashi, and T. Yamamoto. 1994. “Derivation of Energy Generated by Nuclear Fission-Fusion Reaction.” Sciences Reports Researcher Institutes Tohoku University Series A 40: 13–15.Search in Google Scholar
Kim, YE. 2009. “Theory of Bose–Einstein Condensation Mechanism for Deuteron-Induced Nuclear Reactions in Micro/Nano-Scale Metal Grains and Particles.” Naturwissenschaften 96: 803–811.10.1007/s00114-009-0537-6Search in Google Scholar PubMed
Kim, YE. 2011. “Generalized Theory of Bose-Einstein Condensation Nuclear Fusion for Hydrogen-Metal System.” Journal of Condensed Matter Nuclear Science 4: 188–208.10.1016/j.jnucmat.2010.12.004Search in Google Scholar
Kitamura, A, T Nohmi, Y Sasaki, A Taniike, A Takahashi, R Seto, and Y. Fujita. 2009. “Anomalous Effects in Charging of Pd Powders with High Density Hydrogen Isotopes.” Physics Letters A 373: 3109–3112.10.1016/j.physleta.2009.06.061Search in Google Scholar
Knowles, PE, A Adamczak, JM Bailey, GA Beer, JL Beveridge, MC Fujiwara, TM Huber, et al. 1997. “Muon Catalyzed Fusion in 3 K Solid Deuterium.” Physical Reviews A 56: 1970–1982.10.1103/PhysRevA.56.1970Search in Google Scholar
Konashi, K, H Kayano, and M. Teshigawara. 1996. “Analysis of Heavy-Ion-Induced Deuteron-Deuteron Fusion in Solids.” Fusion Science and Technology 29: 379–384.10.13182/FST96-A30724Search in Google Scholar
Kumar, EM, S Sinthika, and R. Thapa. 2015. “First Principles Guide to Tune h-BN Nanostructures as Superior Light-Element-Based Hydrogen Storage Materials: Role of the Bond Exchange Spillover Mechanism.” Journal of Materials Chemistry A 3: 304–313.10.1039/C4TA04706KSearch in Google Scholar
Kusada, K, H Kobayashi, R Ikeda, Y Kubota, M Takata, S Toh, T Yamamoto, et al. 2014. “Solid Solution Alloy Nanoparticles of Immiscible Pd and Ru Elements Neighboring on Rh: Changeoverof the Thermodynamic Behavior for Hydrogen Storage and Enhanced CO-oxidizing Ability.” Journal of the American Chemical Society 136: 1864–1871.10.1021/ja409464gSearch in Google Scholar PubMed
Liu, C, YY Fan, M Liu, HT Cong, HM Cheng, and MS. Dresselhaus. 1999. “Hydrogen Storage in Single-Walled Carbon Nanotubes at Room Temperature.” Science 286: 1127–1129.10.1126/science.286.5442.1127Search in Google Scholar PubMed
Massalski, TB Ed. 1999. “Binary Alloy Phase Diagrams. ASM International.Search in Google Scholar
Mitsui T, Rose MK, Fomin E, Ogletree DF, Salmeron M. 2003. “Dissociative Hydrogen Adsorption on Palladium Requires Aggregates of Three or More Vacancies.” Nature 422: 705–707.10.1038/nature01557Search in Google Scholar PubMed
Muthu, RN, S Rajashabala, and R. Kannan. 2015. “Synthesis and Characterization of Polymer (Sulfonated Poly-Ether-Ether-Ketone) Based Nanocomposite (H-Boron Nitride) Membrane for Hydrogen Storage.” International Journal of Hydrogen Energy 40: 1836–1845.10.1016/j.ijhydene.2014.11.136Search in Google Scholar
Naranjo, B, JK Gimzewski, and S. Putterman. 2005. “Observation of Nuclear Fusion Driven by a Pyroelectric Crystal.” Nature 434: 1115–1117.10.1038/nature03575Search in Google Scholar PubMed
Nijkamp, MG, JEMJ Raaymakers, AJ Van Dillen, and KP. De Jong. 2001. “Hydrogen Storage Using Physisorption-Materials Demands.” Applied Physics A 72: 619–623.10.1007/s003390100847Search in Google Scholar
Nützenadel, C, A Züttel, D Chartouni, and L. Schlapbach. 1999. “Electrochemical Storage of Hydrogen in Nanotube Materials.” Electrochemical and Solid-State Letters 2: 30–32.10.1149/1.1390724Search in Google Scholar
Oku, T. 2012. “Direct structure analysis of advanced nanomaterials by high-resolution electron microscopy.” Nanotechnology Reviews 1: 389–425.10.1515/ntrev-2012-0018Search in Google Scholar
Oku, T. 2014. “High-resolution electron microscopy and electron diffraction of perovskite-type superconducting copper oxides.” Nanotechnology Reviews 3: 413–444.10.1515/ntrev-2014-0003Search in Google Scholar
Oku, T. 2015. “Hydrogen Storage in Boron Nitride and Carbon Nanomaterials.” Energies 8: 319–337.10.3390/en8010319Search in Google Scholar
Oku, T. 2017. Solar Cells and Energy Materials. Berlin: Walter de Gruyter.10.1515/9783110298505Search in Google Scholar
Oku, T, M Furumai, CJ Uchibori, and M. Murakami. 1997. “Formation of WSi-based Ohmic Contacts to N-Type GaAs.” Thin Solid Films 300: 218–222.10.1016/S0040-6090(96)09511-9Search in Google Scholar
Oku, T, T Hiraoka, and K Kuroda. 1995. “Improvement of Thermal Conductivity of Carbon Materials Due to Addition of Metal Particles.” Journal of Nuclear Science and Technology 32: 816–818.10.1080/18811248.1995.9731778Search in Google Scholar
Oku, T, E Kawakami, M Uekubo, K Takahiro, S Yamaguchi, and M. Murakami. 1996. “Diffusion Barrier Property of TaN between Si and Cu.” Applied Surface Science 99: 265–272.10.1016/0169-4332(96)00464-3Search in Google Scholar
Oku, T, and T. Kitao. 2015. “Hydrogen Storage and Possible Condensation of Deuterium in Palladium.” Nanoscience & Nanotechnology-Asia 5: 137–143.10.2174/2210681205666151030221352Search in Google Scholar
Oku, T, A Kurumada, T Sogabe, T Oku, T Hiroka, and K Kuroda. 1998. “Effects of Titanium Impregnation on the Thermal Conductivity of Carbon/Copper Composite Materials.” Journal of Nuclear Materials 257: 59–66.10.1016/S0022-3115(98)00434-6Search in Google Scholar
Oku, T, I Narita, N Koi, A Nishiwaki, K Suganuma, M Inoue, K Hiraga, et al. 2009. “Boron Nitride Nanocage Clusters, Nanotubes, Nanohorns, Nanoparticles, and Nanocapsules.” In B-C-N Nanotubes and Related Nanostructures. Springer, Berlin, Germany, ed. Y.K. Yap, 149–194.10.1007/978-1-4419-0086-9_6Search in Google Scholar
Oku, T, I Narita, A Nishiwaki, and N. Koi. 2004. “Atomic Structures, Electronic States and Hydrogen Storage of Boron Nitride Nanocage Clusters, Nanotubes and Nanohorns.” Defect and Diffusion Forum 226–228: 113–140.10.4028/www.scientific.net/DDF.226-228.113Search in Google Scholar
Oku, T, I Narita, A Nishiwaki, N Koi, K Suganuma, R Hatakeyama, T Hirata, H Tokoro, and S. Fujii. 2006. “Formation, Atomic Structures and Properties of Carbon Nanocage Materials.” Topics in Applied Physics 100: 187–216.10.1007/11378235_10Search in Google Scholar
Oku, T, and T. Oku. 2007. “Effects of Titanium Addition on the Microstructure of Carbon/Copper Composite Materials.” Solid State Communications 141: 132–135.10.1016/j.ssc.2006.10.013Search in Google Scholar
Ozawa, N, H Nakanishi, S Kunikata, and H. Kasai. 2007. “A Behavior of A Hydrogen Atom Pd0.75Ag0.25(111).” Journal of the Vacuum Society of Japan 50: 440–443.10.3131/jvsj.50.440Search in Google Scholar
Reibold, M, AA Levin, DC Meyer, P Paufler, and W. Kochmann. 2006. “Microstructure of a Damascene Sabre after Annealing.” International Journal of Materials Research 97: 1172–1182.10.3139/146.101355Search in Google Scholar
Reidinger, F, JF Lynch, and JJ. Reilly. 1982. “An X-Ray Diffraction Examination of the FeTi-H2 System.” Journal of Physics F: Metal Physics 12: L49–L55.10.1088/0305-4608/12/3/007Search in Google Scholar
Schlapbach, L, and A. Züttel. 2001. “Hydrogen-Storage Materials for Mobile Applications.” Nature 414: 353–358.10.1038/35104634Search in Google Scholar PubMed
Skoskiewicz, T. 1972. “Superconductivity in the Palladium-Hydrogen and Palladium-Nickel-Hydrogen Systems.” Physica Status Solidi 11: K123–K126.10.1002/pssa.2210110253Search in Google Scholar
Stritzker, B. 1974. “High Superconducting Transition Temperatures in the Palladium-Noble Metalhydrogen System.” Z Physical 268: 261–264.10.1007/BF01669889Search in Google Scholar
Stritzker, B, and W. Buckel. 1972. “Superconductivity in the Palladium-Hydrogen and the Palladium Deuterium Systems.” Zeitschrift für Physik 257: 1–8.10.1007/BF01398191Search in Google Scholar
Su, YC, J Yan, PT Lu, and JT. Su. 2006. “Thermodynamic Analysis and Experimental Research on Li Intercalation Reactions of the Intermetallic Compound Al2Cu.” Solid State Ionics 177: 507–513.10.1016/j.ssi.2005.12.007Search in Google Scholar
Sugimoto, H. 2006. “Diffusion Mechanism of Hydrogen in Solids.” Journal of the Vacuum Society of Japan 49: 17–22.10.3131/jvsj.49.17Search in Google Scholar
Takahashi, A. 2007B. “A Theoretical Summary of Condensed Matter Nuclear Effects.” Journal of Condensed Matter Nuclear Science 1: 129–141.10.1142/9789812772985_0001Search in Google Scholar
Takahashi, A. 2009. “Dynamic Mechanism of TSC Condensation Motion.” Journal Cond Matt Nuclear Sciences 2: 33–44.10.70923/001c.72113Search in Google Scholar
Takahashi, A, K Maruta, K Ochiai, H Miyamaru, and T. Iida. 1998. “Anomalous Enhancement of Three-Body Deuteron Fusion in Titanium-Deuteride with Low-Energy D+ Beam Implantation.” Fusion Science and Technology 34: 256–272.10.13182/FST98-A70Search in Google Scholar
Takahashi, A, and N. Yabuuchi. 2007A. “Fusion Rates of Bosonized Condensates.” Journal of Condensed Matter Nuclear Science 1: 106–128.10.70923/001c.72106Search in Google Scholar
Tripodi, P, D Di Gioacchino, and JD. Vinko. 2007. “A Review of High Temperature Superconducting Property of PdH System.” International Journal of Modern Physics B 21: 3343–3347.10.1142/S0217979207044524Search in Google Scholar
Uekubo, M, T Oku, K Nii, M Murakami, K Takahiro, S Yamaguchi, T Nakano, and T. Ohta. 1996. “WNx Diffusion Barriers between Si and Cu.” Thin Solid Films 286: 170–176.10.1016/S0040-6090(96)08553-7Search in Google Scholar
Widom, A, and L. Larsen. 2006. “Ultra Low Momentum Neutron Catalyzed Nuclear Reactions on Metallic Hydride Surfaces.” European Physical Journal C 46: 107–111.10.1140/epjc/s2006-02479-8Search in Google Scholar
Wu, X.B, P Chen, J Lin, and KL. Tan. 2000. “Hydrogen Uptake by Carbon Nanotubes.” International Journal of Hydrogen Energy 25: 261–265.10.1016/S0360-3199(99)00037-3Search in Google Scholar
Zhang, H, CJY Tong Zhang, YN Zhang, and LM. Liu. 2015. “Porous BN for Hydrogen Generation and Storage.” Journal of Materials Chemistry A 3: 9632–9637.10.1039/C5TA01052GSearch in Google Scholar
© 2018 Walter de Gruyter Inc., Boston/Berlin
Articles in the same Issue
- Frontmatter
- Editorial
- Characterization of Thermal Energy Harvesting Using Pyroelectric Ceramics at Elevated Temperatures
- Possible Applications of Nanomaterials for Nuclear Fusion Devices
- DFT Study of Anthocyanidin and Anthocyanin Pigments for Dye Sensitized Solar Cells: Electron Injecting from the Excited States and Adsorption onto TiO2 (Anatase) Surface