Determining qualitative effect size ratings using a likelihood ratio scatter matrix in diagnostic test accuracy systematic reviews
-
Matthew L. Rubinstein


Abstract
Background
Diagnostic test accuracy (DTA) systematic reviews (SRs) characterize a test’s potential for diagnostic quality and safety. However, interpreting DTA measures in the context of SRs is challenging. Further, some evidence grading methods (e.g. Centers for Disease Control and Prevention, Division of Laboratory Systems Laboratory Medicine Best Practices method) require determination of qualitative effect size ratings as a contributor to practice recommendations. This paper describes a recently developed effect size rating approach for assessing a DTA evidence base.
Methods
A likelihood ratio scatter matrix will plot positive and negative likelihood ratio pairings for DTA studies. Pairings are graphed as single point estimates with confidence intervals, positioned in one of four quadrants derived from established thresholds for test clinical validity. These quadrants support defensible judgments on “substantial”, “moderate”, or “minimal” effect size ratings for each plotted study. The approach is flexible in relation to a priori determinations of the relative clinical importance of false positive and false negative test results.
Results and conclusions
This qualitative effect size rating approach was operationalized in a recent SR that assessed effectiveness of test practices for the diagnosis of Clostridium difficile. Relevance of this approach to other methods of grading evidence, and efforts to measure diagnostic quality and safety are described. Limitations of the approach arise from understanding that a diagnostic test is not an isolated element in the diagnostic process, but provides information in clinical context towards diagnostic quality and safety.
Introduction
Background
Clinical laboratory testing generates information to benefit patient management decisions in support of health, while inaccurate or inappropriate testing may contribute to patient harm [[1], [2], [3]. Moreover, measures of diagnostic test accuracy (DTA) provide insight into a test’s (or test combination’s) ability to contribute to quality and safety within diagnostic pathways by estimating a test’s clinical validity 4]. Based on rates of true positives (TP), false positives (FP), true negatives (TN), and false negatives (FNs), these measures can inform the appropriate role of a test in a diagnostic pathway, and can assist in interpretation of test results for individual patients as generally depicted in Figure 1 [6], [7], [8], [9].
![Figure 1: Uses of DTA measures in the total testing process.For definitions and characteristics of the total testing process in general, refer to Plebani [5].](/document/doi/10.1515/dx-2018-0061/asset/graphic/j_dx-2018-0061_fig_001.jpg)
Uses of DTA measures in the total testing process.
For definitions and characteristics of the total testing process in general, refer to Plebani [5].
Measures of DTA can be determined through diagnostic cross-sectional studies and diagnostic case-control studies which assess performance of one or more index tests in relation to a gold standard or reference method test [[10], [11], [12], [13]. Through these study designs, rates of TP, FP, TN and FN are derived for assembly into various summary measures as illustrated in Figure 214].
![Figure 2: Measures of DTA and their significance.Figure adapted from Bossuyt 2008 [14].](/document/doi/10.1515/dx-2018-0061/asset/graphic/j_dx-2018-0061_fig_002.jpg)
Measures of DTA and their significance.
Figure adapted from Bossuyt 2008 [14].
DTA systematic reviews (SRs) are a method for developing recommendations on the use of a test or a combination of tests [[15], [16], [17]. In DTA SRs, studies are synthesized to obtain pooled, and potentially more reliable, DTA measures. Further, DTA SRs may help investigators determine how DTA may vary by populations, settings/clinical contexts, or positivity thresholds 15], [[16], [18], [19]. However, such findings are not the only arbiter of decisions on test implementation and interpretation in support of diagnostic quality and safety [20], [21], [22]. For example, a DTA evidence base, of itself, cannot directly indicate downstream consequences without additional linkage to separate bodies of evidence (e.g. on treatment efficacy for the target condition), or through logical inference 23]. Adding to the interpretative challenges, published DTA SRs often provide a scattershot of DTA measures, without guidance on which are more informative for those making test implementation decisions [[24], [25], [26]. This situation is especially problematic when one considers, as noted by Schiff 2012, it is possible “the average clinician could care less about…a new study to increase their positive predictive value” 27]. While more patient-centered research strategies have been described through controlled trials assessing outcomes of test-and-treat interventions, and through hierarchical assessments of test efficacy, such studies are less often found in the available evidence base [10], [28], [29], [30], [31], [32].
Some of these limitations of DTA SRs may partially relate to infrequent use of an analytic framework, which provides scope and context for DTA measures, and is a recommended standard for SRs in general [33], [34]. Interpretive challenges may also arise when primary DTA studies are poorly reported or demonstrate risk of bias. Reporting standards for DTA studies are found in the Standards for Reporting of Diagnostic Accuracy, and risk of bias is identifiable through the Quality Assessment of Diagnostic Accuracy Studies risk of bias tool [35], [36], [37], [38].
In addition to these challenges, some SR methods [e.g. the Centers for Disease Control and Prevention, Division of Laboratory Systems (CDC DLS) Laboratory Medicine Best Practices (LMBP) method] require determination of qualitative effect size ratings (e.g. “substantial”, “moderate”, “minimal”) as a partial determinant of the strength of body-of-evidence [33]. Table 1 details the CDC DLS LMBP method’s criteria for rating the strength of a body-of-evidence, in general taking into account the number of studies (within an intervention group) with particular effect size ratings and study quality ratings.
CDC DLS LMBP criteria for determining strength of body-of-evidence ratings.
| Strength of evidence rating | # of studies | Effect size rating | Quality rating |
|---|---|---|---|
| High | ≥3 | Substantial | Good |
| Moderate | 2 | Substantial | Good |
| or ≥3 | Moderate | Good | |
| Suggestive | 1 | Substantial | Good |
| or 2 | Moderate | Good | |
| or ≥3 | Moderate | Fair | |
| Insufficient | Too few | Minimal | Fair |
Adapted from: Christenson et al. [33].
Objective
To address these DTA SR challenges, a clinically meaningful approach was needed in order to derive a single qualitative effect size rating for each DTA study and for a body of evidence as a whole. This paper describes the approach developed, which is based on:
Location of a diagnostic accuracy study within a four-quadrant likelihood ratio scatter matrix and
Matrix quadrant demarcation derived from established likelihood ratio thresholds signifying high clinical validity.
Materials and methods
Likelihood ratios are depicted in Table 2, and multiple resources are available to further aid in understanding and interpretation [13], [17], [39], [40], [41], [42], [43], [44], [45]. In general, clinical interpretation of likelihood ratios includes use of probability thresholds, Fagan’s nomogram, and Bayesian reasoning.
Positive and negative likelihood ratio definitions and interpretations.a
| Positive likelihood ratio | Negative likelihood ratio | ||
|---|---|---|---|
| What it is: the probability of an individual with target condition (e.g. disease, gene, infectious organism) having a positive test result relative to the probability of an individual without the target condition having a positive test result. Higher values are better (with low values there is increased risk of FPs) How it’s calculated: +LR=sensitivity/(1–specificity) Intuitive example: if the test has a +LR=15, then a person who has the condition is 15 times more likely to have a positive result than a person without the condition | What it is: the probability of an individual with target condition (e.g. disease, gene, infectious organism) having a negative test result relative to the probability of an individual without the target condition having a negative test result. Lower values are better (with high values there is increased risk of FNs) How it’s calculated: −LR=(1–sensitivity)/specificity Intuitive example: if the test has a −LR=0.05, then the person who has the condition is 20 times (1/0.05) less likely to have a negative result than a person without the condition | ||
| Interpretation when test result is positive | Interpretation when test result is negative | ||
| >10 | High likelihood target condition is present when test is positive | ≤0.1 | High likelihood target condition is absent when test is negative |
| >5–10 | Moderate likelihood target condition is present when test is positive | >0.1–0.2 | Moderate likelihood target condition is absent when test is negative |
| >2–5 | Low likelihood target condition is present when test is positive | >0.2–0.5 | Low likelihood target condition is absent when test is negative |
| ≤2 | Test not likely to identify patients having target condition when test is positive | >0.5 | Test not likely to identify patient not having target condition when test is negative |
aInterpretation cutoffs adapted from Jaeschke et al. [39] in order to convey mutually exclusive categories. Limitations of cutoffs are discussed in the Methods section.
Figure 3 further characterizes likelihood ratios by illustrating their relationship to other DTA measures, and their relationship to ruling-in or ruling-out a target condition.
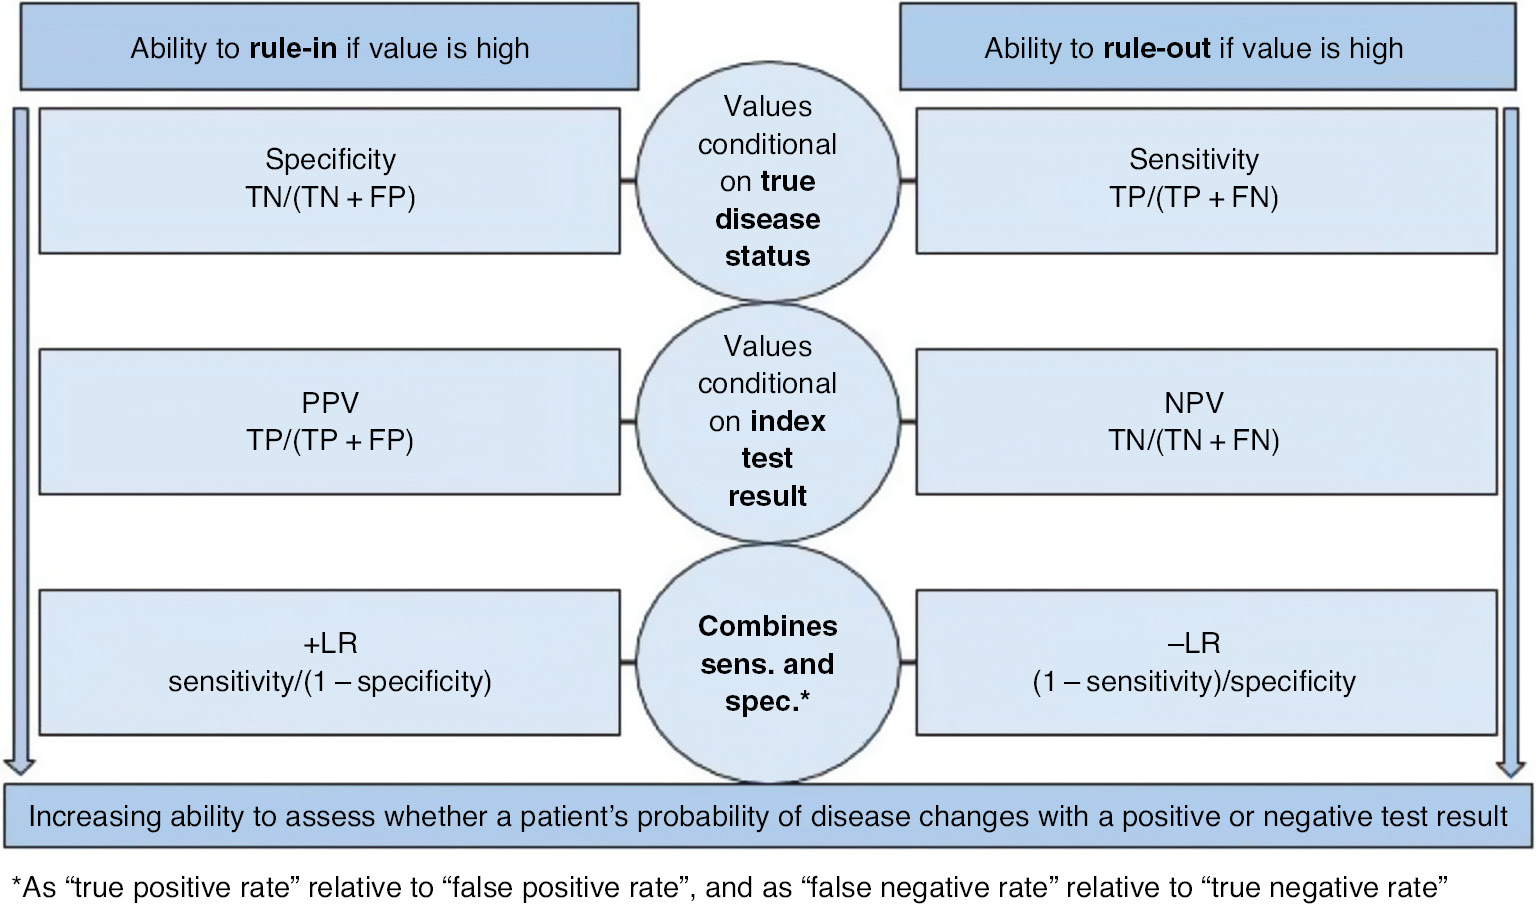
General depiction of DTA measure ability to rule-in or rule-out.
Use of likelihood ratios to determine effect size rating
The American Society for Microbiology (ASM) recently completed a SR using the CDC DLS’s LMBP method to derive practice recommendations for Clostridium difficile testing practices (pending publication at this time). The evidence base for this SR consisted of DTA studies, and the SR was conducted in collaboration with the CDC DLS.
DTA studies present analysis challenges not encountered when assessing other types of evidence such as randomized controlled trials and before-and-after studies [15], and the CDC DLS LMBP SR method was not developed to optimally address some of these challenges. An important challenge is interpretation of the tradeoff between diagnostic sensitivity and specificity, particularly in the context of the LMBP method of evidence grading. Given that DTA studies report two related effects (diagnostic sensitivity and specificity), the review team determined that an approach was needed to capture (1) the trade-off between these two measures of effect, and (2) the clinical importance of this tradeoff. Lastly, an approach for deriving a single qualitative effect size rating from these measures was needed, expressible as “substantial”, “moderate”, or “minimal” (see Table 1 evidence rating criteria) [13].
Approach step 1
The solution (developed by authors MLR and JSP) was based on two diagnostic accuracy effect measures: the positive likelihood ratio (+LR) and the negative likelihood ratio (−LR). Further, the solution adopts cutoff points described in the literature as providing strong evidence of a test’s ability to rule-in or rule-out a disease [8], [17], [39], [44], [46], [47], [48], [49], and extends them into the following +LR and –LR effect pairings:
“Substantial” effect rating, if: +LR>10 and –LR<0.1
“Moderate” effect rating, if: +LR>10 and –LR>0.1 or +LR<10 and –LR<0.1
“Minimal” effect rating, if: +LR<10 and –LR>0.1
It is necessary to express some caveats for these likelihood ratio cutoffs. First, these cutoffs, and the post-test probabilities of disease derived by using them, are not of themselves diagnostic. Accurate diagnosis depends on integration of information arising from diagnostic processes, including history, physical findings, and results of other testing, and it depends on multi-professional efforts to overcome diagnosis “pitfalls and challenges” [27], [[50], [51], [52]. Second, there is an arbitrary nature to setting cutoffs/thresholds in support of qualitative effect size judgments. Cutoffs in support of effect size interpretation, therefore, are not ironclad rules of thumb – effect size interpretation should occur in context of the practical, clinical importance for whatever is being researched [53], [54], [55], [56]. Further, while these cutoffs provide strong evidence of a test’s ability to rule-in (+LR>10) or rule-out (–LR<0.1) a target condition, in practice this ability is dependent on a patient’s pre-test probability of disease in order for a “large and…conclusive [change] from pretest to posttest probability” to be observed, as is readily demonstrated by Fagan’s nomogram 17], [39], [48]. Finally, as mentioned previously, DTA values (including likelihood ratios) are not a fixed attribute of a test, but may vary according to population, setting/clinical context, or positivity threshold.
Nevertheless, the approach is rooted in established cutoffs representing thresholds for “high” clinical validity in service of (1) straightforward, binary handling of data, and (2) meaningful handling of FP/FN tradeoffs often observed in DTA measures. Given broad acceptance in the literature of these likelihood cutoffs for “high” test information value, a defensible approach was established to meet a specific challenge: derive qualitative effect size measures for a DTA evidence base in a way that is amenable to the CDC DLS LMBP SR method of evidence rating. In general, approaches for simplifying information when making judgments has demonstrated advantages, including accuracy, transparency and accessibility, when the approach is rule-based and framed to a specific context [57]. In sum, this approach allowed for meaningful derivation of effect size ratings for each DTA study, using a DTA measure that is multi-use in nature (application to “test performance, clinical utility, and decision making”), and which may overcome interpretability shortcomings associated with other DTA measures [[58], [59], [60]. Finally, effect ratings derived from +LR/−LR pairings advances the notion that “test results can be valuable both when positive and negative” 61] by preserving the discrimination potential of FPs and FNs.
A last note, while the mathematical ratio of +LR to −LR is commonly referred to as the diagnostic odds ratio (DOR), basing effect ratings on the DOR was determined by the review team to be an unacceptable approach. For example, values for DOR are repetitive across various pairings of +LR to −LR, as illustrated in Deeks 2001 [16], obscuring FP and FN tradeoffs, and further challenging defensible effect rating judgments. For example, a DOR of 500 could indicate either a “substantial” or “moderate” effect if linked to this approach. It is for this reason that pairings of +LR to −LR are assessed, rather than their mathematical ratio expressed as DOR.
Approach step 2
The second step in deriving a single qualitative effect size rating for each study was integrating these cutoffs into a four-quadrant likelihood ratio scatterplot of +LR and –LR pairings, as is further described in the next section.
Generalized approaches for determining effect size ratings
Before applying this approach, a review team in collaboration with an expert panel should identify the relative clinical importance of FPs and TPs, contextualizing the test to the relevant population and clinical setting [24], [25], [48].
The general approach of Figure 4 may be taken when the expert panel determines the clinical importance of FPs and FNs is approximately equal, or that the test (in its intended role) should have the ability to both accurately rule-in and rule-out a target condition. From this perspective, use of point estimates [vs. use of confidence interval (CI) limits] is illustrated when judging effect size rating. However, this approach is flexible if a review team determines it is more appropriate to upgrade or downgrade an effect size rating based on whether the CI for a point estimate overlaps quadrants. For example, the effect size rating could be based on the lower end of a CI if a review team determines that aspect of an estimate is more important to communicate through effect ratings.

First generalized four-quadrant likelihood ratio scatter matrix.
While the approach in Figure 4 is based on an assumption of equal weight for the clinical importance of FPs and FNs, an expert panel may determine the clinical importance of one outweighs the other. There may be scenarios, then, where what might be considered a “Moderate” effect could either be upgraded to “Substantial” or downgraded to “Minimal.”
For example:
When the effects of the disease are serious, but the disease is treatable and the treatment does not cause patient harms or incur high costs. In this scenario a paired effect in the upper right quadrant of Figure 4 might be considered “Substantial” rather than “Moderate”.
Readers may also refer to Hsu et al. 2011 for additional scenarios weighing benefits of correct classification (i.e. TPs and TNs) against the harms of incorrect classifications (i.e. FPs and FNs) as may further inform tailored use of these likelihood scatter matrices [24]. Lastly, readers may also consider the literature on “misdiagnosis” (i.e. wrong diagnosis), “missed diagnosis”, or “delayed diagnosis” [64], [65], [66], [67].
Therefore, as an alternative to the approach illustrated in Figure 4, one of the following perspectives may be emphasized:
Rule-in a target condition (or when the clinical importance of FP results outweighs that of FN results) or
Rule-out a target condition (or when the clinical importance of FN results outweighs that of FP results).
Figure 5 depicts this alternative perspective when using the +LR/−LR scatter matrix to derive effect size ratings. In this case, the figure also depicts how interpretation of effect size may be affected by whether a point’s CIs cross quadrants, with “moderate” effects occurring when the CI crosses the horizontal line (left-hand Figure) or the vertical line (right-hand Figure).
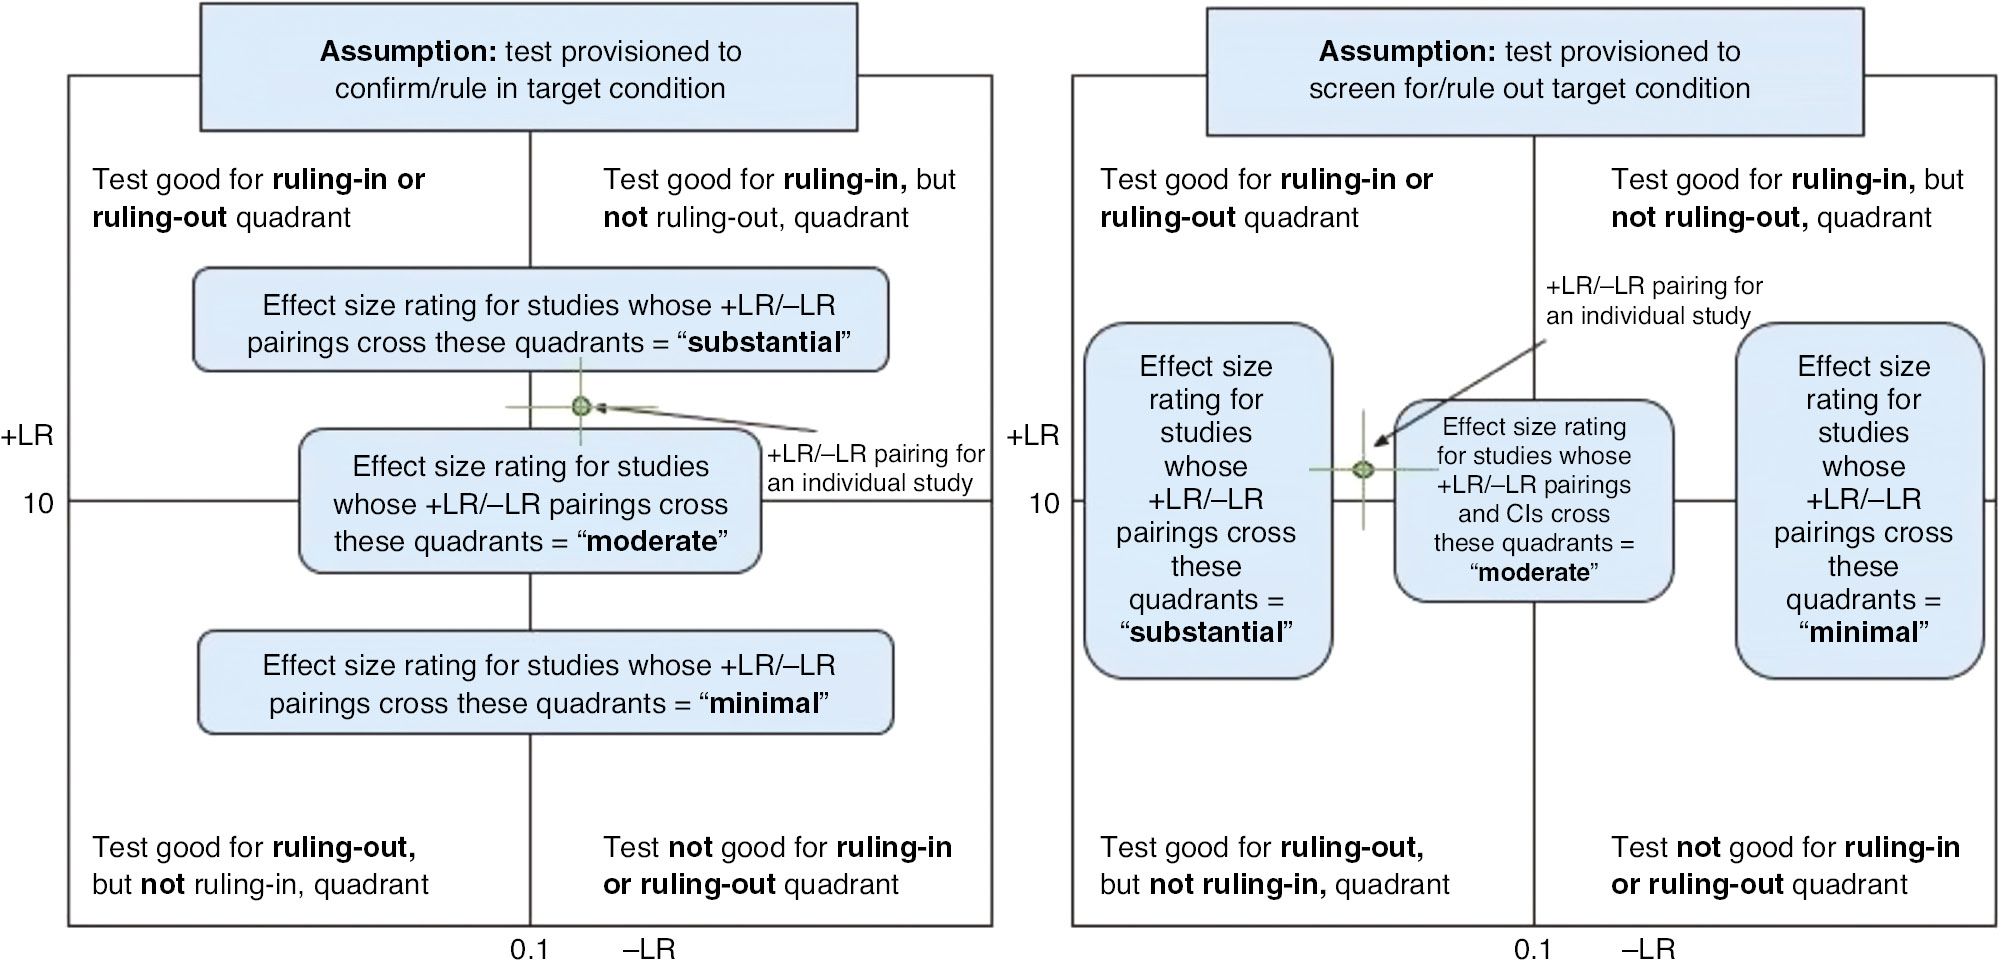
Second generalized four-quadrant likelihood ratio scatter matrix.
Results
Likelihood ratio scatter matrix in the ASM-CDC DLS SR
There are two considerations when rating effect sizes for DTA statistics: (1) identifying an overall index of sample size as relates to the tradeoff between sensitivity and specificity; and (2) weighing their relative clinical importance. To create an overall index of effect, the likelihood ratio scatter matrix was created using the midas command in Stata 15 (Stata Corp., College Station, TX, USA). These scatterplot matrices can be created in any standard statistical package, though the midas procedure in Stata provides the benefit of computing these via a subroutine of the more general diagnostic meta-analysis procedure.
Figure 6 illustrates the likelihood ratio scatter matrix used as a practical tool to rate effect sizes for the SR on C. difficile testing approaches. When paired likelihood ratios were within areas indicating high clinical validity (+LR>10 and –LR<0.1), the review team in collaboration with the project’s expert panel described this as a “Substantial” effect, especially if the CIs of the estimate (as represented by the crosshairs on the summary diamond) did not cross into other quadrants. When only one of the likelihood ratios was within the areas used to indicate high clinical validity, it was considered a “Moderate” effect.
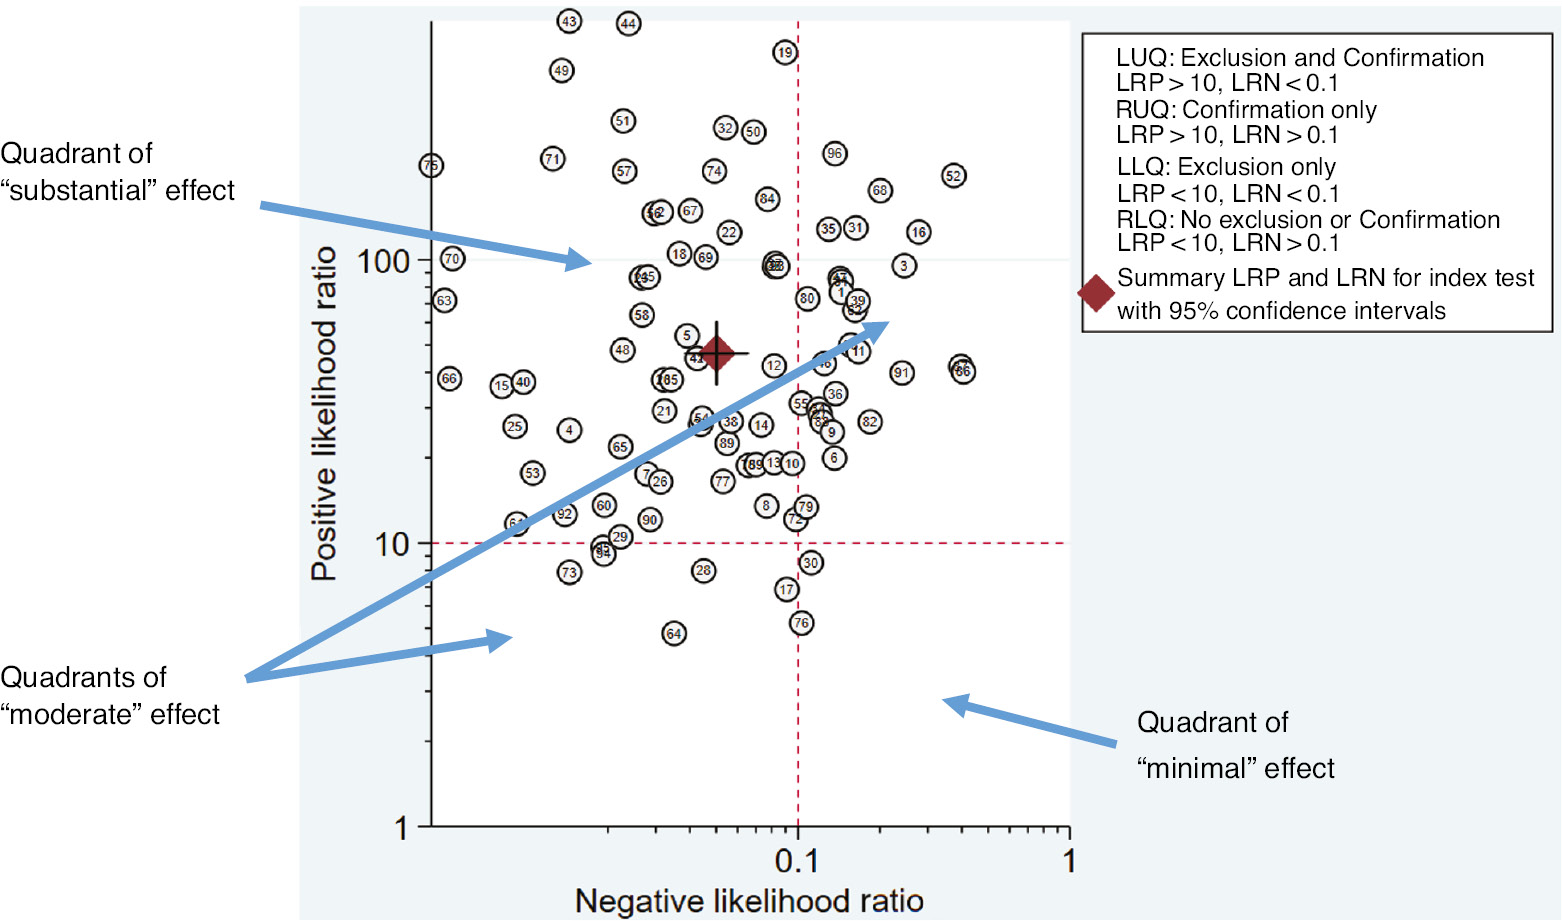
Example of a likelihood ratio scatter matrix to inform effect size ratings in the ASM-CDC DLS SR.
Table 3 illustrates how qualitative effect size ratings subsequently informed the final level of qualitative synthesis in the ASM-CDC DLS SR: rating of overall strength of body-of-evidence using CDC DLS LMBP criteria (Table 1). Strength of body-of-evidence ratings were then used to inform practice recommendations, with three C. difficile test practices achieving a “recommended” categorization as shown in Table 3. This table provides counts for only the highest rated pairings of quality-to-effect for each test practice category. A list of quality ratings and effect size ratings for all studies in the SR is available from the authors upon request, as are details on specific testing practices assessed.
Strength of body of evidence ratings for the ASM-CDC DLS SR based on a DTA evidence base.
| Practice | # studies | Effect size rating | Quality ratinga | Overall strength of body-of-evidence rating |
|---|---|---|---|---|
| Clostridium difficile testing practice 1 | 60 | Substantial | Good | High |
| Clostridium difficile testing practice 2 | 9 | Substantial | Good | High |
| Clostridium difficile testing practice 3 | 7 | Moderate | Good | Moderate |
aQuality ratings were established through the QUADAS-2 risk of bias tool tailored to support the qualitative synthesis approach of the CDC DLS LMBP SR method.
Discussion
Additional implication of this effect rating approach
Additional methods of grading evidence
Other methods for grading the strength of evidence, such the Grading of Recommendations Assessment, Development and Evaluation (GRADE) [68], may benefit from this effect size rating approach. As when applying the CDC DLS LMBP method to a DTA evidence base, challenges in applying GRADE have been described [24], [[25], [69]. Some of these challenges in GRADE have been (in part) addressed by considering DTA a surrogate (intermediate) patient outcome, to the extent that rates of TP, FP, TN, and FN can be inferably linked to patient management or patient health consequences 23], [25], [69], [70]. However, expressing “magnitude of effect” – one of the GRADE criteria for assessing the strength of evidence – for a DTA evidence base appears to remain a challenge.
In GRADE, “magnitude of effect” is a criterion that can upgrade the strength of evidence. While Gopalakrishna et al. 2014 described important challenges in applying three of the GRADE strength of evidence criteria (inconsistency, imprecision, and publication bias), there is no clear solution provided for assessing “magnitude of effect” for DTA. Yet, several GRADE papers, including Gopalakrishna et al. 2014, recommend that (1) the differential patient consequences of TPs, FP, TNs, and FNs be considered when making recommendations from a DTA evidence base, and that (2) these differential consequences should inform emphasis of particular DTA measures [24], [25], [69]. On this last point, however, little detailed guidance is provided.
We suggest these a priori considerations can be expressed through an analytic framework for DTA SRs, which should depict inferable (in the absence of direct evidence) clinical outcome types. Clinical outcomes that can be linked to laboratory testing have been described in the literature [[71], [72], [73]. Further, by appropriating the effect rating approach described here, patient-important consequences of TPs, FPs, TNs, and FNs can be preserved through pairings of +LR/−LN in a way that (1) is readily visualized for “magnitude of effect” assessment, and that (2) promotes transparent, defensible, and reproducible judgments on effect rating toward grading the strength of a body of evidence. In this way DTA SR “judgments on which would be the more critical accuracy measures to focus” 69] could be addressed in a straightforward, intuitive way that is comparable across DTA SRs.
In sum, this +LR/−LR effect rating approach provides a defensible means of deriving effect ratings, as can then inform potential upgrading of strength of evidence when using the GRADE method [74], [75].
For diagnostic quality and safety measures
Diagnostic error has been defined as the “failure to (a) establish an accurate and timely explanation of the patient’s health problem(s), or (b) communicate that explanation to the patient” [[76]. Identifying meaningful measures of diagnostic quality and safety, however, is a noted challenge [50], [76], [77], [78]. While “diagnostic accuracy” in this context signifies more than simply “DTA” (or test clinical validity) 4], [50], [76], +LR/−LR pairings represent an aspect of diagnostic information quality and can aid test interpretation, although (of themselves) are not necessarily a suitable direct measure of diagnostic quality and safety.
In this way, +LR/−LR scatterplot matrix pairings may inform the “Diagnostic Process” domain of quality and safety measures described in the 2017 National Quality Forum (NQF) report Improving Diagnostic Quality and Safety. DTA can be equated with a component of diagnostic accuracy identified in the NQF report as “measurement of initial diagnostic accuracy” or “accuracy of initial diagnosis” [50]. In this context, +LR/−LR scatterplot matrix pairings signal a test’s (or a combination of tests) ability to correctly or incorrectly classify patients in relation to a diagnosis, in a way that is straightforward, visual, and clinically meaningful. Further, +LR/−LR pairings may provide an additional means to express whether “diagnostic tests have adequate analytical and clinical validity [as is] critical to preventing diagnostic errors” [76].
Limitations
While benefiting transparent effect rating judgments, any approach that simplifies findings risks information loss. For example, this approach does not contain information as to resource utilization (e.g. costs), patient preferences, or the indirectness of evidence to patient outcomes. Readers are further cautioned that a diagnostic test is not an isolated element of the patient diagnostic process; however, a test provides information, the quality of which can be assessed toward test utility and patient-related outcomes. Additionally, the strength of this approach may be diminished if DTA for an index test is established in relation to an imperfect reference standard, although this concern was not formally assessed [79], [80].
Finally, use of probabilistic tools (e.g. likelihood ratios, Bayesian reasoning) and “statistical numeracy” has been shown to challenge health care professionals when interpreting diagnostic information [58], [[60], [81], [82], [83]. Yet, this approach to interpreting DTA measures may be relevant to interventions to improve clinical insights from diagnostic reasoning 84], especially in cases where laboratories implement recommendations to provide likelihood ratios in results reporting [59].
Conclusions
Findings of DTA SRs should be interpreted in relation to intended clinical use in support of diagnostic quality and safety. The approach described in this paper facilitates meaningful interpretation of results, as well as determination of qualitative effect size ratings. In this way, +LR/−LR scatterplot matrix pairings are answerable to the call to “move beyond summary measures and ask how a new diagnostic test reclassifies patients” [20] by facilitating ratings of effect linked to clinical practice.
Author contributions: All the authors have accepted responsibility for the entire content of this submitted manuscript and approved submission.
Disclaimer: The findings and views expressed in this paper do not necessarily represent those of the CDC, nor of the CDC DLS LMBP initiative.
Research funding: None declared.
Employment or leadership: None declared.
Honorarium: None declared.
Competing interests: The funding organization(s) played no role in the study design; in the collection, analysis, and interpretation of data; in the writing of the report; or in the decision to submit the report for publication.
References
1. Epner PL, Gans JE, Graber ML. When diagnostic testing leads to harm: a new outcomes-based approach for laboratory medicine. BMJ Qual Saf 2013;22:ii6–10.10.1136/bmjqs-2012-001621Search in Google Scholar
2. Plebani M. Quality in laboratory medicine: an unfinished journey. J Lab Precis Med 2017;2:1–4.10.21037/jlpm.2017.08.04Search in Google Scholar
3. Hallworth MJ, Epner PL, Ebert C, Fantz CR, Faye SA, Higgins TN, et al. Current evidence and future perspectives on the effective practice of patient-centered laboratory medicine. Clin Chem 2015;61:589–99.10.1373/clinchem.2014.232629Search in Google Scholar
4. Linnet K, Bossuyt PM, Moons KG, Reitsma JB. Quantifying the accuracy of a diagnostic test or marker. Clin Chem 2012;58:1292–301.10.1373/clinchem.2012.182543Search in Google Scholar
5. Plebani M. Exploring the iceberg of errors in laboratory medicine. Clin Chim Acta 2009;404:16–23.10.1016/j.cca.2009.03.022Search in Google Scholar
6. Bossuyt PM, Irwig L, Craig J, Glasziou P. Comparative accuracy: assessing new tests against existing diagnostic pathways. BMJ 2006;332:1089–92.10.1136/bmj.332.7549.1089Search in Google Scholar
7. Hayen A, Macaskill P, Irwig L, Bossuyt P. Appropriate statistical methods are required to assess diagnostic tests for replacement, add-on, and triage. J Clin Epidemiol 2010;63:883–91.10.1016/j.jclinepi.2009.08.024Search in Google Scholar
8. Trenti T. Evidence-based laboratory medicine as a tool for continuous professional improvement. Clin Chim Acta 2003;333:155–67.10.1016/S0009-8981(03)00180-3Search in Google Scholar
9. Aakre KM, Langlois MR, Watine J, Barth JH, Baum H, Collinson P, et al. Critical review of laboratory investigations in clinical practice guidelines: proposals for the description of investigation. Clin Chem Lab Med 2013;51:1217–26.10.1515/cclm-2012-0574Search in Google Scholar PubMed
10. Sackett DL, Haynes RB. The architecture of diagnostic research. BMJ 2002;324:539–41.10.1136/bmj.324.7336.539Search in Google Scholar PubMed PubMed Central
11. Rutjes AW, Reitsma JB, Vandenbroucke JP, Glas AS, Bossuyt PM. Case-control and two-gate designs in diagnostic accuracy studies. Clin Chem 2005;51:1335–41.10.1373/clinchem.2005.048595Search in Google Scholar
12. Knottnerus JA, Muris JW. Assessment of the accuracy of diagnostic tests: the cross-sectional study. J Clin Epidemiol 2003;56:1118–28.10.1002/9781444300574.ch3Search in Google Scholar
13. Christenson RH, Committee on Evidence Based Laboratory Medicine of the International Federation for Clinical Chemistry Laboratory M. Evidence-based laboratory medicine – a guide for critical evaluation of in vitro laboratory testing. Ann Clin Biochem 2007;44:111–30.10.1258/000456307780118127Search in Google Scholar
14. Bossuyt PM. Interpreting diagnostic test accuracy studies. Semin Hematol 2008;45:189–95.10.1053/j.seminhematol.2008.04.001Search in Google Scholar
15. Reitsma JB, Moons KG, Bossuyt PM, Linnet K. Systematic reviews of studies quantifying the accuracy of diagnostic tests and markers. Clin Chem 2012;58:1534–45.10.1373/clinchem.2012.182568Search in Google Scholar
16. Deeks JJ. Systematic reviews in health care: systematic reviews of evaluations of diagnostic and screening tests. BMJ 2001;323:157–62.10.1136/bmj.323.7305.157Search in Google Scholar
17. Khan KS, Dinnes J, Kleijnen J. Systematic reviews to evaluate diagnostic tests. Eur J Obstet Gynecol Reprod Biol 2001;95:6–11.10.1016/S0301-2115(00)00463-2Search in Google Scholar
18. Macaskill P, Gatsonis C, Deeks JJ, Harbord RM, Takwoingi Y. Chapter 10: Analyzing and Presenting Results. Cochrane Handbook for Systematic Reveiws of Diagnsotic Test Accuracy. The Cochrane Collaboration. 2010. Available at: https://methods.cochrane.org/sdt/handbook-dta-reviews.Search in Google Scholar
19. Jones CM, Ashrafian H, Skapinakis P, Arora S, Darzi A, Dimopoulos K, et al. Diagnostic accuracy meta-analysis: a review of the basic principles of interpretation and application. Int J Cardiol 2010;140:138–44.10.1016/j.ijcard.2009.05.063Search in Google Scholar PubMed
20. Cornell J, Mulrow CD, Localio AR. Diagnostic test accuracy and clinical decision making. Ann Intern Med 2008;149:904–6.10.7326/0003-4819-149-12-200812160-00011Search in Google Scholar PubMed
21. Van den Bruel A, Cleemput I, Aertgeerts B, Ramaekers D, Buntinx F. The evaluation of diagnostic tests: evidence on technical and diagnostic accuracy, impact on patient outcome and cost-effectiveness is needed. J Clin Epidemiol 2007;60:1116–22.10.1016/j.jclinepi.2007.03.015Search in Google Scholar PubMed
22. Staub LP, Lord SJ, Simes RJ, Dyer S, Houssami N, Chen RY, et al. Using patient management as a surrogate for patient health outcomes in diagnostic test evaluation. BMC Med Res Methodol 2012;12:12.10.1186/1471-2288-12-12Search in Google Scholar
23. Brozek JL, Akl EA, Jaeschke R, Lang DM, Bossuyt P, Glasziou P, et al. Grading quality of evidence and strength of recommendations in clinical practice guidelines: part 2 of 3. The GRADE approach to grading quality of evidence about diagnostic tests and strategies. Allergy 2009;64:1109–16.10.1111/j.1398-9995.2009.02083.xSearch in Google Scholar
24. Hsu J, Brozek JL, Terracciano L, Kreis J, Compalati E, Stein AT, et al. Application of GRADE: making evidence-based recommendations about diagnostic tests in clinical practice guidelines. Implement Sci 2011;6:62.10.1186/1748-5908-6-62Search in Google Scholar
25. Singh S, Chang SM, Matchar DB, Bass EB. Grading a body of evidence on diagnostic tests. In: Chang SM, Matchar DB, Smetana GW, Umscheid CA, editors. Methods guide for medical test reviews. Rockville, MD: The Agency for Healthcare Quality and Research (AHRQ), 2012.Search in Google Scholar
26. Leeflang MM, Deeks JJ, Takwoingi Y, Macaskill P. Cochrane diagnostic test accuracy reviews. Syst Rev 2013;2:82.10.1186/2046-4053-2-82Search in Google Scholar
27. Schiff GD. Finding and fixing diagnosis errors: can triggers help? BMJ Qual Saf 2012;21:89–92.10.1136/bmjqs-2011-000590Search in Google Scholar
28. Deeks JJ. Using evaluations of diagnostic tests: understanding their limitations and making the most of available evidence. Ann Oncol 1999;10:761–8.10.1023/A:1008359805260Search in Google Scholar
29. Staub LP, Dyer S, Lord SJ, Simes RJ. Linking the evidence: intermediate outcomes in medical test assessments. Int J Technol Assess Health Care 2012;28:52–8.10.1017/S0266462311000717Search in Google Scholar
30. Lord SJ, Irwig L, Simes RJ. When is measuring sensitivity and specificity sufficient to evaluate a diagnostic test, and when do we need randomized trials? Ann Intern Med 2006;144: 850–5.10.7326/0003-4819-144-11-200606060-00011Search in Google Scholar
31. Pearl WS. A hierarchical outcomes approach to test assessment. Ann Emerg Med 1999;33:77–84.10.1016/S0196-0644(99)70421-XSearch in Google Scholar
32. Fryback DG, Thornbury JR. The efficacy of diagnostic imaging. Med Decis Making 1991;11:88–94.10.1177/0272989X9101100203Search in Google Scholar PubMed
33. Christenson RH, Snyder SR, Shaw CS, Derzon JH, Black RS, Mass D, et al. Laboratory medicine best practices: systematic evidence review and evaluation methods for quality improvement. Clin Chem 2011;57:816–25.10.1373/clinchem.2010.157131Search in Google Scholar PubMed
34. Woolf S, Schunemann HJ, Eccles MP, Grimshaw JM, Shekelle P. Developing clinical practice guidelines: types of evidence and outcomes; values and economics, synthesis, grading, and presentation and deriving recommendations. Implement Sci 2012;7:61.10.1186/1748-5908-7-61Search in Google Scholar PubMed PubMed Central
35. Whiting PF, Rutjes AW, Westwood ME, Mallett S, Deeks JJ, Reitsma JB, et al. QUADAS-2: a revised tool for the quality assessment of diagnostic accuracy studies. Ann Intern Med 2011;155:529–36.10.7326/0003-4819-155-8-201110180-00009Search in Google Scholar PubMed
36. Cohen JF, Korevaar DA, Altman DG, Bruns DE, Gatsonis CA, Hooft L, et al. STARD 2015 guidelines for reporting diagnostic accuracy studies: explanation and elaboration. BMJ Open 2016;6:e012799.10.1136/bmjopen-2016-012799Search in Google Scholar PubMed PubMed Central
37. Bossuyt PM, Reitsma JB, Bruns DE, Gatsonis CA, Glasziou PP, Irwig LM, et al. The STARD statement for reporting studies of diagnostic accuracy: explanation and elaboration. Clin Chem 2003;49:7–18.10.1373/49.1.7Search in Google Scholar PubMed
38. Korevaar DA, van Enst WA, Spijker R, Bossuyt PM, Hooft L. Reporting quality of diagnostic accuracy studies: a systematic review and meta-analysis of investigations on adherence to STARD. Evid Based Med 2014;19:47–54.10.1136/eb-2013-101637Search in Google Scholar PubMed
39. Jaeschke R, Guyatt GH, Sackett DL. Users’ guides to the medical literature. III. How to use an article about a diagnostic test. B. What are the results and will they help me in caring for my patients? The Evidence-Based Medicine Working Group. JAMA 1994;271:703–7.10.1001/jama.271.9.703Search in Google Scholar PubMed
40. Fagan TJ. Letter: Nomogram for Bayes theorem. N Engl J Med 1975;293:257.10.1056/NEJM197507312930513Search in Google Scholar PubMed
41. McGee S. Simplifying likelihood ratios. J Gen Intern Med 2002;17:646–9.10.1046/j.1525-1497.2002.10750.xSearch in Google Scholar PubMed PubMed Central
42. Parikh R, Parikh S, Arun E, Thomas R. Likelihood ratios: clinical application in day-to-day practice. Indian J Ophthalmol 2009;57:217–21.10.4103/0301-4738.49397Search in Google Scholar PubMed PubMed Central
43. Halkin A, Reichman J, Schwaber M, Paltiel O, Brezis M. Likelihood ratios: getting diagnostic testing into perspective. Q J Med 1998;91:247–58.10.1093/qjmed/91.4.247Search in Google Scholar PubMed
44. Akobeng AK. Understanding diagnostic tests 2: likelihood ratios, pre- and post-test probabilities and their use in clinical practice. Acta Paediatr 2007;96:487–91.10.1111/j.1651-2227.2006.00179.xSearch in Google Scholar PubMed
45. Moreira J, Bisoffi Z, Narvaez A, Van den Ende J. Bayesian clinical reasoning: does intuitive estimation of likelihood ratios on an ordinal scale outperform estimation of sensitivities and specificities? J Eval Clin Pract 2008;14:934–40.10.1111/j.1365-2753.2008.01003.xSearch in Google Scholar PubMed
46. Deeks JJ, Altman DG. Diagnostic tests 4: likelihood ratios. BMJ 2004;329:168–9.10.1136/bmj.329.7458.168Search in Google Scholar PubMed PubMed Central
47. Hawkins RC. The evidence based medicine approach to diagnostic testing: practicalities and limitations. Clin Biochem Rev 2005;26:7–18.Search in Google Scholar
48. Bossuyt P, Davenport C, Deeks J, Hyde C, Leeflang M, Scholten R. Chapter 11: Interpreting Results and Drawing Conclusions. Cochrane Handbook for Systematic Reviews of Diagnsotic Test Accuracy. The Cochrane Collaboration. 2013. Available at: https://methods.cochrane.org/sdt/handbook-dta-reviews.Search in Google Scholar
49. Price CP, Christenson RH, American Association for Clinical Chemistry. Evidence-based laboratory medicine: principles, practice, and outcomes, 2nd ed. Washington, DC: AACC Press, 2007:17–8Search in Google Scholar
50. National Quality Form. Improving Diagnostic Quality and Safety: Final Report. NQF, Washington, DC, 2017. Available at: http://www.qualityforum.org/ProjectDescription.aspx?projectID=83357.Search in Google Scholar
51. Graber ML, Rusz D, Jones ML, Farm-Franks D, Jones B, Cyr Gluck J, et al. The new diagnostic team. Diagnosis (Berl) 2017;4:225–38.10.1515/dx-2017-0022Search in Google Scholar PubMed
52. Schiff GD. Diagnosis and diagnostic errors: time for a new paradigm. BMJ Qual Saf 2014;23:1–3.10.1136/bmjqs-2013-002426Search in Google Scholar PubMed
53. Cooper HM, Hedges LV, Valentine JC. The handbook of research synthesis and meta-analysis, 2nd ed. New York: Russell Sage Foundation, 2009:632.Search in Google Scholar
54. Durlak JA. How to select, calculate, and interpret effect sizes. J Pediatr Psychol 2009;34:917–28.10.1093/jpepsy/jsp004Search in Google Scholar PubMed
55. Fern E, Monroe KB. Effect-size estimates: issues and problems in interpretation. J Consum Res 1996;23:89–105.10.1086/209469Search in Google Scholar
56. Fritz CO, Morris PE, Richler JJ. Effect size estimates: current use, calculations, and interpretation. J Exp Psychol Gen 2012;141:2–18.10.1037/a0024338Search in Google Scholar PubMed
57. Gigerenzer G, Gaissmaier W. Heuristic decision making. Annu Rev Psychol 2011;62:451–82.10.1093/acprof:oso/9780199390076.003.0007Search in Google Scholar
58. Gigerenzer G, Edwards A. Simple tools for understanding risks: from innumeracy to insight. BMJ 2003;327:741–4.10.1136/bmj.327.7417.741Search in Google Scholar
59. Radack KL, Rouan G, Hedges J. The likelihood ratio. An improved measure for reporting and evaluating diagnostic test results. Arch Pathol Lab Med 1986;110:689–93.Search in Google Scholar
60. Perera R, Heneghan C. Making sense of diagnostic test likelihood ratios. ACP J Club 2007;146:A8–9.10.7326/ACPJC-2007-146-2-A08Search in Google Scholar
61. Mitchell AJ. Sensitivity x PPV is a recognized test called the clinical utility index (CUI+). Eur J Epidemiol 2011;26:251–2; author reply 2.10.1007/s10654-011-9561-xSearch in Google Scholar
62. Schiff GD, Kim S, Abrams R, Cosby K, Lambert B, Elstein AS, et al. Diagnosing Diagnosis Errors: Lessons from a Multi-institutional Collaborative Project. In: Henriksen K, Battles JB, Marks ES, Lewin DI, editors. Advances in patient safety: from research to implementation (Volume 2: Concepts and Methodology). Rockville, MD: The Agency for Health Quality and Reasearch (AHRQ), 2005.Search in Google Scholar
63. Olson AP, Graber ML, Singh H. Tracking progress in improving diagnosis: a framework for defining undesirable diagnostic events. J Gen Intern Med 2018;33:1187–91.10.1007/s11606-018-4304-2Search in Google Scholar
64. Graber ML, Franklin N, Gordon R. Diagnostic error in internal medicine. Arch Intern Med 2005;165:1493–9.10.1001/archinte.165.13.1493Search in Google Scholar
65. Singh H, Schiff GD, Graber ML, Onakpoya I, Thompson MJ. The global burden of diagnostic errors in primary care. BMJ Qual Saf 2017;26:484–94.10.1136/bmjqs-2016-005401Search in Google Scholar
66. Newman-Toker DE. A unified conceptual model for diagnostic errors: underdiagnosis, overdiagnosis, and misdiagnosis. Diagnosis (Berl) 2014;1:43–8.10.1515/dx-2013-0027Search in Google Scholar
67. Graber ML, Trowbridge R, Myers JS, Umscheid CA, Strull W, Kanter MH. The next organizational challenge: finding and addressing diagnostic error. Jt Comm J Qual Patient Saf 2014;40:102–10.10.1016/S1553-7250(14)40013-8Search in Google Scholar
68. Guyatt GH, Oxman AD, Vist GE, Kunz R, Falck-Ytter Y, Alonso-Coello P, et al. GRADE: an emerging consensus on rating quality of evidence and strength of recommendations. BMJ 2008;336:924–6.10.1136/bmj.39489.470347.ADSearch in Google Scholar PubMed PubMed Central
69. Gopalakrishna G, Mustafa RA, Davenport C, Scholten RJ, Hyde C, Brozek J, et al. Applying grading of recommendations assessment, development and evaluation (GRADE) to diagnostic tests was challenging but doable. J Clin Epidemiol 2014;67:760–8.10.1016/j.jclinepi.2014.01.006Search in Google Scholar PubMed
70. Schunemann HJ, Oxman AD, Brozek J, Glasziou P, Jaeschke R, Vist GE, et al. Grading quality of evidence and strength of recommendations for diagnostic tests and strategies. BMJ 2008;336:1106–10.10.1136/bmj.39500.677199.AESearch in Google Scholar PubMed PubMed Central
71. Bruns DE. Laboratory-related outcomes in healthcare. Clin Chem 2001;47:1547–52.10.1093/clinchem/47.8.1547Search in Google Scholar
72. Horvath AR, Pewsner D. Systematic reviews in laboratory medicine: principles, processes and practical considerations. Clin Chim Acta 2004;342:23–39.10.1016/j.cccn.2003.12.015Search in Google Scholar PubMed
73. Ferrante di Ruffano L, Hyde CJ, McCaffery KJ, Bossuyt PM, Deeks JJ. Assessing the value of diagnostic tests: a framework for designing and evaluating trials. BMJ 2012;344:e686.10.1136/bmj.e686Search in Google Scholar PubMed
74. Andrews JC, Schunemann HJ, Oxman AD, Pottie K, Meerpohl JJ, Coello PA, et al. GRADE guidelines: 15. Going from evidence to recommendation-determinants of a recommendation’s direction and strength. J Clin Epidemiol 2013;66:726–35.10.1016/j.jclinepi.2013.02.003Search in Google Scholar PubMed
75. Brozek JL, Akl EA, Compalati E, Kreis J, Terracciano L, Fiocchi A, et al. Grading quality of evidence and strength of recommendations in clinical practice guidelines part 3 of 3. The GRADE approach to developing recommendations. Allergy 2011;66:588–95.10.1111/j.1398-9995.2010.02530.xSearch in Google Scholar PubMed
76. Balogh E, Miller BT, Ball J, Institute of Medicine (U.S.). Committee on Diagnostic Error in Health Care. Improving diagnosis in health care. Washington, DC: The National Academies Press, 2015.10.17226/21794Search in Google Scholar PubMed
77. Schiff GD, Ruan EL. The elusive and illusive quest for diagnostic safety metrics. J Gen Intern Med 2018;33:983–5.10.1007/s11606-018-4454-2Search in Google Scholar PubMed PubMed Central
78. Zwaan L, Singh H. The challenges in defining and measuring diagnostic error. Diagnosis (Berl) 2015;2:97–103.10.1515/dx-2014-0069Search in Google Scholar PubMed PubMed Central
79. Reitsma JB, Rutjes AW, Khan KS, Coomarasamy A, Bossuyt PM. A review of solutions for diagnostic accuracy studies with an imperfect or missing reference standard. J Clin Epidemiol 2009;62:797–806.10.1016/j.jclinepi.2009.02.005Search in Google Scholar PubMed
80. Trikalinos TA, Balion CM. Chapter 9: options for summarizing medical test performance in the absence of a “gold standard”. J Gen Intern Med 2012;27(Suppl 1):S67–75.10.1007/s11606-012-2031-7Search in Google Scholar
81. Whiting PF, Davenport C, Jameson C, Burke M, Sterne JA, Hyde C, et al. How well do health professionals interpret diagnostic information? A systematic review. BMJ Open 2015;5:e008155.10.1136/bmjopen-2015-008155Search in Google Scholar
82. Van den Ende J, Moreira J, Basinga P, Bisoffi Z. The trouble with likelihood ratios. Lancet 2005;366:548.10.1016/S0140-6736(05)67096-1Search in Google Scholar
83. Marewski JN, Gigerenzer G. Heuristic decision making in medicine. Dialogues Clin Neurosci 2012;14:77–89.10.31887/DCNS.2012.14.1/jmarewskiSearch in Google Scholar
84. Graber ML, Kissam S, Payne VL, Meyer AN, Sorensen A, Lenfestey N, et al. Cognitive interventions to reduce diagnostic error: a narrative review. BMJ Qual Saf 2012;21:535–57.10.1136/bmjqs-2011-000149Search in Google Scholar PubMed
©2018 Walter de Gruyter GmbH, Berlin/Boston
Articles in the same Issue
- Frontmatter
- Editorials
- Learning from tragedy – improving diagnosis through case reviews
- Diagnostic test accuracy: a valuable tool for promoting quality and patient safety
- Review
- Blinding or information control in diagnosis: could it reduce errors in clinical decision-making?
- Opinion Paper
- System-related and cognitive errors in laboratory medicine
- Original Articles
- The Assessment of Reasoning Tool (ART): structuring the conversation between teachers and learners
- Determining qualitative effect size ratings using a likelihood ratio scatter matrix in diagnostic test accuracy systematic reviews
- Patient groups, clinicians and healthcare professionals agree – all test results need to be seen, understood and followed up
- Teaching about diagnostic errors through virtual patient cases: a pilot exploration
- Using computerized virtual cases to explore diagnostic error in practicing physicians
- “Closing the loop”: a mixed-methods study about resident learning from outcome feedback after patient handoffs
- Case-based simulation empowering pediatric residents to communicate about diagnostic uncertainty
- Letters to the Editor
- Capturing diagnostic errors in incident reporting systems: value of a specific “DX Tile” for diagnosis-related concerns
- PSA-based, prostate cancer risk on-line calculators: no such thing as a crystal ball?
- Learning from Error
- Learning from tragedy: the Julia Berg story
- Acknowledgment
- Congress Abstracts
- Diagnostic Error in Medicine