Does Environmental Regulation Achieve “Incremental Quality” of Green Technology Innovation? —— Evidence from the Target Responsibility System of Environmental Protection
-
Feng Tao

Abstract
The target responsibility system of environmental protection, introduced during the 11th Five-Year Plan period, is a key feature of China’s environmental regulation policy framework. Guided by the principle of high-quality development, this system addresses the challenge of incentivizing green technology innovation. This paper examines how the target responsibility system of environmental protection affects the quantity and quality of green technology innovation activities across society, identifying environmentally friendly invention patents at the International Patent Classification (IPC) group level. Using the difference-in-differences method, the study finds that while the target responsibility system of environmental protection has increased the number of green patent applications, it has also led to a decline in the quality of these innovations. Further analysis reveals that enterprises with weaker innovation capabilities are the primary contributors to the decline in innovation quality, particularly in the field of atmospheric pollution control technology, which is subject to environmental constraints, as well as in industries with moderate to light pollution. Notably, the substantive examination system effectively ensures the quality of authorized patents, mitigating the distortion effect of policies on innovation quality. The findings provide theoretical support and practical recommendations for deepening the reform of the target responsibility system of environmental protection, establishing a market-oriented green technology innovation system, and optimizing the intellectual property system.
1 Introduction
The 19th National Congress of the Communist Party of China proposed to “accelerate the reform of the ecological civilization system and build a beautiful China”, and explicitly required the establishment of a market-oriented green technology innovation system. In April 2019, the National Development and Reform Commission and the Ministry of Science and Technology jointly issued the Guiding Opinions on Establishing a Market-Oriented Green Technology Innovation System, which further detailed the roadmap and timeline for building the green technology innovation system. Since then, “green technology innovation” has been transformed into a specialized government policy document, becoming a key task in the current national ecological civilization construction, urgently requiring in-depth research and practice by both the academic and practical communities.
Generally, well-designed environmental regulations are considered to significantly promote technological innovation. During China’s 11th Five-Year Plan period, environmental protection indicators were first linked to the performance evaluations of government officials as mandatory targets, marking a shift from “soft” to “hard” environmental regulations (Han et al., 2017). Since the implementation of the 11th Five-Year Plan, China’s green technology innovation activities have become more active, with a significant increase in green patent applications. Using the OECD’s IPC codes for environmental management technology patents, this study found that from 2000 to 2005, the number of invention patent applications related to environmental management technology grew slowly, averaging 333.17 per year; starting from 2006, the number of such invention patent applications saw explosive growth, averaging 3008.45 per year. However, in terms of knowledge breadth, the average value of corresponding patents decreased from 0.37 in 2000–2005 to 0.33 in 2006–2016. [1] This suggests that since the implementation of the target responsibility system of environmental protection, there may have been a bubble in China’s green patent applications.
China is currently in a phase of institutional transformation, where the government plays a significant role in stimulating innovation activities. However, the market mechanism has yet to play a decisive role in allocating innovation resources. Given that local governments and their officials control substantial economic resources, the design of performance evaluation systems, which are oriented towards political achievements, significantly influences policy formulation and implementation. An imperfect evaluation system can lead to distorted incentives in public policies, resulting in suboptimal or even counterproductive outcomes. The 11th Five-Year Plan first linked energy conservation and emission reduction targets to the performance evaluations of government officials, shifting the focus from GDP-centric goals to more sustainable development. This shift is expected to have a significant impact on the formulation and enforcement of environmental regulations. Therefore, does China’s command-based environmental regulation, embodied in the target responsibility system, distort the incentives for green technology innovation, potentially leading to a bubble in green patent applications?
Previous literature has explored the mechanisms by which environmental regulations influence technological innovation, yielding valuable research findings. However, the existing literature is not unanimous on whether environmental regulations can stimulate technological innovation. Gray and Shadbegian (2003) and Greenstone et al. (2012) argue that environmental regulations can increase costs for businesses, thereby inhibiting technological innovation. Conversely, Ley et al. (2016) and Xu and Cui (2020) suggest that well-designed environmental regulations can effectively promote green technological innovation. These different conclusions offer two key insights for empirical research: first, it is crucial to differentiate between command-type and market-type environmental regulations, as they have distinct mechanisms for promoting green technological innovation. Theoretically, market-based environmental regulations can provide more flexible and effective incentives for innovation (Blackman et al., 2018). Researches by Qi et al. (2018) and Ren et al. (2019), based on China’s SO₂ emission trading, also support this view. Currently, China’s environmental regulation policies are predominantly command-and-control, with local officials responsible for formulating and implementing these policies. Second, it is essential to identify green technological innovations within a broad range of innovative activities and to scientifically measure their quantity and quality. Due to the limitations of data availability, identifying green technology innovations is a significant challenge. Many studies have focused on indirect indicators such as R&D expenditure (Jaffe and Palmer, 1997; Jiang et al., 2013) and green productivity (Bai and Song , 2009; Song and Wang , 2013). As patent data availability has improved and researchers have delved deeper into patent information, the advantages of patent data have led more scholars to use it to measure green technology innovation (Ley et al., 2016; Wang and Qi , 2016; Dong and Wang , 2019). However, previous studies have primarily focused on the impact of environmental regulations on the quantity of green patents, with few addressing the quality of green patents. This paper examines the impact of the target responsibility system of environmental protection implemented during the 11th Five-Year Plan period on China’s green innovation behavior by distinguishing between the quantity and quality of green patent applications, and discusses the heterogeneity of this impact across different types of applicants, patent cooperation methods, green patent types, and industry pollution attributes.
The potential contributions of this paper are primarily reflected in two aspects: By leveraging the technical information on patent innovation activities provided by the International Patent Classification (IPC), and focusing on invention patents filed with the China National Intellectual Property Administration, this paper identifies for the first time environmentally friendly invention patents that exhibit characteristics of green innovation activities. This identification helps to establish relevant indicators for measuring the quantity and quality of green technological innovation activities. Unlike previous studies that have focused more on the impact of environmental policies on the quantity of innovation activities, this paper is the first to comprehensively examine how the target responsibility system affects the quantity and quality of green technological innovation activities, aligning with the current trend of high-quality development. Furthermore, the paper analyzes from multiple perspectives, including the types of innovation entities, innovation capabilities, organizational methods of innovation activities, technology fields, industry pollution intensity, and the substantive examination system of invention patents, providing micro-level evidence and diverse explanations for the phenomenon of the decline in the quality of green technological innovation due to the target responsibility system. This paper not only offers new insights and evidence into the phenomenon of patent bubbles in China but also enriches the research on the evaluation of the effects of environmental regulation policies.
2 Institutional Background
The “Five-Year Plan” for environmental protection plays a crucial role in China’s environmental governance system. The 6th Five-Year Plan for National Economic and Social Development of the People’s Republic of China was the first to dedicate a separate chapter to environmental protection. Subsequent documents highlighted the central government’s growing emphasis on environmental protection, but these documents lacked effective methods for breaking down and evaluating environmental indicators, thus lacking strong enforcement mechanisms. By the end of 2005, the emission reduction targets for the two primary pollutants set in the 10th Five-Year Plan had not been met, and national energy consumption reached its peak that year.
Faced with the severe situation of high energy consumption and major pollutant emissions, the central government decided to take strong measures to enhance the enforcement of environmental protection policies at the beginning of the 11th Five-Year Plan period. In December 2005, the State Council issued the Decision on Implementing the Scientific Outlook on Development and Strengthening Environmental Protection, which first introduced the significant measure of “environmental performance assessment”. In March 2006, the Outline of the 11th Five-Year Plan for National Economic and Social Development designated environmental indicators such as the total emissions of COD and SO2, and the energy consumption per unit of GDP, as key performance indicators for local officials. Subsequently, the former State Environmental Protection Administration, the National Development and Reform Commission, the National Bureau of Statistics, and the National Energy Administration issued a series of specific documents, forming a relatively complete environmental protection policy system. The main feature of this policy system is the hierarchical decomposition and implementation of environmental indicators. The central government sets the overall control targets for major pollutant emissions and energy consumption per unit of GDP nationwide. These targets are then broken down and implemented by provincial governments through target responsibility agreements of environmental protection. Provincial governments further break down these targets to prefecture-level cities, which then allocate them to districts, counties, and key polluting enterprises within their jurisdictions. Local officials at all levels are responsible for the energy conservation and emission reduction targets in their jurisdictions. Higher-level supervisory units form an evaluation team to regularly assess the completion of these targets, compile comprehensive evaluation reports, and announce them to the public. The evaluation results serve as a critical basis for the political appointment and dismissal of local leaders. During the 12th Five-Year Plan and 13th Five-Year Plan” periods, the target responsibility system of environmental protection was further strengthened.
3 The Mechanism and Research Hypothesis of the Role of Target Responsibility System of Environmental Protection on Green Technology Innovation
3.1 Positive Impact of Target Responsibility System of Environmental Protection on Green Innovation Activities
The nature of local officials as “political figures” (Zhou, 2004) means they adjust the weight of various political behaviors in their utility functions based on the assessment criteria set by the central government (Wang et al., 2017), to maximize their political gains. Before the 11th Five-Year Plan period, the central government’s GDP-focused assessment system led to a lack of motivation among local officials for environmental protection. The target responsibility system of environmental protection, however, incorporated environmental indicators into the political assessments of local governments at all levels, emphasizing the importance of environmental governance and clarifying the severe consequences of failing to meet these standards. This system has a high-pressure deterrent and mandatory nature. As a result, the target responsibility system of environmental protection exerts pressure on local officials, compelling them to implement a series of measures to improve the environment.
Faced with the “hard constraints” of environmental targets, enterprises, acting as “economic agents”, will make decisions based on their specific conditions, leading to diverse self-selection behaviors: relocation, upgrading, or transformation. For small businesses, constrained by capital and technology, they often shut down or relocate to avoid internalizing the costs of environmental regulations; for enterprises with sufficient capital and technology, they aim for energy conservation and emission reduction by installing end-of-pipe treatment equipment and implementing technological upgrades, thus advancing towards modernization. For larger and more established enterprises, they can reconfigure resources across geographical, technological, and industrial domains, using a combination of relocation, upgrading, and transformation to address environmental regulations. These actions often involve various forms of innovation. When the compensatory effect of environmental regulations on corporate innovation exceeds the compliance costs, it provides a sustainable environment for innovation, forming what is known as the “Porter’s Hypothesis”.
Over time, mandatory emission standards have evolved from a short-term shock into a routine constraint for businesses. Whether new or existing enterprises, allocating resources for green innovation has become a standard practice, leading to a societal shift towards green innovation and guiding the steady increase in the input and output of green innovation resources. Moreover, the promotion of environmental protection goals and their policies through public media increases societal attention to environmental protection, encouraging more innovative resources from universities and research institutions to be directed towards environment-related activities. Meanwhile, collaboration between industry, academia, and research institutions encourages nonprofit organizations like universities and research institutes to engage in secular green innovation activities. Additionally, the uncertainty of innovation often means that it takes a considerable amount of time for the results of investment to materialize, so the impact of environmental protection goals on the outcomes of corporate green innovation is not immediately apparent.
Based on the above analysis, this paper puts forward the first hypothesis.
Hypothesis 1: The implementation of target responsibility system of environmental protection promotes the increase of green patents, but the policy effect has a lag.
3.2 Potential Distortion of Green Innovation Activities by Target Responsibility System of Environmental Protection
Faced with the “hard constraint” of a veto on environmental targets, command-type environmental regulations often become the preferred choice for local officials, especially in the early stages of implementing the target responsibility system of environmental protection. While these regulations can drive enterprises to innovate in green practices, their incentives for such innovation are limited to administrative penalties, which can lead some enterprises to settle for merely meeting the minimum standards. This lack of effective quality incentives for green innovation can result in more widespread “just meeting the standards” behavior.
As the implementation of target responsibility systems of environmental protection advances, some local governments in developed regions have introduced incentive-based environmental regulations. However, when these incentive systems are not well-established, enterprises may engage in rent-seeking behavior, which can distort green technology innovation. The reasons are as follows: In incentive-based environmental regulations, tax reductions and subsidies are common tools. One prerequisite for the effective implementation of these measures is that the government must accurately obtain real information about enterprises’ green innovation activities. However, the government has a natural disadvantage in information acquisition. When the government can only decide on reward recipients based on signals from enterprises (such as the number of green patents), strategic innovation behaviors tend to occur (Zhang and Zheng, 2018). Enterprises aiming to maximize profits will excessively pursue short-term increases in green innovation to gain economic benefits from policy support, often engaging in low-difficulty strategic innovations (Li and Zheng, 2016). This phenomenon is more pronounced in enterprises with limited innovation resources. Enterprises with different innovation capabilities have varying motivations for innovation. Enterprises with strong innovation capabilities tend to have more sustained innovation activities (Noailly and Smeets, 2015), especially in an environment where green development is a core competitive advantage, where green innovation can bring new competitive advantages. In contrast, enterprises with weaker innovation capabilities have limited innovation resources, leading to more random innovation behaviors (Noailly and Smeets, 2015), making their green innovation activities more susceptible to the influence of policies such as subsidies and taxes. Therefore, even the incentive-based environmental regulation cannot necessarily promote the quality of green innovation. When the overall green innovation ability of the whole society is relatively low, although a few enterprises carry out high-quality green innovation activities, the overall impact on the quality of relevant innovation activities may not be significant, and even may have a negative effect.
When the relevant policies of target responsibility system of environmental protection focus on command environmental regulation and supplemented by incentive environmental regulation, this paper puts forward the second hypothesis based on the above analysis.
Hypothesis 2: When the overall green innovation strength of society is in its infancy, the target responsibility system of environmental protection may cause the risk of declining quality of green patents.
4 Research Design
4.1 Data Sources and Processing
(1) Data source. The patent data is sourced from the BvD database, and this study primarily uses invention patent applications to examine the impact of policies on green technological innovation by Chinese institutions and individuals. Since the focus is on the influence of policies on green technological innovation by Chinese institutions and individuals, patents with priority numbers [1] for other countries (regions) have been excluded. From 2002 to 2016, over 5.43 million invention patent applications were filed by Chinese institutions and individuals. For patents with a priority number of China, the year of the priority number is used as the application date.
(2) Measurement of the quantity and quality of green innovation. This paper uses patent data to measure green innovation activities, which offers three advantages. ① Patent data can more accurately gauge the output of innovation activities (Zhou et al., 2012), rather than the input. This aligns with the focus of this paper on how target responsibility systems impact innovation performance. ② The IPC information in patents can accurately depict the technical domain characteristics of innovation activities, which helps the paper distinguish between green and non-green innovation activities using OECD classification standards, thus creating conditions for DID estimation. ③ Using patent data, this paper can measure both the quantity and quality of green innovation activities. Considering data availability, this paper identifies and calculates the number of green patents applied for in China at the IPC group level based on the IPC codes corresponding to environmental management technologies listed by the OECD. Then, following the methods of Aghion et al. (2015) and Zhang and Zheng (2018), this paper constructs a knowledge width to measure the quality of green innovation activities. [2] The knowledge width at the patent level is aggregated to the IPC group level using two methods: mean and median. The mean method is used for benchmark regression and heterogeneity analysis, while the median method is used for robustness testing.
(3) The construction of the experimental and control groups. Given the varying impacts of the target responsibility system on green and non-green patents, we adopt Chen (2017)’s approach, categorizing green patents as the experimental group and other types of patents as the control group. [1] Specifically, based on the OECD’s classification of environmental management technology in the Green IPC, most of the IPC groups fall under environmental management technology. Following Moser and Voena (2012), this study constructs the experimental and control groups at the IPC group level, selecting those belonging to environmental management technology as the experimental group and those not listed in the OECD’s green patent classification as the control group. This results in 102 experimental groups and 7,217 control groups. However, to ensure comparability between the experimental and control groups, considering the significant differences among different technology categories, this study controls for the technical differences between the experimental and control groups at the IPC sub-group level. Specifically, it removes all IPC groups within the same IPC sub-group that are entirely part of either the experimental or control group, ensuring that each IPC group within the same IPC sub-group has both an experimental and a control group. Ultimately, this results in 100 experimental groups and 7,217 control groups. The 5.43 million invention patent applications from 2002 to 2016, after removing foreign priority numbers, were matched with the experimental and control groups constructed at the IPC group level, identifying a total of 770,000 invention patent applications in both groups. To ensure the accuracy of the estimation results, patents that were in both the experimental and control groups were excluded, resulting in a final total of 680,000 invention patent applications, with 140,000 in the experimental group and 540,000 in the control group. Following the approach of Haščič and Migotto (2015), the patent data was aggregated using a weighted method [2] to form panel data at the IPC group level for the period 2002–2016.
4.2 Model Setting
In order to effectively identify the impact of target responsibility system of environmental protection on green technology innovation, this paper uses the difference-in-difference method to construct the following equation:
Given that invention patents are more innovative and better reflect the actual level of technological development (Fu et al., 2015), Yi,t represents the quantity and quality of invention patents in the corresponding year for each IPC group. The number of invention patents plus one is taken as the natural logarithm of the dependent variable. The grouping variable greeni is a dummy variable indicating whether the IPC group belongs to the experimental group. If the IPC group is classified as green technology, it is 1; otherwise, it is 0. The dummy variable postt indicates whether the year is before or after the policy. If the year is 2006 or later, it is 1; otherwise, it is 0. λi and ft are the individual fixed effects and the year fixed effects for the IPC group, respectively. To further control for the unique characteristics of the technology field in which the IPC group operates over different years, this paper introduces an interaction term between the dummy variable of the IPC subcategory and the dummy variable of the year in the model, to control for factors that vary with the year at the IPC subcategory level. Additionally, this paper uses the cluster standard error at the IPC group level. The estimated coefficient of the interaction term greeni×postt is the key focus of this study on the policy effect. If α1>0, it indicates that the policy promotes the growth and quality improvement of green patents; if α1 <0, it indicates that the policy inhibits the growth and quality improvement of green patents; if α1 =0, the policy effect is not significant.
In order to observe the dynamic impact of target responsibility system of environmental protection on green technology innovation behavior, this paper further expands Equation (1) as follows:
where yeart is the dummy variable for the year, greeni×postt represents the interaction between the group variable greeni and the dummy variables for the years before and after the implementation of the target responsibility system of environmental protection. βt indicates the policy impact of the target responsibility system on the quantity and quality of green patents in that year. The year 2005, prior to the implementation of the target responsibility system, is used as the reference group. This model can also be used for the key parallel trend test in DID estimation. If the estimated coefficients βt of greeni×yeart before 2006 are not significant, it suggests that the conditions for parallel trends are met.
5 Empirical Analysis
5.1 Benchmark Results
The benchmark regression results are presented in Table 1. This paper first examines the impact of the target responsibility system of environmental protection on the quantity of green technology innovation. The results in column (1) show that, under the two-way fixed effects of the IPC group and year, the estimated coefficient of greeni×postt is significantly positive at the 1% level. To further mitigate estimation bias caused by omitted variables, column (2) introduces “IPC sub-group × year” to control for the development trends of IPC sub-group technologies over different years, increasing R2 from 0.59 to 0.68 with a 15% increase. Clearly, introducing the historical development characteristics of IPC sub-group technologies has a certain effect on mitigating omitted variables. Meanwhile, the estimated coefficient of greeni×postt rises to 0.23, also significant at the 1% level. Furthermore, Figure 1 illustrates the dynamic effect of the target responsibility system of environmental protection on the quantity of green innovation activities. It can be seen that the estimated coefficients βt were not significant in the three years prior to the implementation of the target responsibility system, indicating that the parallel trend hypothesis was met. After the implementation of the target responsibility system of environmental protection, the number of green patent applications increased significantly from 2010 to 2016, with the interaction term coefficient being significantly positive throughout this period, while the interaction term coefficient was generally insignificant from 2006 to 2009.[1] These results indicate that the target responsibility system of environmental protection has stimulated an increase in the quantity of green innovation, thus verifying Hypothesis 1.
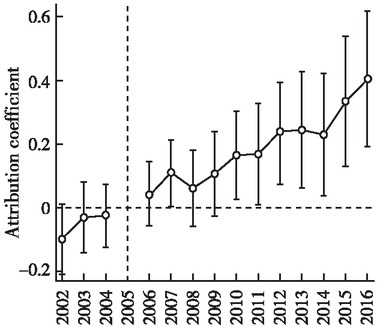
Dynamic Effect of the Target Responsibility System of Environmental Protection on the Number of Green Patents
Baseline Regression Results
| Panel A: Number of patents | Panel B: Patent quality | |||
|---|---|---|---|---|
| (1) | (2) | (3) | (4) | |
| greeni × postt | 0.194*** | 0.229*** | –0.036*** | –0.036*** |
| (0.0719) | (0.0671) | (0.0096) | (0.0107) | |
| Individual fixed effects | Yes | Yes | Yes | Yes |
| Time fixed effect | Yes | Yes | Yes | Yes |
| IPC sub-group × year | Yes | Yes | ||
| Sample size | 12315 | 12315 | 12315 | 12315 |
| R2 | 0.591 | 0.683 | 0.0163 | 0.140 |
Note: ***, ** and * indicate significance at the 1%,5% and 10% levels, respectively. The same applies to the following tables.
Next, we examine the impact of the target responsibility system of environmental protection on the quality of green technology innovation. Similarly, column (3) controls for the two-way fixed effects of the IPC group and year, while column (4) introduces the “IPC sub-group×year”. The results show that the coefficients of greeni×postt in both cases are significantly negative, indicating that the target responsibility system hinders the improvement of green technology innovation quality. Figure 2 shows that the estimated coefficients βt were not significant in the three years prior to the implementation of the target responsibility system, thus satisfying the parallel trend assumption. Moreover, the quality of green patents began to decline significantly from 2012, as evidenced by the interaction term coefficient being significantly negative from 2012 to 2016, whereas the interaction term coefficient was generally insignificant from 2006 to 2011. This result aligns with the expectations of Hypothesis 2 of this paper.
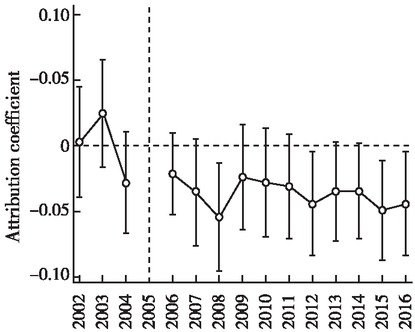
Dynamic Effect of the Target Responsibility System of Environmental Protection on the Quality of Green Patents
Overall, the results in Table 1 indicate that the target responsibility system of environmental protection has certain time lags in influencing green innovation. To meet the final assessment of environmental targets in 2010, local officials tend to implement short-term administrative measures, such as “shutdowns, mergers, and transformations”, rather than long-term green technology innovations that can reduce emissions and save energy. However, these administrative measures often come at the cost of local economic growth and offer limited environmental benefits. As national environmental efforts intensify, local officials find it increasingly difficult to achieve their environmental goals through mandatory measures alone. Therefore, for long-term development, local officials adopt a dual approach: maintaining emission standards with command-style environmental regulations while also encouraging green technology innovation through incentive-based regulatory measures. In the short term, enterprises may relocate to areas with lower environmental regulations or pay fines to address pollution. However, in the long term, increased environmental efforts and heightened public awareness will drive enterprises to innovate in green technology.
5.2 Robustness Test[1]
(1) The number of countries or regions where a patent is filed is used to measure the quality of patents. A patent family consists of a series of patents filed in different countries or regions for the same invention. The higher the patent value, the more likely the inventor applies for patent protection in multiple countries or regions. This paper measures patent quality by calculating the number of countries or regions where a patent family is filed, and the regression results are robust.
(2) Assess the quality of patents by evaluating the breadth of their technical fields.
The more extensive a patent’s technical field, the more complex the knowledge it covers, making it harder to be replaced or imitated, and thus increasing its value. This paper employs two methods to measure the breadth of a patent’s technical field: directly counting the number of IPC codes involved in the patent. However, this method has limitations, such as when a patent has two IPC classification codes that belong to the same IPC subclass, indicating they are in the same technical field. To address this, the number of IPC subclasses involved in the patent is also counted to measure the breadth of its technical field, which also yields robust regression results.
(3) Use the median method instead of the mean method. The difference in the way patent quality is summed may also affect the estimation results. Therefore, the median method is used to sum the patent data at the IPC group level for regression, and the results are consistent with the benchmark results.
(4) Comparison of ordinary and high-quality patents. This paper categorizes patents into high-quality and ordinary categories based on the second quartile of knowledge breadth, and conducts a subsample regression analysis. The regression results indicate that the target responsibility system of environmental protection increases the number of ordinary patent applications but reduces their quality, while it has no significant impact on the quantity or quality of high-quality patents. This suggests that the target responsibility system significantly influences the quantity of green innovation activities, whereas high-quality green innovation activities are more likely to depend on the overall enhancement of green innovation capabilities and the improvement of the innovation environment.
(5) Stricter standards for identifying green patents. The experimental group in the baseline regression is defined at the IPC group level. However, some subgroups under the IPC groups may not be classified as green patent technologies, which could lead to an overestimation of the scope of green patents. Therefore, another robustness test is examined by using IPC groups whose subgroups are all classified as green patent technologies as the experimental group. The results are consistent with the baseline results.
(6) The impact of other policies. In 2008, the Outline of National Intellectual Property Strategy was issued, encouraging patent applications as a key component of the national innovation-driven strategy. In 2015, the new Environmental Protection Law came into effect. To account for the potential impact of these policies on green patent applications, this paper added interaction terms between the group variables greeni and time dummy variables for 2008 and 2014 to the model (1), and the results remained robust.
(7) Placebo Test. In the same patent family, the receiving office corresponding to the priority number is the location where the patent was first filed, which is the preferred place for seeking intellectual property protection and can be considered the most important target market. Therefore, the relevant policies of the administrative region where the receiving office is located are likely to incentivize the patent’s innovative behavior. The target responsibility system of environmental protection primarily regulates enterprises conducting production and business activities within Chinese mainland. Clearly, for patents that are first applied for in other countries and then in China, it can be expected that the target responsibility system had little impact on such patents. This paper identifies patents with foreign priority numbers as those applied for by foreign institutions or individuals and uses them as dependent variables in regression analysis. The results show that the target responsibility system has no significant impact on the quantity and quality of green patents applied for by foreign institutions or individuals in China, further confirming the reliability of the main conclusions of this paper.
(8) Three-stage difference method. The high concentration of innovation activities in space indicates that geography is a significant factor influencing innovation behavior (Carlino and Kerr, 2014). To further examine the impact of omitted variables on the conclusions of this study, the data structure was expanded to IPC×year×province based on the geographical information of patent applicants. Provinces were categorized into two groups: those with high emission reduction targets (1=high targets) and those with low targets (0=low targets). Based on this, a three-stage difference estimation was conducted, drawing on Chen et al. (2018), and the regression results remained robust.
6 Further Analysis of the Decline in the Quality of Green Technology Innovation
6.1 Who is Responsible for the Decline in Quality?
Profit-orientation is a prominent feature of enterprises’ patent innovation activities, whereas university researchers tend to pursue academic pursuits aimed at self-actualization. Moreover, whether it is command-based pollutant emission standards or incentive-based tax reductions and R&D subsidies, enterprises are almost the only entities targeted. This paper uses text recognition methods to categorize patent applicants into enterprises and universities, examining the heterogeneous impact of the target responsibility system of environmental protection on green innovation by different applicant entities. Table 2 shows that the target responsibility system significantly promotes the increase in green patent applications by both enterprises and universities, but it only reduces the quality of green patent applications by enterprises.
Profit-Making and Non-Profit Organizations
| Enterprise | Universities and research institutions | |||
|---|---|---|---|---|
| Number of patents | Quality of patents | Number of patents | Quality of patents | |
| (1) | (2) | (3) | (4) | |
| greeni × postt | 0.143** | –0.0284** | 0.283*** | –0.0153 |
| (0.0652) | (0.0130) | (0.0724) | (0.0139) | |
| Fixed effect | Yes | Yes | Yes | Yes |
| Sample size | 12075 | 12075 | 11325 | 11325 |
| R2 | 0.464 | 0.102 | 0.530 | 0.198 |
Note: In line with the benchmark regression, fixed effects include three fixed effects: IPC group, year and IPC subgroup × year. The same applies to the following tables.
6.2 The Reasons for the Decline in Quality and the Corresponding Organizational Forms, Technical Fields and Industry Attributes of Innovation Activities [1]
(1) Explanations based on the innovation capability. Enterprises with strong innovation capabilities typically proactively implement innovation strategies in response to market competition, characterized by their initiative and continuity, and are less influenced by government policies. In contrast, enterprises with weaker innovation capabilities are constrained by factors such as funding and talent, leading to more reactive and random innovation activities. Therefore, compared to enterprises with strong innovation capabilities, the target responsibility system of environmental protection has a more pronounced distorting effect on the quality of innovation for enterprises with weaker innovation capabilities. This study measures the pre-policy innovation capability of enterprises based on the median number of patent applications in the year prior to the implementation of the target responsibility system, and examines whether this system has a heterogeneous impact on the green patent application behavior of enterprises with different innovation capabilities. Table 3 shows that the target responsibility system has increased the number of green patent applications from enterprises with different innovation capabilities, but it has only significantly and negatively impacted the quality of green patent applications from enterprises with weaker innovation capabilities.
Enterprises with Strong Innovation Capability and Enterprises with Weak Innovation Capability
| Strong innovation capability | Weak innovation capability | |||
|---|---|---|---|---|
| (1) | (2) | (3) | (4) | |
| Number of patents | Quality of patents | Number of patents | Quality of patents | |
| greeni × postt | 0.249*** | 0.0059 | 0.171** | –0.0308** |
| (0.0811) | (0.0144) | (0.0860) | (0.0129) | |
| Fixed effect | Yes | Yes | Yes | Yes |
| Sample size | 10620 | 10620 | 11130 | 11130 |
| R2 | 0.471 | 0.219 | 0.505 | 0.233 |
(2) The organizational forms of innovation activities. Independence and cooperation are two common forms of organizing innovation activities. When enterprises implement strategic innovation activities to gain economic benefits such as subsidies and tax reductions, independent innovation is clearly a better choice. In terms of cost, the investment in strategic innovation activities is entirely determined by the enterprise itself; in terms of revenue, the potential benefits from these activities are also exclusively enjoyed by the enterprise. For cooperative innovation, strategic innovation activities face numerous uncertainties and challenges in the distribution of potential benefits. Based on patent applicant information, this paper constructs sub-samples using patents from individual applicants and joint applicants (two or more applicants) for comparison, to further examine the impact of environmental responsibility on the quality of green technology innovation activities in terms of organizational form heterogeneity.
Table 4 indicates that the target responsibility system of environmental protection has a significant negative impact on the quality of green patents filed independently. Furthermore, this paper uses text recognition methods to identify both corporate and university independent patent applications. The results in Table 5 show that the decline in green patent quality due to the target responsibility system of environmental protection primarily stems from corporate independent patent applications. Additionally, the target responsibility system’s positive effect on the number of green patents is supported in both cooperative and independent application samples.
Independent Innovation and Cooperative Innovation
| Joint application | Independent applications | |||
|---|---|---|---|---|
| (1) | (2) | (3) | (4) | |
| Number of patents | Quality of patents | Number of patents | Quality of patents | |
| greeni × postt | 0.319*** | –0.0004 | 0.227*** | –0.0369*** |
| (0.106) | (0.0137) | (0.066) | (0.010) | |
| Fixed effect | Yes | Yes | Yes | Yes |
| Sample size | 11445 | 11445 | 12315 | 12315 |
| R2 | 0.586 | 0.372 | 0.665 | 0.139 |
Independent Applications by Enterprises and Universities
| Independent application by enterprises | Independent application by university | |||
|---|---|---|---|---|
| (1) | (2) | (3) | (4) | |
| Number of patents | Quality of patents | Number of patents | Quality of patents | |
| greeni × postt | 0.142** | –0.0304** | 0.279*** | –0.0120 |
| (0.0657) | (0.0131) | (0.0715) | (0.0143) | |
| Fixed effect | Yes | Yes | Yes | Yes |
| Sample size | 12060 | 12060 | 11310 | 11310 |
| R2 | 0.450 | 0.102 | 0.526 | 0.195 |
6.3 Is the “Substantive Review” Effective?
As previously mentioned, the “substantive examination” is a critical component of the patent system for “quality control” of invention patent activities. Only after passing the substantive examination will an invention patent be granted. This section focuses on whether authorization can serve as a supervisory and screening mechanism to mitigate the negative impact of the target responsibility system of environmental protection on the quality of green patent applications. The article further constructs relevant samples using authorized patents. Results show that the “substantive examination” can alleviate the negative impact of the target responsibility system of environmental protection to some extent. For details, please refer to the Appendix online.
7 Research Conclusions and Policy Implications
This paper constructs quantitative and qualitative indicators for green innovation activities that align well with the characteristics of environmental protection technology, based on patent data. It empirically examines the impact of the target responsibility system of environmental protection, which was implemented during the 11th Five-Year Plan period, on green technological innovation behavior. The study reveals: Firstly, the target responsibility system significantly boosts the number of green patent applications but also negatively impacts the quality of green innovation activities to some extent. Secondly, in the short term, the target responsibility system of environmental protection does not significantly affect the quantity or quality of green patents; however, in the long term, it increases the number of green patents while reducing their quality. Thirdly, the policy effects of the target responsibility system of environmental protection on green patents vary depending on the profit orientation, innovation capability, organizational form of innovation activities, types of green technology, and industrial pollution intensity of the patent applicants. Fourthly, the target responsibility system of environmental protection increases the number of green authorized patents but does not significantly and negatively impact their quality.
Based on the above research findings, the policy implications of this paper are as follows: Firstly, in the future, we should deepen the reform of the target responsibility system of environmental protection, increase the weight of environmental performance and audit of local officials upon their departure from office in the performance evaluation, implement a lifelong responsibility system for environmental protection, intensify the assessment of green technology research and development and environmental protection investment, formulate scientific and effective environmental science and technology policies, use the quality of green patents as a key criterion for policy support, and develop differentiated environmental regulation policies based on the heterogeneity of enterprises to achieve precise regulation. Secondly, promote the coordination and cooperation among various environmental regulation tools, including command-based, market-based, and voluntary types, fully utilize social supervision mechanisms such as environmental organizations and online news media, and establish a diversified environmental regulation system. Thirdly, establish a scientific and effective patent authorization management system, enhance the ability of authorization institutions to identify high-value patents, and fully leverage the supervisory and management functions of these institutions.
References
Aghion, P., Akcigit, U., Bergeaud, A., Blundell, R., & Hémous, D. (2015). Innovation and Top Income Inequality. NBER Working Paper, No. w21247.10.3386/w21247Suche in Google Scholar
Bai, X., & Song, Y. (2009). Environment Regulation, Technology Innovation and Efficiency Improvement of Chinese Thermal Power Industry. China Industrial Economics (Zhongguo Gongye Jingji), (8), 68–77.Suche in Google Scholar
Blackman, A., Li, Z. Y., & Liu, A. A. (2018). Efficacy of Command-and-Control and Market-based Environmental Regulation in Developing Countries. Annual Review of Resource Economics, 10(1), 381–404.10.1146/annurev-resource-100517-023144Suche in Google Scholar
Carlino, G., & Kerr, W. R. (2014). Agglomeration and Innovation. NBER Working Paper, No. w20367.10.21799/frbp.wp.2014.26Suche in Google Scholar
Chen, S. X. (2017). The Effect of a Fiscal Squeeze on Tax Enforcement: Evidence from a Natural Experiment in China. Journal of Public Economics, 147, 62–76.10.1016/j.jpubeco.2017.01.001Suche in Google Scholar
Chen, Z., Kahn, M. E., Liu, Y., & Wang, Z. (2018). The Consequences of Spatially Differentiated Water Pollution Regulation in China. Journal of Environmental Economics and Management, 88, 468–485.10.1016/j.jeem.2018.01.010Suche in Google Scholar
Dong, Z., & Wang, H. (2019). Local-Neighborhood Effect of Green Technology of Environmental Regulation. China Industrial Economics (Zhongguo Gongye Jingji), (1), 100–118.10.1016/j.ecolind.2020.106773Suche in Google Scholar
Fu, W., Ye, J., Meng, W., & Lei, Z. (2015). The Impacts of Domestic Content Protection on Indigenous Innovation: Evidence from China’s Wind Power Technology Industry. Economic Research Journal (Jingji Yanjiu), (2), 118–131.Suche in Google Scholar
Gray, W. B., & Shadbegian, R. J. (2003). Plant Vintage, Technology and Environmental Regulation. Journal of Environmental Economics and Management, 46(3), 384–402.10.1016/S0095-0696(03)00031-7Suche in Google Scholar
Greenstone, M., List, J. A., & Syverson, C. (2012). The Effects of Environmental Regulation on the Competitiveness of U.S. Manufacturing. NBER Working Paper, No. w18392.10.3386/w18392Suche in Google Scholar
Han, C., Zhang, G., & Feng, Z. (2017). How Does Environmental Regulation Remove Resource Misallocation: An Analysis of the First Obligatory Pollution Control in China. China Industrial Economics (Zhongguo Gongye Jingji), (4), 115–134.Suche in Google Scholar
Haščič, I., & Migotto, M. (2015). Measuring Environmental Innovation Using Patent Data. OECD Environment Working Papers, No. 89.Suche in Google Scholar
Jaffe, A. B., & Palmer, K. (1997). Environmental Regulation and Innovation: A Panel Data Study. Review of Economics and Statistics, 79(4), 610–619.10.1162/003465397557196Suche in Google Scholar
Jiang, F., Wang, Z., & Bai, J. (2013). The Dual Effect of Environmental Regulations’ Impact on Innovation: An Empirical Study Based on Dynamic Panel Data of Jiangsu Manufacturing. China Industrial Economics (Zhongguo Gongye Jingji), (7), 44–55.Suche in Google Scholar
Ley, M., Stucki, T., & Woerter, M. (2016). The Impact of Energy Prices on Green Innovation. Energy Journal, 37(1), 41–75.10.5547/01956574.37.1.mleySuche in Google Scholar
Li, W., & Zheng, M. (2016). Is It Substantive Innovation or Strategic Innovation? Impact of Macroeconomic Policies on Micro-enterprises’ Innovation. Economic Research Journal (Jingji Yanjiu), (4), 60–73.Suche in Google Scholar
Moser, P., & Voena, A. (2012). Compulsory Licensing: Evidence from the Trading with the Enemy Act. American Economic Review, 102(1), 396–427.10.1257/aer.102.1.396Suche in Google Scholar
Noailly, J., & Smeets, R. (2015). Directing Technical Change from Fossil-fuel to Renewable Energy Innovation: An Application using Firm-level Patent Data. Journal of Environmental Economics and Management, 72(3), 15–37.10.1016/j.jeem.2015.03.004Suche in Google Scholar
Qi, S., Lin, S., & Cui, J. (2018). Do Environmental Rights Trading Schemes Induce Green Innovation? Evidence from Listed Firms in China. Economic Research Journal (Jingji Yanjiu), (12), 129–143.Suche in Google Scholar
Ren, S., Zheng, J., Liu, D., & Chen, X. (2019). Does Emissions Trading System Improve Firm’s Total Factor Productivity: Evidence from Chinese Listed Companies. China Industrial Economics (Zhongguo Gongye Jingji), (5), 5–23.Suche in Google Scholar
Song, M., & Wang, S. (2013). Analysis of Environmental Regulation, Technological Progression and Economic Growth from the Perspective of Statistical Tests. Economic Research Journal (Jingji Yanjiu), (3), 122–I34.Suche in Google Scholar
Wang, B., & Qi, S. (2016). The Effect of Market-Oriented and Command-and-Control Policy Tools on Emissions Reduction Innovation: An Empirical Analysis Based on China’s Industrial Patents Data. China Industrial Economics (Zhongguo Gongye Jingji), (6), 91–108.Suche in Google Scholar
Wang, H., Tang, T., & Song, X. (2017). Who Drives Enterprise Environmental Governance: Officials’ Tenure Evaluation or “Five-Year Plan” Target Assessment? Finance & Trade Economics (Caimao Jingji), (11), 147–161.Suche in Google Scholar
Xu, J., & Cui, J. (2020). Low-Carbon Cities and Firms’ Green Technological Innovation. China Industrial Economics (Zhongguo Gongye Jingji), (12), 178–196.Suche in Google Scholar
Zhang, J., & Zheng, W. (2018). Has Catch-up Strategy of Innovation Inhibited the Quality of China’s Patents? Economic Research Journal (Jingji Yanjiu), (5), 28–41.Suche in Google Scholar
Zhou, L. (2004). The Incentive and Cooperation of Government Officials in the Political Tournaments: An Interpretation of the Prolonged Local Protectionism and Duplicative Investments in China. Economic Research Journal (Jingji Yanjiu), (6), 33–40.Suche in Google Scholar
Zhou, X., Cheng, L., & Wang, H. (2012). Is Higher the Level of Technological Innovation, Better the Financial Performance? An Empirical Analysis of Patent Applications of the Listed Chinese Pharmaceutical Company. Journal of Financial Research (Jinrong Yanjiu), (8), 166–179.Suche in Google Scholar
© 2025 Feng Tao, Jinyu Zhao, Hao Zhou, published by De Gruyter
This work is licensed under the Creative Commons Attribution 4.0 International License.
Artikel in diesem Heft
- Frontmatter
- Column: China’s Economic Development
- Responsible International Investment: ESG and OFDI in China
- Digital Economy, Declining Demographic Dividend and Rights of Low- and Medium-Skilled Workers
- Domestic Demand Upgrading, Product Mix Adjustment, and Export Competition Strategy
- Does Environmental Regulation Achieve “Incremental Quality” of Green Technology Innovation? —— Evidence from the Target Responsibility System of Environmental Protection
- Effect of Government Subsidies on the New Quality Productive Forces of Enterprises: An Empirical Study Based on A-Share Listed Companies
- Influence of Urbanization on Carbon Emission Rights: An Analysis Based on an Enhanced Translog Production Function and Refined Urban Boundaries