Measurement and Characteristics of the Integration of China’s Trade in Services into Digital Global Value Chain
-
Yanfang Lv

Abstract
In this paper, the characteristics of digital trade in services of China are measured and revealed from the perspective of digitalization of trade in services. A digital global value chain is constructed and comprehensively analyzed at the three levels of path decomposition, two-way digital connection and bilateral connection. The study finds that the digital added value of China’s services driven by domestic demand outweighs that driven by foreign demand, and most countries engage in digital trade in services with China through simple participation; the role of China’s services in the digital global value chain is shifting from “digital value input” to “digital value output”, but its relative position is still low; China’s dependence on the import of digital intermediate products from developed countries has been significantly reduced, and the country has become the main source of digital intermediate imports for most countries, acting as a “hub” in the digital global value chain. This study comprehensively evaluates the strategic positioning and paths of integrating China’s services into the digital global value chain in multiple dimensions under the unified accounting framework. It provides the reference for further improving the statistics accounting framework of China’s digital trade and promoting the high-quality development of the digital economy.
1 Introduction
With the third and fourth industrial revolutions, new-generation information technologies such as big data, cloud computing and artificial intelligence have effectively enabled the participation of digital products in the global value chain (GVC). Accordingly, the participation cost of the GVC and the models of production and interaction have changed, and international trade has started to take the form of “digital global value chain” (DVC), rather than the previous GVC. [1] Digital technologies, while quickening the pace of trade and expanding its size and scope, are driving forward the digitalization of trade in services. As an integral part of digital trade, digital trade in services is becoming the new engine for the high-quality economic development and the new match point in global trade competition at the current stage. Its development serves as an important approach for countries to elevate their position in the DVC. In a bid to seize the say in the new-round global political and economic governance system, developed economies represented by the United States and Europe have been frontrunners in promoting the construction of digital trade rules and planning for the development of digital trade in services. As a large trader in services, China registered a digital service export of up to USD 131.45 billion in 2018, 4.45% of the world. [2] The report of the 19th CPC National Congress has proposed the measures of building a “digital China” and “fostering new business forms and new models of trade and pressing ahead to develop into a great power in trade”; the CPC Central Committee and the State Council have also released major plans on cyber development, “Internet +” and artificial intelligence to support the high-quality development of digital trade in services in China. Evidently, the innovative development of digital technologies has injected new vigor to global trade development, and digital trade in services, with data as trade object and Internet as transmission medium, is becoming the new trend of international trade development.
Some national organizations and scholars have made preliminary explorations on statistical measurement of digital economy and digital trade, offering insights into accounting of digital trade in services (USITC, 2013, 2014; OECD, 2018; Wu, 2019; Xu and Zhang, 2020). However, digital trade in services, as an emerging form of trade, has led to many new methods and rules of trade, for which a statistical accounting system remains to be established. On the one hand, in the context of constantly evolving international trade in form, perception on the traditional trade in services is no longer sufficient for meeting the needs under the new situation, while a unified concept of “digital trade in services” based on new practice hasn’t been developed yet. On the other hand, it’s difficult to accurately categorize emerging trading products and services in trade statistics, and quantitative measurement of digital trade in services that is internationally comparable remains a blank academically. Under such background, to identify the theoretical connotation of digital trade in services and make accurate measurement based on the established knowledge and new practice is helpful for refining the digital trade accounting system and promoting the development into a “digital China” and a great power in trade.
On this account, based on thorough understanding on the theoretical connotation of digital trade in services, this paper extends GVC into DVC from the perspective of digitalization of trade in services. It also analyzes the multi-dimensional positioning and paths of China participating in the DVC and the characteristics of bilateral connection between China and other main economies in the DVC. The analysis is conducted at three levels, namely path decomposition investigated from domestic and foreign demand and production activities in various forms, two-way digital connection investigated from degree and position of participation, and bilateral connection investigated from composition of countries and mutual dependence.
2 Measurement Framework of Digital Trade in Services
2.1 Theoretical Basis
This paper first clarifies the concept of digital trade in services. Currently, no consensus has been reached on the concept internationally, and digital trade in services is mostly defined in rules or initiatives released by some countries and categorized under digital trade. United Nations Conference on Trade and Development (UNCTAD) defined digital trade in services as “cross-border supply of all trade in services through information and communication network” (UNCTAD, 2015); Organization for Economic Co-operation and Development (OECD) believed it to be cross-border transmission and supply of trade in software, electronic books and data services etc. through information and communication network (OECD, 2018); the 2018 Report on the Development of Digital Trade in Services in China pointed out digital trade in services in the narrow sense is an integral part of digital trade and refers to digital trade, with trade in goods excluded. With digital technologies advance, the concept in the narrow sense can no longer reflect the rapid development of digital trade in services comprehensively. With the contents of new-type digital services being included into the narrow sense, digital trade in services in the broad sense can be described as “products and services that are researched and developed, designed and produced with digital technologies, and delivered to users with the means of Internet and modern information technologies”. It covers three parts, namely trade in information technology services, trade in digital content services, and outsourcing of offshore services delivered via Internet. Wang (2019) held that the focus of study on digital trade in services should include four dimensions, including application of digital technologies, digitalization of industries and trade, market opening-up for digital trade and main barriers, and impact of cross-border digital flow on trade. In combination of the current researches, this paper believes digital trade in services is born in the context of intertwined digital economy and trade in services and resorts to the efficient use of digital communication technologies to improve the efficiency and optimize the structure of trade in services; it includes not only digitalization of traditional trade in services, but also new economic models triggered by the accelerated iteration of digital technologies.
Currently, the academic research on the measurement of GVC is rather matured and able to offer important insights into tentative measurement of digital trade in services from the perspective of digitalization of trade in services. Hummels et al. (2001) proposed the vertical specialization framework (HIY model) to analyze size of vertically specialized trade of a country and its degree of participation, commencing the study on global value chain specialization. Inspired by the HIY model and for the purpose of distinguishing the source and flow direction of value of various sectors at different production stages, Koopman et al. (2014) relaxed the HIY hypotheses, decomposed total export of a country by ultimate destination into domestic value-added absorbed overseas, value-added returned to a country after export, foreign value-added and repeated calculations, and constructed and improved the total export decomposition model (KWW model), setting the footstone of theoretical research on vertical specialization and trade in value-added. Wang et al. (2013) segmented total export into 16 parts based on backward linkage, expanded the total export model in national sectors, bilateral connection and bilateral sectors, and systematically developed a relatively complete accounting framework for GVC ranging from gross trade to trade in value-added. On such basis, Wang et al. (2017a, 2017b) further extended the accounting framework to production, decomposed trade in value-added from the perspective of forward linkage and backward linkage respectively, and comprehensively analyzed the characteristics of national sectors participating in the GVC in degree of participation, position and competitiveness. Meanwhile, the KWW model and the WWYZ model based on total export decomposition are becoming mainstream methods for quantitative measurement of GVC and widely applied by Chinese scholars in analyzing the characteristics of China’s participation in the GVC. Wang (2014) used the KWW model to explore the specialization position and integration paths of Chinese manufacturing in the GVC in the dimensions of position of participation and value-added capacity. Zhang and Zhai (2018) adopted the WWYZ model and used indicators such as participation degree, location and competitiveness in the GVC to evaluate the features of China’s participation in the GVC. Chen (2019) resorted to the WWYZ model to analyze the path decomposition of integrating Chinese manufacturing into the world innovation network through trade in value-added.
2.2 Classification of Related Industries
2.2.1 Digital Economy
With reference to the research by Xu and Zhang (2020) and in light of data availability, this paper categorizes digital economy into three parts including digital infrastructure industry, digital media industry and digital trading industry (Table 1). To be specific, digital infrastructure is infrastructure that renders services in digital transformation, intelligent upgrade and integrated innovation and facilitates realization of their tradability, and mainly includes telecommunication equipment and service, computer software, computer hardware and other infrastructure industries that support the normal operation of digital trade in services. Digital media refers to Internet service industry that is based on digital technologies and digital infrastructure, covers multimedia, software, network and other information communication industries, and satisfies users’ diversified needs such as creating, browsing and keeping digital contents. It consists of two parts: Internet publishing and distribution and Internet transmission. Digital trading in the broad sense can be taken as all trades in goods and services that are actualized via Internet, and covers e-commerce activities such as related online trade acting through digital subscription and digital delivery. In this paper, with the classification of e-commerce by National Bureau of Statistics being matched with the World Input-Output Database (WIOD) industrial grouping, digital trading industry is defined as wholesale and retail, finance, and other related auxiliary services.
Classification of Digital Economy
| Type | Including | Industry code | NACE code | Industry |
|---|---|---|---|---|
| Digital infrastructure | Telecommunication equipment and services | 39 | J61 | Telecommunication services |
| Computer software | 40 | J62_J63 | Computer programming, software services | |
| Computer hardware | 17 | c26 | Manufacturing of computers and electronic and optical products | |
| 18 | c27 | Manufacturing of electric equipment | ||
| Digital media | Internet publishing and distribution | 37 | J58 | Publishing |
| Internet transmission | 38 | J59_J60 | Producing of films, videos and TV programs, and recording | |
| Digital trading | Wholesale and retail | 29 | G46 | Wholesale |
| 30 | G47 | Retail | ||
| Financial services | 41 | K64 | Financial services | |
| Other related auxiliary services | 35 | H53 | Postal and courier services | |
| 45 | M69_M70 | Legal, accounting and related consulting services | ||
| 47 | M72 | Research and development services |
Note: Industries under digital economy are grouped in various ways. Limited by statistics, this paper only classifies related industries of digital economy as data permits.
2.2.2 Services
The latest WIOD data covers the input-output data of 56 industries in 43 countries and regions (other ROW countries and regions deleted) during 2000−2014. On the basis of the International Standard Industrial Classification of All Economic Activities, this paper eventually selects the 28 WIOD service industries coded c28-c55.
2.3 Method of Measurement
2.3.1 Channel of China’s Integration into the Digital Global Value Chain: Path Decomposition
In expanding the research by Wang et al. (2017a), this paper includes digital penetration into the global multi-regional input-output model (GMRIO) and extends GVC into DVC. It decomposes the paths of services in a country’s integration into the GVC through trade in value-added by measuring the digital value-added of services in different links of DVC.
First, in line with the row equilibrium conditions, total output can be expressed as:
X is total output, ADX domestic intermediate products, and YD domestic end products. E refers to total export and can be categorized into export of intermediate products (AFX) and export of final products (YF).
Total export E is decomposed by intermediate products, final products and end destination of absorption:
In combination of (1) and (2), we get the total output decomposition by whether products and services participate in cross-border trade, i.e. by whether products are used as final products and whether they are used to meet domestic demand:
Second, the GMRIO table reflects the trade flow of products and services among countries, and digital input and data factors form the DVC through international trade flow. Given that data details on digital trade in services remain unavailable currently and digital value-added remains to be estimated, this paper introduces the digital penetration coefficient vector TWi and defines it as the proportion of intermediate input (zikl) from the digital industry k of economy i in services l in total output (yil) of services l of economy i.
Accordingly, the digital value-added coefficient vector can be expressed as:
TWV a is direct digital value-added vector. In further combination of (3) and (5), we can decompose the digital value-added at the level of national sectors into:
Further referring to the research by Chen (2019), the paper exemplifies (6) with the cases of three economies including Chinese services, country i and country j.
DV_D matrix follows as:
Main diagonal entries
DV_R matrix follows as:
Main diagonal entries
DV_DVCS is domestic digital value-added included in the digital intermediate export of Chinese services and directly absorbed by importing countries. It is named digital value-added driven by participation in simple DVC activities.
Non-main diagonal entries
DV_DVCC is domestic digital value-added that is included in the digital intermediate export of home country’s services, used by host countries in producing export products and re-exported to the home country or third economies. It is called digital value-added driven by participation in complex DVC activities.
2.3.2 Positioning of China in the Digital Global Value Chain: Two-Way Digital Connection
With reference to the research by Wang et al. (2017a), this paper defines the forward digital linkage index of services in a country as share of digital value-added implied in intermediate export to downstream national sectors in total digital value-added. The index reflects the digital contribution of intermediate products of a country to the supply chain of other countries and is marked as DVCPf.
Similarly, backward digital linkage index of services in a country can be defined as share of digital final demand in total final demand. The index reflects the contribution of domestic and foreign production factors participating in global service and production division, with data, a new production factor, included, to the final product value-added of a country, and is marked as DVCPb.
Compared with the digital linkage indices, a DVC position index can reveal a country’s relative position in DVC specialization more accurately. Meanwhile, given the high dependence of digital trade in services on digital technologies, for the economies that participate in the DVC with trade in services of a large high-tech content, their predominant position and profitability in the international digital specialization system are increasingly noticeable thanks to their core technologies. On this account, this paper extends the production chain to digital production chain in length by referring to the method of Zhang and Zhai (2018) and expanding the research by Wang et al. (2017b), and constructs the DVC position index (TDVC_pos) covering both value-added and R&D innovation, with the R&D innovation index (ISF) as correction factor. The purpose is to further highlight the decisive influence of scientific and technological strength on the position of an economy in the DVC specialization. [1]
DVC_lenva is the share of domestic digital value-added embodied in the intermediate exports in its total output in the world; DVC_leny is the share of digital value-added embodied in the intermediate imports in its total output in the importing country. The index TDVC_pos discloses the position of a country or sector in the digital value chain; a higher value indicates a position closer to the upper-stream DVC and greater profitability of digital input.
3 Comprehensive Characteristics of China in the Digital Global Value Chain
3.1 Characteristics of China’s Integration into the Digital Global Value Chain: Path Decomposition
3.1.1 Path 1 and Path 2: Domestic Demand and Foreign Demand
Figure 1 shows the dynamic changes of digital value-added of Chinese services driven by domestic and foreign demand in 2000−2014. According to the results, the digital value-added of Chinese services for satisfying domestic demand was steadily increased from USD 34879.79 million in 2000 to USD 409323.71 million, up 10.74 times. On the one hand, digitalization enriched domestic consumers’ diversified, individualized and virtualized demand and promoted daily-life services and cross-provincial digital trade in services to develop rapidly. In another word, along with the rise in digital service demand in the domestic market, the demand-side digitalization forced the supply side to accelerate digitalization and further facilitated the dynamic supply-demand optimization, effectively matching the two sides. On the other hand, the cut in technical cost sped up the digitalization of Chinese services and greatly improved the efficiency and quality of digital services. Also, the digital value-added driven by foreign demand grew stably as well, but was lower than that driven by domestic demand in general. As a possible reason, in order to fully meet the people’s increasingly stronger demand for a better life, China forcefully pushed forward the high-quality development of manufacturing and promoted manufacturing to integrate in depth with productive services and digital economy, bringing up the demand for domestic digital services and modern digital trade in services.
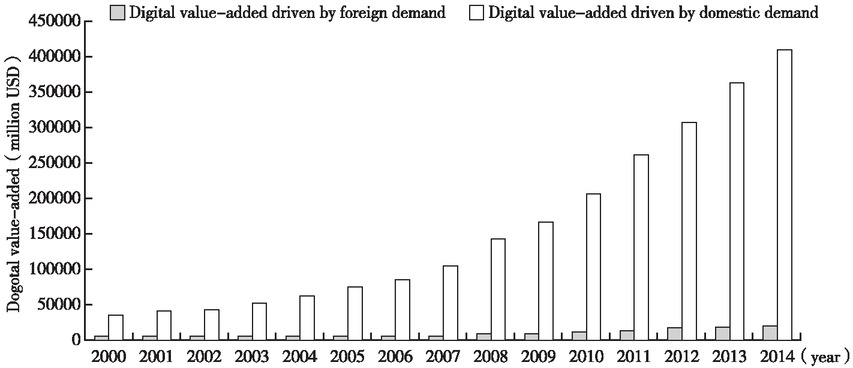
Digital Value-Added of Chinese Services Driven by Domestic and Foreign Demand
3.1.2 Path 3 and Path 4: Simple Production Activities and Complex Production Activities [1]
Based on the previous analysis, this paper takes ten representative economies globally as an example [2] and lists the digital value-added of Chinese services driven by different production activities (Table 2). First, regarding simple production activities, during 2000−2014, economies that caused high digital value-added in China through intermediate demand were the United States, Germany and Japan. The United States ranked first with absolute advantage, resulting in up to USD 2290.97 million digital value-added in 2014, 2.77 times that caused by Germany at the second place. Out of the BRICS countries, South Korea and Russia resulted in high digital value-added of Chinese services through digital intermediate demand. With the edge in geographical proximity, they enjoyed multiple facilities in technologies and complementary resources, and had relatively close ties in technology and trade with Chinese services. Second, with respect to complex production activities, economies that resulted in the most digital value-added after the intermediate products and services were exported from China to them, processed there and then re-exported to third economies or used to satisfy China’s end demand were similarly the United States and Japan; BRICS countries drove much lower digital value-added of Chinese services through complex production activities than through simple production activities. As traditional innovative economies, developed economies were relatively high in income and strong in end consuming power, and the intermediate products and services exported from China need only be slightly processed before being directly converted into end consumer products to be absorbed by the importers. On the other hand, these economies enjoyed great competitive edges in the DVC with their high-end services, but constrained by their high labor cost, they mostly imported final products and services directly from China, rather than intermediate products and services. Chinese services have established a stable economic tie with developed economies in the DVC and provided them with massive digital consumer services. Developing economies, with weak export capacity, limited competitive advantage in re-export and low cost in making to meet local demand, mostly processed the intermediate products and services imported from China to satisfy local basic demand.
Digital Value-Added of Chinese Services Driven by Different Production Activities (Million USD) Developed economy Developing economy
| Activity type | Year | Developed economy | Developing economy | ||||||||
|---|---|---|---|---|---|---|---|---|---|---|---|
| United States | Germany | Japan | France | Britain | Canada | Brazil | South Korea | Russia | India | ||
| Simple production | 2000 | 232.10 | 114.01 | 137.26 | 51.74 | 60.89 | 21.55 | 4.72 | 37.32 | 2.21 | 5.33 |
| 2002 | 299.25 | 110.40 | 169.74 | 50.00 | 71.03 | 31.51 | 5.27 | 49.68 | 3.99 | 9.12 | |
| 2004 | 421.15 | 179.94 | 249.79 | 101.84 | 110.09 | 59.42 | 11.81 | 71.33 | 8.28 | 15.18 | |
| 2006 | 622.76 | 249.22 | 279.09 | 127.59 | 157.58 | 90.23 | 20.70 | 147.47 | 23.94 | 24.31 | |
| 2008 | 949.23 | 406.86 | 362.83 | 188.56 | 254.46 | 149.36 | 48.50 | 252.33 | 57.97 | 44.38 | |
| 2010 | 1170.32 | 565.09 | 424.37 | 344.24 | 345.43 | 208.86 | 81.65 | 298.75 | 79.60 | 58.65 | |
| 2012 | 1546.59 | 623.74 | 596.09 | 323.91 | 405.46 | 298.96 | 125.29 | 399.72 | 159.71 | 83.71 | |
| 2014 | 2290.97 | 826.03 | 641.20 | 443.47 | 429.00 | 396.31 | 173.09 | 515.50 | 210.48 | 135.50 | |
| Complex production | 2000 | 99.68 | 21.31 | 39.40 | 16.77 | 32.89 | 11.93 | 6.08 | 9.34 | 2.75 | 4.66 |
| 2002 | 134.75 | 26.44 | 52.04 | 22.12 | 45.61 | 15.57 | 6.36 | 14.50 | 4.93 | 7.30 | |
| 2004 | 196.52 | 45.38 | 80.16 | 39.92 | 77.86 | 28.66 | 8.89 | 21.48 | 7.25 | 11.31 | |
| 2006 | 316.95 | 66.65 | 121.00 | 59.69 | 105.89 | 51.59 | 17.63 | 42.01 | 16.65 | 22.13 | |
| 2008 | 520.27 | 122.32 | 200.99 | 102.55 | 175.46 | 79.64 | 41.78 | 75.46 | 33.67 | 40.91 | |
| 2010 | 638.36 | 172.60 | 229.78 | 163.73 | 228.69 | 102.17 | 66.22 | 93.45 | 35.62 | 64.12 | |
| 2012 | 907.13 | 220.35 | 380.68 | 217.56 | 314.76 | 156.40 | 112.60 | 149.86 | 69.39 | 92.53 | |
| 2014 | 1216.55 | 298.58 | 366.93 | 266.94 | 362.23 | 181.40 | 128.67 | 181.17 | 92.98 | 103.12 | |
3.2 Characteristics of China in the Digital Global Value Chain: Two-Way Digital Connection
3.2.1 Overall Analysis
The changes with the two-way digital linkage index in Figure 2 show that the average value of VCPb (0.0807) of Chinese services is lower than DVCPf (0.1006), indicating Chinese services integrate into the DVC mostly in the form of forward participation and participate in DVC specialization mainly by providing other economies with digital services. Dynamically speaking, the evolving trend of the two-way digital linkage index of Chinese services is basically consistent, turning out in a M-shape. During 2000−2007, along with China’s accession into WTO, Chinese services participated in the DVC specialization at an increasingly deeper level, with DVCPf and DVCPb increased by 34.38% and 31.40% respectively. In 2008−2011, under the impact of the European debt crisis and the financial crisis, both forward and backward digital linkage index declined temporarily and then slowly rebounded slightly, telling us the DVC specialization and cooperation of Chinese services were obstructed to different degrees, but managed to deepen slightly after the impact faded off. It’s worth noticing that the financial crisis posed greater influence on DVCPb, probably because China had been relying on cheap labor force and resource endowment to develop processing trade for long and intermediate input in the digital economy was mostly added to services and integrated into the DVC specialization in the form of backward participation. In 2012−2014, as affected by both external factors such as weak global economic recovery and rising trade protectionism and internal factors such as increased labor cost and fiercer environmental pressure, China’s participation in the DVC specialization and cooperation was severely tied up and processing trade import/export evidently declined, with DVCPb dropping again from 0.0597 in 2012 to 0.0568 in 2014. On the contrary, DVCPf climbed up by a small margin in 2014, which was possibly related with the policies on promoting the digital transformation and upgrade of trade in services put into effect in China. The diverging trend between DVCPf and DVCPb revealed the ongoing changing process of the role of Chinese services in the DVC from “digital value input” to “digital value output”.
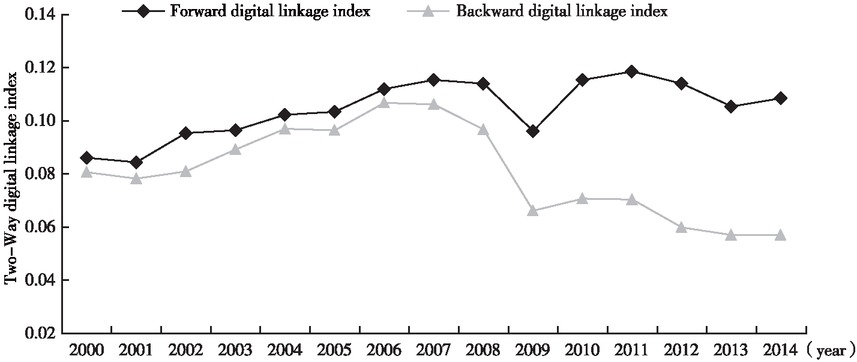
Participation of Chinese Services in the DVC
3.2.2 Analysis by Industry
According to the digital linkage index of industries shown in Table 3, first, knowledge-intensive industries providing related information services (such as computer programming, software services and R&D services) had a higher two-way digital linkage index in 2014. These high-tech information technology industries participated in the international division of labor at the highest level in China in the age of digital economy and also were critical for driving the transformation from information-based services to network-based and intelligent services. Second, from the perspective of changes, in 2000−2011, the two-way digital linkage index of most service industries climbed to various extents; during 2012−2014, DVCPf of most service industries remained basically unchanged, while that of high-tech services represented by telecommunication services and computer programming/software services was further increased by 0.44 and 0.93 percentage points respectively. It meant Chinese services were being fully integrated into the DVC and participated in different parts of DVC specialization increasingly more, with its forward digital intermediate product service and backward digital production service both being gradually extended. After 2012, as the technical content and R&D factors in the export of Chinese services gradually rose, domestic digital value-added of high-tech services was steadily increased, guiding the digital transformation and upgrade of trade in services. Meanwhile, DVCPb of all service industries presented a downward trend, indicating the comprehensively reduced dependence of Chinese domestic service activities on foreign digital value-added.
Difference in the Digital Linkage Index of the Segmented Industries in China
| Industrial code | Forward digital linkage index | Backward digital linkage index | ||||
|---|---|---|---|---|---|---|
| 2000−2011 | 2012−2014 | 2014 | 2000−2011 | 2012−2014 | 2014 | |
| c29 | 0.0189 | −0.0014 | 0.0323 | 0.0023 | −0.0011 | 0.0102 |
| c30 | 0.0059 | 0.0010 | 0.0325 | −0.0070 | −0.0011 | 0.0102 |
| c31 | 0.0000 | 0.0000 | 0.0097 | −0.0010 | −0.0007 | 0.0061 |
| c32 | 0.0167 | −0.0028 | 0.0272 | 0.0073 | −0.0018 | 0.0125 |
| c33 | −0.0098 | −0.0022 | 0.0201 | 0.0018 | −0.0011 | 0.0133 |
| c34 | 0.0038 | 0.0000 | 0.0110 | −0.0025 | 0.0019 | 0.0080 |
| c35 | 0.0057 | 0.0011 | 0.0137 | 0.0055 | −0.0015 | 0.0117 |
| c36 | −0.0057 | 0.0002 | 0.0064 | −0.0049 | −0.0006 | 0.0056 |
| c39 | 0.0021 | 0.0044 | 0.0167 | 0.0071 | −0.0026 | 0.0166 |
| c40 | 0.0183 | 0.0093 | 0.0523 | 0.0015 | −0.0073 | 0.0557 |
| c41 | 0.0003 | 0.0000 | 0.0112 | 0.0005 | −0.0002 | 0.0035 |
| c42 | −0.0100 | −0.0017 | 0.0246 | −0.0059 | −0.0009 | 0.0181 |
| c44 | −0.0007 | −0.0001 | 0.0031 | −0.0065 | −0.0002 | 0.0015 |
| c45 | 0.0343 | −0.0044 | 0.0481 | 0.0265 | −0.0031 | 0.0284 |
| c47 | 0.0205 | 0.0012 | 0.0231 | 0.0041 | −0.0027 | 0.0199 |
| c49 | 0.0085 | 0.0006 | 0.0116 | 0.0214 | −0.0036 | 0.0230 |
| c50 | −0.0112 | −0.0036 | 0.0047 | 0.0002 | −0.0013 | 0.0120 |
| c51 | 0.0005 | 0.0001 | 0.0008 | 0.0008 | −0.0008 | 0.0075 |
| c52 | 0.0003 | 0.0000 | 0.0008 | 0.0044 | −0.0010 | 0.0082 |
| c53 | 0.0004 | 0.0000 | 0.0005 | 0.0072 | −0.0008 | 0.0080 |
| c54 | 0.0036 | 0.0001 | 0.0081 | 0.0076 | −0.0016 | 0.0127 |
Note: 2000−2011 and 2012−2014 respectively refer to the change of digital participation index in 2000−2011 and that in 2012−2014, reflecting the dynamic change of the digital participation degree.
3.2.3 International Comparison
Table 4 lists the size of digital trade in services of main countries globally in 2000 and 2014. Regarding the total trade value, within the reporting period, total digital value-added of trade in services of developed economies was higher than that of developing economies, mainly for the following reason. Developed economies represented by the United States, Japan and Germany boasted developed services, a great quantity of service multinationals and rich digital economy policies, which spurred the continuous development of their digital trade in services; limited by lack of digital infrastructure and backward digital communication technologies, developing economies lagged behind in developing the digital trade in services. In 2000−2014, the two groups of economies both showed an upward trend in the digital value-added of trade in services, showing that amid the vigorous development momentum of the digital economy worldwide, digital trade in services in main economies was growing robustly and the trend of seizing the commanding height in global digital competition with digital trade in services was distinct. It is noteworthy that in 2000, China’s total digital value-added in trade in services lagged behind and was only 6.41% of that of the United States and 17.12% of that of Japan; by 2014, China soared into the second largest power in digital trade in services among the sample countries. Though the development of the trade in China started late, in recent years, the CPC and Chinese government took a series of reform measures to promote the development of new economy of services and new engines; digital infrastructure was increasingly refined and digital industrial foundation and enterprises kept growing; based on the leapfrog imitation and learning in digital technologies represented by network communication technologies, China had its innovation capacity greatly enhanced in the area. With these, China’s scale advantage and later-mover advantage in digital trade in services became prominent. However, though China was running ahead of other developing economies and overtaking most developed economies aside from the United States, the gap with the first-ranking United States remained wide and China’s total digital trade in services was only 48.19% of that of the United States.
Total Value-Added of Digital Trade in Services in Main Economies Worldwide (Million USD)
| Developed economy | 2000 | 2014 | Developing economy | 2000 | 2014 |
|---|---|---|---|---|---|
| United States | 915087.80 | 1522096.00 | China | 58620.20 | 733554.60 |
| Japan | 342401.10 | 299040.70 | Brazil | 44697.62 | 167078.80 |
| Germany | 147682.10 | 284860.60 | Switzerland | 35210.05 | 89943.38 |
| Britain | 140849.10 | 256665.60 | Russia | 10445.89 | 77722.87 |
| France | 112374.60 | 246948.50 | India | 11616.11 | 57083.14 |
| Italy | 88803.98 | 151031.10 | Mexico | 23444.09 | 46700.40 |
| Australia | 41767.42 | 150447.30 | Indonesia | 7704.07 | 40554.82 |
| Canada | 49486.01 | 114039.90 | Poland | 13253.97 | 33014.79 |
| Netherlands | 39801.34 | 91805.76 | Norway | 11154.15 | 33003.09 |
| South Korea | 36997.33 | 91248.49 | Turkey | 14129.98 | 29334.61 |
| Spain | 35560.64 | 84666.55 | Denmark | 10917.31 | 28002.70 |
| Belgium | 21251.27 | 55945.95 | Greece | 8816.94 | 13706.35 |
| Sweden | 16894.92 | 38789.47 | Romania | 1957.55 | 12289.91 |
| Taiwan, China | 23985.16 | 32272.10 | Hungary | 3321.08 | 8716.29 |
| Austria | 14110.12 | 31041.22 | Slovak Republic | 1597.63 | 7511.77 |
| Ireland | 9622.34 | 23969.32 | Bulgaria | 688.68 | 3681.10 |
| Finland | 7974.04 | 18545.16 | Croatia | 1181.91 | 3270.40 |
| Portugal | 9764.18 | 16846.29 | Slovenia | 1139.95 | 3188.80 |
| Czech Republic | 4510.18 | 16299.77 | Latvia | 623.53 | 2303.42 |
| Luxembourg | 2181.74 | 7757.34 | Lithuania | 572.99 | 2114.51 |
| Cyprus | 660.88 | 1750.26 | Republic of Malta | 356.63 | 1653.02 |
| — | — | — | Estonia | 391.39 | 1628.73 |
Note: Developed and developing economies are classified with reference to the UNCTAD standard and rank in a descending order by total value-added of digital trade in services in 2014.
In order to explore the position of Chinese services in the DVC, the sample economies are ranked in the descending order of TDVC_pos in 2014 in Table 5. Developed economies such as the United States, Japan and Germany were positioned higher in the DVC as dominant players; developing economies such as Russia and Brazil with a low technological level were positioned medium or lower. It means the great powers in technology and services such as the United States, Japan and Germany mostly provided R&D, design and other high-tech upper-stream services in the DVC. Besides, though below most economies as it was, China was positioned upper-medium in the DVC thanks to its high-ranking R&D innovation capacity. Position in the DVC reflected by this new indicator is better aligned with the interest pattern of international labor division in the age of digital economy.
International Comparison on the Participation Position in the DVC
| Higher | Upper-medium | Lower-medium | Lower |
| United States | France | Russia | Mexico |
| Germany | Britain | Spain | Bulgaria |
| Japan | Sweden | Czech Republic | Greece |
| Belgium | South Korea | Portugal | Lithuania |
| Netherlands | Taiwan, China | Estonia | Croatia |
| Denmark | Australia | Cyprus | Indonesia |
| Switzerland | China | India | Latvia |
| Finland | Italy | Slovenia | Turkey |
| Norway | Canada | Poland | Slovak Republic |
| Luxembourg | Ireland | Brazil | Romania |
| Austria | Republic of Malta | Hungary | — |
4 Ties between China and Other Main Economies in the DVC
This paper refers to the research by Zhang and Zhai (2018) and investigates in depth the ties between China and other main economies in the DVC at the level of bilateral trade decomposition.
4.1 Composition of Economies
First, from the perspective of forward linkage, the domestic digital value-added of Chinese services is mostly exported to developed economies. As shown in Table 6, in 2000, developed economies were the main destinations of export digital value-added of Chinese services (DDVA), and the share slightly dropped to 88.24% in 2014. From the perspective of backward linkage, regional constitution of Chinese services in the DVC was relatively stable, and China mainly import digital value added (DFVA) from developed economies. In 2014, developed economies were the main source of the DFVA of Chinese services, accounting for 89.21% of the total, barely different from that in 2000. Second, in order to further identify the trade ties of China with other main economies, Table 6 lists the top 20 countries in digital value-added trade with Chinese services. In 2014, the United States was both the largest DDVA export area of Chinese services, and also the largest source of DFVA import; Japan, EU and Britain also took up a large share in DDVA and DFVA trade with Chinese services, indicating in the DVC, Chinese services had the closest trade ties with developed economies. Meanwhile, China also established relatively stable connections in digital trade in services with important DVC member states in Asia such as India and Indonesia. Next, in 2014, the proportion of the United States in the DDVA export of Chinese services was increased to 20.21%, far higher than other economies, meaning the DDVA export of Chinese services highly depended on the U.S. market. Also, apart from a few economies including Germany, Australia and Indonesia, main economies had a generally larger share in the DFVA import of Chinese services.
Top 20 Economies in Digital Value-Added Trade with Chinese Services (%)
| Economies of DDVA export | Economies of DFVA import | ||||||
|---|---|---|---|---|---|---|---|
| 2000 | 2014 | 2000 | 2014 | ||||
| Developed economy | 89.95 | Developed economy | 88.24 | Developed economy | 89.32 | Developed economy | 89.21 |
| Developing economy | 10.05 | Developing economy | 11.76 | Developing economy | 10.68 | Developing economy | 10.79 |
| United States | 17.01 | United States | 20.21 | United States | 18.10 | United States | 20.70 |
| Germany | 15.32 | Netherlands | 10.58 | Germany | 17.13 | Germany | 11.45 |
| Japan | 14.46 | Germany | 9.40 | Japan | 9.13 | Netherlands | 10.80 |
| Australia | 6.60 | France | 8.84 | Australia | 6.93 | France | 8.42 |
| Britain | 6.28 | Sweden | 7.19 | Netherlands | 6.58 | Sweden | 7.34 |
| South Korea | 5.73 | South Korea | 6.55 | South Korea | 6.43 | South Korea | 6.58 |
| France | 5.72 | Belgium | 4.16 | France | 5.94 | Belgium | 4.23 |
| Netherlands | 5.57 | Australia | 3.42 | Britain | 5.36 | Australia | 3.40 |
| Indonesia | 3.49 | Finland | 3.19 | Indonesia | 4.16 | Finland | 3.24 |
| Luxembourg | 2.30 | Canada | 3.09 | Sweden | 2.74 | Canada | 2.79 |
| Sweden | 2.29 | Japan | 3.03 | Luxembourg | 2.34 | Italy | 2.74 |
| Italy | 2.25 | Italy | 2.88 | Italy | 2.20 | Japan | 2.39 |
| Canada | 2.14 | Indonesia | 2.36 | Canada | 1.96 | Indonesia | 2.34 |
| Denmark | 1.93 | Britain | 1.91 | Denmark | 1.88 | Switzerland | 1.74 |
| Switzerland | 1.59 | Switzerland | 1.85 | Belgium | 1.72 | Britain | 1.74 |
| Belgium | 1.54 | India | 1.85 | Switzerland | 1.68 | India | 1.46 |
| Spain | 1.07 | Brazil | 1.25 | Spain | 1.06 | Brazil | 1.13 |
| India | 0.69 | Denmark | 1.21 | India | 0.74 | Denmark | 1.09 |
| Norway | 0.65 | Austria | 0.99 | Norway | 0.68 | Austria | 0.97 |
| Austria | 0.61 | Norway | 0.83 | Austria | 0.62 | Norway | 0.86 |
4.2 Mutual Dependence
Next, the bilateral digital value-added trade is used to reflect the specialization dependence of economies in the DVC, as expressed in the following formula:
BDDVAmi is forward digital dependence. SDDVAmi is the share of digital value-added of China’s export to economy i within the economy in the digital value-added within economies as China’s export destination; SDDVAim is the share of digital value-added of export from economy i to China within the economy in the digital value-added within economies as export destinations of economy i. BDDVAmi > 1 means China has a higher forward digital dependence on country i and its digital value-added export has a higher dependence on the market of economy i; BDDVAmi < 1 shows the digital value-added export of economy i depends more on Chinese market. Similarly, backward digital dependence is expressed as:
Table 7 exhibits the two-way digital dependence of Chinese services in 2000 and 2014. The result on forward digital dependence shows that in 2000, SDDVAmi of Chinese services with developed economies was mostly higher than SDDVAim; the share of Chinese services in the digital value-added export of developed economies was low; the digital value-added export of Chinese services strongly depended on the European and U.S. market. Since China’s accession into WTO, the development environment for digital trade in services was continuously optimized in the country and local support policies for trade in services were constantly stepped up, greatly spurring the high-quality development of Chinese digital trade in services. Meanwhile, as digital trade platforms in services became increasingly more influential and services were gradually opened up to the outside at a high level on multiple levels and in extensive sectors, Chinese market gradually became the main target of competition among economies globally and its forward digital dependence changed accordingly. Compared with 2000, in 2014, the proportion of Chinese services in the digital value-added export of developed economies was noticeably increased, with SDDVAim dramatically elevated in general and the forward digital dependence BDDVAim considerably reduced. Though the digital value-added export of Chinese services still depended on the European and U.S. market, its dependence BDDVAmi dropped by a large margin.
Two-Way Digital Dependence between Chinese Services and Representative Economies (%)
| Type of dependence | Economy | 2000 | Economy | 2014 | ||||
|---|---|---|---|---|---|---|---|---|
| SDDVAmi | SDDVAim | BDDVAmi | SDDVAmi | SDDVAim | BDDVAmi | |||
| Forward digital dependence | United States | 17.01 | 0.41 | 41.25 | Sweden | 7.19 | 2.30 | 3.12 |
| Japan | 14.46 | 0.71 | 20.40 | Germany | 9.40 | 3.08 | 3.06 | |
| Spain | 1.07 | 0.09 | 12.13 | United States | 20.21 | 7.17 | 2.82 | |
| Britain | 6.28 | 0.57 | 10.96 | Netherlands | 10.58 | 4.00 | 2.65 | |
| Germany | 15.32 | 1.57 | 9.75 | Switzerland | 1.85 | 0.87 | 2.13 | |
| Italy | 2.25 | 0.26 | 8.67 | France | 8.84 | 4.47 | 1.98 | |
| Luxembourg | 2.30 | 0.28 | 8.20 | Japan | 3.03 | 1.54 | 1.97 | |
| Switzerland | 1.59 | 0.28 | 5.64 | Canada | 3.09 | 1.69 | 1.83 | |
| Netherlands | 5.57 | 1.28 | 4.36 | Italy | 2.88 | 1.94 | 1.48 | |
| Canada | 2.14 | 0.59 | 3.64 | Belgium | 4.16 | 3.51 | 1.19 | |
| Backward digital dependence | United States | 18.10 | 0.50 | 36.20 | Sweden | 7.34 | 1.63 | 4.51 |
| Luxembourg | 2.34 | 0.10 | 22.99 | United States | 20.70 | 6.32 | 3.27 | |
| Spain | 1.06 | 0.07 | 15.71 | Netherlands | 10.80 | 4.17 | 2.59 | |
| Germany | 17.13 | 1.22 | 14.04 | Switzerland | 1.74 | 0.87 | 1.99 | |
| Britain | 5.36 | 0.45 | 12.01 | France | 8.42 | 4.53 | 1.86 | |
| Italy | 2.20 | 0.23 | 9.75 | Germany | 11.45 | 6.17 | 1.85 | |
| Japan | 9.13 | 1.04 | 8.78 | Belgium | 4.23 | 2.82 | 1.50 | |
| Netherlands | 6.58 | 1.03 | 6.39 | Canada | 2.79 | 1.88 | 1.48 | |
| Switzerland | 1.68 | 0.27 | 6.24 | Italy | 2.74 | 2.00 | 1.37 | |
| Sweden | 274 | 0.55 | 4.97 | Britain | 1.74 | 1.68 | 1.03 | |
Note: Only top ten countries ranked by BDDVAmi are shown in Table 7.
Based on the result in backward digital dependence, in 2000, China, where the digital innovation capacity was relatively low and processing trade was just starting, strongly depended on European, U.S. and Japanese market for digital intermediate products, and its proportion in the digital intermediate import of Europe and the United States was minor. In general, China’s backward digital dependence on main great powers in technology and services was high. In 2014, as its trade strength in services was augmented and digital technologies were improved, China depended much less on the digital intermediate import from developed economies and also became the main source of digital intermediate import for most economies. It means most economies depended increasingly more on the digital intermediate products of China to some degree and played a significant role in the DVC.
5 Conclusions and Policy Suggestions
The paper comes to the following conclusions. (1) China’s digital value-added driven by domestic and foreign demand grows rapidly, and the digital value-added of Chinese services driven by domestic demand outweighs that driven by foreign demand in general. Meanwhile, most economies, both developed and developing, mostly engage in digital trade in services with China in the form of simple participation. (2) During the sample period, the forward and backward digital linkage indices of Chinese services have both evolved in a M-shaped trend, and Chinese services are gradually transformed from “digital value input” to “digital value output” in the DVC, but its relative position remains relatively low. (3) The bilateral connections between China and great powers in technology and services such as European countries, the United States and Japan are close; China shows a significant downward trend in its dependence on digital intermediate import from developed countries and also becomes the main source of digital intermediate import for most countries, making a critical “hub” in the DVC.
Based on the conclusions, the paper proposes the following policy suggestions.
First, it’s imperative to seize the opportunity of digital reform to make arranges in the DVC and promote the digital transformation of service outsourcing. On the one hand, efforts need be made to speed up the digital transformation of high-tech enterprises in information technology outsourcing and knowledge process outsourcing, greatly develop new models such as cloud outsourcing and platform-based subcontracting, foster new platforms of digital outsourcing and keep increasing the share of high-tech business and business with high digital value-added. On the other hand, it’s important to actively refer to the experience of developed economies in services and also enhance the absorption and introduction of high-spillover and high-relevance service products and high-end service links. Quality service resources globally should be fully utilized and the late-mover advantage in the digital age be tapped to improve China’s DVC value-adding capacity and help use foreign advanced digital technologies to elevate the level of Chinese backward industries in the DVC.
Second, the effective supply of digital technologies need be strengthened to promote services to further extend in the DVC. With the help of the relatively sound Internet foundation and by giving play to the relative advantage in emerging technologies such as artificial intelligence and cloud computing, we should quicken the pace in developing the new business forms and new models with data as key footstone, and cultivate new competitive edges for extending to the middle and high end of DVC. For instance, it’s necessary to promote pioneering and fundamental research and design, step up support for critical generic technologies including artificial intelligence, industrial Internet and 5G, and accelerate the construction of digital industrial chain, value chain and ecosystem. In the meantime, we need strive to enable the high-quality development of digital trade in services innovatively and develop a virtuous circle featuring efficient market, fierce competition and continuous innovation, so as to contribute to realization of the strategic goals towards a strong digital power and a great power in trade.
Third, by resorting to the Belt and Road, we need to proactively explore new space for digital trade in services and gradually develop a high-level opening-up system that is aligned with internationally prevailing rules. On the one hand, digital infrastructure, smart payment and logistics systems can be promoted based on cross-border e-commerce by relying on pilot free trade zones to reach a new height of digital trade in services. On the other hand, with the help of the connectivity framework involving six corridors, six types of routes, multiple countries and multiple ports, we should proactively promote the digitalization strategies of China and countries along the Belt and Road to match, and keep expanding emerging markets of digital service. Also, it’s suggested to accelerate negotiations on bilateral and multi-lateral digital trade rules in services, actively participate in the making of international rules on digital trade in services, and promote the building of a new international collaboration mechanism centered on fair competition and mutual benefit for win-win results.
References
Chen, T. (2019). Research on Multidimensional Positioning and Integration Path of China’s Manufacturing Industry in the Global Innovation Network. The Journal of Quantitative & Technical Economics (Shuliang Jingji Jishu Jingji Yanjiu) 11, 60−80.Search in Google Scholar
Hummels, D., Ishii, J., & Yi, K. (2001). The Nature and Growth of Vertical Specialization in World Trade. Journal of International Economics 54 (1), 75−96.10.1016/S0022-1996(00)00093-3Search in Google Scholar
Koopman, R., Wang, Z., & Wei, S. (2014). Tracing Value-Added and Double Counting in Gross Exports. American Economic Review 104 (2), 459−494.10.3386/w18579Search in Google Scholar
OECD. (2018). A Proposed Framework for Digital Supply-Use Tables. http://www.oecd.org/officialdocuments/publicdisplaydocumentpdf/?cote=SDD/CSSP/WPNA(2018)3&DocLanguage=EnSearch in Google Scholar
United Nations Conference on Trade and Development (UNCTAD). (2015). International Trade in ICT Services and ICT-enabled Services. UNCTAD Technical Notes on ICT for Development No. 3.Search in Google Scholar
United States International Trade Commission. (2013). Digital Trade in the U.S. and Global Economies, Part 1. USITC Publication No.4415.Search in Google Scholar
United States International Trade Commission. (2014). Digital Trade in the U.S. and Global Economies, Part 2. USITC Publication No.4485.Search in Google Scholar
Wang, L. (2014). The Impact of Integration into Global Value Chains on the Position of Chinese Manufacturing in International Specialization. Statistical Research (Tongji Yanjiu) 5, 17−23.Search in Google Scholar
Wang, T. (2019). Digital Service Trade and Comparative Study on Related Policies. Intertrade (Guoji Maoyi) 9, 81−90.Search in Google Scholar
Wang, Z., Wei, S., Xu, X., & Zhu, K. (2017a). Measures of Participation in Global Value Chains and Global Business Cycles. NBER Working Paper, No. 23222.10.3386/w23222Search in Google Scholar
Wang, Z., Wei, S., Xu, X., & Zhu, K. (2017b). Characterizing Global Value Chains: Production Length and Upstreamness. NBER Working Paper, No. 23261.10.3386/w23261Search in Google Scholar
Wang, Z., Wei, S., & Zhu, K. (2013). Quantifying International Production Sharing at the Bilateral and Sector Levels. NBER Working Paper, No. 19677.10.3386/w19677Search in Google Scholar
Wu, Y. (2019). The Construction and International Comparison of National Digital Competitiveness Index. Statistical Research (Tongji Yanjiu) 11, 14−25.Search in Google Scholar
Xu, J., & Xia, J. (2020). The Development of Digital Trade from the Perspective of Global Value Chain: Strategic Positioning and China’s Path. Reform (Gaige) 5, 58−67.Search in Google Scholar
Xu, X., & Zhang, M. (2020). Research on the Scale Measurement of China’s Digital Economy: Based on the Perspective of International Comparison. China Industrial Economics (Zhongguo Gongye Jingji) 5, 23−41.Search in Google Scholar
Zhang, H., & Zhai, X. (2018). The Characteristics and Enlightenments of China’s Participation in Global Value Chains. The Journal of Quantitative & Technical Economics (Shuliang Jingji Jishu Jingji Yanjiu) 1, 3−22.Search in Google Scholar
© 2021 Published by De Gruyter on behalf of the National Academy of Economic Strategy, Chinese Academy of Social Sciences
This work is licensed under the Creative Commons Attribution 4.0 International License.
Articles in the same Issue
- Frontmatter
- Does China’s Financial System Amplify Risks in the Real Economy?
- Macro Debt Burden and Consumption Expansion: An Analysis Based on Panel Model and Panel Quantile Regression Model
- Measurement and Characteristics of the Integration of China’s Trade in Services into Digital Global Value Chain
- Tax Burden, Institutional Environment and Foreign Direct Investment Flow: From the Perspective of Asymmetric International Tax Competition
- The Promotion of Deep Integration of Modern Service Industry and Advanced Manufacturing Industry
- Driving Factors, Effect Analysis and Countermeasures of the Development of China’s Live Broadcast Platform
- Challenges and Countermeasures for the Sustainable Development of Local Finance under the Impact of COVID-19