Does China’s Financial System Amplify Risks in the Real Economy?
-
Yanyan Jia


Abstract
The smooth operation of the financial system can promote economic growth by absorbing risks, while the risks breaking out in the financial system will drag down economic development through risk spillovers and amplification. On this basis, this paper uses secondary industry indices to build a risk spillover network between the real economy and the financial system, and discusses the risk absorption and amplification role of the financial system in China’s economy and finance from the perspective of industry. First, on the whole, the source of risks in China’s economic and financial system lies in the real economy. The financial system plays a role of risk absorption in China’s economic and financial system, demonstrating the professional risk management functions of the financial system. The risk absorption of the financial system is positively correlated with the risks in the real economy, and negatively correlated with the risks in the financial system. Second, from the perspective of the correlation between the financial sub-industry and the real economy, the banking sector has the closest relationship with the real economy and the lowest risk absorption capacity. Third, from the perspective of the internal correlation of the financial system, the internal network correlation of the financial system is asymmetric. Diversified financial industry has stronger risk spillover effect on the banking industry and the insurance industry, while the insurance industry has stronger risk spillover effect on the banking industry. These results are essentially related to the functioning of the financial system, the internal relationship of the financial system and the relationship between the financial system and the real economy.
1 Introduction
In essence, financial system is to serve the real economy. Therefore, it is necessary to combine financial system with real economy in research, with a view to understanding the nature of systemic financial risks and maintaining the steady growth of real economy.
On the one hand, risks in the real economy spill over to the financial system through correlated business. For example, recent real economy risks represented by global economic slowdown resulting from COVID-19 pandemic have significantly impacted the financial markets of all countries and caused volatilities. Especially from March 8 to March 16, 2020, the circuit breaker in the US stock market was triggered for four times within two weeks, a typical case of the outbreak of systemic financial risks.
On the other hand, faced with impacts of the real economy, the financial system, as a unique part, has a double-sided reaction to the spillover of the risks in the real economy. First, the financial system can promote economic growth and mitigate the real economic risks caused by emergency events through raising the efficiency of resource allocation, and can reduce the risks in the real economy with professional risk management capacity. Therefore, the financial system can reduce the risks in the real economy, and this paper defines such a reaction as risk absorption. Second, systemic financial risks break out in the financial system, undermining the system’s financing function and hindering the financing for real economy, and eventually raise the risks in the real economy. This paper defines such a reaction as risk amplification.
So far, various studies have been made on systemic financial risks, but most of them focus on the internal aspect of the financial system (Tang et al., 2017; Tong et al., 2018; Yang and Zhou, 2018), and only a small part of them studied the risk spillover effect of the financial sectors and the real economy. Zhu (2019), Baur (2012) and Chiu et al. (2015) discussed the relationship between the financial system and the real economy from theoretical or empirical perspectives, and found that these two systems are closely related, with synchronized risks and returns. Cotter et al. (2017) studied the spillover effect between the real economy and financial markets of the United States, and found that financial markets are the net exporter of impacts, especially in volatile market environment. He et al. (2018) found that systemic financial risks are transmitted to real economy sectors through the channel of credit and loan, and thus have negative impact on the macro economy. Measuring systemic risks in various sectors based on economy-finance correlated network, Zhu et al. (2018) found that mining, real estate and some other sectors have higher systemic risks than financial sector; and Li et al. (2019) found that the source of systemic risks is real economy sectors.
It can be seen that scholars mainly pay attention to the risk amplification of the financial system, while its risk absorption and reduction mechanism is less noticed. To fill in this gap, this paper discusses the mechanism and dynamism of the risk absorption and risk amplification effects of the financial system on the real economy. In particular, this paper has the following three marginal contributions.
First, based on the influence of the financial system on the real economy, this paper proposes innovative thoughts on the risk absorption of the financial system, and incorporates its risk absorption and risk amplification into one framework to discuss the role of financial system in China’s finance.
Second, this paper describes risks in the financial system and in the real economy at the sectoral level, and accurately demonstrates the mutual influences of sectors on each other. In this paper, the mutual spillover effect of three financial sub-sectors—banking, diversified financing and insurance—is taken as the risks in the financial system, and the mutual spillover effect of 21 real economy sectors as real economy risk proxy variable. From the perspective of financial sub-markets, this paper compares the difference of banking, diversified financing and insurance sectors in their spillover effect on the real economy, and thus deepens its research mechanism.
Third, this paper probes into the forming mechanism and spillover effect of China’s systemic financial risks on the basis of network structure. LASSO-VAR model is used for empirical study. The advantages of this model is: first, it takes the risk spillover within the real economy, the secondary moment of economic variables and the network effects between economic variables into account, and thus enjoys more solid micro foundation; second, it uses LASSO technology to reduce the number of endogenous variables, and thus can effectively estimate the parameters of the high-dimensional variable model to ensure the reliability of the empirical results of this paper.
2 Analysis on the Risk Spillover Effect of the Financial System on the Real Economy
Starting from theoretical studies, this paper elaborates on the mutual spillover effect between the financial system and the real economy. It should be noted that the financial system is still the key subject of this paper, and thus the argumentation in the latter part will be elaborated from the perspective of the financial system.
2.1 Risk Absorption Mechanism of the Financial System for the Real Economy
To be specific, the financial system can mitigate risks in the real economy through risk management, resource allocation and risk sharing.
First, the financial system has the function of diversifying, transferring and managing risks (Merton, 1995). This function is formed by three aspects: one, the financial system manages liquidity risks by smoothing the supply and demand of intertemporal funds (Allen and Santomero, 1998); two, the financial system can share risks by transferring risks between investors (Merton 1989); three, by acquiring and assessing the information of investors, the financial system cuts supervision costs, mitigates moral hazards, ensures the safety of savers’ funds and reduces real economic risks caused by losses in consumer property and fluctuations in consumer demand (Levine, 2004).
Second, the financial system promotes economic development through effective resource allocation based on financing functions, and thus indirectly mitigates real economic risks. The financial system has the function of resource allocation (Merton, 1995), and this function is used for allocating resources among different economic entities, different regions and different periods with high efficiency, which improves the efficiency of fund use and facilitates product sales, consumption scale and steady economic development (Zhang and Zhu, 2014). From this perspective, the financial system directly promotes economic growth and indirectly mitigates risks in the real economy through the resource allocation function.
Third, in normal periods, with small external impacts, the internal correlation within the financial system can diversify the risks and thus mitigate the risk spillover from the real economy. In theory, correlation among financial institutions includes direct creditor-debtor relationship and indirect holding of common assets. Highly correlated financial network can ensure that financial institutions complement each other’s liquidity to mitigate the pressure of insufficient liquidity and mitigate risks in the financial system. Moreover, in normal periods, impacts of the real economy are small and follow a “thin-tail” distribution. Thus, financial institutions can share risks with each other through inter-bank lending and repo market, so that impacts of the real economy on the financial system are mitigated (Elliott et al., 2014; Acemoglu et al., 2015; Cabrales et al., 2017). Therefore, when external impacts are small, the highly correlated network among financial systems can effectively absorb and resolve risks in the real economy.
2.2 Risk Amplification Mechanism of the Financial System for the Real Economy
To be specific, risks in financial system can spill over to the real economy through business linkage, inter-institutional infection, negative externalities and financial accelerators.
First, risks in the financial system directly spill over to the real economy through business linkage. In this paper, banking industry is taken as an example. External impacts trigger withdrawal requests from a large number of depositors, resulting in a sharp drop of banks’ lending funds, and thus corporate financing restraints will be tightened, investment will be hindered and the development of real economy will slow down. In addition, with a negative impact, the amplification effect of high leverage ratio will cause heavy losses to financial institution, and they are forced to undersell assets. Sell-off of assets further drags down the prices of assets, leading to sharp drop in the financing capacity of related entities and aggravating risks in the real economy. Therefore, risks in the financial system spill over to the real economy through lending business.
Second, risk spillover from the financial system to the real economy is amplified by internal correlation. The internal correlation of the financial system includes two types. On the one hand, financial institutions are directly correlated through borrowing and lending in the wholesale capital market (Shin and Shin, 2011). On the other hand, financial institutions often choose to hold similar asset portfolios, which lead to an increase in indirect correlation of holding common assets. In summary, due to excessive correlation, negative impacts spread within the financial system, causing heavier damage and larger influencing scope and amplifying the possibility and magnitude of infection.
Third, risks in the financial system will have serious externalities to the real economy. Once the financial system is negatively impacted, a large number of financial institutions will collapse, and the basic function of the financial system—capital allocation—will be affected. The failure of financial institutions in providing the real economy with sufficient fund will cause huge damage to the real economy (Laeven and Valencia, 2018).
Fourth, the impact of the financial system on the real economy is amplified through financial accelerator mechanism. Financial accelerator model is proposed by Bernanke et al. (1999), demonstrating the risk spillover from the financial system to the real economy from the perspective of the interaction between these two sides. This mechanism comprises credit demand and credit supply. From the perspective of credit demand, faced with negative impact, the real economy will witness large-scale asset depreciation, resulting in higher probability of corporate loans default. High bad debt ratio forces the financial system to curb credit scale, which poses larger difficulties to the operation of real economic entities. From the perspective of credit supply, faced with negative impact, the profitability of the financial system will decline. Depositors will run on the financial system to make sure that their funds are safe, and the asset scale of the financial system is thus compressed. As a result, the financial system will increase the financing cost of the real economy, and thus the investment and output will drop in the real economy.
Figure 1 shows the transmission mechanism of risk absorption and risk amplification effects of the financial system on the real economy.
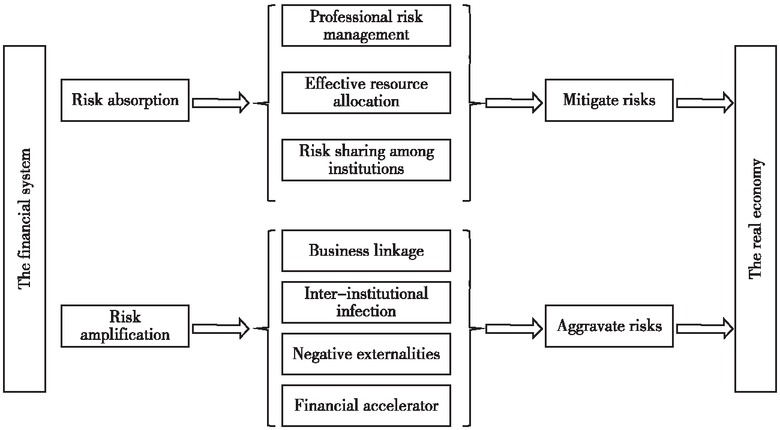
The Transmission Mechanism of Risk Absorption and Risk Amplification Effects of the Financial System on the Real Economy
3 Research Method and Data Description
This part first elaborates the description of related indicators, and then uses the LASSO-VAR model to construct a correlation network between the financial system and the real economy. The LASSO method can reduce the number of endogenous variables, and thus it not only can estimate high-dimensional variable models, but also can more effectively estimate the parameters of VAR model. Finally, the selected data and sources are introduced in this part.
3.1 LASSO-VAR Model
This paper constructs VAR model to conduct quantitative study on the correlation between China’s financial system and real economy. To be specific, the N-ary VAR model of order P can be described as:
In this formula, Y t is composed of three financial sub-sectors—banking, diversified financing and insurance—and 21 sectors in the real economy, namely 24 variables in total. v refers to 24×1 dimensional intercept vector; Φi refers to 24×24 dimensional coefficient matrix; p refers to lag order; and εt refers to 24×24 dimensional independent and identically distributed disturbance.
LASSO is a least squares method that imposes a penalty term on the regression parameters, which can estimate the parameters and select variables at the same time (Messner and Pinson, 2019). According to Nicholson et al. (2017), the estimated expression of the LASSO-VAR model is as follows:
Among them, || A ||F is the Frobenius norm of Matrix A, which is the sum of the squared absolute value of the elements of Matrix A. λi refers to the penalty parameter, which is estimated by sequential cross-validation. || Φi || 1 refers to penalty term l1, which is the sum of the absolute values of all the elements in the vector. By assigning the least significant element to 0, it can reduce the number of intercept coefficients.
3.2 The Construction of Spillover Index
Following the idea in Diebold and Yilmaz (2012), this paper uses generalized variance decomposition to construct the spillover index. In the generalized variance decomposition of the advance H-step prediction, the contribution degree of the j-th variable to the i-th variable is expressed as follows:
Among them, Σ refers to the variance matrix of error ε; σj, j refers to the standard deviation of the error in the j-th equation; the value of the i-th term in vector ei is 1, and the values of other terms are 0. As the contribution of all endogenous variables in generalized variance decomposition does not add up to 1, or in other words,
Therefore,
To facilitate this construction, this paper takes the data of sectors in the real economy as the first N-3 endogenous variables, the banking industry as the endogenous variable N-2, and the insurance industry as the endogenous variable N.
3.2.1 The Risk Spillover Effect of the Financial System on the Real Economy
The risk spillover effect of the financial system on the real economy is constructed on the basis of the risk spillover effect between the banking sector, diversified financing sector and insurance sector and the sectors in the real economy. The risk spillover effect of all the sub-sectors in the financial system on the real economy can be expressed as formula (6) to formula (8).
Among them, formula (6) expresses the risk spillover effect of banking sector on the real economy; formula (7) expresses the risk spillover effect of diversified financing sector on the real economy; and formula (8) expresses the risk spillover effect of insurance sector on the real economy.
The risk spillover effect of the financial system on the real economy is the arithmetic mean of the risk spillover effect of banking sector, diversified financing sector and insurance sector respectively on the real economy. It can be expressed as formula (9).
3.2.2 Risk Spillover Effect of the Real Economy on the Financial System
Risk spillover effect of the real economy on all the sub-sectors in the financial system can be expressed as formula (10) to formula (12).
Among them, formula (10) expresses the risk spillover effect of real economy on the banking sector; formula (11) expresses the risk spillover effect of real economy on the diversified financing sector; and formula (12) expresses the risk spillover effect of real economy on the insurance sector.
The risk spillover effect of the real economy on the financial system is the arithmetic mean of the risk spillover effect of the real economy on banking sector, diversified financing sector and insurance sector respectively. It can be expressed as formula (13).
3.2.3 The Mutual Risk Spillover Effect between Each Pair of Sectors
The mutual spillover effect between each pair of sectors within the financial system can be expressed by Pairspill, and those between other pairs of sectors can be deduced on this basis. To be specific, the risk spillover effect of the i-th sector on the j-th sector can be expressed as:
3.2.4 The Indicator of the Risk Absorption Rate of the Financial System
Risk absorption rate of the financial system is the ratio of the net risk spillover effect of the financial system to the real economy to the risk spillover effect of the financial system on the real economy. Here, the risk absorption rate of sector i can be expressed as:
In this formula, sector i includes banking sector, diversified financing sector, insurance sector and the financial system. When Absorptioni > 0, sector i absorbs risks. The higher the value of Absorptioni, the stronger the absorption effect of sector i. When Absorptioni < 0, sector amplifies risks. The higher the value of Absorptioni, the stronger the amplification effect of sector i.
3.3 The Construction of Sectoral Risk Variables
To distinguish the specific risks of different sectors, this paper uses the rolling regression method in the calculation process to remove market returns and common influencing factors. The construction of sectoral risk variables is divided into three steps.
The first step is to calculate the profitability of each sector. The formula for calculating the logarithmic return rate of sector i is as follows:
In this formula, Pi,t and Pi,t-1 refer to the closing price of sector i in periods t and t-1.
The second step is to remove the market returns rate by using rolling regression, and to take the residual as the returns rate of each sector.
In this formula, ri,t refers to the returns rate of sector i, and rm,t refers to the returns rate of Shanghai Composite Index. Residual εi,t is taken in this paper as the returns rate of each sector after removing market returns rate, and is used to calculate sectoral risks.
The third step is to use the univariate GARCH (1,1) model to calculate risk variables of each sector.
Based on Fang et al. (2019), this paper adopts a general autoregressive conditional heteroscedasticity (GARCH) volatility model, and uses dynamic volatility rate to characterize risk variables of each sector. From this, it can be seen that sectoral risks mentioned in this paper refer to specific volatility rates of each sector, rather than the risks with common source in the real economy.
3.4 Data Description
Based on the availability of data, this paper selects the Wind secondary industries classification index to examine the risk spillover effect of the financial system and the real economy on each other, and conducts robustness analysis on the basis of financial data. The advantage of secondary industries classification index lies in its consideration on the heterogeneity between the sub-sectors. On the one hand, this paper uses secondary industries index, rather than primary industries index, because the finer the industries classification, the richer the information contained. Moreover, on March 1, 2007, Wind adjusted its primary industries classification index, separating the real estate sector from the financial industry. Therefore, using primary industries index will result in incomparability between data before and after March 2007. On the other hand, this paper uses secondary industries index rather than tertiary industries index, because it needs to strike a balance between information and data quantity. To be specific, Wind secondary industries classification index includes 24 sectors, three of which are sectors of the financial industry, namely banking, diversified financing and insurance, and 21 sectors in the real economy. Finally, this paper takes Shanghai Composite Index as market returns rate. The sample interval selected in this paper is from January 1, 2000 to August 31, 2019, and the data frequency is weekly. Data sources include Wind database, CSMAR database and the National Bureau of Statistics.
4 Analysis on Empirical Results
This part first analyzes the spillover relationship between the financial system and the real economy from four perspectives, and then conducts robustness analysis from multiple perspectives.
4.1 Static Risk Spillover Effect of the Financial System and the Real Economy on Each Other
Table 1 demonstrates the mutual risk spillover between the financial system and the real economy. First, the financial system mainly absorbs risks in the real economy. In particular, the risk spillover effect of the financial system on the real economy is 42.17%, smaller than the spillover effect of the real economy on the financial system, which is 55.79%. In the overall sample interval, the real economy was the major source of risks, and the financial system absorbs risks in the real economy through resource allocation, risk management and inter-institutional risk sharing.
Mutual Risk Spillover between the Financial System and the Real Economy Unit: %
 |
Note: “→” means the risk spillover from the former sector to the latter sector; and “←” means the risk spillover from the latter sector to the former sector. The shady part shows the risk spillover effect within the financial system.
In addition, it can be seen from the spillover between financial sub-sectors and the real economy that the banking sector has the closest relationship with the real economy, but its risk absorption capacity is the poorest. Whether for the spillover from the real economy or to the real economy, the banking sector has the closest relationship with the real economy. This matches with China’s financing structure: the main source of financing for China’s real economy is the banking sector (Han and Han, 2017). The risk absorption capacity of the diversified financing sector is the strongest, that of the insurance sector comes the second, and that of the banking sector is the poorest. The reason may be that with the closest relationship with the real economy, the banking sector suffers the most from the risk spillover from the real economy. Higher risk spillover undermines the risk absorption capacity of the banking sector.
Finally, within the financial industry, diversified financing sector has the strongest risk spillover, while that of the banking sector is the weakest; and the correlation between the banking sector and the insurance sector is the closest. In particular, the shady part in Table 1 demonstrates the risk spillover among all the sub-sectors within the financial system. One, the risk spillover from diversified financing sector to the banking sector and the insurance sector is 2.65% and 3.26% respectively, higher than the spillover from the banking sector to the diversified financing sector (2.09%) and the spillover from the insurance sector to the diversified financing sector (2.87%). This indicates that the diversified financing sector has stronger risk spillover to the banking sector and the insurance sector than the reverse direction of spillover. Two, the risk spillover from the insurance sector to the banking sector is 3.73%, slightly higher than the risk spillover from the banking sector to the insurance sector (3.58%). This indicates that compared with the risk spillover from the banking sector to the insurance sector, that of the reverse direction is slightly stronger. Three, if the mutual risk spillover of these three sectors are compared, it can be seen that the risk spillover between the banking sector and the insurance sector is stronger than that between the diversified financing sector and the other two sectors respectively. This conclusion indicates that compared with the diversified financing sector, the banking sector and the insurance sector have closer relationship.
4.2 Periodical Features of the Overall Risk Spillover in China’s Economic and Financial System
This paper uses a rolling method to dynamically examine the time-order features of China’s financial and economic system. The rolling sample period in this paper is 96 weeks (about two years), and the prediction period is four weeks (about one month). To reduce the impact of noise, the following results are obtained by taking the monthly average of weekly data and converting them into monthly data.
Figure 2 shows that the overall risks in China’s financial and economic system has periodic characteristics. With the setting that “low point—increase—high point—decrease—low point” forms a complete period, we can divide the overall risks in China’s financial and economic system into four periods. The relevant statistical results are shown in Table 2.
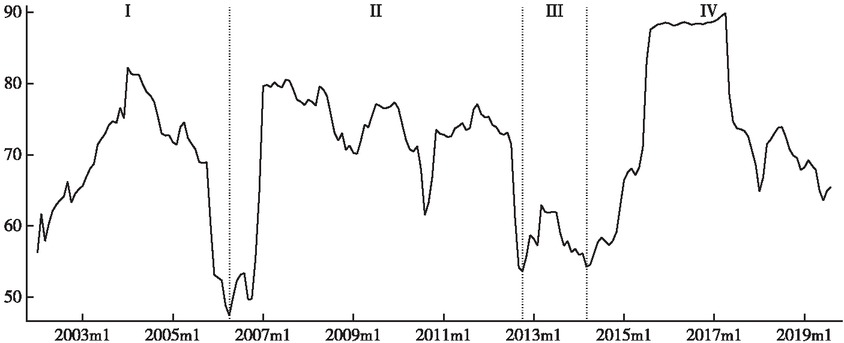
The Time-Order Features of Overall Risk Spillover in China’s Economic and Financial System
Periodical Statistical Features of Overall Risks in China’s Economic and Financial System
| Period | Time | Average (%) | Volatility (%) | Major events |
|---|---|---|---|---|
| I | 2002.01—2006.04 | 68.69 | 8.59 | Early development of the financial industry |
| II | 2006.05—2012.10 | 71.77 | 8.13 | Global financial crisis and euro debt crisis |
| III | 2012.11—2014.03 | 58.49 | 2.70 | “Liquidity shortage” of China’s banking sector |
| IV | 2014.04—2019.08 | 75.88 | 10.23 | Crisis in China’s stock market and China-US trade friction |
From Figure 2 and Table 2, it can be seen that risks in China’s economic and financial system were the highest in Period IV and the lowest in Period III; and that risks were higher in Period II than in Period I. In Period I, overall risk in China’s economic and financial system featured rapid fluctuation, and peaked in February 2004. This period witnessed the early development of China’s financial industry, with frequent non-standard behaviors and financial regulatory actions. Therefore, uncertainties and volatilities were both high. In February, the State Council released nine opinions on the development of capital market, which was conducive to the sound and steady development of the financial system. After that, the overall risks in the economic and financial system were gradually mitigated. In Period II, the overall risks in China’s economic and financial system kept at a high level. This period covered global financial crisis and euro debt crisis. Also impacted by this external event, China witnessed high level of risks. In Period III, the overall risks in China’s economic and financial system were at a low level. But it should be noted that a small peak occurred in June 2013. At that time, “liquidity shortage” happened to China’s banking sector. This event had a heavy impact on the financial system, but as the liquidity shortage was a short-term issue rather than liquidity fracture, it had less impact on the real economy. The overall risks in the economic and financial system were low. In Period IV, the overall risks in China’s economic and financial system fluctuated rapidly again, and reached the historical highest point from September 2015 to April 2017. The “abnormal fluctuations” in the stock market in September 2015 and the China-US trade frictions started in April 2017 have posed high uncertainties to China’s economic development, and thus the risk spillover between the financial system and the real economy aggravated. Risks in the economic and financial system were high. In addition, compared with the “abnormal fluctuation” in China’s stock market, China-US trade frictions had smaller impact on the overall risks in China’s economic and financial system.
4.3 Comparison between the Risk Spillover within the Financial System and the Real Economy
This part studies the risk spillover within the financial system and the real economy. Hereinafter, the risk spillover among all sub-sectors within the financial system will be called financial system risks, and that among all sub-sectors within the real economy will be called real economic risks.
To accurately analyze financial system risks and real economic risks, this paper excludes the spillover effect of each sector on itself when calculating the risk spillover level. Meanwhile, this paper measures the risks of these two systems with the average spillover excluding the differences in the number of sectors, in order to precisely compare financial system risks and risk economic risks. Table 3 shows the average of financial system risks and real economic risks in different periods. Figure 3 shows the time-order features of financial system risks and real economic risks. The following conclusions can be drawn from Table 3 and Figure 3.
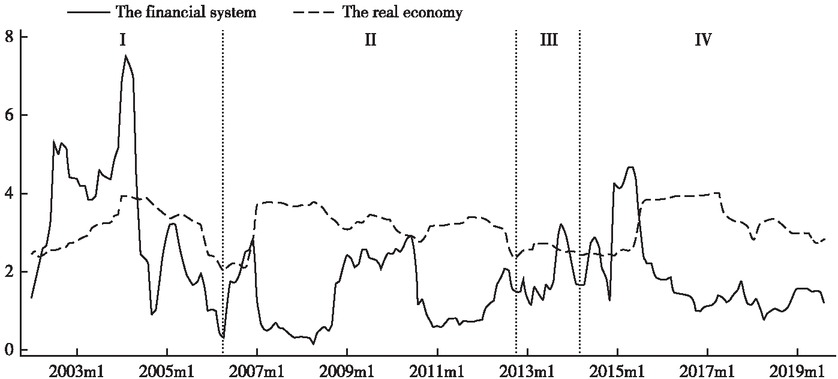
The Time-Order Features of Financial System Risks and Real Economic Risks
Note: The solid line (dotted line) represents the average risk spillover level of all sectors within the financial system (real economy).
The Average of Financial System Risks and Real Economic Risks in Different Periods Unit: %
| Period I | Period II | Period III | Period IV | |
|---|---|---|---|---|
| The financial system | 3.28 | 1.38 | 1.90 | 1.83 |
| The real economy | 3.11 | 3.20 | 2.59 | 3.24 |
| Difference between real economic financial risks system risks and | 0.17 | −1.82 | −0.69 | −1.41 |
Note: “Difference between financial system risks and real economic risks is obtained through the former minus the latter. It represents the gap between financial system risks and real economic risks.
First, the real economy is the major source of risks in China’s economic and financial system. Real economic risks reached the highest level in Period IV, followed by Period II and Period I, and the risk level in Period III was the lowest. Comparing Figure 2 and Figure 3, we can see that the trend of real economic risks is almost the same as that of China’s economic and financial system risks. This indicates that real economic risks are the major driving force of China’s economic and financial system risks. Financial system risks reached the highest level in Period I, followed by Period III and Period IV with the former slightly higher than the latter, and the risk level in Period II was the lowest. From this, it can be seen that financial system risks and risks in China’s economic and financial system have differences in time-order features. In Period IV, when risks in China’s economic and financial system reached the highest level, financial system risks merely ranked three among all the four periods. In Period III, when risks in China’s economic and financial system were lowest, financial system risks ranked second highest among all the four periods.
Second, generally speaking, real economic risks are higher than financial system risks. In particular, In Period I, financial system risks were higher than real economic risks. Apart from this period, real economic risks were higher than financial system risks in all other periods. In addition, the gap between financial system risks and real economic risks was the largest in Period II, followed by Period IV and Period III, and the lowest in Period I. This means that the extent to which financial risks higher than real economic risks in Period I was much lower than the extent to which real economic risks higher than financial system risks in other periods. This conclusion indicates again that real economic risks are the major contributor to risks in China’s financial and economic system.
4.4 Dynamic Risk Spillover of the Financial System and the Real Economy
This part studies the dynamic risk spillover between the financial system and the real economy and the role of the financial system in China’s economic and financial system in different periods.
First, in the four periods, the financial system mainly played the role of risk absorption, but at some specific times, it amplified risks. In Period I, the financial system mainly absorbed the risks, with its risk absorption effect first gradually strengthened and then gradually weakened. But in February to March 2002, October 2002 to April 2003, the financial system amplified risks. In Period II, the financial system mainly absorbed risks, and its risk absorption effect was first strengthened, then weakened, then strengthened again, and then weakened again, forming an “M” shape. But in April to December 2006, March to June 2010, the financial system amplified risks. In Period III, the financial system absorbed all the risk, but its absorption effect was weak. In Period IV, at the earlier stage, the financial system amplified risks; while in the later stage, it absorbed risks, and the risk absorption effect was gradually strengthened. In particular, in December 2014 to June 2015, November 2015 to March 2016, the financial system amplified risks. And at other times, the financial system absorbed risks.
Second, the strength of risk absorption of the financial system is relevant to the risk level of economic and financial system. The comparison of Period I, Period II and Period III shows that the risk absorption of the financial system was the strongest in Period II, followed by the later part of Period I, and the weakest in Period III. The reason is that in Period III, the overall risk level was low, and the risk spillover from the real economy to the financial system was weak. Therefore, the volume of risks that needed to be absorbed by the financial system was small. But in the later part of Period I and Period II, the overall risk level was higher, and the risk spillover from the real economy to the financial system was strong. Therefore, the volume of risks that needed to be absorbed by the financial system was larger. It should be noted that in the earlier part of Period IV, risks in the financial system were at a high level, while those in the real economy were at a lower level. At that time, the financial system amplified risks in the real economy.
This result can be proven by Table 4. In the former three periods, when the financial system absorbed risks, the absorption rate was positively correlated with risk level of China’s economic and financial system. The correlation coefficient between the two was 0.763 in Period II, followed by 0.603 in Period I and 0.078 in Period III. This shows that the intensity of the risk absorption rate of the financial system was positively correlated with risks in China’s economic and financial system. In Period IV, the risk absorption rate of the financial system was negatively correlated with risks in China’s economic and financial system. The main reason is that in the earlier part of Period IV, abnormal fluctuation of the stock market in 2015 led to risk spillover, and thus the financial system amplified risks.
Correlation Coefficient between Risk Absorption Rate of the Financial System and Real Economic Risks
| Period I | Period II | Period III | Period IV | All samples | |
|---|---|---|---|---|---|
| Financial system risks | −0.251 | −0.891 | −0.074 | −0.655 | −0.591 |
| Real economic risks | 0.753 | 0.850 | 0.140 | −0.049 | 0.445 |
| Economic and risks financial system | 0.603 | 0.763 | 0.078 | −0.159 | 0.349 |
Note: The table shows the Spearman rank correlation coefficient of economic and financial system risks and the risk absorption rate of the financial system.
Third, risk absorption of the financial system is positively correlated with risk level of the real economy, and negatively correlated with risk level of the financial system. It can be seen from Table 4 that risk absorption rate of the financial system is negatively correlated with risk level of the financial system. Except for Period IV, risk absorption of the financial system was positively correlated with risk level of the real economy. Observing the former three periods, in which the financial system absorbed risks, we can see that the absolute values of the correlation coefficient between the financial system risk absorption rate and the real economic risk as well as financial system risk was the highest in Period II, followed by Period I and Period III. This is consistent with the aforementioned conclusions. It indicates that the intensity of risk absorption of the financial system is not only correlated with economic and financial system risks, but also correlated with the risks in the financial system and the real economy respectively. The reason is easy to find: risks in the economic and financial system are the superposition of risks in the financial system and in the real economy. It should be noted that as the intensity of the risk amplification of the financial system was strong in the earlier part of Period IV, risk absorption and risk amplification in this period were balanced.
Fourth, when the risk of the financial system is higher than (lower than) the risk of the real economy, greater gaps would mean stronger risk amplification (absorption) effect of the financial system. In particular, when the risk of the financial system is higher than the risk of the real economy, the larger the gap, the stronger the risk amplification effect of the financial system. For instance, based on Figure 3 and Figure 4, before June 2004 and on the eve of “abnormal fluctuation” in the stock market in 2015, risks in the financial system were much higher than the risks in the real economy, and the risk amplification of the real economy was strong. When the risk of the real economy is higher than the risk of the financial system, the larger the gap, the stronger the risk absorption effect of the financial system. For instance, based on Table 3, Figure 3 and Figure 4, in Period II, the gap between the risk of the real economy and the risk of the financial system was the largest, and in this period, the risk absorption effect of the financial system was the strongest. In addition, during the global financial crisis, euro debt crisis, “liquidity shortage” of China’s banking sector and China-US trade frictions, the gap between the risk of the real economy and the risk of the financial system was relatively larger, and the risk absorption of the financial system was stronger. The possible reason for these results is that when risks in financial system are higher, the risk spillover from the financial system to the real economy is stronger, and thus the risk absorption rate of the financial system is low, and the risk amplification of the financial system is strong. On the contrary, when risks in real economy are higher, the risk spillover from the real economy to the financial system is stronger, and thus the risk absorption rate of the financial system is high, and the risk absorption of the financial system is strong.
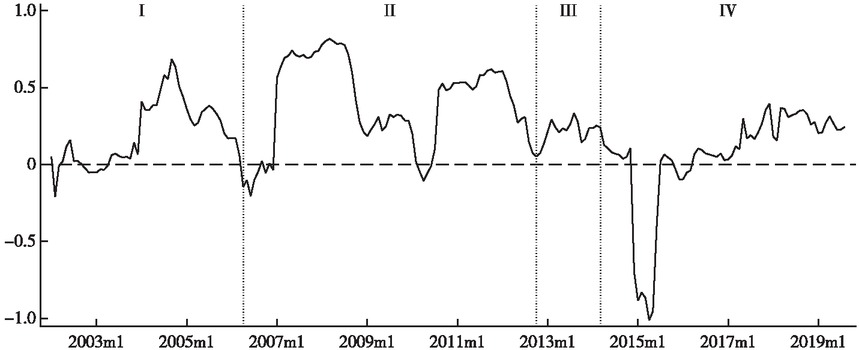
The Time-Order Features of the Risk Absorption Rate of the Financial System to the Real Economy
Note: The dotted line represents that risk absorption rate is 0.
4.5 Dynamic Risk Spillover of the Financial Sub-Sectors and the Real Economy
To find which financial sub-sector contributes to the risk amplification and risk absorption of the financial system to the real economy, this part studies the risk spillover between financial sub-sectors and the real economy. Table 5 shows the average risk absorption rate of financial sub-sectors in all periods. Figure 5 shows the time-order features of risk absorption rate of financial sub-sectors.
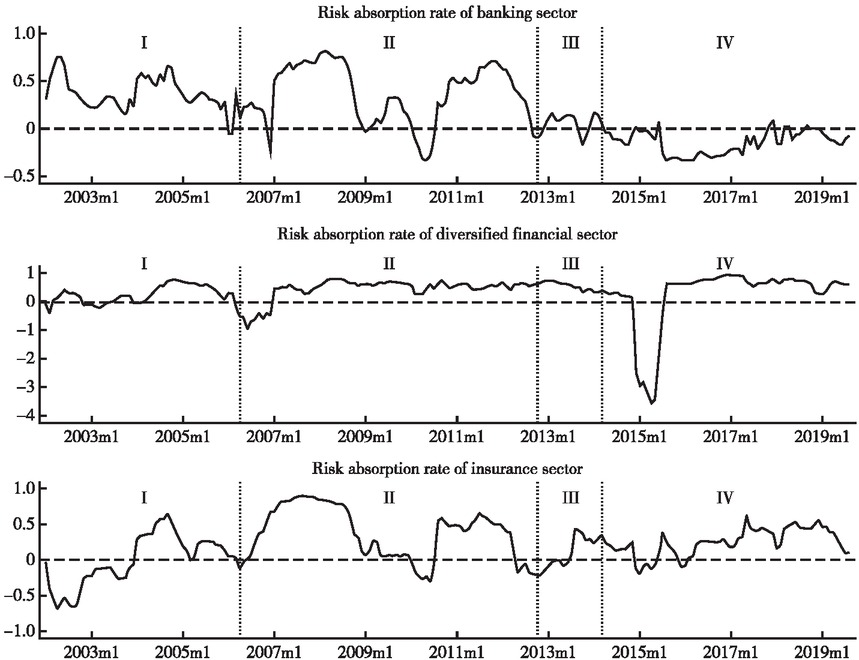
The Time-Order Features of the Risk Absorption Rate of Financial Sub-Sectors
Note: The upper part represents the risk absorption rate of the banking sector to the real economic risks, the middle part represents that of the diversified financing sector, and the lower part represents that of the insurance sector. The dotted line means risk absorption rate equals zero.
The Average of Risk Absorption Rate of Financial Sub-Sectors Unit: %
| Period I | Period II | Period III | Period IV | |
|---|---|---|---|---|
| Banking | 0.371 | 0.371 | 0.067 | −0.140 |
| Diversified financing | 0.266 | 0.474 | 0.573 | 0.261 |
| Insurance | 0.000 | 0.384 | 0.130 | 0.254 |
First, risk spillover of financial sub-sectors in different periods showed heterogeneity. The risk absorption of the banking sector showed similar intensity in the former two periods, and the intensity in Period III was the weakest. The possible reason is that the “liquidity shortage” in Period III mainly happened to the banking sector, and with the heaviest impact, the functions of banking sector were most severely undermined. The risk absorption of the diversified financing sector was gradually strengthened from Period I to Period III, and was weakened to the lowest level in Period IV. This shows that the “abnormal fluctuation” in China’s stock market in Period IV had the heaviest impact on the diversified financing sector, and thus undermined its function. The risk absorption of the insurance sector was the strongest in Period II, followed by Period IV and Period III, and was the weakest in Period I. The possible reason is that in Period I, the insurance sector was boosting. In 2006, the national premium income reached RMB 564.1 billion, 1.8 times that of 2002. The incomplete development of the insurance sector affected its risk management function.
Second, comparing the risk absorption and risk amplification of financial sub-sectors in different periods shows the following findings. From the static results in Table 5, it can be seen that generally speaking, the diversified financing sector has the strongest risk absorption function, followed by the insurance sector, and the banking sector has the weakest. This is consistent with the results in Table 1. In particular, the banking sector had the strongest risk absorption in Period I, and in Period IV it had risk amplification effect. The diversified financing sector had strong risk absorption in Period II, Period III and Period IV, with risk absorption rate of 0.474%, 0.673% and 0.261% respectively. The insurance sector had the weakest risk absorption in Period I, and in other periods, its risk absorption was weaker than the diversified financing sector, but stronger than the banking sector. The possible reason is that in Period I, the development of the banking sector was more mature, while that of the insurance sector was incomplete. Therefore, the risk absorption of the banking sector was the strongest, and that of the insurance sector was the weakest. In other periods, the diversified financing sector and the insurance sector had matured. The emergence of diversified financial products enabled investors avoid risks through financial speculation and hedging. The risk management of this sector effectively mitigated real economic risks.
From the dynamic results in Table 5, it can be seen that both the risk absorption and the risk amplification of the financial system are closely related to the three financial sub-sectors. But in different periods, the dominant sub-sectors are different. In Period I, the trend of the risk absorption of the financial system was similar to that of the insurance sector, which indicates that in this period, the risk absorption of the financial system was dependent on the insurance sector. During the global financial crisis and euro debt crisis, the banking sector and the insurance sector both had two long peaks, which was consistent with the trend of the risk absorption rate of the financial system. This indicates that in this period, the risk absorption of the financial system was dependent on the banking sector and the insurance sector. During the “liquidity shortage” of China’s banking sector, the trend of the risk absorption rate of the financial system was similar to that of the banking sector, which indicates that the banking sector had a heavy influence on the risk absorption of the financial system. During the “abnormal fluctuation” of China’s stock market, the risk absorption rate of the diversified financing sector reached its minimum, and its risk amplification effect was obvious. This indicates that the risk amplification effect of the financial system is dominated by the diversified financing sector. The possible reason is that this sector covers investment banks, brokerage and diversified capital market, which are the most closely related to the stock market.
4.6 Robustness Test
[1]This paper uses four methods for robustness analysis. First, it uses correlation coefficient method, which is more intuitive, to replace Diebold-Yilmaz model to measure risk correlation. Second, it uses the financial data of the real economy to calculate the real return on capital investment of all sectors, in order to examine the correlation among the return rates of sectors in the real economy and to demonstrate the rationality of data in this paper. Third, it takes financial sub-sectors as examples to further discuss whether the risk absorption effect of the financial system will increase its own risks. In most periods, the risk absorption of the financial system increased its own risks, and risk spillover reduced its own risks. Fourth, it uses the financial data of banks to verify the risk absorption mechanism of the financial system for the real economy. This paper finds that the higher the risk level of banks, the lower the risk absorption rate of banking sector to the real economy. The empirical research results of this paper are an intuitive reflection of theoretical mechanism rather than a logical mapping of the selected data.
5 Conclusions and Policy Implications
This paper draws the following five conclusions. First, generally speaking, the source of risks in China’s economic and financial system is the real economy, while the financial system mainly plays the role of risk absorption. However, when extreme events, such as financial crises occur, the risk amplification effect of the financial system is significantly strengthened. Second, the intensity of the risk absorption of the financial system is correlated with the risk level of the economic and financial system. The risk absorption effect of the financial system is positively correlated with real economic risks and negatively correlated with financial system risks. Third, when the risk of the financial system is higher than the risk of the real economy, the larger the gap, the stronger the risk amplification effect of the financial system. On the contrary, when the risk of the financial system is lower than the risk of the real economy, the larger the gap, the stronger the risk absorption effect of the financial system. Fourth, in terms of the risk spillover between financial sub-sectors and the real economy, the diversified financing sector has the strongest risk absorption effect, followed by the insurance sector, and the banking industry has the weakest. Compared with the diversified financing sector and the insurance sector, the risk spillover between the banking sector and the real economy is the strongest. But in most periods, its risk absorption effect on the real economy is the weakest. Fifth, in different periods, the risk spillover of financial sub-sectors to the real economy is heterogeneous. The risk absorption and amplification of the financial system is undertaken by different financial sub-sectors in different periods.
Based on the above conclusions, this paper proposes the following policy recommendations. First, development is the key to solving all issues. In normal periods, the prevention of systemic risks needs to start from the source, that is, real economic risks must be controlled. Second, in periods when financial risks are on the rise, effective regulation on the financial system is a powerful measure to rapidly resolve the risks. Third, the regulatory body should establish a risk monitoring system dominated by the banking sector, in order to prevent the negative impact of financial risks on the real economy. Fourth, China should unswervingly encourage the diversified development of the financial industry, and better leverage the function of risk absorption of the financial system, so as to mitigate the risks in the real economy.
References
Acemoglu, D., Ozdaglar, A., & Tahbaz-Salehi, A. (2015). Systemic Risk and Stability in Financial Networks. The American Economic Review 105 (2), 564−608.10.3386/w18727Search in Google Scholar
Allen, F., & Santomero, A. M. (1998). The Theory of Financial Intermediation. Journal of Banking & Finance 21, 1461−1485.10.1016/S0378-4266(97)00032-0Search in Google Scholar
Baur, D. G. (2012). Financial Contagion and the Real Economy. Journal of Banking & Finance 36 (10), 2680−2692.10.1016/j.jbankfin.2011.05.019Search in Google Scholar
Bernanke, B. S., Gertler, M., & Gilchrist, S. (1999). The Financial Accelerator in a Quantitative Business Cycle Framework. Handbook of Macroeconomics 1, 1341−1393.10.3386/w6455Search in Google Scholar
Cabrales, A., Gottardi, P., & Vega-Redondo, F. (2017). Risk Sharing and Contagion in Networks. The Review of Financial Studies 30 (9), 3086−3127.10.1093/rfs/hhx077Search in Google Scholar
Chiu, W., Peña, J. I., & Wang, C. (2015). Industry Characteristics and Financial Risk Contagion. Journal of Banking & Finance 50, 411−427.10.1016/j.jbankfin.2014.04.003Search in Google Scholar
Cotter, J., Hallam, M., & Yilmaz, K. (2017). Mixed-Frequency Macro-Financial Spillovers. Koç University-TUSIAD Economic Research Forum Working Papers, No.1704.10.2139/ssrn.2904536Search in Google Scholar
Diebold, F. X., & Yilmaz, K. (2009). Measuring Financial Asset Return and Volatility Spillovers, with Application to Global Equity Markets. The Economic Journal 119 (1), 158−171.10.1111/j.1468-0297.2008.02208.xSearch in Google Scholar
Diebold, F. X., & Yilmaz, K. (2012). Better to Give Than to Receive: Predictive Directional Measurement of Volatility Spillovers. International Journal of Forecasting 28 (1), 57−66.10.1016/j.ijforecast.2011.02.006Search in Google Scholar
Elliott, M., Golub, B., & Jackson, M. O. (2014). Financial Networks and Contagion. American Economic Review 104 (10), 3115−3153.10.1257/aer.104.10.3115Search in Google Scholar
Fang, Y., He, W., & Jing, Z. (2019). Studies on the Spillover Effect of China-US Trade Frictions on China’s Financial Market. Finance & Trade Economics (Caimao Jingji) 6, 55−59.Search in Google Scholar
Han, X., & Han, B. (2017). Systemic Financial Risks under the Suppl y-Side Structural Reform: Generation Logic, Risk Measurement and Countermeasures. Finance & Economics (Caijing Kexue) 6, 1−13.Search in Google Scholar
He, Q., Qian, Z., & Liu, W. (2018). Measurement of China’s Systemic Financial Risks—Perspectives Based on the Real Economy. Journal of Financial Research (Jinrong Yanjiu) 4, 53−70.Search in Google Scholar
Laeven, L., & Valencia, F. (2018). Systemic Banking Crises Revisited. IMF Working Paper, No.WP/18/206.10.5089/9781484376379.001Search in Google Scholar
Levine, R. (2004). Finance and Growth: Theory and Evidence. NBER Working Paper, No.9.10.3386/w10766Search in Google Scholar
Li, Z., Liu, Q., & Liang, Q. (2019). Studies on the Prevention of China’s Systemic Financial Risks. Statistical Research (Tongji Yanjiu) 2, 25−39.Search in Google Scholar
Merton, R. C. (1989). On the Application of the Continuous-Time Theory of Finance to Financial Intermediation and Insurance. The Geneva Papers on Risk and Insurance 52, 225−261.10.1057/gpp.1989.21Search in Google Scholar
Merton, R. C. (1995). A Functional Perspective of Financial Intermediation. Financial Management 2, 23−41.10.2307/3665532Search in Google Scholar
Messner, J. W., & Pinson, P. (2019). Online Adaptive Lasso Estimation in Vector Autoregressive Models for High Dimensional Wind Power Forecasting. International Journal of Forecasting 35(4), 1485−1498.10.1016/j.ijforecast.2018.02.001Search in Google Scholar
Nicholson, W. B., Matteson, D. S., & Bien, J. (2017). VARX-L: Structured Regularization for Large Vector Autoregressions with Exogenous Variables. International Journal of Forecasting 33(3), 627−651.10.1016/j.ijforecast.2017.01.003Search in Google Scholar
Shin, H. S., & Shin, K. (2011). Procyclicality and Monetary Aggregates. NBER Working Papers, No. 16836.10.3386/w16836Search in Google Scholar
Tang, W., & Su, F. (2017). Analysis on the Influence of Extreme Financial Events on Systemic Risks: Taking China’s Banking Sector as an Example. Economic Research Journal (Jingji Yanjiu) 4, 19−35.Search in Google Scholar
Tong, Z., Xie, X., & Deng, M. (2018). Studies on the “Social Mitigation” of Systemic Risks in China’s Banking Sector. Economic Research Journal (Jingji Yanjiu) 2, 124−139.Search in Google Scholar
Yang, Z., & Zhou, Y. (2018). Global Systemic Financial Risk Spillover and External Impacts. Social Sciences in China (Zhongguo Shehui Kexue) 12, 69−90.Search in Google Scholar
Zhang, X., & Zhu, T. (2014). Reflections on the Relationship between the Financial System and the Real Economy. Studies of International Finance (Guoji Jinrong Yanjiu) 3, 43−54.Search in Google Scholar
Zhu, B., & Ma,Y. (2018). Industrial Characteristics, Monetary Policies and Systemic Risks: Analysis Based on “Economic Financial” Correlation Network. Studies of International Finance (Guoji Jinrong Yanjiu) 4, 22−32.Search in Google Scholar
Zhu, T. (2019). How Do Debts in the Real Economy Influence Financial Stability? Theoretical Mechanism and Interpretation Framework. Chinese Review of Financial Studies (Jinrong Pinglun) 2, 29−41+127.Search in Google Scholar
© 2021 Published by De Gruyter on behalf of the National Academy of Economic Strategy, Chinese Academy of Social Sciences
This work is licensed under the Creative Commons Attribution 4.0 International License.
Articles in the same Issue
- Frontmatter
- Does China’s Financial System Amplify Risks in the Real Economy?
- Macro Debt Burden and Consumption Expansion: An Analysis Based on Panel Model and Panel Quantile Regression Model
- Measurement and Characteristics of the Integration of China’s Trade in Services into Digital Global Value Chain
- Tax Burden, Institutional Environment and Foreign Direct Investment Flow: From the Perspective of Asymmetric International Tax Competition
- The Promotion of Deep Integration of Modern Service Industry and Advanced Manufacturing Industry
- Driving Factors, Effect Analysis and Countermeasures of the Development of China’s Live Broadcast Platform
- Challenges and Countermeasures for the Sustainable Development of Local Finance under the Impact of COVID-19