Comparative analysis of three platforms for serum NfL quantification in healthy controls and MS patients
-
Justina Dargvainiene
 ,
Antje Torge
,
Klaus-Peter Wandinger
,
Antje Torge
,
Klaus-Peter Wandinger

Abstract
Objectives
Neurofilament light chain (NfL) is a biomarker of neuroaxonal damage in various neurological conditions, including multiple sclerosis (MS). With new analytical platforms entering the market, standardization of serum NfL (sNfL) measurement is essential. This study compared sNfL levels across three assays – NF-light Advantage V2/Plus (Quanterix), Lumipulse G NfL blood (FujiRebio), and Elecsys NfL (Roche Diagnostics) – and derived conversion formulas for harmonization.
Methods
Serum samples from three cohorts including healthy donors (n=303) and MS patients (n=181) were analyzed across three platforms. Passing-Bablok regression and correlation analyses assessed inter-platform agreement and potential systematic differences. Assays were further evaluated for their ability to detect MS disease activity.
Results
All platforms showed strong correlations (Pearson>0.98; Spearman>0.90, p<0.001). Absolute values from Elecsys were ∼6-fold lower than the other assays. Fourteen of 484 samples (2.90 %) showed substantial, retest-stable deviations (>4 SD) on at least one platform. After excluding outliers, conversion formulas were derived to transform the values to the NF-light Advantage V2/Plus scale: NfL=6.31 × [Elecsys NfL] + 2.33 ng/L; NfL=0.94 × [Lumipulse G NfL] + 1.30 ng/L. In MS patients, all platforms detected significant differences between relapse and remission (p<0.001). Age-adjusted Z scores from converted values yielded the highest effect sizes (Cohen’s d: 0.84 for NF-light Advantage, 1.11 for Elecsys, 0.93 for Lumipulse).
Conclusions
The three platforms demonstrated high correlation and comparable performance in sNfL quantification. About 3 % of samples showed strong deviations, highlighting the need for vigilance and further harmonization. Age-adjusted Z scores may enhance clinical and research utility.
Introduction
Since the introduction of highly sensitive immunoassays (such as single molecule array-based analysis, SIMOA [1]) serum neurofilament light chain (sNfL) has been established as a blood-based biomarker for neuroaxonal damage in neuroinflammatory and neurodegenerative diseases [2], [3], [4]. Particularly in the field of multiple sclerosis (MS), sNfL has received widespread attention as a blood-based biomarker for assessing disease activity and progression in conjunction with clinical parameters and imaging [5], 6]. Elevated levels of sNfL are associated with disease activity, response to treatment, and treatment efficacy, making it a candidate for personalized patient management in MS [7], [8], [9], [10]. However, the widespread clinical application of sNfL measurements remains challenging due to the limited availability of testing. Until recently, no clinically certified testing platform was available, and the pioneering SIMOA technology-based platform from Quanterix was “Research-use-only.” Nevertheless, the testing landscape is undergoing a transformation, with one new platform (Siemens) already certified for routine diagnostics, and two other widely available platforms (FujiRebio and Roche Diagnostics) actively seeking certification. The resulting availability of diverse parallel platforms for measuring sNfL demands standardization to ensure consistent and reliable data for patient care and comparable data for scientific questions. Standardization requires defining reference limits based on healthy controls, which for NfL must account for its age-dependent increase [6], 11]. A leading approach is the comprehensive NfL reference database published in 2022 [7] with NfL Z scores and percentile values, allowing the quantification of deviations from healthy levels while adjusting for age and BMI. However, the application of this dataset to sNfL measurements acquired using one of these new platforms demands the demonstration of a high correlation between platforms and of a comparable analytic performance. This is also relevant for the adaptation and harmonization of platform-specific cut-offs, such as the recently published threshold for prognosticating disease activity – defined by the development of new T2 lesions over 2 years – established during the clinical validation of the Atellica IM NfL assay [12]. Therefore, the objective of our multi-center study was to compare three different platforms and assays for the measurement of sNfL concentration (NF-light Advantage V2/Plus by Quanterix, Lumipulse G NfL blood by FujiRebio, and the Elecsys NfL assay by Roche Diagnostics) to analyze analytical correlation and comparability of differentiation between relapse and remission stages in MS.
Materials and methods
Samples
Our study encompassed three cohorts of participants (Figure 1): Healthy blood donors (n=303) were sourced from a blood bank affiliated with the Institute of Transfusion Medicine at the University Hospital Schleswig-Holstein, Campus Kiel. All participants were examined before serum sampling by physicians and certified to be without known neurodegenerative, neoplastic, neuroinflammatory, or neuroinfectious conditions. Demographic information, including age and gender, was recorded, and samples were pseudonymized immediately following the collection.
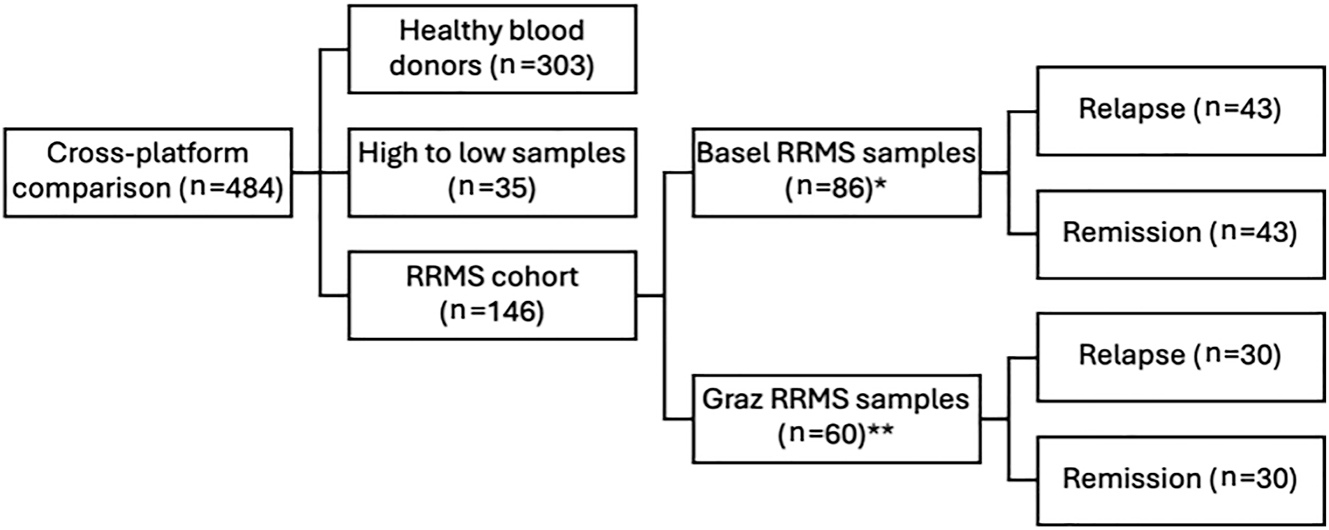
Study cohorts. RRMS, relapsing remitting multiple sclerosis; * paired samples of patients in relapse and remission; ** unpaired samples balanced 1:1 in relapse and remission.
A second cohort (high to low samples) was introduced to enrich the range of sNfL levels in the dataset beyond the mostly low levels observed in healthy individuals and treated MS patients. We included 35 samples from patients with MS with known sNfL concentrations covering a broad range of sNfL levels (1.00–232.00 ng/L on Simoa technology-based platform, Quanterix). These were provided by the MS Center, University Hospital Basel, Switzerland.
The third cohort of patients with relapsing remitting MS (RRMS) was included and balanced 1:1 for relapse and remission to compare the analytical validity of differentiating between relapse and remission across different platforms. For remission, a minimum of 30 days since the last relapse was required. Samples from RRMS patients were procured from Basel and the Department of Neurology, Medical University of Graz, Graz, Austria. Participants were required to have a confirmed diagnosis of RRMS, alongside documented information regarding their current disease status (relapse vs. remission). The Basel sample set (n=86) consisted of paired samples from 43 patients at two time points during relapse and remission, whereas the Graz sample set (n=60) provided unpaired samples with a balanced 1:1 representation of 30 patients during relapse and 30 during remission. Together, these 146 samples were designated as the RRMS patient cohort, with a subdivision into remission and relapse.
All samples were stored at −80 °C prior to analysis and were measured immediately after thawing.
Standard protocol approvals, registrations, and patient consents
The Graz samples were recruited from the study approved by the Ethics Committee of the Medical University of Graz, Austria (31-432 ex 18/19). Basel samples were collected within the Swiss MS Cohort study which was approved by the Ethics Committees of all participating centers (2023-02367). All participants gave written informed consent prior to inclusion in the study. Healthy blood donors provided written informed consent allowing the use of remaining material for research purposes. The study complied with the Word Medical Association Declaration of Helsinki.
Measurements
Each sample was measured in singlicate across three analytical platforms (HD-X analyzer from Quanterix, Billerica, USA; Lumipulse G 600 from FujiRebio, Tokyo, Japan and cobas pro e800 module from Roche Diagnostics, IN, USA), utilizing commercially available kits (NF-light Advantage V2 (LOT 503862 and 503867, Limit of Quantification (LoQ) >1.38, Range 1.38–1,440.00 ng/L) CV: 9.10 % at the low concentration (14.39 ng/L) and 6.38 % at the high concentration (648.88 ng/L)/Plus (LOT 503964, LoQ>1.24 ng/L, Range 1.24–1,800.00 ng/L, CV: 7.51 % at the low concentration (7.93 ng/L) and 4.59 % at the high concentration (204.25 ng/L)) from Quanterix, Lumipulse G NfL blood from FujiRebio (LoQ>3.25, Range 2.00–5,000.00 ng/L, CV: 5.66 % at the low concentration (17.94 ng/L) and 4.56 % at the high concentration (788.71 ng/L)), and Elecsys NfL from Roche Diagnostics (LoQ>0.50, Range 0.50–5,000.00 ng/L, CV: 6.57 % at the low concentration (1.33 ng/L) and 2.46 % at the high concentration (481.81 ng/L)) in accordance with the manufacturer’s recommendations. During each analytical run, both low and high controls provided by the manufacturer were measured at the initiation and conclusion of the run to ensure the stability of the reagents throughout the analysis. Samples from healthy blood donors and RRMS patients were exposed to the same pre-analytical and analytical conditions.
During the analysis period, the assay kit provided by Quanterix underwent a version change. This resulted in healthy controls being measured with the NF-light Advantage V2 kit, while samples from RRMS patients were analyzed using the updated NF-light Advantage Plus version. To exclude a bias introduced by this change in kits, we analyzed n=150 samples (range 1.97–42,610.47 ng/L) using both kits on a fully automated HD-X analyzer and compared them to each other. A very high correlation was observed between the two kit versions (Pearson r=0.99; p<0.001, Spearman r=0.98; p<0.001). Passing-Bablok regression yielded the equation: NF-Light Advantage V2=0.92 × NF-Light Advantage Plus + 0.46 ng/L (CI Slope: [0.88–0.95], CI Intercept: [0.28–0.85], Supplementary Figure 1). Therefore, we chose to combine all analyses on the Quanterix platform into a single group, independent of the type of kit utilized.
Statistical analysis
First, we employed Passing-Bablok regression and Pearson/Spearman correlation analysis to compare the results across the tested platforms in controls and RRMS patients (all samples). Next, outliers were identified by calculating the perpendicular distance from the Passing-Bablok regression line, normalized by the mean of the x- and y-values, to allow consistent detection across all tested platforms in the absence of a gold standard for NfL quantification (all values original, Table 2). Data points with a perpendicular distance from the regression line exceeding the mean distance plus four times the standard deviation (SD) were classified as outliers. Frequency of outliers and relative deviation (up- or down) of outliers (Supplementary Table 1) was grouped by platform and compared using Fisher-Exact test. After exclusion of outliers (all values without outliers, Table 1), formulas for converting absolute sNfL measurements across platforms were calculated using Passing-Bablok regression on the combined dataset from all three cohorts. After converting the values to the NF-light Advantage V2/Plus scale, Passing-Bablok regression and Pearson/Spearman correlation analyses were repeated to assess concordance across all three platforms (excluding outliers; see Table 2). In addition, we used Lin’s concordance correlation coefficient to assess the agreement between measurements across the three platforms. Z scores were calculated using a generalized additive model for location, scale and shape (GAMLSS), validated in a cohort of 4,532 people and previously published [7]. Across assays, biomarker group differences between RRMS patients experiencing relapse and those in remission were evaluated using Cohen’s d and compared using the Wilcoxon rank sum test, for original and converted sNfL values as well as age-adjusted sNfL Z scores. For comparisons of sNfL levels between relapse and remission, all samples were analyzed as unpaired. Receiver operating characteristic (ROC) curves were constructed, and the area under the curve (AUC) was calculated to assess the ability of sNfL values and age-adjusted Z scores to discriminate between relapse and remission in RRMS across all three platforms. AUCs were compared using DeLong-Tests. All analyses were performed in R version 4.3.3, and a p-value below 0.05 was considered statistically significant.
Summary of cross-platform comparison with correlation analysis and Passing-Bablok regression.
| Cohort | Devices | Passing-Bablok regression | Spearman’s ra | Pearson’s ra | Lin’s ccc |
|---|---|---|---|---|---|
| After exclusion of outliers (n=469) | Elecsys NfL vs. NF-Light Adv V2 (Plus) | y=6.31[6.06, 6.56]x + 2.33[−2.67,−1.99] | 0.91 | 0.99 | 0.26 [0.25, 0.28] |
| Lumipulse G NfL vs. Elecsys NfL | y=0.15[0.14, 0.15]x + 0.17[0.12, 0.21] | 0.90 | 0.98 | 0.2 [0.19, 0.21] | |
| Lumipulse G NfL vs. NF-Light Adv V2 (Plus) | y=0.94[0.91, 0.96]x + 1.3[−1.54, −1.09] | 0.92 | 0.98 | 0.94 [0.93, 0.95] | |
| After exclusion of outliers converted (n=469) | Elecsys NfL vs. NF-Light Adv V2 (Plus) | y=0.95[0.91, 0.98]x + 0.34[0.14, 0.61] | 0.91 | 0.99 | 0.99 [0.99, 0.99] |
| Lumipulse G NfL vs. Elecsys NfL | y=1.04[1,1.08]x + 0.34[−0.63,−0.07] | 0.90 | 0.98 | 0.97 [0.96, 0.97] | |
| Lumipulse G NfL vs. NF-Light Adv V2 (Plus) | y=1[0.97, 1.03]x + 0.01[−0.23, 0.16] | 0.92 | 0.98 | 0.96 [0.96, 0.97] | |
| Original values (n=483) | Elecsys NfL vs. NF-Light Adv V2 (Plus) | y=6.38[6.1, 6.64]x + 2.43[−2.8, −2.05] | 0.86 | 0.91 | 0.23 [0.21, 0.25] |
| Lumipulse G NfL vs. Elecsys NfL | y=0.15[0.14, 0.15]x + 0.17[0.12, 0.22] | 0.87 | 0.71 | 0.11 [0.1, 0.13] | |
| Lumipulse G NfL vs. NF-Light Adv V2 (Plus) | y=0.94[0.9, 0.96]x + 1.29[−1.54, −1.06] | 0.89 | 0.89 | 0.78 [0.76, 0.8] |
-
aAll p-values <0.001, Lin’s ccc=Lin’s concordance correlation coefficient: 1=perfect agreement; >0.9=excellent; 0.8–0.9=very good; 0.65–0.8=moderate; <0.65=poor.
Demographics of study cohorts.
| All values | MS-cohort | |
|---|---|---|
| Size | 484 | 146 |
| Age mean (SD) | 41.3 (14) | 38 (9.6) |
| Age range (min-max) | 18–74 | 20–65 |
| Female, n (%) | 244 (50.40) | 101 (69.20) |
| Relapse/remission, n (%) | 73/73 (50/50) | |
| sNfL ng/L mean (SD) | 10.30 (18.00) | 12.90 (20.80) |
| sNfL ng/L range (min-max) | 1–232 | 3–220 |
-
RRMS, relapsing remitting multiple sclerosis; sNfL, serum neurofilament light chain (levels measured with NF-light Advantage V2 (Plus)); SD, standard deviation.
Results
We analyzed a total of 484 serum samples from healthy donors (n=303), patients with RRMS (n=146), and low to high samples (n=35) (Figure 1). Participant demographic characteristics are summarized in Table 2.
Cross-platform comparison and outlier analysis
We initially assessed the correlation among the three platforms, combining all samples to ensure a representative spectrum of sNfL values. We observed strong correlations across all three platforms (Pearson’s r=0.71–0.91, p<0.001; Spearman’s r=0.86–0.89, p<0.001; Figure 2A–C and Table 1). Based on Passing-Bablok regression analysis, we identified 14/484 (2.90 %) significantly discrepant samples on at least one platform (outliers; Figure 2D, Supplementary Table 1). These outliers were non-systematic, as neither their direction nor the affected platform exhibited any consistent and significant bias and accrued across all study cohorts, including healthy donors, MS patients, and high to low samples. A repeated measurement of these outliers on the respective platform confirmed these findings, with a coefficient of variation below 10 % in all repeated samples. Of note, in 13/14 of these samples, two of three platforms yielded highly comparable results and only 1/14 samples resulted in largely deviating results from all three platforms (Supplementary Table 1). After exclusion of these outliers, an even higher correlation was observed across all three platforms (Figure 2E, Pearson’s r=0.98–0.99, p<0.001; Spearman’s r=0.90–0.92, p<0.001; Table 1).
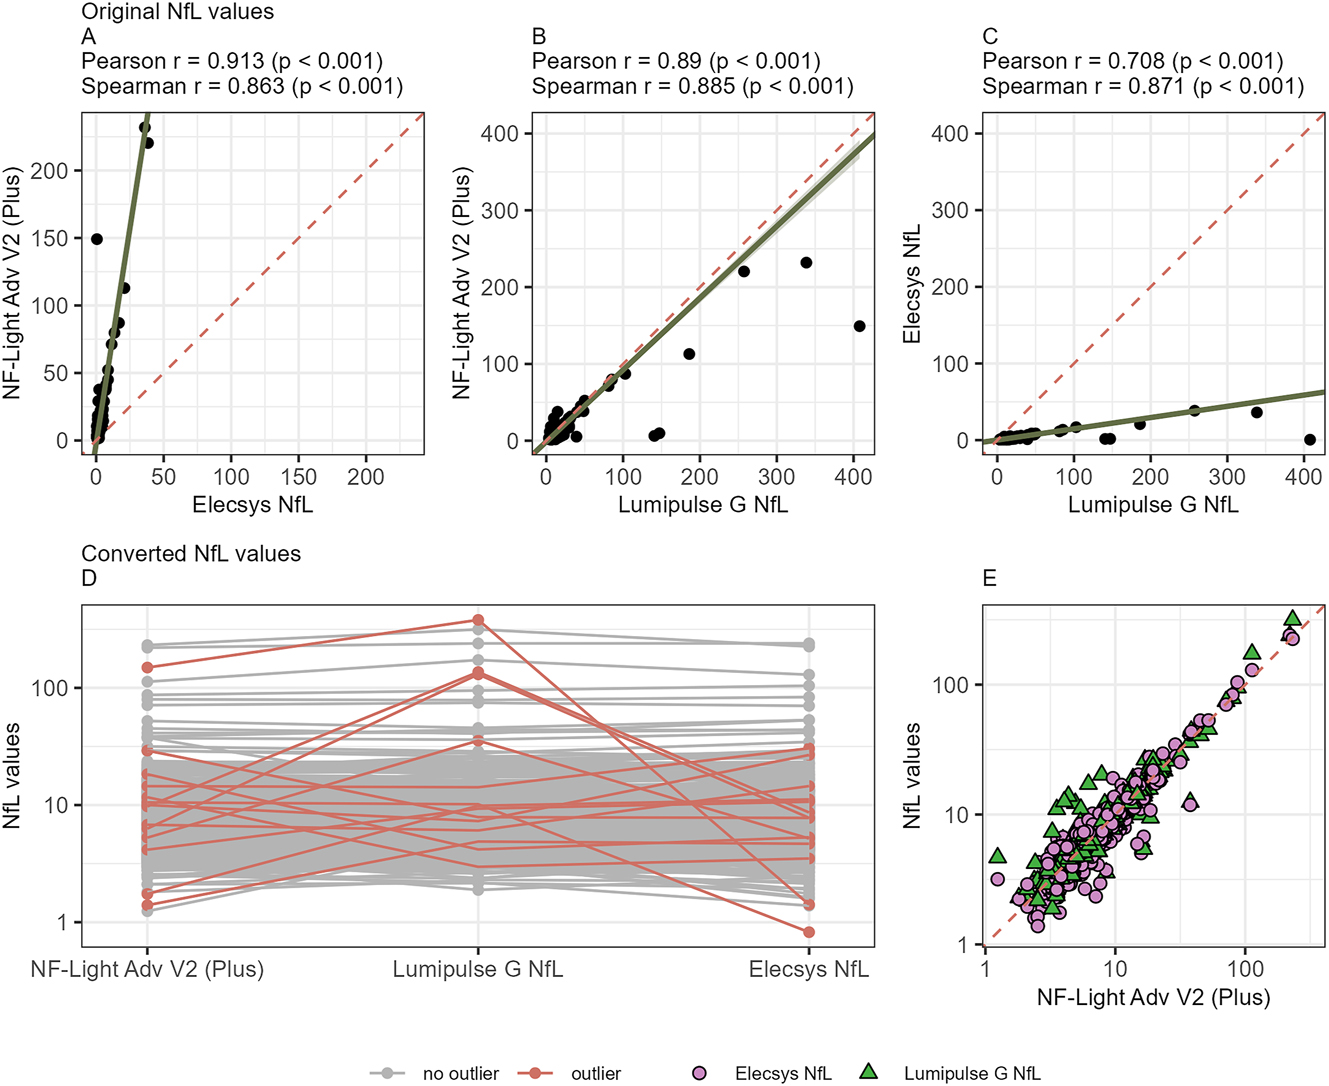
Cross-platform comparison of sNfL values with correlation and outlier analysis. (A–C) Correlation of sNfL values (ng/L) of healthy and MS patients combined between platforms. (A) NF-Light Advantage Adv V2 Plus, Quanterix vs. Elecsys NfL, Roche Diagnostics. (B) NF-Light Advantage Adv V2 Plus, Quanterix vs. Lumipulse G NfL blood, FujiRebio; (C) Lumipulse G NfL blood, FujiRebio vs. Elecsys NfL, Roche Diagnostics. (D) Outliers (marked red) on at least one platform (perpendicular distance from the Passing-Bablok regression line >4 standard deviations). (E) Correlation of all samples following application of conversion formulas. Green triangles Lumipulse G NfL blood, FujiRebio (Pearson correlation r=0.98, p<0.001 and Spearman correlation r=0.92, p<0.001) and purple circles Elecsys NfL, Roche Diagnostics (Pearson correlation r=0.99, p<0.001 and Spearman correlation r=0.91, p<0.001) vs. NF-Light Advantage Adv V2 Plus results on the x-axis.
Establishment of conversion formulas between the platforms
After exclusion of outliers, we next calculated conversion formulas for transforming absolute sNfL measurements between platforms. We again employed Passing-Bablok regression (Table 1). This yielded formulas converting absolute sNfL concentrations measured on any platform to “SIMOA-concentrations” (NfL-light Advantage V2/Plus assay): conversion formula for Elecsys NfL=6.31 × [Elecsys NfL] + 2.33 ng/L and for Lumipulse G NfL blood=0.94 × [Lumipulse G NfL blood] + 1.30 ng/L, (Figure 2E). As previously known [13], 14], the Elecsys NfL assay yielded approximately six-fold lower absolute sNfL concentrations compared to the NF-Light Advantage V2/Plus and Lumipulse G NfL blood assays, whereas measurements obtained with the Lumipulse G NfL assay remained within a comparable range to NF-light Advantage V2/Plus scale (Table 1). Concordance between the three tested platforms could be improved through the exclusion of outliers and conversion of the values, as shown with Lin’s concordance correlation coefficient (Table 1).
Clinical use case: evaluation of disease activity in multiple sclerosis patients
Finally, we evaluated the clinical performance of all three platforms in discriminating between relapse and remission in a preselected cohort of patients with RRMS, encompassing equal numbers of patients with relapse and remission status. We compared the performance of (a) raw values obtained from all three analyzers (Supplementary Figure 2); (b) values adjusted using our conversion formulas (Figure 3A–C); and (c) age-adjusted Z scores calculated using our converted values (Figure 3D–F). Age distribution in MS patients is additionally shown in Supplementary Figure 3. Across all three platforms, significant differences were observed between relapse and remission MS patients. Of note, Z scores yielded larger effect sizes compared to absolute converted values (Cohen’s d: 0.84 vs. 0.49 for NF-light Advantage V2/Plus, 1.11 vs. 0.53 for Elecsys NfL, and 0.93 vs. 0.48 for Lumipulse G NfL blood, see Figure 3A–F) as well as absolute original values (see Supplementary Figure 2). Similarly, Z scores performed slightly better in ROC analysis, showing higher AUCs (0.72 vs. 0.69, 0.78 vs. 0.75, and 0.73 vs. 0.71, respectively; Figure 3G and H and Supplementary Table 2), although the differences were not statistically significant. Of note, all three platforms showed very comparable performance in discrimination between relapse and remission on this cohort with a significant – albeit small – advantage for the Elecsys platform (Supplementary Table 2).
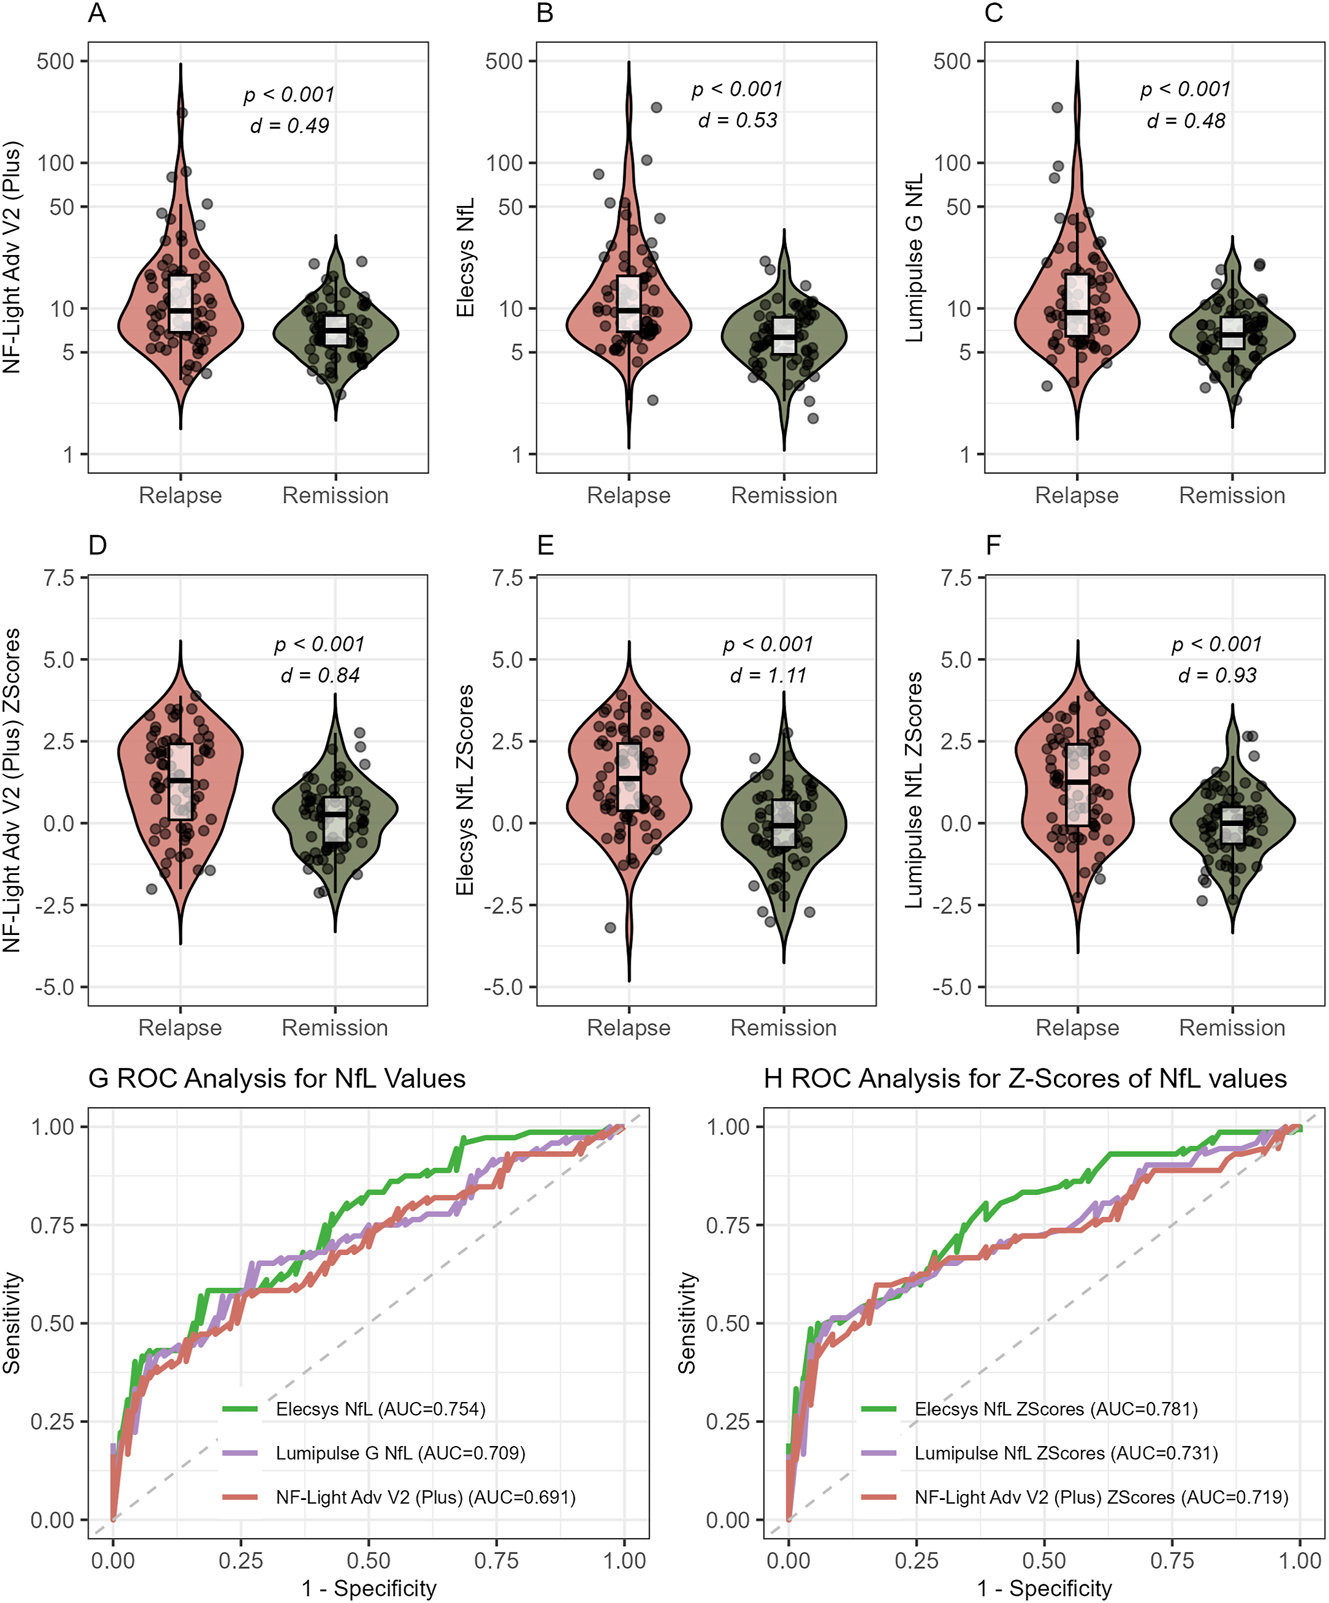
Analytical performance of all platforms to discriminate MS patients with relapse and remission. (A–C) Platform-converted (using our conversion formulas) absolute sNfL values in relapse and remission measured with (A) NF-Light Advantage Adv V2 Plus, Quanterix. (B) Elecsys NfL, Roche diagnostics. (C) Lumipulse G NfL blood, FujiRebio. (D–F) sNfL Z scores based on converted absolute values measured with (D) NF-Light Advantage Adv V2 Plus. (E) Elecsys NfL, Roche diagnostics. (F) Lumipulse G NfL blood, FujiRebio. (G–H) ROC analysis for discrimination between relapse and remission using (G) conversion-formula transformed absolute sNfL values and (H) Z scores based on these converted values measured with NF-Light Advantage Adv V2 Plus (red), Elecsys NfL, Roche diagnostics (green), and Lumipulse G NfL blood, FujiRebio (purple). AUC were not statistically different in G and H.
Discussion
Serum neurofilament light chain (sNfL) has rapidly evolved from a research biomarker to a candidate routine laboratory test for monitoring neuroaxonal injury [15], [16], [17], [18], [19], [20], [21], [22], [23], [24], [25], [26], [27]. In this comparative study, we evaluated three fully automated research-use-only assays that are currently undergoing CE certification. Across 485 samples from healthy volunteers and patients with MS, Pearson (r>0.98) and Spearman (r>0.90) correlation coefficients demonstrated very high analytical concordance between the platforms, satisfying a key prerequisite for clinical interchangeability. Passing Bablok regression-derived conversion equations aligned the numerical scale of the emergent platforms with the legacy Quanterix Simoa assay, thereby permitting direct comparison with historical cohorts and facilitating meta-analyses of treatment effects. When sNfL values were transformed into age-adjusted Z scores after platform-specific normalization, performance in discrimination between relapse and remission remained comparable to raw concentrations. However, the effect size was larger, supporting recent recommendations [7] that laboratories report age-adjusted Z scores rather than absolute values when interpreting individual results. In our cohort, the Elecsys platform demonstrated a slightly better ability to distinguish between relapse and remission compared to the other two evaluated platforms, both when using absolute values and Z scores. However, since this observation is based on a single cohort and the study primarily focuses on the analytical performance of the compared platforms, it should be interpreted with caution and confirmed in independent studies to assess its reliability and generalizability.
In comparison to previous studies [13], 14], 28], we also observed a strong correlation among three different platforms used for measuring blood NfL concentrations. Notably, our cohort represents the largest dataset to date that compares various analytical platforms for blood NfL quantification in both healthy individuals and patients with neurological disorders. Furthermore, this study investigates the utility of age-adjusted Z scores as an additional approach for harmonizing NfL measurements across different platforms. In contrast, the recent French multicenter analytical study [28] primarily utilized artificially generated samples covering a measurement range comparable to our study, however did not include the Elecsys NfL assay. The study conducted by Mayo Clinic, while encompassing all three assays evaluated in our study, was limited by a smaller data set [13]. Despite differences in study design, the Passing-Bablok regression lines observed in our study (NfL=6.31 × [Elecsys NfL] + 2.33 ng/L; NfL=0.94 × [Lumipulse G NfL blood] + 1.32 ng/L) closely align with those reported by the Mayo Clinic (NfL=6.4 × [Elecsys NfL] − 1.30 ng/L; NfL=0.95 × [Lumipulse G NfL blood] − 0.56 ng/L) [13], indicating the robustness of Passing-Bablok regression as a basis for converting blood NfL values across different platforms. The referenced study also included the fourth and currently only CE-IVDR–certified assay, the Atellica IM Neurofilament Light Chain (NfL), for NfL quantification in MS patients. It demonstrated high correlation across all four platforms (r>0.95) with systematic bias, further supporting the generalizability of using Passing–Bablok regression–based conversion formulas. However, applying such cross-study conversions remains exploratory, as differences in cohorts, sample matrices (serum vs. plasma), and pre-analytical conditions may introduce additional shifts. We therefore encourage larger multicenter comparison studies that include the Siemens Atellica IM to enable direct four-way harmonization and the establishment of robust international reference ranges. This could be further expanded in the event that additional platforms seeking CE-IVDR certification are introduced. To date, none of the previous studies have evaluated the additional utility of age adjusted Z scores, which, as demonstrated in our analysis, provide significant added value in enhancing the harmonization of blood NfL measurements across different analytical platforms and increasing the discriminatory power by normalizing for age effects on NfL concentrations. We found no evidence that epitope differences between antibody pairs influenced clinical validity. Although the targeted epitope by antibody has previously been discussed as a potential factor influencing blood NfL concentrations and its biological half-life [29]. Correlation coefficients and relapse–remission effect sizes in patients with RRMS were virtually identical across all three tested platforms. This observation argues against clinically meaningful epitope-dependent bias at least within the concentration range typical of MS and suggests that the same biological signal is captured irrespective of platform.
A clinically relevant challenge emerged from the identification of platform-specific outliers: in our sample set approximately one in 35 samples deviated by more than four standard deviations on a single analyser yet remained concordant on the other two. These discrepancies persisted on repeat runs of the same platform but disappeared when the specimen was re-analysed on a different system, pointing to matrix-dependent interference potentially in the context of differences driven by epitope specificity of used antibodies or heterophilic antibodies. A pre-analytical influence is considered an unlikely explanation for the outliers, as the results remained consistent in repeated runs. The occurrence of outliers was also noted and addressed in a previous cross-platform comparison, in which 8 out of 122 samples (6 %) – those showing more than 150 % difference between the compared platforms – were identified as outliers and excluded from further analysis [13]. In the absence of a universally accepted gold standard for blood NfL quantification results should be interpreted within the appropriate clinical context, as the absence of a universally accepted gold standard for blood NfL quantification may result in inaccurate measurements on both platforms, potentially in either direction. Future studies incorporating dilution linearity, spike-and-recovery experiments and heterophilic-antibody blocking reagents are required to elucidate the underlying mechanism and to establish whether the problem extends to other neurological disorders such as amyotrophic lateral sclerosis or hypoxic encephalopathy, where sNfL concentrations are markedly higher [26], 27].
Several limitations merit acknowledgement. First, we did not include the Siemens ADVIA Centaur/Atellica or ProteinSimple Ella assays and we therefore cannot generalize our findings to those platforms. Second, differentiation between relapse and remission was assessed using retrospectively selected, equally balanced cohorts; optimal diagnostic thresholds for routine practice must therefore be derived from prospectively assembled unselected cohorts. Third, pre-analytical variables – including sample matrix, storage conditions, and freeze–thaw cycles – were tightly controlled in this study. Although sNfL remains stable for up to 7 days at room temperature and across multiple freeze–thaw cycles [30], these factors can still introduce variability in real-world settings. Laboratories implementing sNfL measurements should therefore incorporate these considerations into their quality-management protocols and performe internal validation of the sample transport and storage. Beyond NfL, several additional blood-based biomarkers – such as phosphorylated tau217, glial fibrillary acidic protein, and amyloid-beta peptides – are currently under investigation for use in routine diagnostics [31], [32], [33], [34]. These markers exhibit differing pre-analytical stability and varying concentrations between serum and plasma, which requires careful consideration when comparing cohorts or analytical platforms and when implementing these assays in routine laboratory practice. Finally, our data do not replace the need for large platform-specific reference datasets; they provide a practical bridge for harmonization of blood NfL measurements across different analytic platforms – an essential step toward the broader implementation of this biomarker in routine clinical practice.
In conclusion, sNfL measurements obtained with three emerging automated immunoassays are highly concordant and can be used interchangeably at the individual level after applying simple conversion equations. We recommend consistently reporting age-adjusted reference values and/or age-adjusted Z scores, as this would also help harmonize results across different platforms. Nevertheless, the observed rate of platform-specific outliers underscores the importance of cross-platform quality control, and continued harmonization efforts – including the development of an international calibrator and reference measurement procedure.
Acknowledgments
We thank Melanie Schlapkohl for her excellent technical support.
-
Research ethics: The Graz samples were recruited from the study approved by the Ethics Committee of the Medical University of Graz, Austria (ID 31-432 ex18/19). Basel samples were collected within the Swiss MS Cohort study which was approved by the Ethics Committees of all participating centers (ID 2023-02367). Blood samples from healthy donors were collected prior to donation, following the acquisition of signed informed consent for their use in research and commercial purposes. All participants gave written informed consent prior to inclusion in the study.
-
Informed consent: All participants gave written informed consent prior to inclusion in the study.
-
Author contributions: JD, AT, MK, JK, FL study design and organization; JD first manuscript drafting, AT and EW statistical analysis and visualization of the data, KPW, RJ, RM, PB, AM, SOS, MZ, CT, MMS recruitment of study participants and critical revision of the manuscript. All authors have accepted responsibility for the entire content of this manuscript and approved its submission.
-
Use of Large Language Models, AI and Machine Learning Tools: None declared.
-
Conflict of interest: This study was conceived following an Advisory Board Meeting organized by Roche, attended by FL, JK, and MK. Study design, choice of platforms, execution, and analysis were done by the authors without any influence from IVD companies. NfL assay kits were provided free of charge by Roche and FujiRebio. No additional funding or sponsorship was received. Study design, sample acquisition, data analysis, and interpretation were conducted independently and without any commercial influence. FL receives funding from the German Federal Ministry of Education and Research (CONNECT-GENERATE grant no. 01GM1908A and 01GM2208). FL is also supported by E-Rare Joint Transnational research support (ERA-Net, LE3064/2-1), European Joint Program for Neurodegenerative Diseases (EJPRD) IGNITEMIND (01ED2506B), ERA-Net MICE-AE (01EW2507B), Stiftung Pathobiochemie of the German Society for Laboratory Medicine and HORIZON MSCA 2022 Doctoral Network 101119457 — IgG4-TREAT and discloses speaker honoraria from Grifols, Teva, Biogen, Bayer, Roche, Novartis, Fresenius, travel funding from Merck, Grifols and Bayer and serving on advisory boards for Roche, Biogen and Alexion. JK received speaker fees, research support, travel support, and/or served on advisory boards by Swiss MS Society, Swiss National Research Foundation (320030_212534/1), University of Basel, Progressive MS Alliance, Alnylam, Argenx, Bayer, Biogen, Bristol Myers Squibb, Celgene, Immunic, Merck, Neurogenesis, Novartis, Octave Bioscience, Quanterix, Roche, Sanofi, Stata DX. MK has received travel funding and speaker honoraria from Bayer, Biogen, Novartis, Merck, Sanofi and Teva and serves on scientific advisory boards for Biogen, Bristol-Myers Squibb, Gilead, Merck, Neuraxpharm, Novartis, Alexion, Amgen and Roche. He received research grants from Biogen, Novartis and Teva.
-
Research funding: NfL assay kits were provided free of charge by Roche and FujiRebio. No additional funding or sponsorship was received. Study design, sample acquisition, data analysis, and interpretation were conducted independently and without any commercial influence.
-
Data availability: Data can be made available upon reasonable request.
References
1. Rissin, DM, Kan, CW, Campbell, TG, Howes, SC, Fournier, DR, Song, L, et al.. Single-molecule enzyme-linked immunosorbent assay detects serum proteins at subfemtomolar concentrations. Nat Biotechnol 2010;28:595–9. https://doi.org/10.1038/nbt.1641.Search in Google Scholar PubMed PubMed Central
2. Gaetani, L, Blennow, K, Calabresi, P, Di Filippo, M, Parnetti, L, Zetterberg, H. Neurofilament light chain as a biomarker in neurological disorders. J Neurol Neurosurg Psychiatry 2019;90:870–81. https://doi.org/10.1136/jnnp-2018-320106.Search in Google Scholar PubMed
3. Khalil, M, Teunissen, CE, Otto, M, Piehl, F, Sormani, MP, Gattringer, T, et al.. Neurofilaments as biomarkers in neurological disorders. Nat Rev Neurol 2018;14:577–89. https://doi.org/10.1038/s41582-018-0058-z.Search in Google Scholar PubMed
4. Khalil, M, Teunissen, CE, Lehmann, S, Otto, M, Piehl, F, Ziemssen, T, et al.. Neurofilaments as biomarkers in neurological disorders — towards clinical application. Nat Rev Neurol 2024;20:269–87. https://doi.org/10.1038/s41582-024-00955-x.Search in Google Scholar PubMed
5. Freedman, MS, Gnanapavan, S, Booth, RA, Calabresi, PA, Khalil, M, Kuhle, J, et al.. Guidance for use of neurofilament light chain as a cerebrospinal fluid and blood biomarker in multiple sclerosis management. EBioMedicine 2024;101:104970. https://doi.org/10.1016/j.ebiom.2024.104970.Search in Google Scholar PubMed PubMed Central
6. Khalil, M, Pirpamer, L, Hofer, E, Voortman, MM, Barro, C, Leppert, D, et al.. Serum neurofilament light levels in normal aging and their association with morphologic brain changes. Nat Commun 2020;11:812. https://doi.org/10.1038/s41467-020-14612-6.Search in Google Scholar PubMed PubMed Central
7. Benkert, P, Meier, S, Schaedelin, S, Manouchehrinia, A, Yaldizli, Ö, Maceski, A, et al.. Serum neurofilament light chain for individual prognostication of disease activity in people with multiple sclerosis: a retrospective modelling and validation study. Lancet Neurol 2022;21:246–57. https://doi.org/10.1016/s1474-4422(22)00009-6.Search in Google Scholar
8. Abdelhak, A, Benkert, P, Schaedelin, S, Boscardin, WJ, Cordano, C, Oechtering, J, et al.. Neurofilament light chain elevation and disability progression in multiple sclerosis. JAMA Neurol 2023;80:1317–25. https://doi.org/10.1001/jamaneurol.2023.3997.Search in Google Scholar PubMed PubMed Central
9. Meier, S, Willemse, EAJ, Schaedelin, S, Oechtering, J, Lorscheider, J, Melie-Garcia, L, et al.. Serum glial fibrillary acidic protein compared with neurofilament light chain as a biomarker for disease progression in multiple sclerosis. JAMA Neurol 2023;80:287–97. https://doi.org/10.1001/jamaneurol.2022.5250.Search in Google Scholar PubMed PubMed Central
10. Bittner, S, Oh, J, Havrdová, EK, Tintoré, M, Zipp, F. The potential of serum neurofilament as biomarker for multiple sclerosis. Brain 2021;144:2954. https://doi.org/10.1093/brain/awab241.Search in Google Scholar PubMed PubMed Central
11. Solberg, HE. Approved recommendation (1987) on the theory of reference values. Part 5. Statistical treatment of collected reference values. Determination of reference limits. Clin Chim Acta 1987;170:S13–32. https://doi.org/10.1016/0009-8981(87)90151-3.Search in Google Scholar
12. Ziemssen, T, Freedman, MS, Bar-Or, A, Montalban, X, Teunissen, CE, Häring, DA, et al.. Clinical validation of a novel in vitro diagnostic neurofilament light chain assay for the prognostication of disease activity in people with relapsing multiple sclerosis. Mult Sclerosis 2025;31:1543–56. https://doi.org/10.1177/13524585251389797.Search in Google Scholar PubMed PubMed Central
13. Ashrafzadeh-Kian, S, Figdore, D, Larson, B, Deters, R, Abou-Diwan, C, Bornhorst, J, et al.. Head-to-head comparison of four plasma neurofilament light chain (NfL) immunoassays. Clin Chim Acta 2024;561:119817. https://doi.org/10.1016/j.cca.2024.119817.Search in Google Scholar PubMed
14. Booth, RA, Beriault, D, Schneider, R, Benkert, P, Willemse, EAJ, Maceski, AM, et al.. Validation and generation of age-specific reference intervals for a new blood neurofilament light chain assay. Clin Chim Acta 2025;577:120447. https://doi.org/10.1016/j.cca.2025.120447.Search in Google Scholar PubMed
15. Kuhle, J, Plavina, T, Barro, C, Disanto, G, Sangurdekar, D, Singh, CM, et al.. Neurofilament light levels are associated with long-term outcomes in multiple sclerosis. Mult Sclerosis 2020;26:1691–9. https://doi.org/10.1177/1352458519885613.Search in Google Scholar PubMed PubMed Central
16. Kuhle, J, Kropshofer, H, Haering, DA, Kundu, U, Meinert, R, Barro, C, et al.. Blood neurofilament light chain as a biomarker of MS disease activity and treatment response. Neurology 2019;92:e1007–15. https://doi.org/10.1212/wnl.0000000000007032.Search in Google Scholar PubMed PubMed Central
17. Sejbaek, T, Nielsen, HH, Penner, N, Plavina, T, Mendoza, JP, Martin, NA, et al.. Dimethyl fumarate decreases neurofilament light chain in CSF and blood of treatment naïve relapsing MS patients. J Neurol Neurosurg Psychiatry 2019;90:1324–30. https://doi.org/10.1136/jnnp-2019-321321.Search in Google Scholar PubMed PubMed Central
18. Cantó, E, Barro, C, Zhao, C, Caillier, SJ, Michalak, Z, Bove, R, et al.. Association between serum neurofilament light chain levels and long-term disease course among patients with multiple sclerosis followed up for 12 years. JAMA Neurol 2019;76:1359–66. https://doi.org/10.1001/jamaneurol.2019.2137.Search in Google Scholar PubMed PubMed Central
19. Barro, C, Benkert, P, Disanto, G, Tsagkas, C, Amann, M, Naegelin, Y, et al.. Serum neurofilament as a predictor of disease worsening and brain and spinal cord atrophy in multiple sclerosis. Brain 2018;141:2382–91. https://doi.org/10.1093/brain/awy154.Search in Google Scholar PubMed
20. Rosso, M, Gonzalez, CT, Healy, BC, Saxena, S, Paul, A, Bjornevik, K, et al.. Temporal association of sNfL and gad-enhancing lesions in multiple sclerosis. Ann Clin Transl Neurol 2020;7:945–55. https://doi.org/10.1002/acn3.51060.Search in Google Scholar PubMed PubMed Central
21. Thebault, S, Reaume, M, Marrie, RA, Marriott, JJ, Furlan, R, Laroni, A, et al.. High or increasing serum NfL is predictive of impending multiple sclerosis relapses. Mult Sclerosis Rel Disord 2022;59:103535. https://doi.org/10.1016/j.msard.2022.103535.Search in Google Scholar PubMed
22. Kuhle, J, Nourbakhsh, B, Grant, D, Morant, S, Barro, C, Yaldizli, Ö, et al.. Serum neurofilament is associated with progression of brain atrophy and disability in early MS. Neurology 2017;88:826–31. https://doi.org/10.1212/wnl.0000000000003653.Search in Google Scholar PubMed PubMed Central
23. Seiberl, M, Feige, J, Hilpold, P, Hitzl, W, Machegger, L, Buchmann, A, et al.. Serum neurofilament light chain as biomarker for cladribine-treated multiple sclerosis patients in a real-world setting. Int J Mol Sci 2023;24:4067. https://doi.org/10.3390/ijms24044067.Search in Google Scholar PubMed PubMed Central
24. Barrero Hernández, FJ, Romero Villarrubia, A, Muñoz Fernández, C, Guillén Martinez, V, Aguilera Del Moral, A, Barrios-López, JM, et al.. Real-world study of serum neurofilament light chain levels in ocrelizumab-treated people with relapsing multiple sclerosis. J Pers Med 2024;14:692. https://doi.org/10.3390/jpm14070692.Search in Google Scholar PubMed PubMed Central
25. Paolicelli, D, Ruggieri, M, Manni, A, Gargano, CD, Carleo, G, Palazzo, C, et al.. Real-life experience of the effects of cladribine tablets on lymphocyte subsets and serum neurofilament light chain levels in relapsing multiple sclerosis patients. Brain Sci 2022;12:1595. https://doi.org/10.3390/brainsci12121595.Search in Google Scholar PubMed PubMed Central
26. Benatar, M, Ostrow, LW, Lewcock, JW, Bennett, F, Shefner, J, Bowser, R, et al.. Biomarker qualification for neurofilament light chain in amyotrophic lateral sclerosis: theory and practice. Ann Neurol 2024;95:211–6. https://doi.org/10.1002/ana.26860.Search in Google Scholar PubMed PubMed Central
27. Adler, C, Onur, OA, Braumann, S, Gramespacher, H, Bittner, S, Falk, S, et al.. Absolute serum neurofilament light chain levels and its early kinetics predict brain injury after out-of-hospital cardiac arrest. J Neurol 2022;269:1530–7. https://doi.org/10.1007/s00415-021-10722-3.Search in Google Scholar PubMed PubMed Central
28. Mondésert, E, Schraen-Maschke, S, Quadrio, I, Bousiges, O, Bouvier, D, Delaby, C, et al.. A French multicenter analytical evaluation of the automated lumipulse G sNfL blood assay (Fujirebio®) and its comparison to four other immunoassays for serum neurofilament light chain assessment in clinical settings. Clin Chim Acta 2025;565:120007. https://doi.org/10.1016/j.cca.2024.120007.Search in Google Scholar PubMed
29. Shaw, G, Madorsky, I, Li, Y, Wang, Y, Jorgensen, M, Rana, S, et al.. Uman-type neurofilament light antibodies are effective reagents for the imaging of neurodegeneration. Brain Commun 2023;5:fcad067. https://doi.org/10.1093/braincomms/fcad067.Search in Google Scholar PubMed PubMed Central
30. Altmann, P, Leutmezer, F, Zach, H, Wurm, R, Stattmann, M, Ponleitner, M, et al.. Serum neurofilament light chain withstands delayed freezing and repeated thawing. Sci Rep 2020;10:19982. https://doi.org/10.1038/s41598-020-77098-8.Search in Google Scholar PubMed PubMed Central
31. Arranz, J, Ferrer, R, Zhu, N, Rubio-Guerra, S, Rodríguez-Baz, Í, Arriola-Infante, JE, et al.. Prospective evaluation of plasma pTau217 stability for the detection of Alzheimer’s disease in a tertiary memory clinic. Alzheimer’s Res Ther 2025;17:150. https://doi.org/10.1186/s13195-025-01779-7.Search in Google Scholar PubMed PubMed Central
32. Panikkar, D, Vivek, S, Crimmins, E, Faul, J, Langa, KM, Thyagarajan, B. Pre-analytical variables influencing stability of blood-based biomarkers of neuropathology. J Alzheimer’s Dis 2023;95:735–48. https://doi.org/10.3233/jad-230384.Search in Google Scholar
33. van Lierop, ZYGJ, Verberk, IMW, van Uffelen, KWJ, Koel-Simmelink, MJA, In ’t Veld, L, Killestein, J, et al.. Pre-analytical stability of serum biomarkers for neurological disease: neurofilament-light, glial fibrillary acidic protein and contactin-1. Clin Chem Lab Med 2022;60:842–50. https://doi.org/10.1515/cclm-2022-0007.Search in Google Scholar PubMed
34. Verberk, IMW, Misdorp, EO, Koelewijn, J, Ball, AJ, Blennow, K, Dage, JL, et al.. Stability of the novel blood-based biomarkers under pre-analytical sample handling conditions: results of the SABB-GBSC working group. Alzheimer’s Dementia 2021;17:e055441. https://doi.org/10.1002/alz.055441.Search in Google Scholar
Supplementary Material
This article contains supplementary material (https://doi.org/10.1515/cclm-2025-1476).
© 2025 the author(s), published by De Gruyter, Berlin/Boston
This work is licensed under the Creative Commons Attribution 4.0 International License.