At-home blood collection for clinical chemistry analyses in a kidney transplant population: a feasibility study
-
Jorrit Hoekstra


Abstract
Objectives
To investigate the feasibility of at-home collection of liquid capillary blood samples for clinical chemistry analyses.
Methods
Kidney transplant recipients performed a fingerprick to collect capillary blood samples. Samples were kept at room temperature for 24 h before further processing. Results were compared to results obtained from venipuncture samples using Passing-Bablok analysis and by calculating mean relative differences, which were compared to CLIA and TEa acceptance limits. In addition, transport times/temperatures and effects of postal handling were examined.
Results
Of 38 patients that performed a fingerprick, 29 properly filled 2 microtainers, 4 filled 1 microtainer and 5 were unable to fill any microtainer. Capillary samples were generally more hemolytic, but we found mean differences within CLIA/TEa for hemoglobin, leukocytes, hemoglobinA1c, creatinine, alanine transaminase, C-reactive protein, albumin, calcium and gamma-glutamyl transferase. For alkaline phosphatase and thrombocytes, we found a negative bias, but mean differences within CLIA/TEa. Mean differences for potassium, aspartate transaminase, hematocrit and mean corpuscular volume exceeded CLIA and/or total allowable error (TEa). For phosphate, individual samples showed large variation. Transport times did not exceed 24 h, but temperatures up to 10 °C above outside temperatures were observed. Transport of samples resulted in slight increases in H-index, lactate dehydrogenase (LDH) and aspartate transaminase (ASAT).
Conclusions
At-home capillary blood collection is feasible for many patients and samples are suitable for a subset of clinical chemistry analyses. Instruction, monitoring of transport time/temperature and knowledge of the pitfalls when interpreting results are key elements upon implementation in clinical practice.
Introduction
Laboratory diagnostics are an essential part of the medical diagnostic process. Traditionally, blood is obtained by venipuncture, which is performed by trained phlebotomists. The increasing demand for care and thus increasing burden on the healthcare system has led to more research on remote treatment, telehealth strategies, care networks and centralization of (complex) treatments/procedures. For example, accelerated by the Covid-19 pandemic, the use of video/telephone consultations has significantly increased over the last years. These developments make hospital visits redundant in many situations, but for venipuncture procedures patients are still often required to visit a blood collection facility. This is particularly relevant for patients who live far from their (tertiary) care center and require frequent laboratory testing such as transplant recipients in the early post-transplant period.
At-home blood collections and subsequent transport of blood samples to the laboratory by post or courier, could possibly reduce the number of hospital visits (and thus traveling time and -costs) and may increase patient self-management. Even with physical consultations, at-home blood collection prior to the visit could result in availability of all results at the time of the visit, with more efficient consultations as a result. Self-sampling/capillary blood collection can be performed at-home. The most used sites for capillary collection are the fingertips of the middle and ring finger for adults and the heel for neonates. Capillary sampling is usually performed using contact-activated lancets to puncture the tissue. After collection, blood can be kept liquid or the blood can be collected in/onto filter paper (dried blood spots). For kidney transplant patients, at-home dried blood spot (DBS) collection for therapeutic drug monitoring is already clinical practice [1], 2] and DBS are widely used in newborn screening. However, processing DBS is rather labor-intensive, varying hematocrits may result in variation of the sample spots and the typically low sample volumes obtained by DBS require highly sensitive analytical methods, mainly mass spectrometry [3]. This makes DBS generally less suitable for use in (often highly automated) routine clinical chemistry and hematology laboratories and to our knowledge, DBS have not been validated for routine clinical chemistry analytes or cell counts. Therefore, we investigated liquid capillary collections as an alternative approach to self-sampling in kidney transplant recipients.
The amounts of blood required for routine clinical chemistry/hematology tests have decreased tremendously over the past decades, but in commonly used analysers still ˜250 µL whole blood or plasma is needed for sets of hemocytometry and chemistry analyses respectively. Obtaining these amounts of blood using capillary sampling is a challenge. In addition, the quality of capillary samples is generally inferior to venous samples, due to contamination with tissue fluids, the occurrence of clots and ‘milking’, which may result in increased hemolysis and effects on other parameters [4]. Furthermore, the stability of different analytes in whole blood varies widely, ranging from a few hours to days, and is also influenced by temperature [5], [6], [7]. Thus, transport at temperatures suitable for the analytes of interest and timely transport of at-home collected blood to the laboratory are essential.
The University Medical Centre in Groningen (UMCG) is an academic center in the Northern-Netherlands, with expertise on specific and rare diseases. Therefore, the UMCG is visited by patients from the entire country and some patients thus have to travel rather large distances for a hospital visit. The transplant center of the UMCG has one of the largest transplant programs in the Netherlands. Yearly, approximately 175 kidney transplants are performed, and laboratory analyses post-transplantation are essential to monitor transplant function as well as immunosuppressant levels. At-home blood collections could reduce the number of hospital visits for these patients, facilitate the use of video/telephone consultations and may result in more patient empowerment. With this study, we aimed to investigate the feasibility of at-home blood collections and subsequent transport of samples by post in a group of kidney transplant recipients, for monitoring of routine clinical chemistry and hematology analyses.
Materials and methods
Study population
Kidney transplant patients who visited the outpatient clinic for regular follow-up, including a venipuncture at the UMCG were eligible. All participants gave written informed consent. This study was performed in 2022–2023 with the purpose of improving patient care. Under Dutch legislation this study was not in need of review by the medical ethics committee.
Venous blood collection
Venipuncture was performed for routine healthcare follow-up, by trained phlebotomists using a vacutainer blood collection system according to local procedures. Lithium heparin tubes with plasma separator and K2EDTA tubes (BD Vacutainer® or KIMA Vacutest®) were used for chemistry and hematology analyses respectively. Blood was immediately transported by pneumatic tube transport to the clinical chemistry lab for further processing/laboratory testing.
Capillary blood collection under supervision
Capillary blood collection was performed by patients themselves, at the blood collection facility of the UMCG. Time between venipuncture and capillary collection varied from 15–60 min. Capillary collection was performed under supervision. Patients first received instructions on how to perform the fingerprick and how to fill the microtainers. Special attention was given to warming of the hands and mixing the tubes. For the latter, participants were instructed to gently invert the tubes at least 8–10 times directly after filling, and to prevent shaking. After cleaning the puncture site with a 70 % alcohol tissue, the fingerprick was performed on the side of the fingertip of the middle or ring finger, using a contact-activated lancet (21 G × 2 mm, Becton Dickinson). Patients were asked to wipe off the first drop and then collect the blood drops in 2 microtubes; first a K2EDTA container (Microtainer® MAP, BD) with ± 250 µL blood, followed by a plasma-separator lithium heparin container (Minicollect®, Greiner BioOne) with ± 600 µL blood. To mimic postal transport from home to the laboratory, the microtainers with whole blood were kept for 24 hours at room temperature before measurements/further processing.
To assess feasibility and patient experience, patients who performed the capillary collection were asked to fill out a questionnaire afterwards.
Capillary blood collection at-home
All patients that participated in the capillary collection under supervision in the UMCG, were asked if they were willing to perform another capillary blood collection at home, without supervision. Collected samples were sent to the laboratory by post. Received samples were assessed for sample volume and quality.
Laboratory measurements
All (pre-)analytical activities/measurements were performed at the ISO15189:2012 accredited Central Laboratory of the department of Laboratory Medicine. Lithium heparin (micro)tubes were centrifuged for 5 min at 1885 g and used for chemistry analyses. K2EDTA (micro)tubes were mixed and used for hemocytometry and HbA1c analyses. Routine venipuncture samples were measured directly.
Since the amount of blood that can be obtained with capillary collection is limited, we made a selection of clinical chemistry/hematology parameters that are important in the follow-up of kidney transplant patients: aspartate transaminase (ASAT), alanine transaminase (ALAT), albumin (using BCG method), alkaline phosphatase (ALP), gamma-glutamyl transferase (GGT), creatinine, C-reactive protein (CRP), calcium, phosphate, sodium (Na), potassium (K) and the hemolytic index (H-index) were measured on a Roche Cobas 8000 platform. Hemoglobin (Hb), hematocrit (Ht), leukocytes (WBC count), thrombocytes (PLT count) and mean corpuscular volume (MCV) were determined using a Sysmex XN-9000 hematology analyzer and hemoglobin A1c (HbA1c) was measured on a TOSOH G8.
Transport by post: time and temperature
Transport of samples should take place within established time- and temperature ranges. In the Netherlands, blood samples (UN3373 biological samples) can be sent using regular post in envelopes containing a ‘medical post’ sign. PostNL is the largest postal company in the country, and they offer general mailboxes as well as mailboxes with a ‘medical post’ sign, which are usually located indoors. For medical post, PostNL guarantees maintenance at room temperature and delivery the next day.
To examine if these time and temperature claims are met, we posted medical post envelopes in different mailboxes in the Northern Region. In total 29 envelopes were posted on 2 different days, using 1 general mailbox (outside location) and 2 medical post mailboxes (indoor locations). Transport time was monitored for each envelope; temperature (Tubesense® logger) was monitored in 10 envelopes.
Transport by post: effects of postal handling on sample integrity
Envelope handling during the postal process (collection, sorting, transport) could result in hemolysis of whole blood samples. Therefore, we included whole blood samples in the medical post envelopes and examined analytes that are influenced by hemolysis after transport by mail. For this, we used K2EDTA whole blood that was left-over from routine hematology testing. The blood was kept at room temperature for ± 24 h before use in these experiments. The K2EDTA whole blood was then mixed and used to fill lithium heparin microtainers (Minicollect®, Greiner BioOne). Since improper filling of tubes may result in more vigorous mixing with increased hemolysis as a result, we prepared two microtainers for each envelope. One microtainer was filled with the maximum amount of blood as indicated by the manufacturer (800 µL) and the other was filled with half of the maximum amount (400 µL). As a control, a third lithium heparin microtainer was filled with 800 µL of K2EDTA whole blood and kept at the laboratory. Blood samples were packed according to Dutch legislation for transport of biological samples (UN3373). Upon arrival at the lab, blood samples (including the control) were centrifuged (1885 g × 5 min) and the H-index, lactate dehydrogenase (LDH) and ASAT concentrations were determined in plasma (containing both K2EDTA and lithium heparin) on the Cobas8000 platform (Roche).
Statistics
Bland-Altman plots were generated and Passing-Bablok analyses were performed to assess comparability of results in venous and capillary samples. In addition, mean relative differences were calculated and compared to Clinical Laboratory Improvement Amendments (CLIA) acceptance limits for proficiency testing and to the desirable total allowable error (TEa). TEa was calculated using the EFLM biological variation database, which uses the formula 1.65 × (0.5 × CVI) + 0.25 × (CVI2 + CVG2)1/2 [8]. For blood sent by post, mean relative differences were calculated and compared to CLIA and TEa limits. All statistics were performed using Microsoft Analyse-it.
Results
Capillary blood collection under supervision
Thirty-eight kidney transplant recipients gave written informed consent and performed a capillary blood collection under supervision. Twenty-nine patients (76 %) were able to fill 2 microtainers, four patients (11 %) succeeded in collecting sufficient blood in 1 microtainer (2× K2EDTA and 2× lithium heparin) and five patients (13 %) were unable to fill any container. In the group that was able to fill both microtainers, 20 patients required 1 fingerprick, eight patients required 2 fingerpricks and one patient required 3 fingerpricks.
This resulted in 29 lithium heparin microtainers, of which 27 contained enough blood for all measurements and 2 had sufficient blood for some chemistry measurements. In total, 31 K2EDTA microtainers were obtained of which 27 were suitable for measurements. (Micro)clots were found in 4 K2EDTA microtainers and therefore, these were excluded from hematology measurements. Five microtainers contained sufficient whole blood for Hb, Ht, MCV, WBC and PLT measurements, but not for HbA1c measurements. Table 1 shows the number of measurements for each analyte.
Passing-Bablok intercept and slope, % mean difference and CLIA/TEa limits for each analyte.
| Analyte | n | PB intercept + 95 % CI | PB slope + 95 % CI | % Mean difference + 95 % CI | TEa, % | Within TEa | CLIA | Within CLIA |
|---|---|---|---|---|---|---|---|---|
| Within TEa/CLIA | ||||||||
|
|
||||||||
| Hb, mmol/L | 27 | 0.20 (−0.53 to 0.71) | 1.00 (0.93 to 1.10) | 2.67 (1.401 to 3.944) | 3.9 | Yes | 4 % | Yes |
| PLT, 109/L | 27 | −49.5a (−86.0 to −13.9) | 1.15 (1.00 to 1.26) | −7.06 (−14.77 to 0.65) | 10.5 | Yes | 25 % | Yes |
| WBC, 109/L | 27 | −0.14 (−1.14 to 1.07) | 1.09 (0.95 to 1.21) | 5.75 (−0.46 to 11.95) | 14.3 | Yes | 10 % | Yes |
| ALAT, U/L | 27 | −0.31 (−2.56 to 3.00) | 1.06 (0.92 to 1.17) | 4.49 (0.80 to 8.19) | 18.5 | Yes | 15 % or 6 U/L | Yes |
| ALP, U/L | 27 | 1.00 (−5.05 to 5.98) | 0.89a (0.84 to 0.99) | −8.73 (−10.93 to −6.52) | 10.4 | Yes | 20 % | Yes |
| Albumin, g/L | 29 | −1.00 (−11 to 14) | 1.00 (0.67 to 1.25) | −1.63 (−3.14 to −0.13) | 3.3 | Yes | 8 % | Yes |
| Calcium, mmol/L | 29 | 0.05 (−0.49 to 0.32) | 1.00 (0.89 to 1.23) | 2.04 (1.16 to 2.92) | 2.2 | Yes | 1 mg/dL (0.25 mmol/L) | Yes |
| Creatinine, mmol/L | 29 | 5.19 (−4.00 to 9.91) | 0.95 (0.91 to 1.00) | −1.57 (−2.85 to −0.29) | 7.8 | Yes | 10 % | Yes |
| CRP, mg/L | 29 | 0.08 (0–0.14) | 0.99 (0.93 to 1.00) | 1.26 (−3.31 to 5.83) | 52.1 | Yes | 30 % or 1 mg/L | Yes |
| GGT, U/L | 27 | 2.95a (1.00 to 4.73) | 0.97 (0.91 to 1.00) | 5.75 (1.17 to 10.32) | 18.2 | Yes | 15 % or 5 U/L | Yes |
| HbA1c, mmol/mol | 22 | −0.83 (−2.70 to 1.00) | 1.03 (1.00 to 1.08) | 1.17 (0.08 to 2.26) | 3.1 | Yes | 8 % | Yes |
| Phosphate, mmol/L | 29 | −0.44 (−1.29 to 0.03) | 1.51a (1.04 to 2.36) | 7.37 (−2.54 to 17.28) | 9.6 | Yes | 10 % or 0.3 mg/dL (0.10 mmol/L) | Yes |
| Sodium, mmol/L | 29 | −68.5 (−166 to 0) | 1.50 (1.00–2.20) | 0.39 (−0.13 to 0.91) | 0.7 | Yes | 4 mmol/L | Yes |
|
|
||||||||
| Outside TEa/CLIA | ||||||||
|
|
||||||||
| Ht, L/L | 27 | 0.03 (−0.01 to 0.03) | 1.00 (1.00 to 1.09) | 6.51 (5.19 to 7.84) | 3.9 % | No | 4 % | No |
| MCV, fL | 27 | −1.87 (−16.40 to 10.4) | 1.06 (0.93 to 1.22) | 4.11 (3.68 to 4.54) | 1.7 % | No | NA | NA |
| ASAT, U/L | 27 | −8.34 (−32.5 to 3.96) | 1.46 (0.93 to 2.72) | 16.04 (6.48 to 25.60) | 12.2 % | No | 15 % or 6 U/L | No |
| Potassium, mmol/L | 29 | −2.20 (−10.67 to 0.80) | 1.75 (1.00 to 3.83) | 22.76 (17.49 to 28.02) | 4.9 % | No | 0.3 mmol/L | No |
| H-index, umol/L | 29 | NA | NA | 87.46 (50.50 to 124.42) | NA | NA | ||
-
Hb, hemoglobin; PLT, platelet count; WBC, white blood cell (leukocytes); ALAT, alanine transaminase; ALP, Alkaline Phosphatase; CRP, C-reactive protein; GGT, gamma-glutamyl transferase; HbA1c, hemoglobin A1c; Ht, hematocrit; MCV, mean corpuscular volume; ASAT, aspartate transaminase. aSignificant intercept/slope.
ASAT, LDH and H-index measurements on full and half full microtainers sent by post.
| Analyte | n | Average concentrations | Mean relative difference, % | TEa | Within TEa | CLIA | Within CLIA | |||
|---|---|---|---|---|---|---|---|---|---|---|
| Control (no transport) | Full sample (after transport) | Half fulI sample (after transport) | Full sample–control | Half full sample–control | ||||||
| LDH, U/L | 29 | 483±182 | 529±198 | 513±204 | 8.9 (4.3 to 13.5) | 6.9 (2.7 to 11.0) | 6.8 % | No | 15 % | Yes |
| ASAT, U/L | 29 | 41±22 | 44±23 | 43±24 | 6.7 (2.8 to 10.6) | 6.3 (2.5 to 10.1) | 15 % or 6 U/L | Yes | 12.2 % | Yes |
| H-index, µmol/L | 29 | 12±15 | 15±17 | 17±18 | 25.7 (7.7 to 43.7) | 32.5 (18.3 to 46.7) | NA | NA | NA | NA |
-
LDH, lactate dehydrogenase; ASAT, aspartate transaminase, H-index, hemolytic index.
Comparison of venous samples and capillary samples (24 h)
Figure 1 shows Bland-Altman plots for Hb, PLT, WBC, ALAT, ALP, albumin, calcium, creatinin, CRP, GGT, HbA1c, phosphate, sodium, Ht, MCV and the H-index. Table 1 lists Passing-Bablok intercepts and slopes for all measured analytes and depicts the mean relative differences and the CLIA and TEa acceptance limit for each analyte.


Bland-Altman plots showing absolute difference between venous and capillary samples. Venous samples were measured directly after collection and capillary samples were kept at room temperature for 24 h. In grey: identity lines, in black: mean difference lines, dashed lines: total allowable error (TEa) acceptence limits. PLT=platelet count, WBC=white blood cells (leukocytes), ALAT=alanine transaminase, ALP=alkaline phosphatase, CRP=C-reactive protein, GGT=gamma-glutamyl transferase, HbA1c=hemoglobin A1c, Ht=hematocrit, MCV=mean corpuscular volume, H-index=hemolytic index. Bland-Altman plots for hematocrit, platelet count, WBC count and HbA1c. Venous samples were measured directly after collection, capillary samples were kept at room temperature for 24 hours. Bland-Altman plots for alkaline phosphatase, albumin, sodium, calcium, phosphate and GGT. Venous samples were measured directly after collection, capillary samples were kept at room temperature for 24 hours.
For Hb, PLT, WBC, ALAT, ALP, albumin, calcium, creatinine, CRP, GGT, HbA1c, phosphate and sodium, mean relative differences were within CLIA and TEa acceptance limits. Passing-Bablok slopes and intercepts were non-significant, except for PLT and GGT (significant intercepts), ALP and Phosphate (significant slopes). Indeed we observed a negative bias for ALP and PLT in capillary samples, although the differences were within CLIA and TEa limits. For PLT, in one capillary sample the result was 187 109/L lower than in the venous sample, possibly due to (micro)clots that were not detected. GGT showed a significant intercept of 2.9 U/L, which we consider clinically not relevant, in line with the mean relative difference that is well within CLIA and TEa limits. For sodium, the mean relative difference passed CLIA and TEa limits, but the variations were somewhat large.
For MCV and Ht we found a positive bias in capillary samples and mean relative differences were outside CLIA/TEa limits. For phosphate, the mean relative difference was within CLIA and TEa limits, but Passing-Bablok analysis showed a significant slope of 1.51 mmol/L and for 18 of 29 samples the absolute difference exceeded the CLIA limit of 0.1 mmol/L (3 mg/dL).
As expected, capillary samples generally were more hemolytic than venous samples (Figure 1, H-index). Hemolysis also affects concentrations of known intra-cellular analytes such as ASAT and potassium (bland-altman plots shown in Figure 2, left). Figure 2 on the right shows Bland-Altman plots for ASAT and potassium without hemolytic samples, where hemolytic samples were defined as samples with a difference in H-index between the capillary- and the venous sample higher than our cut-off for interference on the test (for ASAT: difference in H-index >25 μmol/L, for potassium: difference in H-index >30 μmol/L). Upon exclusion of hemolytic samples, agreement for ASAT improved, demonstrating that the differences between venous and capillary samples were in large part caused by hemolysis. For potassium, bias remained 1.15 mmol/L, most likely due to a known stability effect.
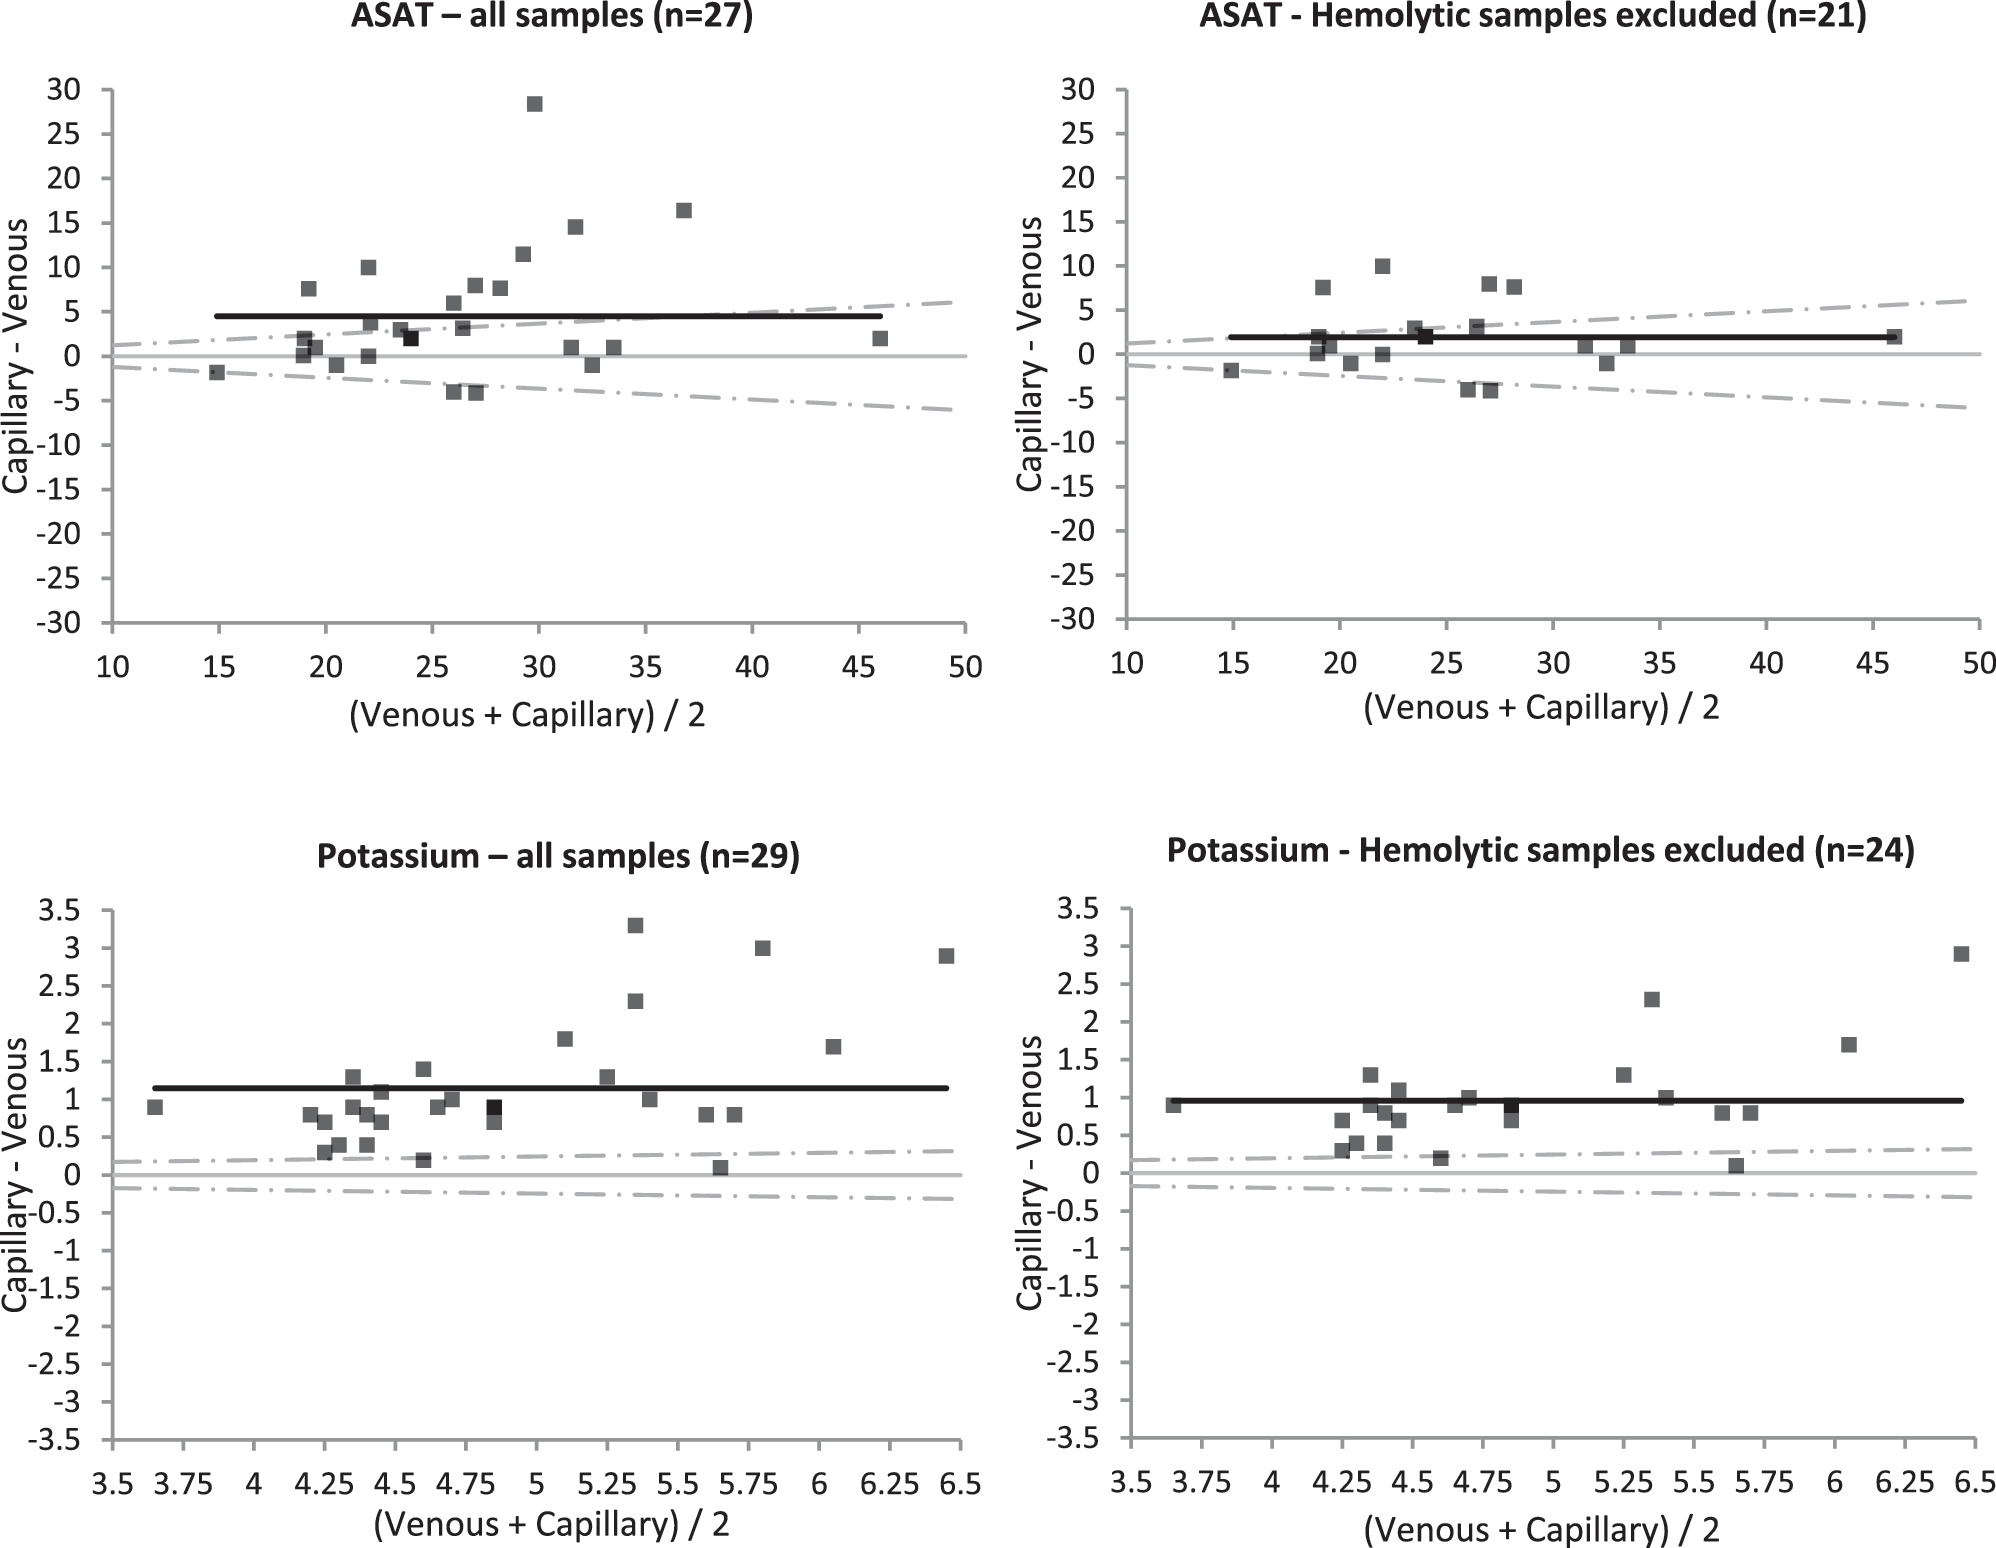
Bland-Altman plots for aspartate transaminase (ASAT) and potassium. Venous samples were measured directly after collection, capillary samples were kept at room temperature for 24 h. On the left: all samples. On the right: only samples where the differences in hemolytic index between the venous and capillary samples was below the cut-off for interference (for ASAT <25 μmol/L, for potsassium <30 μmol/L). In grey: identity lines, in black: mean difference lines, dashed lines: total allowable error (TEa) acceptence limits.
Patient assessment
All 29 patients that succeeded in collecting two microtainers ‘agreed’ or ‘completely agreed’ that the capillary collection generally went well and that the fingerprick was not painful. Patients that were not able to collect sufficient amounts of blood, were ‘neutral’ or ‘disagreed’. Less traveling was considered the biggest advantage of self-sampling.
Capillary blood collection at home
All patients were asked to perform a second collection at-home. We received at-home collected samples from 16 patients. Reasons for not performing a second collection were being unable to fill microtainers the first time, forgetting, and the fact that this was an extra collection that was not used for measurements. Of the returned collections, seven (44 %) contained 2 properly filled microtainers, five (31 %) contained 1 properly filled microtainer and four (25 %) contained 0 properly filled microtainers. Of the rejected microtainers, most did not contain enough blood and 5 microtainers were not suitable for measurements because of leaking (lid not properly closed) or clots (due to improper mixing or problems in the collection).
Shipment by post: time and temperature
All 29 envelopes that were posted in a medical post box were delivered to the lab the next day before 10.00 am. The medical post boxes are emptied at 17.00 hours. Thus, when posting envelopes just before emptying, transport time is approximately 17 h. Temperature was monitored in 10 envelopes posted at 3 different locations (1 general outdoor mailbox, 2 indoor medical post boxes) on 2 different sunny days in May 2022. With maximum outside temperatures of 25–28 °C on these days, the temperature in the outdoor mailbox reached a maximum of 35 °C. Temperatures in the indoor medical post mailboxes did not exceed 25 °C.
Transport by post: effects of postal handling on sample integrity
As shown in Table 2, we found increased LDH, ASAT and H-index in blood samples that were sent by post, compared to control samples that were stored in the laboratory. However, for ASAT, the mean relative differences for both full and half full samples were within CLIA and TEa limits and for LDH, the mean relative difference was outside TEa, but within CLIA limits. In microtainers that were half full, the average H-index was slightly higher than in full samples, but in contrast, LDH and ASAT showed lower values in half full samples, suggesting that incomplete filling of microtainers does not increase the risk of hemolysis during transport.
Discussion
At-home blood collection as an alternative for venipuncture procedures is gaining interest, as it may increase patient self-management, reduce traveling time and -costs and pressure on a burdened healthcare system [9]. There are many examples of at-home blood collections using dried blood spots (DBS) including therapeutic drug monitoring [10], serological surveys [11] and follow up for phenylketonuria [12]. However, measurements on DBS are practically challenging and there are some concerns over the comparability between DBS and plasma measurements [10], 12]. Capillary sampling of liquid whole blood using small blood collection containers is a well-known in-hospital method for blood sampling. At-home collections are also offered by several parties in the direct-to-consumer market. However, studies on at-home blood collections are limited. Ansari et al. compared 15 clinical chemistry analytes in venous and capillary samples, where capillary samples were stored at room temperature for 72 h and concluded that a selection of analytes is suitable for at-home collections. In addition, they asked patients to self-sample at home, which resulted in 82 % of patients returning samples. They also reported that 70–80 % of patients found capillary sampling easy and would recommend it to others [13].
Though we stored samples for only 24 h and investigated some different analytes, our findings were similar. We found that 76 % of included patients were able to obtain sufficient sample volumes upon self-sampling under supervision, though when the capillary collection was performed at-home without supervision, the percentage of two properly filled microtainers decreased to 44 %. In addition, we found increased amounts of hemolysis in capillary samples, demonstrating the difficulty of capillary collections. However, not all analytes are sensitive to hemolysis and most laboratories use flagging or interpretative comments on results from hemolytic samples. The success percentage may increase when patients perform a fingerprick more often and become more experienced. More practice may also result in less hemolytic samples.
In recent years, several devices became available to aid at-home self-sampling [14], 15]. Devices such as the TAP, RedDrop one, Comfort Draw and Tasso, are placed on the upper arm and use micro-capillaries and a vacuum to fill microtainers or blood spots. Recent studies on upper arm devices described good agreements between results from venous and capillary collections for inflammation markers and autoantibodies (intraclass correlation coefficients >95 %) [16] as well as for several clinical chemistry analytes [15]. Obtained amounts of blood and serum were comparable to traditional fingerprick collections, whereas associated pain was reported to be less with upper arm devices [15], 17]. A potential drawback with regards to combined clinical chemistry/hematology collections, is that the vacuum that these devices use to fill the blood tubes, is lost when the tube is removed. It is thus not (yet) possible to fill multiple tubes with one device. Another aid for fingerprick collections may be the BD® MiniDraw™ system, which contains a finger sleeve that is used to apply controlled pressure and to prevent excessive squeezing or ‘milking’ [18]. However, as of yet, this device is only intended for use by trained professional healthcare workers and has not been cleared for self-collection. Also, potassium, ASAT and platelet count, analytes known to be rapidly affected in capillary samples, are not on the FDA list of cleared analytes for the MiniDraw [4]. Although further research is needed, the use of upper-arm devices or other capillary collection aids may increase patient comfort and adoption of at-home self-sampling and may also increase success percentages.
Postal handling does not seem to have large effects on sample integrity. The increases that we found are comparable to effects of pneumatic tube transport, which are generally accepted as clinically not relevant [19]. In addition, our tests were performed with K2EDTA blood that had been stored for 24 h, and the relatively high LDH and H-index concentration in control samples suggest that this storage period may have led to cell leakage or more fragile cells. Effects on fresh samples therefore may be even smaller. Temperature however, could be an issue on warm or sunny days, as we noticed a rapid increase in temperature, reaching values up to 10°C above the outside temperature. Although not tested in this study, low temperatures (freezing) could have even more deteriorating effects as this would result in cell lysis. Therefore, clear patient instructions and if possible, the use of ‘medical post’ mailboxes that guarantee certain temperatures, are essential to maintain sample integrity. Temperature monitoring during transport is necessary to guard this.
When using capillary samples and comparing these to reference values or previous values determined in venous samples, one needs to verify that capillary and venous concentrations are comparable. Doeleman et al. recently demonstrated acceptable variations between venous and capillary samples for 34 routine clinical chemistry parameters [20] and for hematology parameters [21], when analyzed directly. For at-home sampling, analytes also need to be stable in whole blood during transport to the lab. In the Netherlands, medical post sent via PostNL is guaranteed to be delivered the next day and indeed, all posted envelopes were delivered the next day. Depending on when the envelope is put in the mailbox, this results in transport times of ˜17–24 hours. Steveral studies already described very limited stability for potassium, phosphate, Ht and MCV [5], 21]. In line with these findings, these analytes did not meet CLIA/TEa limits in our study. For the other analytes, we found stability for at least 24 h at room temperature (unpublished data), which was also published by others, although sodium and calcium were shown to be temperature-sensitive [5], 6]. Indeed, sodium showed rather large variation in our comparison and for calcium a bias of 2.04 % was observed, which was just within CLIA/TEa (2.2 %) limits. This small increase may be caused by mixing with interstitial fluids, which contain higher calcium concentrations [22]. For alkaline phosphatase, we observed a slight negative bias in capillary samples, which was within CLIA/TEa and is considered not clinically relevant. For PLT we also observed a slight negative bias. This is in line with the findings of Doeleman et al., who reported a mean difference of −8.1 % between venous and capillary samples that were analyzed directly [21]. Here, we also observed one significantly decreased value in a capillary sample, most likely the result of (micro)clots.
We propose that at-home capillary blood collections may be offered as an alternative to venous collections for Hb, PLT, WBC, ALAT, ALP, albumin, calcium, creatinine, CRP, GGT, HbA1c and sodium. Ht, MCV, ASAT, potassium and phosphate should be excluded. (Micro)clots may result in aberrant low PLT values. We suggest checking for clots in each sample, and low values should be verified by venipuncture. Such findings may lead to unnecessary anxiety, and we suggest careful consideration upon measuring PLT in capillary samples collected at-home.
After kidney transplantation, transplant- and liver function, electrolyte balance as well as immunosuppressant levels should be monitored. Potassium dysregulation, particularly hyperkalemia, is a common complication after kidney transplantation and may require repeated potassium monitoring, for which at-home capillary collections are thus not appropriate. In recipients with good kidney function and stable potassium levels, less frequent potassium measurements can be considered and in these cases at-home capillary collections could (partly) replace venipunctures. Furthermore, we discourage using at-home collections for ASAT measurements, but in many cases liver function may be monitored using ALAT only. For immunosuppressant monitoring, capillary liquid collection can be combined with DBS sampling, the suitability of capillary liquid samples for immunosuppressant levels remains to be determined. The clinical utility of at-home capillary blood collection thus strongly depends on the required parameters and individual patient characteristics, but may be a viable option in a large proportion of patients.
Our study has some limitations. Firstly, most of the measured values were within reference values and relatively few values were abnormal. However, we expect relative differences to be similar for values outside the reference range. Secondly, we simulated transport by keeping the samples in the laboratory for 24 hrs, which is a conditioned environment. As shown with our postal experiments, during actual transport, samples will be exposed to more temperature variations which may affect stability. Thirdly, the formula that we used to calculate the desirable TEa may result in overestimating TEa, but nevertheless it is widely used. Acceptable errors (differences) also depend on clinical decisions and may vary for different patient groups.
To conclude, we demonstrate that at-home liquid capillary blood collection is feasible for a large group of patients and can be used for selected clinical chemistry and hematology parameters. Further investigation is necessary to validate other parameters. Upon implementation in clinical practice, proper patient instruction and practice under supervision are key elements. Transport time and temperature affect sample stability and should be monitored. Furthermore, we strongly suggest that results be marked as at-home collected and to perform venipunctures as control when in doubt about capillary results.
-
Research ethics: All participants gave written informed consent. This study was performed in 2022–2023 with the purpose of improving patient care. Under Dutch legislation this study was not in need of review by the medical ethics committee.
-
Informed consent: Informed consent was obtained from all individuals included in this study, or their legal guardians or wards.
-
Author contributions: All authors have accepted responsibility for the entire content of this manuscript and approved its submission.
-
Use of Large Language Models, AI and Machine Learning Tools: None declared.
-
Conflict of interest: The authors state no conflict of interest.
-
Research funding: None declared.
-
Data availability: Raw data can be obtained on request from the corresponding author.
References
1. Veenhof, H, Koster, RA, Alffenaar, JWC, Berger, SP, Bakker, SJL, Touw, DJ. Clinical validation of simultaneous analysis of tacrolimus, cyclosporine a, and creatinine in dried blood spots in kidney transplant patients. Transplantation 2017;101:1727–33. https://doi.org/10.1097/tp.0000000000001591.Suche in Google Scholar PubMed
2. Veenhof, H, Koster, RA, Alffenaar, JWC, van den Berg, AP, de Groot, MR, Verschuuren, EAM, et al.. Clinical application of a dried blood spot assay for sirolimus and everolimus in transplant patients. Clin Chem Lab Med 2019;57:1854–62. https://doi.org/10.1515/cclm-2019-0053.Suche in Google Scholar PubMed
3. Antunes, MV, Charão, MF, Linden, R. Dried blood spots analysis with mass spectrometry: potentials and pitfalls in therapeutic drug monitoring. Clin Biochem 2016;49:1035–46. https://doi.org/10.1016/j.clinbiochem.2016.05.004.Suche in Google Scholar PubMed
4. Greene, DN, Cotten, SW, Pyle-Eilola, AL. Advances and skepticism for broad implementation of capillary collection devices. J Appl Lab Med 2025;10:1087–9. https://doi.org/10.1093/jalm/jfaf100.Suche in Google Scholar PubMed
5. van Balveren, JA, Huijskens, MJAJ, Gemen, EFA, Péquériaux, NCV, Kusters, R. Effects of time and temperature on 48 routine chemistry, haematology and coagulation analytes in whole blood samples. Ann Clin Biochem 2017;54:448–62. https://doi.org/10.1177/0004563216665868.Suche in Google Scholar PubMed
6. Oddoze, C, Lombard, E, Portugal, H. Stability study of 81 analytes in human whole blood, in serum and in plasma. Clin Biochem 2012;45:464–9. https://doi.org/10.1016/j.clinbiochem.2012.01.012.Suche in Google Scholar PubMed
7. Ellis, MJ, Livesey, JH, Evans, MJ. Hormone stability in human whole blood. Clin Biochem 2003;36:109–12. https://doi.org/10.1016/s0009-9120(02)00440-x.Suche in Google Scholar PubMed
8. European Federation of Laboratory Medicine. EFLM biological variation database. [Internet]. [cited 2025 Mar 30]. Available from: https://biologicalvariation.eu/bv_specifications.Suche in Google Scholar
9. Muehlensiepen, F, May, S, Zarbl, J, Vogt, E, Boy, K, Heinze, M, et al.. At-home blood self-sampling in rheumatology: a qualitative study with patients and health care professionals. BMC Health Serv Res 2022;22. https://doi.org/10.1186/s12913-022-08787-5.Suche in Google Scholar PubMed PubMed Central
10. Müller, IR, Linden, G, Charão, MF, Antunes, MV, Linden, R. Dried blood spot sampling for therapeutic drug monitoring: challenges and opportunities. Expet Rev Clin Pharmacol 2023;16:691–701. https://doi.org/10.1080/17512433.2023.2224562.Suche in Google Scholar PubMed
11. Aatresh, AV, Cummings, K, Gerstein, H, Knight, CS, Limberopolous, A, Stasi, MA, et al.. Development of at-home sample collection logistics for large-scale seroprevalence studies. PLoS One 2021;16. https://doi.org/10.1371/journal.pone.0258516.Suche in Google Scholar PubMed PubMed Central
12. Coene, KLM, Timmer, C, Goorden, SMI, ten Hoedt, AE, Kluijtmans, LAJ, Janssen, MCH, et al.. Monitoring phenylalanine concentrations in the follow-up of phenylketonuria patients: an inventory of pre-analytical and analytical variation. JIMD Rep 2021;58:70–9. https://doi.org/10.1002/jmd2.12186.Suche in Google Scholar PubMed PubMed Central
13. Ansari, S, Abdel-Malek, M, Kenkre, J, Choudhury, SM, Barnes, S, Misra, S, et al.. The use of whole blood capillary samples to measure 15 analytes for a home-collect biochemistry service during the SARS-CoV-2 pandemic: a proposed model from North West London pathology. Ann Clin Biochem 2021;58:411–21. https://doi.org/10.1177/00045632211004995.Suche in Google Scholar PubMed PubMed Central
14. Poland, DCW, Cobbaert, CM. Blood self-sampling devices: innovation, interpretation and implementation in total lab automation. Clin Chem Lab Med 2024;63:3–13. https://doi.org/10.1515/cclm-2024-0508.Suche in Google Scholar PubMed
15. Collier, BB, Brandon, WC, Chappell, MR, Iacovetti, G, Tokunaga, N, Schaff, UY, et al.. Comparing capillary blood collection technologies: assessing patient experience, device performance, & clinical accuracy. Bioanalysis 2025;17:1329–36. https://doi.org/10.1080/17576180.2025.2580284.Suche in Google Scholar PubMed PubMed Central
16. Knitza, J, Tascilar, K, Vuillerme, N, Eimer, E, Matusewicz, P, Corte, G, et al.. Accuracy and tolerability of self-sampling of capillary blood for analysis of inflammation and autoantibodies in rheumatoid arthritis patients–results from a randomized controlled trial. Arthritis Res Ther 2022;24. https://doi.org/10.1186/s13075-022-02809-7.Suche in Google Scholar PubMed PubMed Central
17. Solheim, SA, Ringsted, TK, Nordsborg, NB, Dehnes, Y, Levernæs, MCS, Mørkeberg, J. No pain, just gain: painless, easy, and fast dried blood spot collection from fingertip and upper arm in doping control. Drug Test Anal 2021;13:1783–90. https://doi.org/10.1002/dta.3135.Suche in Google Scholar PubMed
18. Parikh, M, Wimmer, C, DiPasquale, C, Barr, RL, Jacobson, JW. Evaluation of a novel capillary blood collection system for blood sampling in nontraditional settings as compared with currently marketed capillary and venous blood collection systems for selected general chemistry analytes. J Appl Lab Med 2025;10:639–52.10.1093/jalm/jfaf005Suche in Google Scholar PubMed
19. Kapoula, GV, Kontou, PI, Bagos, PG. The impact of pneumatic tube system on routine laboratory parameters: a systematic review and meta-analysis. Clin Chem Lab Med 2017;55:1834–44. https://doi.org/10.1515/cclm-2017-0008.Suche in Google Scholar PubMed
20. Doeleman, MJH, Koster, AF, Esseveld, A, Kemperman, H, Swart, JF, De, RS, et al.. Comparison of capillary finger stick and venous blood sampling for 34 routine chemistry analytes: potential for in the hospital and remote blood sampling. Clin Chem Lab Med 2024;63:747–52.10.1515/cclm-2024-0812Suche in Google Scholar PubMed
21. Doeleman, MJH, Esseveld, A, Huisman, A, de Roock, S, Tiel Groenestege, WM. Stability and comparison of complete blood count parameters between capillary and venous blood samples. Int J Lab Hematol 2023;45:659–67. https://doi.org/10.1111/ijlh.14080.Suche in Google Scholar PubMed
22. Schaafsma, G. Calcium in extracellular fluid: homeostasis. In: Nordin, BEC, editor. Calcium in Human Biology [Internet]. London: Springer London; 1988:241–59 pp.10.1007/978-1-4471-1437-6_10Suche in Google Scholar
© 2025 the author(s), published by De Gruyter, Berlin/Boston
This work is licensed under the Creative Commons Attribution 4.0 International License.