
The correlation of urea and creatinine concentrations in sweat and saliva with plasma during hemodialysis: an observational cohort study
-
Sophie Adelaars
 ,
Constantijn J.A.M. Konings
,
Constantijn J.A.M. Konings


Abstract
Objectives
Urea and creatinine concentrations in plasma are used to guide hemodialysis (HD) in patients with end-stage renal disease (ESRD). To support individualized HD treatment in a home situation, there is a clinical need for a non-invasive and continuous alternative to plasma for biomarker monitoring during and between cycles of HD. In this observational study, we therefore established the correlation of urea and creatinine concentrations between sweat, saliva and plasma in a cohort of ESRD patients on HD.
Methods
Forty HD patients were recruited at the Dialysis Department of the Catharina Hospital Eindhoven. Sweat and salivary urea and creatinine concentrations were analyzed at the start and at the end of one HD cycle and compared to the corresponding plasma concentrations.
Results
A decrease of urea concentrations during HD was observed in sweat, from 27.86 mmol/L to 12.60 mmol/L, and saliva, from 24.70 mmol/L to 5.64 mmol/L. Urea concentrations in sweat and saliva strongly correlated with the concentrations in plasma (ρ 0.92 [p<0.001] and 0.94 [p<0.001], respectively). Creatinine concentrations also decreased in sweat from 43.39 μmol/L to 19.69 μmol/L, and saliva, from 59.00 μmol/L to 13.70 μmol/L. However, for creatinine, correlation coefficients were lower than for urea for both sweat and saliva compared to plasma (ρ: 0.58 [p<0.001] and 0.77 [p<0.001], respectively).
Conclusions
The results illustrate a proof of principle of urea measurements in sweat and saliva to monitor HD adequacy in a non-invasive and continuous manner. Biosensors enabling urea monitoring in sweat or saliva could fill in a clinical need to enable at-home HD for more patients and thereby decrease patient burden.
Introduction
Plasma urea and creatinine concentrations are used to estimate exchange efficiency and guide hemodialysis (HD) in patients with end-stage renal disease (ESRD) [1]. These patients are required to visit the hospital multiple times a week, which affects their quality of life. This burden can possibly be reduced, by performing HD in a home situation. Also, individualizing HD treatment could improve the patients’ quality of life [2]. To enable individualized HD, transferable to a home situation, there is a clinical need for non-invasive alternatives to plasma for remote and continuous biomarker monitoring during and between cycles of HD.
In recent decades, the analysis of bio-fluids that are easily and non-invasively collectable, such as sweat and saliva, has gained scientific interest. Sweat is considered a biomarker-rich fluid that shows potential for clinical applications in diagnosis and monitoring of multiple diseases [3]. For instance, the chloride concentration in sweat is already being quantified in clinical practice to support the diagnosis of cystic fibrosis in young children [4].
In addition to sweat, saliva is a potential non-invasive alternative to plasma analysis during HD as the results of Lasisi et al. suggest a potential supporting role of salivary urea and creatinine in the diagnosis and monitoring of chronic kidney disease [5, 6].
Currently, there are no methods for continuous measurement of urea and creatinine concentrations in sweat and saliva enabling remote readout. However, technological advances in microfluidics make it possible to analyze small volumes of sweat by means of biosensors on the skin [7], [8], [9], [10]. In fact, while a variety of interesting biomarkers have been quantified in sweat [3] and saliva [11], the commercialization of technological innovations in the clinic is, among other challenges, hampered by the lack of knowledge about the correlation of biomarker concentrations in sweat and saliva with the patients’ plasma concentrations [12]. Sweat and saliva might not simply be an ultra-filtrate of plasma, meaning that sweat and salivary components may not only derive from blood through active transport or passive diffusion, but they may also partly originate from the sweat or salivary glands.
Urea and creatinine are both low-molecular-weight, water-soluble waste products that are normally excreted via urine [1]. To evaluate the potential of sweat and salivary urea and creatinine concentrations to estimate HD adequacy, the association between these and plasma concentrations should be assessed. To our knowledge this association has never been described with sweat and saliva combined, during HD. In this study, we therefore established the correlation and agreement of urea and creatinine concentrations between saliva, sweat and plasma in a cohort of ESRD patients on HD.
Materials and methods
Subjects
This paper is based on the observational clinical trial (UMIS Study) that is registered in the International Clinical Trials Registry Platform with main ID NL9831. The study was approved by the local Ethical Review Board and the Medical research Ethics Committees United (MEC-U), and written informed consent was obtained from each patient before participation. This study was carried out in accordance with the principles of the Declaration of Helsinki (Fortaleza, Brazil, October 2013) and in accordance with Dutch law. Forty hemodialysis patients were recruited at the Dialysis Department of the Catharina hospital in Eindhoven, The Netherlands. Exclusion criteria were as follows: aged<18 years, presence of an implanted device (e.g. defibrillator, neurostimulator, pacemaker, or ECG monitor), pregnancy, known allergy to any ingredient of the sweat test, damaged or denuded skin or other recent scar tissue at the sweat stimulation site, or cardiac conditions or suspected heart problems. The exclusion criteria were based on the contraindications of the Macroduct® Advanced for sweat gland stimulation, as described in the user manual.
Study design
A schematic overview of this observational cohort study design is shown in Figure 1. All 40 patients participated during one hemodialysis cycle, where plasma, sweat and salivary samples were collected at the start and at the end of the procedure.

Schematic timeline of study design. All patients (n=40) participate for one hemodialysis cycle, where plasma, sweat and salivary samples were collected at the start and the end of the treatment.
Sample collection and analysis
Plasma
Blood was drawn from each patient while connected to the HD machine. The dialysate flow was temporarily reduced from 300 to 100 mL/min during blood collection. All samples were centrifuged within 2 h after collection. Biomarker concentrations were determined using the Cobas Pro analyzer (Roche Diagnostics, Rotkreutz, Switzerland) with a kinetic method for urea (measuring range: 0.5–40 mmol/L, Limit of Quantitation [LoQ]: 0.5 mmol/L) and an enzymatic method for creatinine (measuring range: 5–2,700 μmol/L, LoQ: 10 μmol/L), according to standard operating procedures.
Sweat and saliva
Sweat samples were collected on the forearm with the Macroduct Advanced sweat collection system (Elitechgroup, Logan, Utah, USA), according to manufacturer’s instructions. In short, two electrodes (one anode and one cathode) were placed over agarose gel discs containing pilocarpine, that were in contact with the skin. A mild current (1.5 mA) allows the pilocarpine to enter the skin under the anode, where it activates the sweat glands. After 5 min of stimulation, the electrodes were removed, the arm was washed successively with alcohol and deionized water, and sweat was collected for 30 min with the Macroduct advanced sweat collector.
Saliva samples were obtained with the Salivette saliva collection method (Starsted, Nümbrecht, Germany). In short, patients were asked to refrain from eating, drinking or brushing their teeth for 30 min before saliva was collected. Patients were then asked to chew a cotton swab for 1 min and then spit the swab with all accumulated saliva into the collection tube. Samples were centrifuged at 2,495 rpm for 10 min and stored at −80 °C in cryogenic vials for a maximum of 3 weeks before analysis.
Analysis of sweat and saliva samples
Concentrations of urea and creatinine were determined with the Cobas Pro analyzer (Roche Diagnostics, Rotkreutz, Switzerland), using the plasma method. This method was validated for sweat and salivary samples with solutions in distilled H2O in 5 separate batches in the expected range of urea (0.5–40 mmol/L) and creatinine (5–250 μmol/L), with a maximum Coefficient of Variation (CV) of 10.48 % (data not shown). Sweat samples were diluted with distilled H2O to increase the collected volume to a higher sample volume (70 µL) that was sufficient as input for the Cobas analyzer.
Statistical analysis
All analyses were carried out using software R (version 4.2.3 or higher) with RStudio (version 2023.03.0 or higher) and a p-value of less than 0.05 was considered significant. The Shapiro-Wilk test combined with visual inspection of the QQ-plot were carried out to assess the normality of the data. When data was normally distributed, a student t-test was conducted to test for statistical differences. Otherwise, the difference between biomarker concentrations in different bio-fluids and at different time-points was tested for significance with the non-parametric Wilcoxon signed rank test for paired samples. Spearman’s correlation analysis was conducted to assess the strength of the association between biomarker concentrations in different bio-fluids. Linear regression analysis was used to estimate plasma urea and creatinine concentrations based on sweat and saliva measurements of urea and creatinine.
This concerns a study in which diagnostic methods were compared and was analyzed according to the EP9 protocol, as generally applied in clinical laboratories [13]. In this protocol, a number of 40 patients is recommended for an adequate method comparison study to determine and quantify the bias with sufficient statistical substantiation.
Results
Inclusion
Main patient characteristics are described in Table 1. Seventy-four patients met the inclusion criteria and were asked to participate. Thirty-three patients were not willing to participate and one patient was excluded based on health issues preventing participation. Forty patients were included in this study (27 males and 13 females). The median age was 71 (min: 22, max: 90) years, with no significant difference between genders (p=0.29).
Main patient characteristics.
| Variable | All patients (n=40) |
|---|---|
| Gender, men, n (%) | 27 (67.5 %) |
| Age, years (min.–max.) | 68 (22–90) |
| BMI, n (%) | |
| <18 | 2 (5.0 %) |
| 18–25 | 13 (32.5 %) |
| 25–30 | 17 (42.5 %) |
| >30 | 8 (20 %) |
| Postdialysis weight, mean ± SD in kg | 79.3 ± 19.3 |
| Access via AV shunt, n (%) | 26 (65.0 %) |
| Diabetes Mellitus, n (%) | 17 (42.5 %) |
| GFR (mL/min/1.73 m2) (median [IQR]) | 5.95 (4.98–8.15) |
| Type of dialyzer, n (%) | |
| Fx Cordiax 1000 | 26 (65 %) |
| Fx Cordiax 80 | 8 (20 %) |
| Nephral 500 | 6 (15 %) |
-
GFR, glomerular filtration rate; AV shunt, arteriovenous shunt.
Urea and creatinine concentrations
Table 2 summarizes the results of the urea and creatinine concentrations in plasma, sweat and saliva before and after HD. For six sweat samples at the start and nine sweat samples at the end of HD, there was not enough volume for accurate quantification of urea concentration and these were therefore excluded from further analysis. Remaining urea concentrations in the collected saliva and sweat samples were well above the detection limits of the laboratory tests (0.5 mmol/L). In plasma, the urea concentration decreased from 22.43 (18.75–26.25) mmol/L (median [IQR]) to 5.75 (4.08–7.55) mmol/L in the studied HD cycle. This decrease was also observed in sweat, from 27.86 (22.02–33.25) mmol/L to 12.60 (9.10–15.11) mmol/L, and saliva, from 24.70 (20.75–29.85) mmol/L to 5.64 (4.11–7.51) mmol/L. Concentrations in sweat were significantly higher than in plasma at the start and end of HD (p<0.001). Salivary urea concentrations were also significantly higher at the start (p<0.001), but not at the end of HD (Figure 2).
Biomarker concentrations pre- and post-dialysis. p-Values give the difference between the group median vs. plasma group median. All p-values are determined for paired measures only.
| Start of HD | End of HD | |||||||
|---|---|---|---|---|---|---|---|---|
| Biomarker | Biofluid | n | Concentration (median [IQR]) | p-Value for difference with plasma | n | Concentration (median [IQR]) | p-Value for difference with plasma | p-Value for difference start-end |
| Urea, mmol/L | Plasma | 40 | 22.50 (18.75–26.25) | – | 40 | 5.75 (4.08–7.55) | – | <0.001 |
| Sweat | 34 | 27.86 (22.02–33.25) | <0.001 | 31 | 12.60 (9.10–15.11) | <0.001 | <0.001 | |
| Saliva | 39 | 24.70 (20.75–29.85) | <0.001 | 40 | 5.64 (4.11–7.51) | 0.299 | <0.001 | |
| Creatinine, µmol/L | Plasma | 40 | 676.50 (509.20–853.50) | – | 40 | 211.50 (145.00–274.80) | – | <0.001 |
| Sweat | 26 | 43.39 (23.41–50.42) | <0.001 | 16 | 19.69 (17.22–27.34) | <0.001 | <0.001 | |
| Saliva | 39 | 59.00 (39.75–126.50) | <0.001 | 39 | 13.70 (10.55–25.70) | <0.001 | <0.001 | |

Boxplot of urea concentrations at the start and at the end of hemodialysis in plasma, sweat and saliva. Concentrations in sweat were significantly higher than in plasma at the start and end of HD (p<0.001). Salivary urea concentrations were also significantly higher at the start (p<0.001), but not at the end of HD.
In plasma, the median creatinine concentrations decreased from 676.50 (509.20–853.50) µmol/L to 211.50 (145.00–274.80) µmol/L in the studied HD cycle. A decrease was also observed in sweat, 43.39 (23.41–50.42) µmol/L to 19.69 (17.22–27.34) µmol/L, and saliva, from 59.00 (39.75–126.50) µmol/L to 13.70 (10.55–25.70) µmol/L. Concentrations of creatinine in sweat could not be accurately quantified before HD in 14 samples and after HD in 24 samples due to analytical limitations in the combination with the sparse sample volume. Concentrations of creatinine in plasma were significantly higher than in sweat and saliva at the start and end of HD (p<0.001), with the median sweat and salivary creatinine concentrations being 6.0 and 8.3 % of the plasma concentration, respectively.
Associations of sweat and saliva with plasma
As shown in Figures 3 and 4, as well as Table 3, the urea concentrations in sweat correlated well with the corresponding plasma concentrations (Spearman’s correlation coefficient ρ: 0.92 [CI: 0.88–0.95, p<0.001]). The saliva concentration of urea showed a similar correlation coefficient of 0.94 [CI: 0.90–0.96, p<0.001]. Consistently higher urea concentrations were found in sweat than in plasma, reflected in the intercept of the linear regression line (y=1.04x + 5.19 [R2: 0.80]). The absolute differences between sweat and plasma urea concentrations were similar at the start and at the end of HD within individual patients (p=0.89), but not between individual patients, ranging from a mean difference of 0.98 mmol/L to 17.69 mmol/L (Figure 5). This inter-individual variation was not observed with urea in saliva and plasma (y=1.13x − 0.06 [R2: 0.87]) (Figure 6). A linear regression model could be used to estimate plasma urea concentrations based on the sweat and/or saliva urea concentrations that were not significantly different from the actually measured plasma urea concentrations (p=0.35 and p=0.29, respectively). However, for creatinine (Figures 7 and 8 and Table 3), correlation coefficients were lower for both sweat and saliva compared to plasma (0.58 [CI: 0.34–0.75, p<0.001] and 0.77 [CI: 0.67–0.85, p<0.001], respectively) and the data could not be described with a linear regression model (R2<0.4).

Urea concentrations in sweat and plasma before (start, n=34) and after (end, n=31) hemodialysis. Spearman’s correlation coefficient ρ=0.92 (95 % CI: 0.88–0.95), formula of linear regression line: y=1.04x + 5.19 (R2=0.80). The dashed line represents the x=y line.

Urea concentrations in saliva and plasma before (start, n=39) and after (end, n=40) hemodialysis. Spearman’s correlation coefficient ρ=0.94 (95 % CI: 0.90–0.96), formula of linear regression line: y=1.13x − 0.06 (R2=0.87). The dashed line represents the x=y line.
Correlation coefficients for associations between sweat or saliva with plasma concentrations of urea and creatinine. Correlations and R2 values for urea are higher than for creatinine.
| Biomarker | Compared biofluids | Spearman correlation coefficient (ρ) with 95 % CI | p-Value | R2 | Number of samples, n |
|---|---|---|---|---|---|
| Urea | Plasma/sweat | 0.92 (0.88–0.95) | <0.001 | 0.80 | 65 |
| Plasma/saliva | 0.94 (0.90–0.96) | <0.001 | 0.87 | 79 | |
| Creatinine | Plasma/sweat | 0.58 (0.34–0.75) | <0.001 | 0.38 | 42 |
| Plasma/saliva | 0.77 (0.66–0.85) | <0.001 | 0.35 | 78 |

Urea concentrations in sweat and plasma before (start, n=34) and after (end, n=31) hemodialysis. Every line represents one patient, the dashed line represents the x=y line.
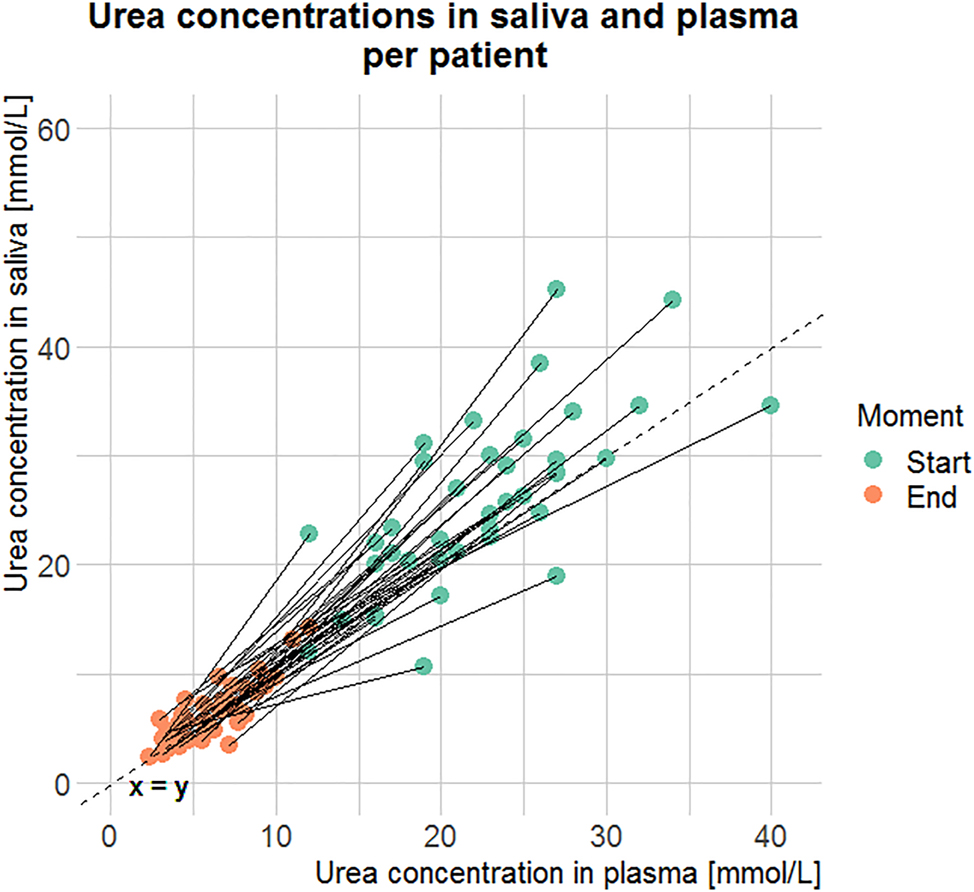
Urea concentrations in saliva and plasma before (start, n=39) and after (end, n=40) hemodialysis. Every line represents one patient, the dashed line represents the x=y line.

Creatinine concentrations in sweat and plasma before (start, n=26) and after (end, n=16) hemodialysis. Spearman’s correlation coefficient ρ=0.58 (95 % CI: 0.34–0.75) and R2=0.38, formula of regression line: y=0.03x + 14.4 (R2=0.38). The dashed line represents the x=y line.

Creatinine concentrations in saliva and plasma before (start, n=39) and after (end, n=39) hemodialysis. Spearman’s correlation coefficient r=0.77 (95 % CI: 0.66–0.85), formula of regression line: y=0.13x − 4.18 (R2=0.35). The dashed line represents the x=y line.
Discussion
In this study, the association between urea and creatinine concentrations in sweat and saliva compared to those in plasma was investigated to evaluate the feasibility of sweat and saliva for non-invasive and continuous monitoring of HD patients. Urea concentrations in sweat and saliva were found to be highly correlated with plasma urea concentrations. For creatinine, the correlation coefficients were lower.
Urea in sweat
Previous literature on urea and creatinine concentrations in sweat and saliva and the correlation with plasma concentrations during HD is limited. However, consistent with the literature, the urea concentrations in sweat where found to be higher than the urea concentrations in plasma [14, 15]. Based on size and solubility in water, Komives et al. [16] hypothesized that urea passively diffuses through cell membranes and tight junctions. However, as sweat concentrations are higher than in plasma, this could imply an additional source of urea outside plasma, the occurrence of additional active transport mechanisms from plasma to sweat, or water reabsorption in the sweat gland duct [15]. Other studies suggested the epidermis as source for urea [17, 18] or the sweat gland itself by arginase cleavage of arginine to ornithine and urea [19, 20]. More recently, Xie et al. [21] found evidence of increased expression of urea transporters in sweat glands from uremic patients, suggesting an alternative excretion pathway via the sweat glands, occurring when kidney function decreases. The variation in the expression of the urea transporters between individuals could explain the inter-individual variation in the variability that we described.
The outcome of the high correlation between sweat and plasma urea contradicts the results of Al-Tamer et al. [14], who found no significant association. This discrepancy could be attributed to the different method used for sweat stimulation and collection. The sweat collection method with unstimulated sweat that Al-Tamer et al. employed, might be more prone to evaporation as systemic heat stimulation was applied, causing the high urea concentrations found in sweat.
Urea in saliva
The high correlation found for urea in saliva and plasma (ρ: 0.94) is consistent with the findings of Bilancio et al. [22] who also found a correlation of 0.94. In addition, the results of five HD patients in that study showed higher salivary urea compared to plasma at the start of HD, but not at the end of HD, which is also in line with our findings. In addition, our findings also confirm those of Bader et al. [5], who found a correlation of 0.98 in 30 ESRD patients undergoing regular HD treatment.
Creatinine in sweat and saliva
Sweat concentrations of creatinine could only be quantified in a subset of samples due to a too high limit of quantitation (LoQ) of the applied assay. Therefore, the median and IQR values might be biased and need to be interpreted with caution. Despite this limitation, the findings of the creatinine concentration being lower in sweat than in plasma is in accordance with other reported studies [10, 23]. The literature is inconclusive about the correlation coefficient between sweat and plasma creatinine concentrations [14]. Saliva concentrations of creatinine showed a significant positive correlation with concentrations in plasma, in line with the research of Bader et al. [5]. However, the correlation coefficients are slightly higher than in our study (ρ=0.89 vs. ρ=0.77). The difference could be caused by a difference in the saliva collection method (passive drooling vs. actively stimulated saliva while chewing a swab), impacting and changing the contribution of the three main salivary glands, which in turn could alter the concentration of the biomarker and thus the correlation with plasma [24].
Innovation and future perspective
Although biosensors are proposed for urea and creatinine in sweat and saliva [7, 10], there is a lack of fundamental knowledge about the underlying transport mechanisms of urea and creatinine between sweat, saliva, and plasma. To our knowledge, this study is the first to elucidate the association of urea and creatinine in sweat and saliva with the corresponding plasma concentrations in 40 ESRD patients during one HD cycle. This research adds fundamental knowledge about the kinetics of urea and creatinine towards sweat and saliva at the start and at the end of HD, needed for clinical interpretation of these biomarkers. Our findings confirm an excellent correlation of urea in sweat and saliva with plasma, implying that biosensors that can adequately monitor urea concentrations in sweat or saliva may enable non-invasive and continuous remote HD monitoring. These sensors should however still be developed further to enable accurate and robust analysis [12]. The clinical need for continuous creatinine monitoring is a subject for further exploration.
Additional potential clinical applications
Some modern HD machines are able to quantify the HD adequacy by clearance of small solutes or electrolytes via conductivity measures, ion-selective electrodes or optical measurements [25]. However, the on-line measurements are limited to the duration of the HD treatment, whereas sweat and/or saliva measurements could be performed between the HD cycles at any moment. This would allow further individualization of the HD treatment schedule, as the patient or medical specialist can evaluate the urea in real-time. In addition, the findings of this study could potentially be translated to the non-invasive and continuous urea monitoring of other patients, e.g., requiring peritoneal dialysis or in the pre-dialysis stage. However, this requires additional testing in the respective patient populations.
Limitations
The main limitation of sweat analysis is the relatively low volume of sweat, which in some patients leads to unquantifiable urea and creatinine concentrations. In our experience (results not shown), several ESRD patients on HD produce relatively low sweat rates after iontophoresis, specifically women. This could be caused by relative dehydration during the HD cycle. Despite the fact that this had no impact on the outcome of our study, this shows that handling of low sample volumes by and microfluidics in bio-sensors are essential in further development.
The physiology underlying the excretion of urea and creatinine by means of sweating and saliva production is, to our knowledge, largely unknown. Although Kao et al. [26] suggested decreased saliva production in ESRD patients on HD, it is unclear how alternative excretion pathways change in the process of renal failure. Our study did not address these knowledge gaps. It would therefore be of great interest to further explore excretion of urea and creatinine through sweat and saliva production in the healthy population and in renal failure patients in the pre-dialysis stage. Also, we did not address the intra-individual variability or reproducibility of urea and creatinine in sweat and saliva, since this would require the measurements at the start and end of multiple HD cycles. This study was designed to assess the feasibility of urea and creatinine measurements in sweat and saliva and clarify the correlation between the analyses in these different matrices. The intra-individual variability remains to be established during further development.
Conclusions
In conclusion, urea and creatinine concentrations in sweat and saliva showed a positive correlation with the corresponding concentrations in plasma in a cohort of 40 ESRD patients requiring HD. As in plasma, urea and creatinine concentrations in sweat and saliva decreased extensively during a dialysis cycle. Based on these findings, urea in sweat or saliva is a promising biomarker that can easily be translated into plasma concentrations at the start and at the end of HD. This would allow the estimation of HD adequacy by sweat or saliva monitoring, but requires further investigation. The results illustrate a proof of principle of urea measurements in sweat and saliva to monitor HD adequacy in a non-invasive and continuous manner. This suggests that biosensors enabling urea monitoring in sweat or saliva remotely could fill in a clinical need to improve HD in a home situation, individualize the treatment schedule and thereby decrease patient burden.
Funding source: Catharina Research Fund
Award Identifier / Grant number: 2021-3
Funding source: Penta Program
Award Identifier / Grant number: Project 19017
Acknowledgments
We thank Dr. Karin Moret (Catharina Hospital), Stefanie Baten (Catharina Hospital), Dr. Vincent Peters (Catharina Hospital) and Vera Maas (Catharina Hospital) for their contributions in sample collection and data acquisition at the Dialysis Department. We also thank Anton van der Stokker (Catharina Hospital), Anjolie Amsens-van Happen (Catharina Hospital) and Daphne van Klinken (Catharina Hospital) for their contributions in sample handling and study coordination at the Clinical Laboratory.
-
Research ethics: The study was approved by the local Ethical Review Board and the Medical research Ethics Committees United (MEC-U). This study was carried out in accordance with the principles of the Declaration of Helsinki (Fortaleza, Brazil, October 2013) and in accordance with Dutch law.
-
Informed consent: Informed consent was obtained from all individuals included in this study, or their legal guardians or wards.
-
Author contributions: Research idea and study design: SA, CJAMK, LC, EB, RAB, DHK; data acquisition: SA; data analysis/interpretation: SA, CJAMK, LC, EB, MM, RAB, DHK; statistical analysis: SA; supervision or mentorship: MM, RAM, DHK. The authors have accepted responsibility for the entire content of this manuscript and approved its submission.
-
Competing interests: The authors state no conflict of interest.
-
Research funding: This study was funded by the Catharina Research Fund (2021-3) and Penta program (project 19017).
-
Data availability: The raw data can be obtained on request from the corresponding author.
-
Trial registration: This paper is based on the observational clinical trial (UMIS Study) that is registered in the International Clinical Trials Registry Platform with main ID NL9831.
References
1. Tattersall, J, Martin-Malo, A, Pedrini, L, Basci, A, Canaud, B, Fouque, D, et al.. EBPG guideline on dialysis strategies. Nephrol Dial Transplant 2007;22:ii5–21. https://doi.org/10.1093/ndt/gfm022.Search in Google Scholar PubMed
2. Walker, RC, Hanson, CS, Palmer, SC, Howard, K, Morton, RL, Marshall, MR, et al.. Patient and caregiver perspectives on home hemodialysis: a systematic review. Am J Kidney Dis 2015;65:451–63. https://doi.org/10.1053/j.ajkd.2014.10.020.Search in Google Scholar PubMed
3. Baker, LB. Physiology of sweat gland function: the roles of sweating and sweat composition in human health. Temperature 2019;6:211–59. https://doi.org/10.1080/23328940.2019.1632145.Search in Google Scholar PubMed PubMed Central
4. De Boeck, K, Vermeulen, F, Dupont, L. The diagnosis of cystic fibrosis. Presse Med 2017;46:e97–108. https://doi.org/10.1016/j.lpm.2017.04.010.Search in Google Scholar PubMed
5. Bader, R, Kora, MAA, El-Shalakany, A, Mashal, BAAB. Clinical significance of saliva urea and creatinine levels in patients with chronic kidney disease. Menoufia Med J 2015;28:406. https://doi.org/10.4103/1110-2098.163893.Search in Google Scholar
6. Lasisi, TJ, Raji, YR, Salako, BL. Salivary creatinine and urea analysis in patients with chronic kidney disease: a case control study. BMC Nephrol 2016;17:10. https://doi.org/10.1186/s12882-016-0222-x.Search in Google Scholar PubMed PubMed Central
7. Hussain, S, Park, S. Sweat-based noninvasive skin-patchable urea biosensors with photonic interpenetrating polymer network films integrated into PDMS chips. ACS Sens 2020;5:3988–98. https://doi.org/10.1021/acssensors.0c01757.Search in Google Scholar PubMed
8. Paul, B, Demuru, S, Lafaye, C, Saubade, M, Briand, D. Printed iontophoretic-integrated wearable microfluidic sweat-sensing patch for on-demand point-of-care sweat analysis. Adv Mater Technol 2021;6:2000910. https://doi.org/10.1002/admt.202000910.Search in Google Scholar
9. Poletti, F, Zanfrognini, B, Favaretto, L, Quintano, V, Sun, J, Treossi, E, et al.. Continuous capillary-flow sensing of glucose and lactate in sweat with an electrochemical sensor based on functionalized graphene oxide. Sens Actuators B Chem 2021;344:130253. https://doi.org/10.1016/j.snb.2021.130253.Search in Google Scholar
10. Zhang, Y, Guo, H, Kim, SB, Wu, Y, Ostojich, D, Park, SH, et al.. Passive sweat collection and colorimetric analysis of biomarkers relevant to kidney disorders using a soft microfluidic system. Lab Chip 2019;19:1545–55. https://doi.org/10.1039/C9LC00103D.Search in Google Scholar PubMed PubMed Central
11. Humphrey, SP, Williamson, RT. A review of saliva: normal composition, flow, and function. J Prosthet Dent 2001;85:162–9. https://doi.org/10.1067/mpr.2001.113778.Search in Google Scholar PubMed
12. Moonen, EJM, Haakma, JR, Peri, E, Pelssers, E, Mischi, M, den Toonder, JMJ. Wearable sweat sensing for prolonged, semicontinuous, and nonobtrusive health monitoring. View 2020;1:20200077. https://doi.org/10.1002/VIW.20200077.Search in Google Scholar
13. NCCLS. Method comparison and bias estimation using patient samples; approved guideline — Second Edition. EP9-A2; 2002.Search in Google Scholar
14. Al-Tamer, YY, Hadi, EA, Al-Badrani, II. Sweat urea, uric acid and creatinine concentrations in uraemic patients. Urol Res 1997;25:337–40. https://doi.org/10.1007/BF01294662.Search in Google Scholar PubMed
15. Bulmer, MG. The concentration of urea in thermal sweat. J Physiol 1957;137:261–6. https://doi.org/10.1113/jphysiol.1957.sp005810.Search in Google Scholar PubMed PubMed Central
16. Komives, GK, Robinson, S, Roberts, JT. Urea transfer across the sweat glands. J Appl Physiol 1966;21:1681–4. https://doi.org/10.1152/jappl.1966.21.6.1681.Search in Google Scholar PubMed
17. Brusilow, SW. Evidence for a non-plasma source of urea in sweat. Nature 1967;214:506. https://doi.org/10.1038/214506a0.Search in Google Scholar PubMed
18. Gordon, RS, Thompson, RH, Thrasher, D, Benson, JW. Genesis of the sweat: plasma urea concentration gradient. J Invest Dermatol 1976;66:218–21. https://doi.org/10.1111/1523-1747.ep12482142.Search in Google Scholar PubMed
19. Baker, LB, Engel, MD, Wolfe, AS. Sweat biomarkers for sports science applications. Sports Sci Exch 2022;35:1–9.Search in Google Scholar
20. Szondi, DC, Wong, JK, Vardy, LA, Cruickshank, SM. Arginase signalling as a key player in chronic wound pathophysiology and healing. Front Mol Biosci 2021;8:773866. https://doi.org/10.3389/fmolb.2021.773866.Search in Google Scholar PubMed PubMed Central
21. Xie, L, Jin, L, Feng, J, Lv, J. The expression of AQP5 and UTs in the sweat glands of uremic patients. BioMed Res Int 2017;2017:8629783. https://doi.org/10.1155/2017/8629783.Search in Google Scholar PubMed PubMed Central
22. Bilancio, G, Cavallo, P, Lombardi, C, Guarino, E, Cozza, V, Giordano, F, et al.. Salivary levels of phosphorus and urea as indices of their plasma levels in nephropathic patients. J Clin Lab Anal 2018;32:e22449. https://doi.org/10.1002/jcla.22449.Search in Google Scholar PubMed PubMed Central
23. Venkatapathy, R, Govindarajan, V, Oza, N, Parameswaran, S, Pennagaram Dhanasekaran, B, et al.. Salivary creatinine estimation as an alternative to serum creatinine in chronic kidney disease patients. Int J Nephrol 2014;2014:742724. https://doi.org/10.1155/2014/742724.Search in Google Scholar PubMed PubMed Central
24. Rutherfurd-Markwick, K, Starck, C, Dulson, DK, Ali, A. Comparison of three saliva collection methods to assess physiological markers. JFNM 2020;3:1–11. https://doi.org/10.31487/j.JFNM.2020.01.05.Search in Google Scholar
25. Sharma, MK, Wieringa, FP, Frijns, AJH, Kooman, JP. On-line monitoring of electrolytes in hemodialysis: on the road towards individualizing treatment. Expet Rev Med Dev 2016;13:933–43. https://doi.org/10.1080/17434440.2016.1230494.Search in Google Scholar PubMed
26. Kao, CH, Hsieh, JF, Tsai, SC, Ho, YJ, Chang, HR. Decreased salivary function in patients with end-stage renal disease requiring hemodialysis. Am J Kidney Dis 2000;36:1110–4. https://doi.org/10.1053/ajkd.2000.19810.Search in Google Scholar PubMed
© 2024 the author(s), published by De Gruyter, Berlin/Boston
This work is licensed under the Creative Commons Attribution 4.0 International License.
Articles in the same Issue
- Frontmatter
- Editorial
- SARS-CoV-2 is here to stay: do not lower our guard
- Reviews
- SARS-CoV-2 subgenomic RNA: formation process and rapid molecular diagnostic methods
- Prognostic value of anti-SARS-CoV-2 antibodies: a systematic review
- Presence of SARS-CoV-2 RNA in COVID-19 survivors with post-COVID symptoms: a systematic review of the literature
- Opinion Papers
- Harmonizing the post-analytical phase: focus on the laboratory report
- Blood-based biomarkers in Alzheimer’s disease – moving towards a new era of diagnostics
- A comprehensive review on PFAS including survey results from the EFLM Member Societies
- General Clinical Chemistry and Laboratory Medicine
- Report from the HarmoSter study: different LC-MS/MS androstenedione, DHEAS and testosterone methods compare well; however, unifying calibration is a double-edged sword
- An LC–MS/MS method for serum cystatin C quantification and its comparison with two commercial immunoassays
- CX3CL1/Fractalkine as a biomarker for early pregnancy prediction of preterm premature rupture of membranes
- Elevated S100B urine levels predict seizures in infants complicated by perinatal asphyxia and undergoing therapeutic hypothermia
- The correlation of urea and creatinine concentrations in sweat and saliva with plasma during hemodialysis: an observational cohort study
- Tubular phosphate transport: a comparison between different methods of urine sample collection in FGF23-dependent hypophosphatemic syndromes
- Reference Values and Biological Variations
- Monocyte distribution width (MDW): study of reference values in blood donors
- Data mining of reference intervals for serum creatinine: an improvement in glomerular filtration rate estimating equations based on Q-values
- Hematology and Coagulation
- MALDI-MS in first-line screening of newborns for sickle cell disease: results from a prospective study in comparison to HPLC
- Cardiovascular Diseases
- To rule-in, or not to falsely rule-out, that is the question: evaluation of hs-cTnT EQA performance in light of the ESC-2020 guideline
- Temporal biomarker concentration patterns during the early course of acute coronary syndrome
- Diabetes
- Proteomic analysis of diabetic retinopathy identifies potential plasma-protein biomarkers for diagnosis and prognosis
- Infectious Diseases
- Serum biomarkers of inflammation and vascular damage upon SARS-Cov-2 mRNA vaccine in patients with thymic epithelial tumors
- A high throughput immuno-affinity mass spectrometry method for detection and quantitation of SARS-CoV-2 nucleoprotein in human saliva and its comparison with RT-PCR, RT-LAMP, and lateral flow rapid antigen test
- Evaluation of inflammatory biomarkers and vitamins in hospitalized patients with SARS-CoV-2 infection and post-COVID syndrome
- The CoLab score is associated with SARS-CoV-2 viral load during admission in individuals admitted to the intensive care unit: the CoLaIC cohort study
- Development and evaluation of a CRISPR-Cas13a system-based diagnostic for hepatitis E virus
- Letters to the Editor
- Crioplast® is a reliable device to ensure pre-analytical stability of adrenocorticotrophin (ACTH)
- Falsely decreased Abbott Alinity-c gamma-glutamyl transferase-2 result from paraprotein and heparin interference: case report and subsequent laboratory experiments
- Impact of hemolysis on uracilemia in the context of dihydropyrimidine dehydrogenase deficiency testing
- Value of plasma neurofilament light chain for monitoring efficacy in children with later-onset spinal muscular atrophy under nusinersen treatment
- Analytical evaluation of the Snibe β-isomerized C-terminal telopeptide of type I collagen (β-CTX-I) automated method
- Acute myeloid leukemia with blue-green neutrophilic inclusions have different outcomes: two cases and review of the literature
- Congress Abstracts
- The 10+1 Santorini Conference
- 14th National Congress of the Portuguese Society of Clinical Chemistry, Genetics and Laboratory Medicine
- 15th National Congress of the Portuguese Society of Clinical Chemistry, Genetics and Laboratory Medicine
- ISMD2024 Thirteenth International Symposium on Molecular Diagnostics