Association between apolipoprotein E polymorphisms and premature coronary artery disease: a meta-analysis
-
Qiong Rui Zhao


Abstract
Background:
Although several studies have explored the genetic polymorphisms of apolipoprotein E (APOE) and their impact on premature coronary artery disease (PCAD), there is still some controversy regarding the significance of their association. Our aim is to estimate the association between APOE polymorphisms and PCAD via meta-analysis.
Methods:
All relevant case-control studies and cohort studies published in Chinese or English prior to March 2016 were searched for in electronic databases. Detailed information concerning each piece of literature was independently extracted by two researchers. We used STATA11.0 to process all data and to determine the pooled odds ratio (OR). Altogether, four genetic models were applied to calculate OR and 95% confidence interval (CI): (1) ε2 allele vs. ε3 allele; (2) ε2 carriers vs. ε3/3; (3) ε4 allele vs. ε3 allele; (4) ε4 carriers vs. ε3/3.
Results:
Eighteen studies concerning APOE polymorphisms and their impact on PCAD were included in the final analysis. The pooled analysis displayed that the ε2 allele and ε2 carriers increased the risk of PCAD significantly among Asians (OR 1.54; 95% CI, 1.09–2.17; OR 1.65; 1.10–2.47), while they showed protective effects on PCAD in Caucasians (OR 0.77; 95% CI, 0.62–0.95; OR 0.69; 0.54–0.89). Subjects with the ε4 allele and ε4 carriers showed significant associations with PCAD (OR 1.62; 95% CI, 1.27–2.06; OR 1.65; 1.27–2.15).
Conclusions:
Our investigation supported the fact that the ε2 allele in APOE may appear as a risk factor for PCAD in Asians while a protective factor in Caucasians and that the ε4 allele acted as a genetic risk factor for PCAD.
Introduction
Coronary artery disease (CAD), a multifactorial heart disorder resulting from all kinds of predisposing environmental and genetic factors [1], is still one of the leading causes of disability and death around the world, accounting for 14.8% of global death [2]. Premature coronary artery disease (PCAD) is defined as CAD that occurs in males <55 years old or females <65 years old [3]. Even though PCAD constitutes only about 30% of all CAD subjects [4], [5], it is highly stressful for the patients’ families and generates a heavy social burden because of the longer period that the patient lives with the disease in comparison to older patients with CAD [6]. Large epidemiological studies have revealed that genetic factors have a strong influence on early onset CAD [7]. One known factor is the apolipoprotein E (APOE) gene [8].
Apolipoprotein E (apoE) is a multifunction glycoprotein containing 299 amino acids, which are encoded by the APOE gene [9]. It acts as cholesterol carrier and plays a major role in mediating the transportation and metabolism of lipids [10]. The APOE gene is situated at 19q13.2 of the human chromosome and has four exons and three introns [11]. As the genetic polymorphisms which are most widely studied in APOE, rs429358 and rs7412 together define the ε2, ε3, and ε4 alleles, which encode three major protein isoforms (E2, E3, E4) and generate six different genotypes (ε2/4, ε2/3, ε3/4, ε3/3, ε2/2, ε4/4) [12]. There is significant discrepancy in structure and function among the three protein isoforms [12]. ε3 is the wild type, and its amino acids at positions 112 and 158 are cysteine and arginine, respectively [10]. It has normal affinity for low-density lipoprotein receptors (LDLR) and modulates the clearance of lipoprotein remnants from the plasma [12]. When the 112th amino acid is replaced by arginine, ε3 mutates into ε4. Similarly, ε3 mutates into ε2 when the 158th amino acid is replaced by cysteine [13]. ε4 has similar high affinity for LDLR as ε3 and enhanced binding capacity for lipids, so it impairs the process of lipolysis and is associated with high levels of very low-density lipoprotein (VLDL), low-density lipoprotein (LDL), and total cholesterol [12]. As for ε2, it has defective affinity ability for LDLR, which would delay the clearance of VLDL. ε2 is associated with low levels of LDL and total cholesterol [12].
Several meta-analyses have been conducted to explore the impact of APOE polymorphisms on CAD. The analysis conducted by Hong Xu found that the ε2 allele in APOE decreased the prevalence of myocardial infarction while the ε4 allele increased the incidence [14]. Two other meta-analyses conducted in the Chinese population also found a high risk of the ε4 allele for CAD [15], [16]. However, no meta-analysis explored the genetic risk of APOE in PCAD. Due to strong evidence that genetic factors have an influence on PCAD and that APOEε4 has an indirect impact on CAD [17], examining the impact of APOE polymorphisms on PCAD could eliminate possible confounding factors which are related to advanced age and could allow for more precise evaluation of the risk of inherited mutations. Although several studies have explored the genetic polymorphisms of APOE and their impact on PCAD [8], [18], [19], [20], [21], [22], [23], [24], [25], [26], [27], [28], [29], [30], [31], [32], [33], [34], the significance of their association is yet to be determined. Our aim is to estimate the association between APOE polymorphisms and PCAD by conducting this meta-analysis.
Materials and methods
Search strategy
All relevant case control studies and cohort studies exploring APOE polymorphisms and their relationship with PCAD published in Chinese or English prior to March 28th, 2016 were searched for in electronic databases, including PubMed, Embase, Web of Science, Wanfang Database, Chinese National Knowledge Infrastructure, VIP Database, and China Biological Medicine using all feasible combinations of the following key words: (‘CAD’ OR ‘coronary heart disease’ OR ‘ischemic heart disease’ OR ‘myocardial infarction’ OR ‘angina pectoris’ OR ‘acute heart failure’ OR ‘cardiovascular disease’) AND (‘gene polymorphisms’ OR ‘allele’ OR ‘genotype’ OR ‘single nucleotide polymorphism’) AND (‘apolipoprotein E’ OR ‘apoE’) AND (‘premature’ OR ‘young’). The references of all retrieved literature were also screened. In case of duplicated data in publications studying the same group of people, we kept the more recent publication or the one that had the greatest sample size.
Inclusion and exclusion criteria
To identify all eligible publications, the inclusion criteria were listed as follows: (1) studies explored APOE polymorphisms and their association with PCAD; (2) case control studies or cohort studies; (3) case groups needed to be clearly diagnosed with PCAD, which was defined as CAD that occurs in males <55 or females <65 [3]; (4) control groups should be without CAD; (5) the distribution of both sample sizes and alleles should be reported in the studies; and (6) the study is of high quality.
The exclusion criteria listed as follows were used: (1) reviews; (2) case reports; (3) letters; and (4) duplicated researches.
Data extraction
Two authors independently screened the literature to minimize selection bias. For potential relevant literature whose full-texts could not be acquired online, emails were sent to corresponding authors to obtain full text. Detailed information concerning each piece of eligible literature was extracted by two researchers independently. Information included first author’s name, year of publication, ethnicity, clinical subtype, source of control, male percentage, mean age, mean BMI, sample size of controls and cases, genotyping method, Hardy-Weinberg equilibrium (HWE), the distribution of genotypes and frequencies of allele in cases and controls. Any disputes were settled by a third researcher.
Quality assessment of included studies
The quality of all eligible publications was assessed by two authors based on the Newcastle-Ottawa assessment scale [35]. Asterisks (*) were used as quality indicators, and better quality studies would be awarded more stars for a maximum of up to nine stars. Studies with more than six stars were perceived as high quality. Moreover, two authors assessed the risk of bias in each literature based on the Quality In Prognosis Studies (QUIPS) tool [36], which contains six bias domains. The bias of each domain is rated as having high, moderate, or low risk of bias. Any disputes were settled by a third researcher.
Statistical analysis
We applied pooled odds ratio (OR) and its corresponding 95% CI to assess the intensity of the influence of APOE polymorphisms on PCAD, and Z test was used to examine the statistical significance of the OR. As ε3/3 is the most common genotype among humans [37], we designated the ε3 allele or genotype ε3/3 as the reference category in our meta-analysis. Genotypes ε2/2 and ε4/4 were detected in only a few studies. Altogether, four genetic models were applied to calculate OR and 95% CI: (1) ε2 allele vs. ε3 allele; (2) ε2 carriers vs. ε3/3; (3) ε4 allele vs. ε3 allele; (4) ε4 carriers vs. ε3/3. (Patients with genotypes ε2/3 and ε2/2 were included in ε2 carriers. Similarly, patients with genotypes ε4/3 and ε4/4 were included in ε4 carriers) [16]. The distribution of genotypes was examined by χ2-test to test if it fulfilled the HWE criteria. We used the I2test to examine the heterogeneity among all publications (I2<25%, low heterogeneity; 25%≤I2<50%, moderate heterogeneity; I2≥50%, high heterogeneity) [38]. For publications with moderate or high heterogeneity, we chose random effects models to merge OR; otherwise, fixed effects models were selected. Different features concerning studied populations resulted in discrepancies in results, thus we conducted stratified analyses by ethnicity (Caucasian, Asian, or African), clinical subtype (CAD or MI), source of control [population based (PB) or hospital based (HB)], male percentage (≥65% or <65%), and sample size (≥250 or <250). Furthermore, we utilized univariate meta-regression analyses to identify the source of heterogeneity among studies and investigate the effects of different moderators (ethnicity, mean age, HWE, source of control, clinical subtype, male percentage, and mean BMI). Sensitivity analysis was conducted to test the stabilization of the results by omitting each research. Begg’s test [39] and Egger’s test [40] were performed to detect the publication bias. All the data were processed by STATA11.0 for windows (Stata, College Station, TX, USA). A p-value < 0.05 indicated statistically significant.
Results
Study characteristics
The detailed screening process for all relevant literature is displayed in a flow diagram shown in Figure 1. Initially, 472 relevant publications were identified, while only 18 research reports covering a total of 2361 PCAD and 2811 controls fulfilled the inclusion criteria and were included in our analysis. Detailed information concerning each piece of eligible publication was listed in Table 1. The distribution of genotypes and frequencies of APOE allele is shown in Table 2. Results of quality assessment based on the Newcastle-Ottawa assessment scale are displayed in Table 3, while the results of risk of bias assessment are shown in Table 4.

Flow diagram of the study selection.
Characteristics of all studies included in the meta-analysis.
| First author | Year | Ethnicity | Clinical subtype | Source of control | % of male | Mean age | Mean BMI | Sample size | Genotyping method | HWE | |
|---|---|---|---|---|---|---|---|---|---|---|---|
| Case | Control | ||||||||||
| van Bockxmeer [8] | 1992 | Caucasian | CAD | PB | 100 | NA | NA | 91 | 172 | RFLP | N |
| Peacock [18] | 1992 | Caucasian | MI | PB | 100 | 40.4 | 25.5 | 87 | 91 | RFLP | NA |
| Miettinen [19] | 1994 | Caucasian | CAD | HB | 90.9 | 40.0 | NA | 80 | 50 | DNA-Seq | Y |
| Zhao [20] | 2000 | Asian | MI | HB | 100 | 45.8 | 24.4 | 50 | 49 | RFLP | Y |
| Petrovic [21] | 2000 | Caucasian | CAD | PB | 86.5 | 51.4 | 27.0 | 166 | 130 | RFLP | Y |
| Batalla [22] | 2000 | Caucasian | MI | HB | 100 | 42.5 | NA | 220 | 200 | RFLP | Y |
| Viitanen [23] | 2001 | Caucasian | CAD | PB | 66.7 | 53.6 | 27.1 | 118 | 110 | RFLP | Y |
| Peng [24] | 2001 | Asian | CAD | HB | 53.4 | 51.8 | NA | 52 | 180 | RFLP | Y |
| Yang [25] | 2001 | Asian | CAD | PB | NA | 50.1 | 30.7 | 68 | 136 | RFLP | Y |
| Mamotte [26] | 2002 | Caucasian | CAD | PB | 66.9 | 41.6 | 26.6 | 564 | 639 | RFLP | Y |
| Kumar [27] | 2003 | Asian | MI | PB | 92.5 | 36.3 | 22.9 | 35 | 45 | RFLP | N |
| Letonja [28] | 2004 | Caucasian | CAD | PB | 0 | 55.1 | 27.2 | 147 | 114 | RFLP | Y |
| Ranjith [29] | 2004 | African | MI | PB | NA | NA | NA | 195 | 300 | RFLP | N |
| Kolovou [30] | 2005 | Caucasian | CAD | PB | 100 | NA | NA | 73 | 103 | RFLP | Y |
| Aasvee [31] | 2006 | Caucasian | MI | PB | 100 | 49.0 | 28.2 | 71 | 85 | RFLP | Y |
| Balcerzyk [32] | 2007 | Caucasian | CAD | PB | 67.2 | 42.4 | 26.2 | 140 | 107 | RFLP | Y |
| Chu [33] | 2007 | Asian | CAD | HB | 54.8 | 59.0 | NA | 92 | 220 | RFLP | N |
| Djan [34] | 2011 | Caucasian | CAD | PB | 100 | NA | 28.1 | 30 | 30 | RFLP | N |
HB, hospital-based; PB, population-based; HWE, Hardy-Weinberg equilibrium; RFLP, restriction fragment length polymorphism; DNA-Seq, DNA sequence testing.
The distribution of genotypes and frequencies of APOE allele in each eligible literature.
| First author | Year | Case | Control | Case | Control | ||||||||||||||
| ε2/2 | ε2/3 | ε2/4 | ε3/3 | ε3/4 | ε4/4 | ε2/2 | ε2/3 | ε2/4 | ε3/3 | ε3/4 | ε4/4 | ε2 | ε3 | ε4 | ε2 | ε3 | ε4 | ||
| van Bockxmeer [8] | 1992 | 1 | 7 | 4 | 42 | 29 | 7 | 0 | 18 | 3 | 110 | 41 | 0 | 13 | 120 | 47 | 21 | 279 | 44 |
| Peacock [18] | 1992 | – | – | – | – | – | – | – | – | – | – | – | – | 11 | 124 | 39 | 17 | 132 | 33 |
| Miettinen [19] | 1994 | 0 | 5 | 1 | 42 | 30 | 2 | 0 | 3 | 0 | 33 | 11 | 3 | 6 | 119 | 35 | 3 | 80 | 17 |
| Zhao [20] | 2000 | 0 | 4 | 0 | 40 | 6 | 0 | 0 | 5 | 0 | 41 | 3 | 0 | 4 | 90 | 6 | 5 | 90 | 3 |
| Petrovic [21] | 2000 | 0 | 16 | 5 | 119 | 26 | 0 | 0 | 20 | 0 | 91 | 18 | 1 | 21 | 280 | 31 | 20 | 220 | 20 |
| Batalla [22] | 2000 | 0 | 9 | 1 | 174 | 32 | 4 | 0 | 18 | 1 | 151 | 28 | 2 | 10 | 389 | 41 | 19 | 348 | 33 |
| Viitanen [23] | 2001 | 0 | 4 | 3 | 65 | 37 | 9 | 0 | 8 | 2 | 70 | 27 | 3 | 7 | 171 | 58 | 10 | 175 | 35 |
| Peng [24] | 2001 | 0 | 11 | 2 | 24 | 13 | 2 | 0 | 27 | 3 | 126 | 24 | 0 | 13 | 72 | 19 | 30 | 303 | 27 |
| Yang [25] | 2001 | 0 | 5 | 0 | 45 | 12 | 6 | 1 | 12 | 0 | 106 | 15 | 1 | 5 | 107 | 24 | 14 | 239 | 17 |
| Mamotte [26] | 2002 | 5 | 36 | 12 | 340 | 156 | 15 | 4 | 68 | 16 | 383 | 149 | 19 | 58 | 872 | 198 | 92 | 983 | 203 |
| Kumar [27] | 2003 | 0 | 6 | 1 | 12 | 6 | 10 | 2 | 9 | 0 | 32 | 0 | 2 | 7 | 36 | 27 | 13 | 73 | 4 |
| Letonja [28] | 2004 | 0 | 14 | 1 | 105 | 27 | 0 | 0 | 10 | 3 | 79 | 22 | 0 | 15 | 251 | 28 | 13 | 190 | 25 |
| Ranjith [29] | 2004 | 0 | 7 | 3 | 139 | 45 | 1 | 3 | 18 | 3 | 228 | 43 | 5 | 10 | 330 | 50 | 27 | 517 | 56 |
| Kolovou [30] | 2005 | 0 | 3 | 0 | 61 | 8 | 1 | 0 | 9 | 3 | 67 | 23 | 1 | 3 | 133 | 10 | 12 | 166 | 28 |
| Aasvee [31] | 2006 | 2 | 7 | 2 | 41 | 16 | 3 | 1 | 13 | 3 | 52 | 16 | 0 | 13 | 105 | 24 | 18 | 133 | 19 |
| Balcerzyk [32] | 2007 | 0 | 10 | 1 | 98 | 29 | 2 | 0 | 10 | 1 | 82 | 14 | 0 | 11 | 235 | 34 | 11 | 188 | 15 |
| Chu [33] | 2007 | 4 | 19 | 4 | 38 | 27 | 0 | 0 | 41 | 5 | 140 | 34 | 0 | 31 | 122 | 31 | 46 | 355 | 39 |
| Djan [34] | 2011 | 0 | 0 | 1 | 16 | 13 | 0 | 0 | 1 | 0 | 19 | 4 | 1 | 1 | 45 | 14 | 1 | 43 | 6 |
The results of quality assessment according to the Newcastle-Ottawa quality assessment scale.
| First author | Year | Total stars | Adequate case definition | Representativeness of the cases | Selection of controls | Definition of controls | Comparability of cases and controls on the basis of the design or analysis | Ascertainment of exposure | Same ascertainment exposure method for both cases and controls | Non-response rate |
| van Bockxmeer [8] | 1992 | 7 | * | * | * | * | * | * | * | |
| Peacock [18] | 1992 | 7 | * | * | * | ** | * | * | ||
| Miettinen [19] | 1994 | 7 | * | * | * | * | * | * | * | |
| Zhao [20] | 2000 | 7 | * | * | ** | * | * | * | ||
| Petrovic [21] | 2000 | 7 | * | * | ** | * | * | * | ||
| Batalla [22] | 2000 | 7 | * | * | ** | * | * | * | ||
| Viitanen [23] | 2001 | 7 | * | * | * | * | * | * | * | |
| Peng [24] | 2001 | 7 | * | * | ** | * | * | * | ||
| Yang [25] | 2001 | 8 | * | * | * | * | * | * | * | * |
| Mamotte [26] | 2002 | 7 | * | * | * | * | * | * | * | |
| Kumar [27] | 2003 | 9 | * | * | * | * | ** | * | * | * |
| Letonja [28] | 2004 | 8 | * | * | * | ** | * | * | * | |
| Ranjith [29] | 2004 | 7 | * | * | * | * | * | * | * | |
| Kolovou [30] | 2005 | 7 | * | * | * | * | * | * | * | |
| Aasvee [31] | 2006 | 6 | * | ** | * | * | * | |||
| Balcerzyk [32] | 2007 | 8 | * | * | * | ** | * | * | * | |
| Chu [33] | 2007 | 6 | * | * | * | * | * | * | ||
| Djan [34] | 2011 | 6 | * | * | * | * | * | * |
*A study can be awarded a maximum of one star for each item within the selection and exposure categories. **A maximum of two stars can be given for comparability.
The results of risk of bias assessment based on the QUIPS tool.
| First author | Year | Study participation | Study attrition | Prognostic factor measurement | Outcome measurement | Study confounding | Statistical analysis and reporting |
|---|---|---|---|---|---|---|---|
| van Bockxmeer [8] | 1992 | Low | Low | Low | Moderate | Low | Low |
| Peacock [18] | 1992 | Moderate | Moderate | Low | Low | Low | Low |
| Miettinen [19] | 1994 | Low | Low | Low | Low | Low | Low |
| Zhao [20] | 2000 | Moderate | Low | Low | Low | Low | Low |
| Petrovic [21] | 2000 | Moderate | Low | Low | Moderate | Low | Low |
| Batalla [22] | 2000 | Low | Low | Low | Moderate | Low | Low |
| Viitanen [23] | 2001 | Low | Low | Low | Low | Moderate | Low |
| Peng [24] | 2001 | Moderate | Low | Low | Moderate | Low | Low |
| Yang [25] | 2001 | Low | Low | Low | Low | Low | Low |
| Mamotte [26] | 2002 | Low | Low | Low | Moderate | Moderate | Low |
| Kumar [27] | 2003 | Low | Low | Low | Moderate | Low | Low |
| Letonja [28] | 2004 | Moderate | Low | Low | Low | Low | Low |
| Ranjith [29] | 2004 | Low | Low | Low | Moderate | Low | Low |
| Kolovou [30] | 2005 | Low | Low | Low | Moderate | Moderate | Low |
| Aasvee [31] | 2006 | Moderate | Low | Low | Moderate | Low | Low |
| Balcerzyk [32] | 2007 | Moderate | Low | Low | Moderate | Low | Low |
| Chu [33] | 2007 | Low | Low | Low | Moderate | Low | Low |
| Djan [34] | 2011 | Moderate | Low | Low | Low | Moderate | Low |
Association between ε2 allele and PCAD
The results of the ε2 allele and its carriers are shown in Figures 2 and 3. We chose random effects models to merge all data based on its moderate heterogeneity (for ε2 allele vs. ε3 allele, I2=31.2%, τ2=0.067; for ε2 carriers vs. ε3/3, I2=29.7%, τ2=0.085). Overall, the ε2 allele and its carriers had a protective effect on PCAD although the difference was not statistically significant (OR 0.90; 95% CI, 0.72–1.13; OR 0.87; 0.67–1.14). When stratified by ethnicity, Asian ε2 allele carriers significantly had an increased risk of PCAD (OR 1.54; 95% CI, 1.09–2.17; OR 1.65; 1.10–2.47) while protective effects were shown for PCAD in Caucasians (OR 0.77; 95% CI, 0.62–0.95; OR 0.69; 0.54–0.89). Forest plots of subgroup analyses by ethnicity were displayed in Figure 4. We performed subgroup analyses by clinical subtype and found decreased susceptibility of MI in the ε2 allele vs. ε3 allele model (OR 0.70; 95%CI, 0.49–0.98). Significant protective effects of the ε2 allele and its carriers on PCAD also existed in population-based studies (OR 0.78; 95% CI, 0.64–0.95; OR 0.73; 0.57–0.93) and in the male ≥65% subgroup (OR 0.77; 95% CI, 0.63–0.95; OR 0.69; 0.54–0.89), and the increased risk of PCAD was only present in ε2 carriers in the male <65% subgroup (OR 1.76; 95% CI, 1.15–2.71), while other subgroups did not reveal any significant associations. The detailed results of all subgroup analyses were shown in Table 5.
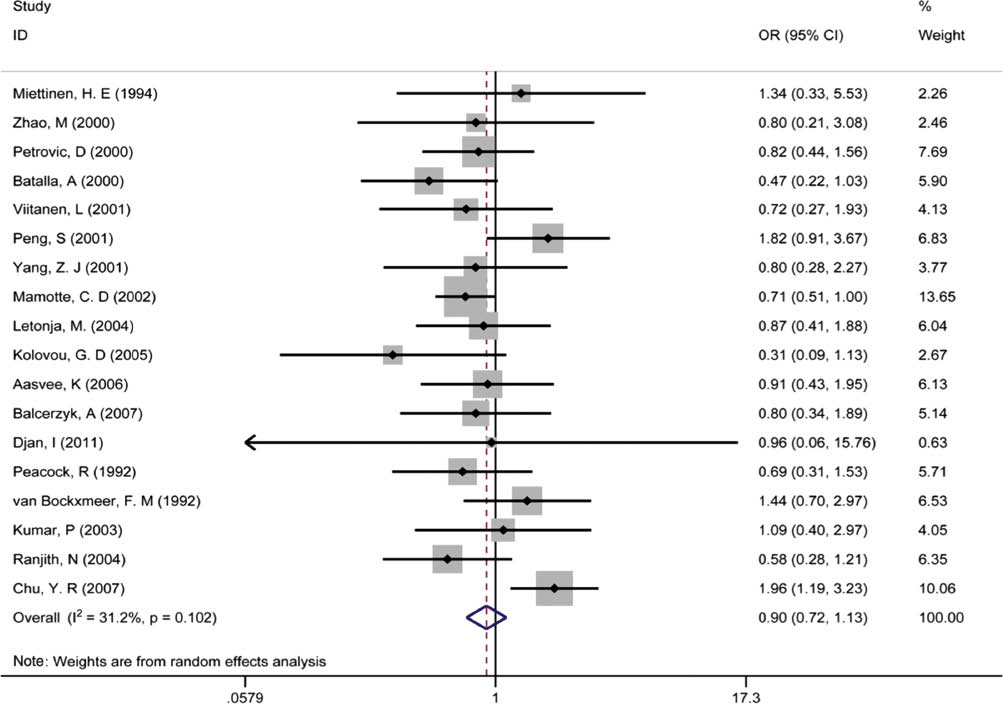
Pooled calculated OR of the association between the ε2 allele and premature coronary artery disease.

Pooled calculated OR of the association between ε2 carriers and premature coronary artery disease.

Forest plots of subgroup analyses by ethnicity in the ε2 analyses.
The results of subgroup analyses.
| Subgroup | No. of studies | ε2 vs. ε3 | ε4 vs. ε3 | No. of studies | ε2 carrier vs. ε3/3 | ε4 carrier vs. ε3/3 | ||||||||
|---|---|---|---|---|---|---|---|---|---|---|---|---|---|---|
| OR | POR | I2 (%) | OR | POR | I2(%) | OR | POR | I2(%) | OR | POR | I2(%) | |||
| Ethnicity | ||||||||||||||
| Caucasian | 12 | 0.77 (0.62, 0.95) | 0.01 | 0.0 | 1.31 (1.05, 1.64) | 0.02 | 53.5 | 11 | 0.69 (0.54, 0.89) | 0.00 | 0.0 | 1.31 (1.02, 1.68) | 0.04 | 45.6 |
| Asian | 5 | 1.54 (1.09, 2.17) | 0.01 | 0.3 | 3.31 (2.00, 5.49) | 0.00 | 52.6 | 5 | 1.65 (1.10, 2.47) | 0.02 | 0.0 | 3.34 (2.02, 5.52) | 0.00 | 33.9 |
| African | 1 | 0.58 (0.28, 1.21) | 0.15 | – | 1.40 (0.93, 2.10) | 0.11 | – | 1 | 0.55 (0.23, 1.32) | 0.18 | – | 1.57 (1.00, 2.48) | 0.05 | – |
| Clinical subtype | ||||||||||||||
| CAD | 12 | 1.00 (0.74, 1.35) | 0.99 | 43.1 | 1.58 (1.18, 2.12) | 0.00 | 72.0 | 12 | 0.95 (0.68, 1.33) | 0.77 | 39.2 | 1.62 (1.19, 2.20) | 0.00 | 64.8 |
| MI | 6 | 0.70 (0.49, 0.98) | 0.04 | 0.0 | 1.77 (1.08, 2.88) | 0.02 | 71.0 | 5 | 0.67 (0.43, 1.04) | 0.07 | 0.0 | 1.89 (1.01, 3.54) | 0.05 | 68.1 |
| Source of control | ||||||||||||||
| PB | 13 | 0.78 (0.64, 0.95) | 0.02 | 0.0 | 1.57 (1.17, 2.10) | 0.00 | 74.2 | 12 | 0.73 (0.57, 0.93) | 0.01 | 0.0 | 1.54 (1.13, 2.11) | 0.01 | 65.9 |
| HB | 5 | 1.19 (0.65, 2.20) | 0.58 | 61.9 | 1.78 (1.19, 2.66) | 0.01 | 48.1 | 5 | 1.20 (0.60, 2.41) | 0.61 | 62.7 | 1.99 (1.21, 3.27) | 0.01 | 54.1 |
| % of male | ||||||||||||||
| ≥65 | 13 | 0.77 (0.63, 0.95) | 0.02 | 0.0 | 1.52 (1.15, 2.03) | 0.00 | 69.0 | 12 | 0.69 (0.54, 0.89) | 0.00 | 0.0 | 1.51 (1.10, 2.09) | 0.01 | 62.4 |
| <65 | 3 | 1.55 (0.97, 2.48) | 0.07 | 37.0 | 1.79 (0.85, 3.74) | 0.12 | 79.9 | 3 | 1.76 (1.15, 2.71) | 0.01 | 0.0 | 2.04 (0.91, 4.60) | 0.09 | 77.1 |
| Sample size | ||||||||||||||
| ≥250 | 7 | 0.90 (0.61, 1.32) | 0.58 | 64.5 | 1.39 (1.05, 1.83) | 0.02 | 65.4 | 7 | 0.82 (0.54, 1.24) | 0.35 | 58.4 | 1.41 (1.05, 1.88) | 0.02 | 57.6 |
| <250 | 11 | 0.92 (0.68, 1.24) | 0.58 | 0.0 | 1.88 (1.28, 2.78) | 0.00 | 70.1 | 10 | 0.98 (0.68, 1.41) | 0.90 | 0.0 | 2.01 (1.27, 3.17) | 0.00 | 64.2 |
POR, p-value for OR.
Association between ε4 allele and PCAD
Due to the heterogeneity among studies exploring the associations between the ε4 allele and ε4 carriers with PCAD (for ε4 allele vs. ε3 allele, I2=69.9%, τ2=0.168; for ε4 carriers vs. ε3/3, I2=63.4%, τ2=0.171), we applied random effects models to calculate the pooled OR. The results showed that the ε4 allele and its carriers had significantly increased prevalence of PCAD (OR 1.62; 95% CI, 1.27–2.06; OR 1.65; 1.27–2.15), as shown in Figures 5 and 6. Furthermore, our subgroup analyses found a higher susceptibility of PCAD in the ε4 allele and in ε4 carriers among Caucasians (OR 1.31; 95% CI, 1.05–1.64; OR 1.31; 1.02–1.68), Asians (OR 3.31; 95% CI, 2.00–5.49; OR 3.34; 2.02–5.52), CAD (OR 1.58; 95% CI, 1.18–2.12; OR 1.62; 1.19–2.20), MI (OR 1.77; 95% CI, 1.08–2.88; OR 1.89; 1.01–3.54), population-based studies (OR 1.57; 95% CI, 1.17–2.10; OR 1.54; 1.13–2.11), hospital-based studies (OR 1.78; 95% CI, 1.19–2.66; OR 1.99; 1.21–3.27), and male ≥65% studies (OR 1.52; 95% CI, 1.15–2.03; OR 1.51; 1.10–2.09). Sample size did not affect this significant association. The detailed information was shown in Table 5. Forest plots of subgroup analyses by ethnicity were displayed in Figure 7.

Pooled calculated OR of the association between the ε4 allele and premature coronary artery disease.

Pooled calculated OR of the association between ε4 carriers and premature coronary artery disease.

Forest plots of subgroup analyses by ethnicity in the ε4 analyses.
Meta-regression
Univariate meta-regression analyses revealed that ethnicity accounted for 55.2% of the between-study heterogeneity for the ε2 allele vs. ε3 allele model (adjusted R2=63.47%, p=0.05), 100% of the between-study heterogeneity for the ε2 carriers vs. ε3/3 model (adjusted R2=100%, p=0.00), 28.6% of the between-study heterogeneity for the ε4 allele vs. ε3 allele model (adjusted R2=40.55%, p=0.02), and 24.0% of the between-study heterogeneity for the ε4 carriers vs. ε3/3 model (adjusted R2=30.21%, p=0.04). Age accounted for 100% of the between-study heterogeneity (adjusted R2=100%, p=0.01) and source of control 55.2% of the between-study heterogeneity (adjusted R2=67.24%, p=0.04) for the ε2 allele vs. ε3 allele model, while the other factors did not show significant results, which suggested that ethnicity was the main source of heterogeneity. Detailed results of meta-regression analyses were listed in Table 6.
The results of meta-regressions.
| Indicator | Ethnicity | Mean age | Hardy-Weinberg Equilibrium | Source of control | Clinical subtype | % of male | Mean BMI |
|---|---|---|---|---|---|---|---|
| ε2 allele vs. ε3 allele | |||||||
| R2 (%) | 63.47 | 100 | 41.99 | 67.24 | 16.54 | 2.95 | – |
| τ2 | 0.03 | 0 | 0.05 | 0.03 | 0.07 | 0.09 | 0 |
| p-Value | 0.05 | 0.01 | 0.10 | 0.04 | 0.18 | 0.32 | 0.91 |
| ε2 carriers vs. ε3/3 | |||||||
| R2 (%) | 100 | 68.48 | 38.50 | 55.84 | 5.84 | 16.87 | – |
| τ2 | 0 | 0.04 | 0.07 | 0.05 | 0.11 | 0.11 | 0 |
| p-Value | 0.00 | 0.08 | 0.12 | 0.07 | 0.33 | 0.19 | 0.71 |
| ε4 allele vs. ε3 allele | |||||||
| R2 (%) | 40.55 | –24.51 | 15.19 | –9.56 | –15.84 | –14.39 | –26.76 |
| τ2 | 0.12 | 0.22 | 0.20 | 0.23 | 0.24 | 0.26 | 0.29 |
| p-Value | 0.02 | 0.83 | 0.09 | 0.70 | 0.74 | 0.73 | 0.49 |
| ε4 carriers vs. ε3/3 | |||||||
| R2 (%) | 30.21 | –29.44 | 22.95 | –1.84 | –21.06 | –21.45 | –86.31 |
| τ2 | 0.13 | 0.18 | 0.14 | 0.19 | 0.22 | 0.22 | 0.22 |
| p-Value | 0.04 | 0.91 | 0.09 | 0.48 | 0.81 | 0.77 | 0.49 |
Sensitivity analysis
Sensitivity analyses showed that the overall calculated OR did not change significantly after excluding each literature, which confirmed the stability and reliability of our analysis.
Publication bias
No obvious asymmetry appeared in funnel plots shown in Figure 8. At the same time, Begg’s correlation (ε2 vs. ε3: p=1.00; ε2 carriers vs. ε3/3: p=0.97; ε4 vs. ε3: p=0.23; ε4 carriers vs. ε3/3: p=0.17) and Egger’s regression (ε2 vs. ε3: p=0.75; ε2 carriers vs. ε3/3: p=0.97; ε4 vs. ε3: p=0.06; ε4 carriers vs. ε3/3: p=0.05) did not reveal any obvious publication bias among our eligible publications.

Funnel plots for the four models.
Discussion
Although several recent meta-analyses explored the genetic risk of APOE polymorphisms in CAD [14], [15], [16], our analysis was the first comprehensive assessment in PCAD. Merging the data of all eligible publications revealed that subjects with the ε4 allele conferred 62% more predisposition to PCAD, while ε4 carriers had 65% higher risk for PCAD. People with the ε2 allele and ε2 carriers showed moderately protective effects on PCAD when merging all data. The results indicated that mutation of ε3–ε4 in APOE may be a genetic risk factor for PCAD.
Meta-regression analyses showed that ethnicity could explain most of the heterogeneity among studies exploring the associations between the ε2 allele or ε2 carriers and PCAD. Increased risk for PCAD was found in Asians with the ε2 allele, and we proposed that the ε2 allele may be a genetic risk factor for PCAD in Asians. This was in contrast to the decreased susceptibility of PCAD occurring in Caucasian subjects with the ε2 allele or ε2 carriers, which provided evidence that the ε2 allele was a genetic protective factor for PCAD in Caucasians. It was assumed that the association between the ε2 allele and type III hyperlipoproteinemia which is associated with PCAD [41], contributed to this geographical variability. Instead of high prevalence of the ε2/2 genotype in type III hyperlipoproteinemia seen in most other geographical areas, Asians are characterized by high prevalence of ε2/3 and ε2/2 genotypes [42], [43], which may be responsible for the genetic risk of the ε2 allele for PCAD in Asians. As the number of ε2/2 genotype in the population is very low, the ε2 allele could still act as a protective factor for Caucasians based on its association with low levels of LDL. Besides, differences in dietary habits exist between Caucasians and Asians [44], which could partially explain this discrepancy. Limited by the relatively small sample size of Asians in the included literature, further larger sample studies are still needed to confirm this result. As for the ε4 allele and ε4 carriers, Asian people showed much higher risk for PCAD compared with Caucasians, which may due to the differences in dietary habits between Caucasians and Asians [44]. When categorized by source of control, the ε2 allele and ε2 carriers showed significant associations with PCAD in population-based studies while no significant associations were found in hospital-based studies. Controls from hospital-based cases may have had diseases associated with APOE polymorphisms, which would confound the impact of APOE polymorphisms on PCAD and which may have been responsible for this discrepancy. In subgroup analysis by male percentage, the four models showed significant association with PCAD in studies where males percentage were ≥65%, while only ε2 carriers showed significant effects in the males percentage <65% subgroup. A number of epidemiological investigations indicated that lifestyle factors, such as tobacco smoking, alcohol consumption, and physical activity, could interact with the APOE gene to influence plasma lipid concentration [45], [46]. Compared to men, the proportion of smokers or drinkers is relative lower in females. Thus, the effect of APOE polymorphisms on PCAD may display discrepancy in sex. When stratified by sample size, no significant associations were found in the ε2 allele and ε2 carriers in sample sizes <250 or ≥250, indicating that heterogeneity did not originate from sample size. Even though possession of the ε4 allele was associated with elevated risk of PCAD in both overall and subgroup analyses, heterogeneity among studies remained high.
The mechanisms for the influence of APOE polymorphisms on PCAD are partially understood. A number of studies investigated the associations of APOE polymorphisms with lipid level [47], metabolic syndrome [48], and arteriostenosis [49]. Evidence suggested that apoE participated in the metabolism of lipids in the liver, and different isoforms of apoE differed in affinity to corresponding receptors and performed different functions [50]. E4 is associated with high levels of LDL, total cholesterol and risk of carotid artery stenosis, while E2 is associated with reduction of LDL and total cholesterol [17]. Thus, APOE polymorphisms affect the prevalence of PCAD indirectly through mediating the concentration of plasma lipid. Additionally, ε4 in APOE has an intimate association with increased apoB and is known as a risk factor for hypertension [51], which may be a contributing factor to its negative effect on PCAD.
From the results, we confirmed that people with the ε4 allele are at high risk of PCAD and need to be detected early and to receive appropriate counseling in case contracting PCAD. Asians with the ε2 allele need to be paid more attention as well.
Limitations
Although the obvious effect of APOE on PCAD was detected, several limitations remind us to interpret the results with caution. Firstly, several authors did not respond to our request to obtain original data, which could affect the integrity of the information included, so we did not include their studies in our meta-analysis. Secondly, the heterogeneity among studies exploring the association between the ε4 allele or ε4 carriers and PCAD remained a very high level even though we applied subgroup analysis. The last, the number of ε2/2 is too low in our research.
Conclusions
In conclusion, our study described the distribution of APOE polymorphisms in PCAD and detected that the ε2 allele appeared as a risk factor for PCAD in Asians while remaining a protective factor in Caucasians, and confirmed that the ε4 allele in APOE was associated with a high risk for PCAD in general. Furthermore, larger sample investigations of different subgroups are still needed to obtain a more definite conclusion.
Author contributions: All the authors have accepted responsibility for the entire content of this submitted manuscript and approved submission.
Research funding: None declared.
Employment or leadership: None declared.
Honorarium: None declared.
Competing interests: The funding organization(s) played no role in the study design; in the collection, analysis, and interpretation of data; in the writing of the report; or in the decision to submit the report for publication.
References
1. Luo JQ, Wen JG, Zhou HH, Chen XP, Zhang W. Endothelial nitric oxide synthase gene G894T polymorphism and myocardial infarction: a meta-analysis of 34 studies involving 21,068 subjects. PLoS One 2014;9:e87196.10.1371/journal.pone.0087196Search in Google Scholar
2. Naghavi M, Wang H, Lozano R, Davis A, Liang X, Zhou M, et al. Global, regional, and national age-sex specific all-cause and cause-specific mortality for 240 causes of death, 1990–2013: a systematic analysis for the Global Burden of Disease Study 2013. Lancet 2015;385:117–71.10.1016/S0140-6736(14)61682-2Search in Google Scholar
3. Tonstad S, Westheim A. Implementation of guidelines to screen relatives of patients with premature coronary heart disease in a hospital setting. Am J Cardiol 2002;90:1211–4.10.1016/S0002-9149(02)02836-9Search in Google Scholar
4. Doughty M, Mehta R, Bruckman D, Das S, Karavite D, Tsai T, et al. Acute myocardial infarction in the young – The University of Michigan experience. Am Heart J 2002;143:56–62.10.1067/mhj.2002.120300Search in Google Scholar
5. Mohammad AM, Jehangeer HI, Shaikhow SK. Prevalence and risk factors of premature coronary artery disease in patients undergoing coronary angiography in Kurdistan, Iraq. BMC Cardiovasc Disord 2015;15:155.10.1186/s12872-015-0145-7Search in Google Scholar
6. Sharma M, Ganguly NK. Premature coronary artery disease in Indians and its associated risk factors. Vasc Health Risk Manag 2005;1:217–25.Search in Google Scholar
7. Vecoli C, Adlerstein D, Shehi E, Bigazzi F, Sampietro T, Foffa I, et al. Genetic score based on high-risk genetic polymorphisms and early onset of ischemic heart disease in an Italian cohort of ischemic patients. Thromb Res 2014;133:804–10.10.1016/j.thromres.2014.03.006Search in Google Scholar
8. van Bockxmeer FM, Mamotte CD. Apolipoprotein epsilon 4 homozygosity in young men with coronary heart disease. Lancet 1992;340:879–80.10.1016/0140-6736(92)93288-XSearch in Google Scholar
9. Mahley RW. Apolipoprotein E: cholesterol transport protein with expanding role in cell biology. Science 1988;240:622–30.10.1126/science.3283935Search in Google Scholar PubMed
10. Mahley RW, Rall SC, Jr. Apolipoprotein E: far more than a lipid transport protein. Annu Rev Genomics Hum Genet 2000;1:507–37.10.1146/annurev.genom.1.1.507Search in Google Scholar PubMed
11. Singh PP, Singh M, Mastana SS. APOE distribution in world populations with new data from India and the UK. Ann Hum Biol 2006;33:279–308.10.1080/03014460600594513Search in Google Scholar PubMed
12. Phillips MC. Apolipoprotein E isoforms and lipoprotein metabolism. IUBMB Life 2014;66:616–23.10.1002/iub.1314Search in Google Scholar
13. Morrow JA, Segall ML, Lund-Katz S, Phillips MC, Knapp M, Rupp B, et al. Differences in stability among the human apolipoprotein E isoforms determined by the amino-terminal domain. Biochemistry 2000;39:11657–66.10.1021/bi000099mSearch in Google Scholar
14. Xu H, Li H, Liu J, Zhu D, Wang Z, Chen A, et al. Meta-analysis of apolipoprotein E gene polymorphism and susceptibility of myocardial infarction. PLoS One 2014;9:e104608.10.1371/journal.pone.0104608Search in Google Scholar
15. Yin YW, Sun QQ, Zhang BB, Hu AM, Liu HL, Wang Q, et al. Association between apolipoprotein E gene polymorphism and the risk of coronary artery disease in Chinese population: evidence from a meta-analysis of 40 studies. PLoS One 2013;8:e66924.10.1371/journal.pone.0066924Search in Google Scholar
16. Zhang MD, Gu W, Qiao SB, Zhu EJ, Zhao QM, Lv SZ. Apolipoprotein E gene polymorphism and risk for coronary heart disease in the Chinese population: a meta-analysis of 61 studies including 6634 cases and 6393 controls. PLoS One 2014;9:e95463.10.1371/journal.pone.0095463Search in Google Scholar
17. Bennet AM, Di Angelantonio E, Ye Z, Wensley F, Dahlin A, Ahlbom A, et al. Association of apolipoprotein E genotypes with lipid levels and coronary risk. J Am Med Assoc 2007;298:1300–11.10.1001/jama.298.11.1300Search in Google Scholar
18. Peacock R, Dunning A, Hamsten A, Tornvall P, Humphries S, Talmud P. Apolipoprotein B gene polymorphisms, lipoproteins and coronary atherosclerosis: a study of young myocardial infarction survivors and healthy population-based individuals. Atherosclerosis 1992;92:151–64.10.1016/0021-9150(92)90274-KSearch in Google Scholar
19. Miettinen HE, Korpela K, Hamalainen L, Kontula K. Polymorphisms of the apolipoprotein and angiotensin converting enzyme genes in young North Karelian patients with coronary heart disease. Hum Genet 1994;94:189–92.10.1007/BF00202868Search in Google Scholar PubMed
20. Zhao M. Lipid level on compatriots of early onset myocardial infaction and ApoE polymorphisms. 2000.Search in Google Scholar
21. Petrovic D, Zorc M, Peterlin B. Effect of apolipoprotein E polymorphism and apolipoprotein A-1 gene promoter polymorphism on lipid parameters and premature coronary artery disease. Folia Biol (Praha) 2000;46:181–5.Search in Google Scholar
22. Batalla A, Alvarez R, Reguero JR, Hevia S, Iglesias-Cubero G, Alvarez V, et al. Synergistic effect between apolipoprotein E and angiotensinogen gene polymorphisms in the risk for early myocardial infarction. Clin Chem 2000;46:1910–5.10.1093/clinchem/46.12.1910Search in Google Scholar
23. Viitanen L, Pihlajamaki J, Miettinen R, Karkkainen P, Vauhkonen I, Halonen P, et al. Apolipoprotein E gene promoter (-219G/T) polymorphism is associated with premature coronary heart disease. J Mol Med (Berl) 2001;79:732–7.10.1007/s001090100265Search in Google Scholar PubMed
24. Peng S, Peng J, Gong WX. ApoE polymorphisms and its relationship with early onset coronary artery disease and lipid level. Chinese J Med Genet 2001;18:44–7.Search in Google Scholar
25. Yang ZJ, Zhu TB, Ma GS, Yin H, Qian WC, Zhang FM, et al. Apolipoprotein E polymorphism in the early onset of coronary heart disease. Chin Med J (Engl) 2001;114:983–5.Search in Google Scholar
26. Mamotte CD, Burke V, Taylor RR, van Bockxmeer FM. Evidence of reduced coronary artery disease risk for apolipoprotein epsilon2/3 heterozygotes. Eur J Intern Med 2002;13:250–5.10.1016/S0953-6205(02)00030-4Search in Google Scholar
27. Kumar P, Luthra K, Dwivedi M, Behl VK, Pandey RM, Misra A. Apolipoprotein E gene polymorphisms in patients with premature myocardial infarction: a case-controlled study in Asian Indians in North India. Ann Clin Biochem 2003;40:382–7.10.1258/000456303766477020Search in Google Scholar PubMed
28. Letonja M, Guzic-Salobir B, Peterlin B, Petrovic D. Apolipoprotein E gene polymorphism effects triglycerides but not CAD risk in Caucasian women younger than 65 years. Ann Genet 2004;47:147–53.10.1016/j.anngen.2004.01.002Search in Google Scholar PubMed
29. Ranjith N, Pegoraro RJ, Rom L, Rajput MC, Naidoo DP. Lp(a) and apoE polymorphisms in young South African Indians with myocardial infarction. Cardiovasc J S Afr 2004;15:111–7.Search in Google Scholar
30. Kolovou GD, Anagnostopoulou KK, Mikhailidis DP, Panagiotakos DB, Pilatis ND, Cariolou MA, et al. Association of apolipoprotein E genotype with early onset of coronary heart disease in Greek men. Angiology 2005;56:663–70.10.1177/000331970505600603Search in Google Scholar PubMed
31. Aasvee K, Jauhiainen M, Kurvinen E, Tur I, Sundvall J, Roovere T, et al. Determinants of risk factors of atherosclerosis in the postinfarction period: the Tallinn MI study. Scand J Clin Lab Invest 2006;66:191–9.10.1080/00365510600564881Search in Google Scholar PubMed
32. Balcerzyk A, Zak I, Krauze J. Synergistic effects of apolipoprotein E gene epsilon polymorphism and some conventional risk factors on premature ischaemic heart disease development. Kardiologia Polska 2007;65:1058–67.Search in Google Scholar
33. Chu YR, Chu ZH, Zhu YZ. ApoE polymorphism and its association with premature coronary artery disease. Progress in Modern Biomedicine 2007;7:244–6.Search in Google Scholar
34. Djan I, Stokic E, Sakac D, Djan M, Obreht D, Erak M, et al. Case-control study of APOE gene polymorphism in young CHD patients and controls in the Serbian population. Arch Biol Sci 2011;63:89–98.10.2298/ABS1101089DSearch in Google Scholar
35. Stang A. Critical evaluation of the Newcastle-Ottawa scale for the assessment of the quality of nonrandomized studies in meta-analyses. Eur J Epidemiol 2010;25:603–5.10.1007/s10654-010-9491-zSearch in Google Scholar PubMed
36. Hayden JA, van der Windt DA, Cartwright JL, Cote P, Bombardier C. Assessing bias in studies of prognostic factors. Ann Intern Med 2013;158:280–6.10.7326/0003-4819-158-4-201302190-00009Search in Google Scholar PubMed
37. Anthopoulos PG, Hamodrakas SJ, Bagos PG. Apolipoprotein E polymorphisms and type 2 diabetes: a meta-analysis of 30 studies including 5423 cases and 8197 controls. Mol Genet Metab 2010;100:283–91.10.1016/j.ymgme.2010.03.008Search in Google Scholar PubMed
38. Higgins JP, Thompson SG, Deeks JJ, Altman DG. Measuring inconsistency in meta-analyses. Br Med J 2003;327:557–60.10.1136/bmj.327.7414.557Search in Google Scholar PubMed PubMed Central
39. Begg CB, Mazumdar M. Operating characteristics of a rank correlation test for publication bias. Biometrics 1994;50:1088–101.10.2307/2533446Search in Google Scholar
40. Egger M, Davey Smith G, Schneider M, Minder C. Bias in meta-analysis detected by a simple, graphical test. Br Med J 1997;315:629–34.10.1136/bmj.315.7109.629Search in Google Scholar
41. Evans D, Beil FU, Aberle J. Resequencing the APOE gene reveals that rare mutations are not significant contributory factors in the development of type III hyperlipidemia. J Clin Lipidol 2013;7:671–4.10.1016/j.jacl.2013.05.003Search in Google Scholar
42. Kitahara M, Shinomiya M, Shirai K, Saito Y, Yoshida S. Frequency and role of apo E phenotype in familial hypercholesterolemia and non-familial hyperlipidemia in the Japanese. Atherosclerosis 1990;82:197–204.10.1016/0021-9150(90)90041-GSearch in Google Scholar
43. Lin H-P, Kao J-T. Apolipoprotein ε2/3 genotype and type III hyperlipoproteinemia among Taiwanese. Clinica Chimica Acta 2003;330:173–8.10.1016/S0009-8981(03)00050-0Search in Google Scholar
44. Corella D, Ordovas JM. Single nucleotide polymorphisms that influence lipid metabolism: interaction with dietary factors. Annu Rev Nutr 2005;25:341–90.10.1146/annurev.nutr.25.050304.092656Search in Google Scholar PubMed
45. Son KY, Son HY, Chae J, Hwang J, Jang S, Yun JM, et al. Genetic association of APOA5 and APOE with metabolic syndrome and their interaction with health-related behavior in Korean men. Lipids Health Dis 2015;14:105.10.1186/s12944-015-0111-5Search in Google Scholar PubMed PubMed Central
46. Djousse L, Myers RH, Coon H, Arnett DK, Province MA, Ellison RC. Smoking influences the association between apolipoprotein E and lipids: The National Heart, Lung, and Blood Institute Family Heart Study. Lipids 2000;35:827–31.10.1007/S11745-000-0591-1Search in Google Scholar
47. Guangda X, Yuhua W. Apolipoprotein e4 allele and endothelium-dependent arterial dilation in Type 2 diabetes mellitus without angiopathy. Diabetologia 2003;46:514–9.10.1007/s00125-003-1060-5Search in Google Scholar PubMed
48. Wilson PW, Myers RH, Larson MG, Ordovas JM, Wolf PA, Schaefer EJ. Apolipoprotein E alleles, dyslipidemia, and coronary heart disease. The Framingham Offspring Study. J Am Med Assoc 1994;272:1666–71.10.1001/jama.1994.03520210050031Search in Google Scholar
49. Horejsi B, Spacil J, Ceska R, Vrablik M, Haas T, Horinek A. The independent correlation of the impact of lipoprotein(a) levels and apolipoprotein E polymorphism on carotid artery intima thickness. Int Angiol 2000;19:331–6.Search in Google Scholar
50. Andrade de Freitas RG, Goncalves Campana EM, Pozzan R, Brandao AA, Brandao AP, Campos Magalhaes ME, et al. APOE and LDLR Gene Polymorphisms and Dyslipidemia Tracking. Rio de Janeiro Study. Arq Bras Cardiol 2015;104:468–74.10.5935/abc.20150036Search in Google Scholar
51. Zhang X, Zhao H, Zhang J, Han D, Zheng Y, Guo X, et al. Gene environment interaction of GALNT2 and APOE gene with hypertension in the Chinese Han Population. Biomed Mater Eng 2015;26(Suppl 1):S1977–83.10.3233/BME-151501Search in Google Scholar PubMed
©2017 Walter de Gruyter GmbH, Berlin/Boston
Articles in the same Issue
- Frontmatter
- Editorial
- Commutable samples with assigned target concentrations may help us harmonise general chemistry results
- Reviews
- Performance of point-of-care HbA1c test devices: implications for use in clinical practice – a systematic review and meta-analysis
- Cardiac troponins and mortality in type 1 and 2 myocardial infarction
- Opinion Paper
- Criteria for assigning laboratory measurands to models for analytical performance specifications defined in the 1st EFLM Strategic Conference
- Genetics and Molecular Diagnostics
- External quality assessment for human papillomavirus 16/18 DNA detection and genotyping in Shanghai, China
- General Clinical Chemistry and Laboratory Medicine
- Analytical performance of 17 general chemistry analytes across countries and across manufacturers in the INPUtS project of EQA organizers in Italy, the Netherlands, Portugal, United Kingdom and Spain
- Commutability of proficiency testing material containing tobramycin: a study within the framework of the Dutch Calibration 2.000 project
- Optimization and validation of moving average quality control procedures using bias detection curves and moving average validation charts
- Extending laboratory automation to the wards: effect of an innovative pneumatic tube system on diagnostic samples and transport time
- Smart management of sample dilution using an artificial neural network to achieve streamlined processes and saving resources: the automated nephelometric testing of serum free light chain as case study
- An integrated proteomic and peptidomic assessment of the normal human urinome
- An alternative inhibition method for determining cross-reactive allergens
- Validation of a new assay for α-synuclein detection in cerebrospinal fluid
- Reference Values and Biological Variations
- Intra-individual variation of plasma trimethylamine-N-oxide (TMAO), betaine and choline over 1 year
- Cancer Diagnostics
- Predictive performance of TPA testing for recurrent disease during follow-up after curative intent surgery for colorectal carcinoma
- Cardiovascular Diseases
- Mid-regional pro-adrenomedullin (MR-proADM) and mid-regional pro-atrial natriuretic peptide (MR-proANP) in severe aortic valve stenosis: association with outcome after transcatheter aortic valve implantation (TAVI)
- Association between apolipoprotein E polymorphisms and premature coronary artery disease: a meta-analysis
- Urinary orosomucoid: a novel, early biomarker of sepsis with promising diagnostic performance
- Letters to the Editor
- CT or MRI
- Reply to: CT or MRI in the diagnosis of right lower quadrant abdominal pain?
- Quantification of daratumumab in the serum protein electrophoresis
- Response to: Interference of daratumumab on the serum protein electrophoresis
- Glycated albumin: correlation to HbA1c and preliminary reference interval evaluation
- Using “big data” to describe the effect of seasonal variation in thyroid-stimulating hormone
- IgE multiple myeloma: a new case report
- Therapeutic decision-making process in the intensive care unit: role of biological point-of-care testing
- How can we evaluate differences between serial measurements on the same sample? A new approach based on within-subject biological variation