
Reference change values to assess changes in concentrations of biomarkers of exposure in individuals participating in a cigarette-switching study
-
Oscar M. Camacho
 ,
Christopher J. Shepperd
,
Christopher J. Shepperd

Abstract
Background: In a previous clinical study, levels of biomarkers of exposure (BoEs) for specific toxicants were significantly reduced in smokers who switched from conventional cigarettes to reduced toxicant prototype (RTP) cigarettes. Very little is known about the biological variability of tobacco smoke BoEs within individuals and sub-groups, and the descriptive group-comparison statistics might not be sufficient to understand such changes. Therefore, we assessed how different statistical methods could be used to interpret changes in urine BoE levels at the individual level.
Methods: We used non-parametric statistical reference limits, the empirical rule and reference change values (RCVs) to assess changes in levels of BoEs related to four toxicants in cigarettes smoke. Current smokers [of 6 mg and 1 mg International Organization for Standardization (ISO) tar yields] were allocated to switching to RTP groups or non-switching control groups within their respective tar bands. There were two 6 mg tar study groups, with a non-switching group (CC6, n=46) and a group switching to an RTP containing tobacco-substitute sheet and modified filter (TSS6, n=49); and three 1 mg tar smoker groups, with one non-switching (CC1, n=42), a group switching to an RTP containing tobacco-substitute sheet and modified filter (TSS1, n=44) and one switching to an RTP containing an enzyme-treated tobacco and modified filter (BT1, n=47).
Results: Assessment of the direction of change showed that up to the 100% of subjects experienced a decrease in levels of some BoEs. Between 49% and 64% of subjects in the switching groups were classified as having decreased levels of 3-hydroxy-1-methylpropylmercapturic acid (HMPMA) by the non-parametric criterion, whereas only 2%–6% had reduced levels of N-nitrosoanatabine (NAT). Of non-switchers, in 7%–14% of those smoking 1 mg ISO tar yield cigarettes increases were classified across all BoEs. RCVs highlighted patterns with more detail, showing that most changes occurred within 14 days of switching. Among smokers who switched to 6 mg RTPs, 40%, 44%, 6% and 15%, respectively, were classified as experiencing significant decreasing levels of HPMA, 3-hydroxypropylmercapturic acid, 4-(methylnitrosamino)-1-(3-pyridyl)-1-butanol and NAT, whereas in the two 1 mg switching groups 46%, 22%, 11% and 52% and 43%, 27%, 2% and 16% had decreased levels of the same biomarkers. Up to five subjects in the 6 mg non-switching group were classified as having increased levels of all BoEs.
Conclusions: Although we believe that is not possible to determine whether the observed changes in BoEs reflect biological relevance, the use of reference values enables assessment of changes in BoEs at the individual level. Estimates of the BoE variability between subjects might aid study design and setting minimum targets for smoke toxicant yields for future development of RTPs.
Background
In 2001, the US Institute of Medicine (IoM) issued a report that suggested the development of what they termed potential reduced exposure products (PREPs) could be an approach to reduce the harm caused by tobacco use [1]. The IoM defined a PREP as a product that “(1) results in the substantial reduction in exposure to one or more tobacco toxicants and (2) can reasonably be expected to reduce the risk of one or more specific diseases or other adverse health effects”. The IoM proposal was based partly on the knowledge that health risks related to cigarette smoking increase with smoking duration and daily cigarette consumption but reduce following smoking cessation [2].
Of the more than 5000 identified tobacco smoke constituents, approximately 150 are considered to be toxicants [3]. The US Food and Drug Adminstration (FDA) has established a list of 96 harmful and potentially harmful consititents of tobacco and tobacco smoke that have been associated with cancer, cardiovascular disease, respiratory effects, developmental or reproductive effects, and addiction. The Study Group on Tobacco Product Regulation of the World Health Organization has proposed mandating limits on a group of nine specific toxicants in cigarette smoke [4].
Some progress has been made on the development of a scientific framework to assess PREPs since the IoM 2001 report. In relation to this, the FDA introduced the term modified-risk tobacco product (MRTP) [5], commissioned the IoM to produce a report on scientific standards for these products [6] and held workshops on the topic [7]. Various parties have since reviewed the state of the art and frameworks for assessing such products [8]. For example, Hatsukami et al. [9] reviewed the usefulness of several established biomarkers in the assessment of PREPs or MRTPs and concluded that no existing biomarkers were predictive of tobacco-related disease. Biomarker studies were categorised as those that measured chemical exposures to estimate the following: tobacco exposure, toxic effects, injury or potential harm, and direct measures of health outcomes. Subsequently, Hatsukami et al. [10] concluded that in the absence of acceptable biomarkers for cancer risk [with the possible exception of total 4-(methylnitrosamino)-1-(3-pyridyl)-1-butanol (NNAL) plus its glucuronides] the best way to evaluate PREPs and MRTPs in humans is to assess reductions in exposure, while noting the distinctions between exposure reduction, risk reduction and harm reduction.
More specifically, the FDA Center for Tobacco Products (CTP) raised 56 questions as research priorities. This paper aims to open the debate around question 21 of the CTP research priorities list: “What methods and measures best assess biological relevant changes in harmful and potentially harmful constituents in tobacco products and smoke in both nonclinical models and humans?” [11].
Several studies suggest that differences in levels of biomarkers of exposure (BoEs) to tobacco smoke toxicants can be observed in populations smoking cigarettes with different levels of toxicants. For example, BoE levels indicating exposure to nitrosamines were lower in smokers of cigarettes with low tobacco-specific nitrosamine yields than in those who smoke cigarettes with higher yields [12], and reductions were seen in BoEs to some vapour-phase toxicants following a switch from cellulose acetate-filtered cigarettes to carbon-filtered cigarettes [13].
We have previously reported results from a 6-week single-centre single-blind, randomised, controlled switching study conducted in Germany with locally recruited subjects [14]. The study evaluated levels of BoEs to a range of tobacco smoke toxicants in groups of volunteers who smoked commercial cigarettes throughout the study period or who switched from commercial to reduced-toxicant prototype (RTP) cigarettes [15]. On average, levels of BoEs were lower in smokers of RTPs than in smokers of conventional cigarettes. For vapour-phase toxicants, such as acrolein and 1,3-butadiene, reductions of ≥70% were typically observed in smoke chemistry and BoEs. Reductions in particulate-phase toxicants, such as tobacco-specific nitrosamines, aromatic amines and polyaromatic hydrocarbons, depended upon the technologies used, but in some cases were ≥80%. With one RTP some increases in other particulate-phase toxicants were observed.
Smoking behaviour varies widely from person to person, and affects exposure to tobacco smoke toxicants [16, 17]. Intervention with an RTP might, therefore, lead to changes in smoking behaviour that could be evaluable in the whole population or in sub-populations. In addition, genetic make-up might affect the metabolism of toxicants to their corresponding BoEs. Leischow et al. [18] reported an initiative aimed at setting out a research agenda to support FDA regulation in the USA and stated that characterisation of BoEs and health risks, including limitations, validation and moderator variables (e.g., ethnicity, sex), needed to be expanded. Hatsukami et al. [10], however, had previously noted that it is not possible to define the biological relevance of BoEs and results cannot generally be extrapolated to indicate risk. Thus, they purported future studies would need to include biomarkers of biological effect and biomarkers of risk to enable such assessments.
In this paper we describe the application of statistical approaches to our clinical data to assess changes in levels of BoEs at an individual level. First, we evaluate the suitability of reference limits quantified by several approaches for assessing individual change and to illustrate the concepts of within- and between-subject variability. Second we assess changes in BoE levels in individuals by use of reference change values (RCVs). Finally, we explore whether the results identify sub-populations that were not considered in the main analysis – that is, we investigate whether the group effects seen in the previous analysis could be the result of interaction effects between groups of smokers and those sub-populations.
Materials and methods
Clinical study
The clinical study (ISRCTN72157335) was conducted in Hamburg, Germany, in 301 healthy adults smokers (minimum age 21 years) who had smoked for >3 years, had smoked their current brand for >6 months and typically smoked between 10 and 30 cigarettes per day. The study was designed and conducted in accordance with the ethical principles of the Declaration of Helsinki and the International Committee on Harmonization for Good Clinical Practice. Details of the study design and protocol have been reported elsewhere [14]. Briefly, volunteer smokers were supplied with unbranded commercially available cigarettes similar to leading commercially available brands in Germany in 2007–2008, with the same International Organization for Standardization (ISO) tar yield as their usual brand (1 mg or 6 mg) for 2 weeks. On Day 14, participants entered the clinic for a short period of clinical confinement, during which cigarette consumption was recorded and 24 h urine samples were collected to measure baseline urinary levels of BoE to tobacco smoke toxicants. Two groups of subjects continued to smoke the 1 mg and 6 mg commercial cigarettes for the remaining 4 weeks of the study (commercial control groups CC1 and CC6, respectively), whereas the others were switched to an RTP cigarette with the same ISO tar yield as their usual brand (one 6 mg ISO tar yield RTP, TSS6, or one of two 1 mg ISO tar yield RTPs: TSS1, which contained tobacco-substitute sheet in the blend and high activity carbon and amine-functionalised resin in the filter, or BT1, which contained water and enzyme-treated Virginia tobacco in the tobacco blend and the same filter as TSS1). These products are described in greater detail elsewhere [15, 19–22]. Urine samples were collected and cigarette consumption recorded in two further periods of clinical confinement (Supplemental Data, Figure 1, which accompanies the article at http://www.degruyter.com/view/j/cclm.2014.52.issue-3/issue-files/cclm.2014.52.issue-3.xml). The final samples collected on Day 41 were used to assess the endpoints of the study. Non-smokers (not smoked for >5 years and baseline urinary cotinine levels <10 ng/mL) were enrolled to provide background levels of urinary BoEs from environmental and dietary sources. The ratio of male-to-female subjects was between 3:2 and 2:3, and groups were matched for age.
Twenty-one known BoEs for tobacco smoke toxicants with validated analytical methods [13, 23–28] were assessed in total (Supplemental Data, Table 1). Levels were reported as quantities of BoEs excreted over 24 h, and were calculated as products of the concentrations in urine and the volumes of urine produced by the subjects over the collection period. Statistical analyses have been carried out using amount of BoEs adjusted by cigarette consumption. Reasons for using this approach are stated in the “Statistical analysis endpoints” section. Four of the investigated biomarkers, NNAL, N-nitrosoanatabine (NAT), 3-hydroxypropylmercapturic acid (HPMA) and 3-hydroxy-1-methylpropylmercapturic acid (HMPMA), are used to illustrate the methods of this report.
Statistical analysis endpoints
To investigate the number of subjects driving observed changes in the original group analyses, we initially needed to define what constitutes a significant change. For simplicity and consistency with previous analyses, hereafter change is defined as BoE level on Day 41 (end of study) minus the level on Day 14 (except for in the non-parametric method), and can be calculated as
Endpointi=BoE day 41i–BoE day 14i
where i represents a subject. Figure 2 of the Supplemental Data illustrates the distribution of these differences across smoker groups for HPMA. Statistical analyses were conducted with SAS version 9.3, and graphics were developed with JMP 10 (both from SAS Institute, Cary, NC, USA), unless stated otherwise.
The endpoint of change can be expressed as two different magnitudes: first as the total amount of a BoE (excreted in 24 h), and second as the total amount of a BoE adjusted by the number of cigarettes smoked per subject. As the two magnitudes yield similar results (Figure 1), we have focused on the adjusted magnitude for this study, as this approach accounts for differences in levels of cigarette consumption. The numbers of cigarettes smoked by subjects were estimated as the mean values of the self-reported daily consumption and the number of tips collected during confinement periods of the clinical study. As temporary variations can lead to disparities between self-reported and counted consumption, the mean values of those quantities is believed to give the best estimate of cigarette consumption per subject.
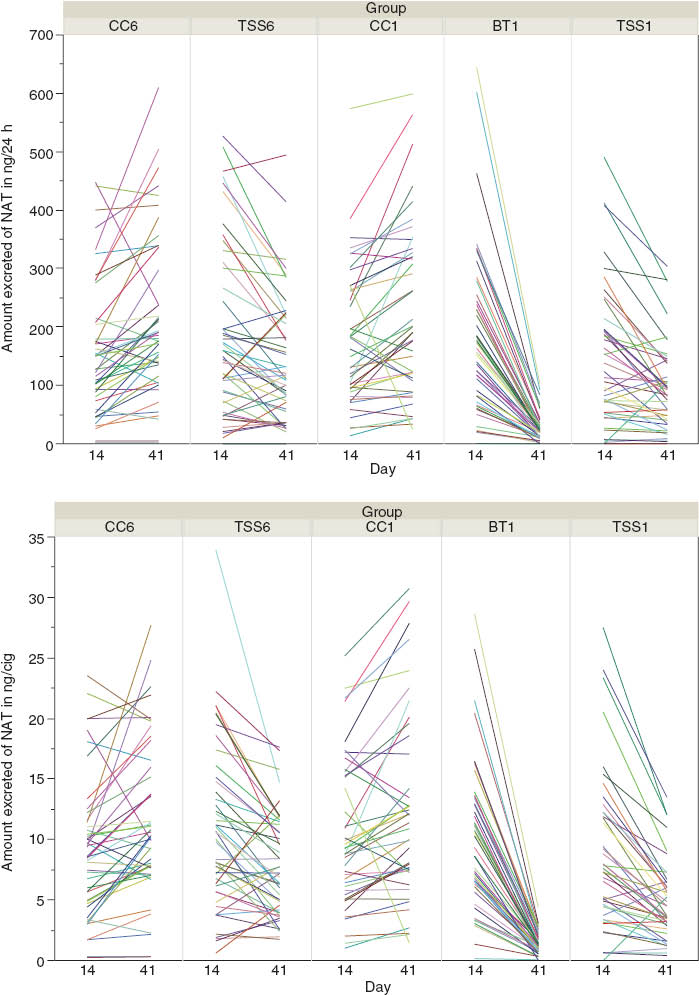
Amount of NAT excreted on Days 14 and 41 (top) and amount adjusted by the number of cigarettes smoked (bottom).
NAT, N-nitrosoanatabine.
Reference values
Increases or reductions in BoE levels within individuals might be the result of natural variability rather than a direct consequence of switching to an RTP. This variability will be the sum of analytical variability of methods used plus biological variability within individuals. We used several methods to calculate reference values to assess suitability of statistical approaches to monitor changes at the individual level.
Non-parametric references
We assessed the use of non-parametric statistical reference intervals. For these, reference limits were calculated from data for all smokers by tar band on Day 14 according to the methodology of the International Federation of Chemical Chemistry [29] and the Clinical and Laboratory Standards Institute (CLSI) [30] – i.e., references for 1 mg and 6 mg smokers for each BoE. We calculated 95% confidence intervals (CIs), as BoE levels for most subjects in the smoker groups would be expected to fall within these limits. We categorised BoEs as increasing, decreasing or not changing, dependent on whether the yield results were above, below or inside the expected ranges. Ninety percent confidence limits (90% CLs) were also estimated for each boundary of the 95% non-parametric CIs.
Empirical rule
We compared results from the non-parametric approach and its interpretation with those obtained by the empirical rule of statistics. In this context, to apply the empirical rule we departed from the hypothesis that no change would give a mean of zero, and we estimated the standard deviation (SD) for each group (SDj) from the changes within groups to calculate reference limits by group (j=TSS6, CC6, BT1, CC1 and TSS1). Therefore, the mean is set to 0 and the reference limits are set at 2 SDj and 3 SDj from that reference. Subjects yielding responses >3 SDj or <−3 SDj are considered to have experienced very significant changes. Changes between 2 SDj and 3 SDj or −2 SDj and −3 SDj are deemed significant, and other responses (between 2 SDj and −2 SDj) are classified as no change. Figure 2 illustrates how differences between time-points are represented and their empirical reference limits by group with their means set at 0.
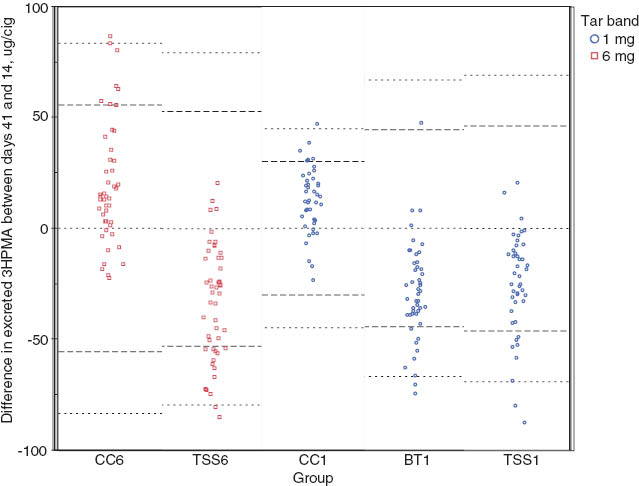
Differences between Days 14 and 41 with empirical reference intervals by group of smokers.
The mean is set as zero and the reference lines at set at 2σ and 3σ. HPMA, 3-hydroxypropylmercapturic acid.
Reference change values
Although empirical reference limits provide information at the individual level within groups, the generalisability of results is limited. An improvement to this approach is the use of RCVs. The RCV method is conceptually similar to the empirical method. Individual subjects’ BoE levels are deemed to be stationary at a specific level and some natural or random variation will occur over time. RCVs were first introduced by Harris and Yasaka [31] and later developed by Fraser and Harris [32, 33]. This methodology provides reference values based on within-subject (CVI) and between-subject (CVG) biological variation and, therefore, enables dissociation between analytical and biological variability. RCVs are widely implemented to help clinicians in the interpretation of laboratory tests intended to monitor subjects over time and/or to assess the prognosis of diseases [34, 35]. This methodology enables incorporation of more than two time-points into the analysis to calculate the sources of variability. Calculations of reference values are based on data collected on Days 14, 28 and 41 in the two commercial cigarette control groups.
The overall variability is assumed to have two main sources: within- and between-subject variability. Within-subject variability can be seen as random variation of values from homeostatic biomarker levels in response to environmental factors per subject and as variations in analytical methods over time. For this report, variability within and between subjects was calculated with repeated-measures analysis, by use of PROC MIXED software, with subject as a random factor. Following the recommendations of Fraser and Harris [32], possible outliers were examined. Few observations for each biomarker were identified as statistical outliers, but, given that outlying values did not consistently belong to any specific subject across biomarkers and there was no evidence of clerical error, we decided not to remove any observations from the analysis, as recommended by the CLSI [30]. Homogeneity of variances was accepted and a Gaussian (at least symmetric) distribution assumed. Homogeneity of variances was also examined with the index of heterogeneity [32].
Within-subject variability (CVI) was estimated as the within-subject mean sum of squares. The between-subject variability (CVG) was calculated as the between-subject mean sum of squares minus the within-subject mean sum of squares, divided by the number of measurements per subject. The RCVs were calculated two-sided as 1.96×√2(CVI2+CVBA2) × overall mean of endpoint, where CVBA is the between analytical batches variation [36, 37]. Categorisation of subjects as experiencing change or not were performed with respect to the RCVs in a 2-week period, i.e., Day 28–Day 14 and Day 41–Day 28.
Sub-group analyses
We assessed whether changes in BoEs could be detected in groups of subjects not considered previously. The explanatory variables assessed in the clinical study as possible determinant factors that could have an impact on RTP effects were sex, age and body mass index. Relationships between the statistical endpoints in this study and these explanatory variables were assessed with general linear-model analyses. Variables and the smoker groups were modelled in pairs. Three general linear models, each of which included as variables smoking group, one of the explanatory variables and interaction, were used to find possible relationships by BoE, for which we calculated F-statistics for each variables and their interactions terms. Models containing only main effects were assessed if an interaction effect was found not to be statistically significant. Larger models were deemed inappropriate due to small sample size. The study, however, was not designed to include this type of analysis, which limits generalisability of results and leads to lack of statistical power. Thus, the analyses should be viewed as data explorations that might lead to future studies. Model assumptions were visually assessed and were considered acceptable given the limitations previously stated. Tukey’s HSD post-hoc test was used to assess differences between the levels of the significant parameters in the regression model.
Results
In simple examination of differences between BoE levels, where values on Day 14 and those on Day 41 were viewed as dichotomous variables, positive differences indicate increases in biomarkers levels and negative differences indicate reductions. Intuitively, in absence of a switching effect, it would be expected that the differences in biomarker yield levels would be distributed randomly around zero, with observed variations due to reasons outside the control of the trial design. These variations are commonly known as biological variability.
In general, in the groups switching to an RTP, the proportion of subjects classified as having decreased BoE levels is much higher than those classified as having increased levels, which suggests a switching effect. In the case of HMPMA in group TSS6, 100% of subjects were classified as having decreased levels (Table 1). However, absolute increases or decreases might suggest trends in response, although it could be argued that a similar trend would have been observed if the subjects had remained smoking the control products. In fact, the control groups seemed to experience the opposite effect, with between 70% and 80% of subjects being classified as having increased BoE levels across most biomarkers (Table 1).
Number of subjects classified as increase/decrease base of endpoint sign and respective percentages for the four biomarkers, by product group.
| Group | HPMA | HMPMA | NNAL | NAT | ||||
|---|---|---|---|---|---|---|---|---|
| Increase | Decrease | Increase | Decrease | Increase | Decrease | Increase | Decrease | |
| CC6 | 36 (78.3%) | 10 (21.7%) | 33 (73.3%) | 12 (26.7%) | 34 (73.9%) | 12 (26.1%) | 34 (73.9%) | 12 (26.1%) |
| TSS6 | 5 (10.2%) | 44 (89.8%) | 0 | 49 (100%) | 15 (30.6%) | 34 (69.4%) | 12 (24.5%) | 37 (75.5%) |
| CC1 | 34 (81.0%) | 8 (19.0%) | 26 (61.9%) | 16 (38.1%) | 24 (57.1%) | 18 (42.9%) | 33 (78.6%) | 9 (21.4%) |
| BT1 | 4 (8.5%) | 43 (91.5%) | 3 (6.4%) | 44 (93.6%) | 3 (6.4%) | 44 (93.6%) | 0 | 47 (100%) |
| TSS1 | 3 (6.8%) | 41 (93.2%) | 2 (4.5%) | 42 (95.5%) | 27 (61.4%) | 17 (38.6%) | 6 (13.6%) | 38 (86.4%) |
BT1, 1 mg ISO tar yield reduced-toxicant product with treated tobacco in blend; CC1, 1 mg ISO tar yield commercial cigarette; CC6, 6 mg ISO tar yield commercial cigarette; TSS1, 1 mg ISO tar yield reduced-toxicant product with tobacco substitute sheet; TSS6, 6 mg ISO tar yield reduced-toxicant product with tobacco substitute sheet.
Non-parametric references
In an attempt to identify subjects who experienced changes in BoE levels greater than the expected biological variability, we calculated non-parametric 95% CI at baseline and classified subjects with respect to these references at Day 41.
Hence, non-parametric 95% CI were calculated for the 95 and 133 subjects who at Day 14 were smoking, respectively, 6 mg and 1 mg ISO tar yield control commercial products (Table 2). The CIs are systematically higher for the 6 mg tar band than for the 1 mg band, with the exception of those for NAT, for which the intervals are very similar.
Non-parametric 95% confidence intervals for biomarkers and the associated lower and upper 90% confidence limits for each boundary at Day 14 and frequency tables classifying subjects with respect to non-parametric 95% reference limits.
| Group | HPMA | HMPMA | NNAL | NAT | ||||||||
|---|---|---|---|---|---|---|---|---|---|---|---|---|
| Estimate | LowL | UpL | Estimate | LowL | UpL | Estimate | LowL | UpL | Estimate | LowL | UpL | |
| 6 mg tar band | ||||||||||||
| HIGH | 148.45 | 131.15 | 165.92 | 138.53 | 109.36 | 143.22 | 35.27 | 30.91 | 38.97 | 23.06 | 21.71 | 28.68 |
| LOW | 25.71 | 1.30 | 33.86 | 21.26 | 15.85 | 31.33 | 4.95 | 2.02 | 6.71 | 0.33 | 0.03 | 1.40 |
| 1 mg tar band | ||||||||||||
| HIGH | 125.97 | 114.74 | 136.09 | 99.55 | 85.08 | 108.61 | 29.14 | 25.31 | 31.21 | 25.58 | 20.52 | 33.96 |
| LOW | 21.36 | 15.67 | 29.60 | 16.68 | 11.75 | 18.18 | 3.76 | 0.88 | 5.20 | 0.37 | 0.04 | 1.76 |
| Decrease | No change | Increase | Decrease | No change | Increase | Decrease | No change | Increase | Decrease | No change | Increase | |
| 6 mg tar band | ||||||||||||
| CC6 | 0 | 43 (93%) | 3 (7%) | 1 (2%) | 43 (94%) | 2 (4%) | 2 (4%) | 42 (91%) | 2 (4%) | 0 | 44 (96%) | 2 (4%) |
| TSS6 | 8 (16%) | 41 (84%) | 0 | 32 (65%) | 17 (35%) | 0 | 0 | 49 (100%) | 0 | 1 (2%) | 48 (98%) | 0 |
| 1 mg tar band | ||||||||||||
| CC1 | 0 | 36 (86%) | 6 (14%) | 0 | 38 (90%) | 4 (10%) | 0 | 39 (93%) | 3 (7%) | 0 | 38 (90%) | 4 (10%) |
| BT1 | 10 (21%) | 37 (79%) | 0 | 23 (49%) | 24 (51%) | 0 | 5 (11%) | 42 (89%) | 0 | 3 (6%) | 44 (94%) | 0 |
| TSS1 | 7 (16%) | 37 (84%) | 0 | 28 (64%) | 16 (36%) | 0 | 1 (2%) | 43 (98%) | 0 | 1 (2%) | 43 (98%) | 0 |
The boundary for the 95% confidence interval is HIGH/LOW. BT1, 1 mg ISO tar yield reduced-toxicant product with treated tobacco in blend; CC1, 1 mg ISO tar yield commercial cigarette; CC6, 6 mg ISO tar yield commercial cigarette; LowL, lower limit; TSS1, 1 mg ISO tar yield reduced-toxicant product with tobacco substitute sheet; TSS6, 6 mg ISO tar yield reduced-toxicant product with tobacco substitute sheet; UpL, upper limit.
For each 95% boundary (reference), 90% CLs were calculated as a measure of uncertainty of these estimates. By visually comparing estimates (Table 2), differences in BoE between tar band references were suggested in the upper boundary (labelled HIGH). HMPMA upper bound CLs do not overlap between tar bands, which suggests that smokers of cigarettes in a higher tar band reach significantly higher yields than those who smoker lower yield cigarettes. The limits for the lower bound references (labelled LOW) do not suggest differences between tar bands. For HPMA and NNAL the upper boundary CLs overlapped slightly between tar bands but references are outside the 90% CL of the other tar band, while no differences between tar band references for NAT were suggested.
We used the non-parametric 95% CI to classify changes at Day 41 as increases if subjects yielded BoE levels above those limits, decreases if BoE levels were below the interval lower boundary, and not changed if BoE levels remained within the intervals estimates. Frequencies show that levels did not change for most of the subjects (Table 2). For NNAL and NAT, at least 89% of subjects were within the intervals, which is in contrast to the decreases of up to 100% seen for BT1 when only the direction of change of the endpoint was assessed (Table 1). Patterns of decreases for HMPMA are still clearly visible with 65%, 49% and 64% of subjects being classified as having decreased BoE levels with TSS6, BT1 and TSS1, respectively. Some increases for control groups were also suggested with increases of 10% or more for subjects in the CC1 group with respect to three of the biomarkers.
Frequencies generated by the non-parametric approach are difficult to interpret, given that 95% CIs are calculated from a snap-shot at baseline and, therefore, do not take into account changes at the individual level. If the level of a BoE at Day 14 is close to or outside a boundary, no change or a small change relative to other individuals could appear as an increase or decrease, whereas substantial changes in individuals with Day 41 values within the boundaries would be categorised as no change.
Following this reasoning, we could have calculated the 95% non-parametric CIs of the differences (Day 41–Day 14) or within-subject variability. On this occasion, however, we can only use data for subjects in the control groups (n<50). Thus, we were precluded from using this approach as the CLSI recommends use of at least 120 observations.
Empirical rule
As an alternative to non-parametric CIs, the empirical rule was used to calculate approximations of the references based on the differences of BoE levels between Day 14 and Day 41, we assumed that these differences are symmetrically distributed around the mean.
With the empirical reference intervals centred at 0, differences in BoE levels between Days 14 and 41 were assessed with respect to 2*SD and 3*SD by smoking group. Although general patterns are maintained, the number of subjects classified as experiencing change is significantly different to numbers obtained with previous approaches (Supplemental Data, Table 2).
Evaluation of the direction of BoE changes showed that 94% of subjects experienced reductions in NNAL levels in group that received the BT1 RTP (Table 1). With use of the empirical rule references, however, 75% of smokers fall within the normal expected variability (no change) and the remaining 25% experienced significant reductions in NNAL levels (Supplemental Data, Table 2). Increases are also suggested for some control groups, with 13% of subjects experiencing significant increases and 4% very significant increases for HPMA in the CC6 group. HPMA and HMPMA were both shown by group analysis to have reduced levels in the BT1 RTP group, but the empirical rule criterion showed that 15% of subjects had significant decreases and 4% had very significant decreases for HPMA, whereas for HMPMA the decreases were significant in 38% and very significant in 7% (Supplemental Data, Table 2).
Reference change values
RCVs are used to assess change for two consecutive measurements, but they can be based on more than two time-points by calculation of within- and between-subject variability. The methodology also enables dissociation of within-subject variability from analytical variability.
Biomarker data collected from subjects in the commercial control groups at Days 14, 28 and 41 were used to determine subject variability for the two tar bands (Table 3).
RCVs and coefficients of variation for the 1 mg and 6 mg ISO tar bands.
| Group/biomarker | CVWA,% | CVBA,% | CVA, % | CVW, % | CVG, % | CVI, % | Mean | CVI+BA, % | RCV | |
|---|---|---|---|---|---|---|---|---|---|---|
| CC1 | HPMA, μg/cig | 10.1 | 8.8 | 13.4 | 16.1 | 39.2 | 8.9 | 78.2 | 12.5 | 33.6 |
| HMPMA, μg/cig | 0.51 | 2.57 | 2.6 | 22.3 | 43.9 | 22.1 | 56.2 | 22.3 | 34.1 | |
| NNAL, ng/cig | 9.06 | 9.05 | 12.8 | 22.5 | 33.3 | 18.4 | 16.4 | 20.5 | 9.4 | |
| NAT, ng/cig | 7.77 | 6.55 | 10.2 | 26.9 | 56.4 | 24.9 | 11.5 | 25.7 | 8.2 | |
| CC6 | HPMA, μg/cig | 10.1 | 8.8 | 13.4 | 22.3 | 34.3 | 17.9 | 87.3 | 19.9 | 53.0 |
| HMPMA, μg/cig | 0.51 | 2.57 | 2.6 | 27.8 | 29.0 | 27.6 | 70.6 | 27.8 | 53.6 | |
| NNAL, ng/cig | 9.06 | 9.05 | 12.8 | 26.0 | 41.3 | 22.6 | 18.2 | 24.4 | 12.3 | |
| NAT, ng/cig | 7.77 | 6.55 | 10.2 | 29.7 | 49.6 | 28.0 | 10.0 | 28.7 | 8.0 | |
CC1, 1 mg ISO tar yield commercial cigarette; CC6, 6 mg ISO tar yield commercial cigarette; CVA, analytical variation; CVBA, between-batch analytical variation; CVG, between-subject biological variation; CVI, within-subject biological variation; CVI+BA, within-subject biological variation plus between-batch analytical variation; CVW, within-subject coefficients of variance; CVWA, within-batch analytical variation; HMPMA, 3-hydroxy-1-methylpropylmercapturic acid; HPMA, 3-hydroxypropylmercapturic acid; NAT, N-nitrosoanatabine; NNAL, 4-(methylnitrosamino)-1-(3-pyridyl)-1-butanol; RCV, reference change value.
Differences between two serial measurements larger in absolute value than the corresponding RCV are assessed as change. On the basis of these RCVs, change frequencies were calculated by tar band and all smoking groups (Supplemental Data, Tables 3 and 4).
Although results generally seem to be more conservative with the empirical rule method, overall similar patterns emerged from that and the RCV approach. Most changes seemed to occur within the first 2-week period (Days 14–28), which indicates a rapid response of the levels of these biomarkers to changes in cigarette smoke. If it is accepted that BoE levels reached a homeostatic set-point within the study period, the frequency of changes should be comparable with the total frequencies obtained when the endpoint BoE level on Day 41 minus that on Day 14 is used (Table 4).
Number and percentages of subjects, by product group, with respect to reference change values.
| Biomarker | 6 mg | 1 mg | ||||
|---|---|---|---|---|---|---|
| CC6 | TSS6 | CC1 | BT1 | TSS1 | ||
| HPMA | Increase | 8 (17%) | 0 | 3 (7%) | 1 (2%) | 0 |
| No change | 38 (83%) | 35 (71%) | 39 (93%) | 26 (55%) | 33 (75%) | |
| Decrease | 0 | 14 (29%) | 0 | 20 (45%) | 11 (25%) | |
| HMPMA | Increase | 6 (13%) | 0 | 2 (5%) | 0 | 0 |
| No change | 38 (83%) | 29 (59%) | 40 (95%) | 31 (66%) | 32 (73%) | |
| Decrease | 2 (4%) | 20 (41%) | 0 | 16 (34%) | 12 (27%) | |
| NNAL | Increase | 0 | 0 | 4 (10%) | 0 | 4 (9%) |
| No change | 46 (100%) | 48 (98%) | 34 (80%) | 37 (79%) | 39 (89%) | |
| Decrease | 0 | 1 (2%) | 4 (10%) | 10 (21%) | 1 (2%) | |
| NAT | Increase | 2 (4%) | 0 | 4 (10%) | 0 | 0 |
| No change | 43 (94%) | 43 (88%) | 37 (88%) | 23 (49%) | 38 (86%) | |
| Decrease | 1 (2%) | 6 (12%) | 1 (2%) | 24 (51%) | 6 (14%) | |
BT1, 1 mg ISO tar yield reduced-toxicant product with treated tobacco in blend; CC1, 1 mg ISO tar yield commercial cigarette; CC6, 6 mg ISO tar yield commercial cigarette; HMPMA, 3-hydroxy-1-methylpropylmercapturic acid; HPMA, 3-hydroxypropylmercapturic acid; NAT, N-nitrosoanatabine; NNAL, 4-(methylnitrosamino)-1-(3-pyridyl)-1-butanol; TSS1, 1 mg ISO tar yield reduced-toxicant product with tobacco substitute sheet; TSS6, 6 mg ISO tar yield reduced-toxicant product with tobacco substitute sheet.
Discrepancies between numbers of observations for the BT1 RTP in different tables are the result of missing data for one subject on Day 28.
Sub-group analyses
Table 5 displays the categories created for the explanatory variables used in the sub-group analysis. Categories for age aim to balance the number of observations between categories rather than attending to any known biological reasons for change in BoE. Table 5 shows the p-values of the statistical models main effects and their interaction with group.
Categories and frequency counts for the explanatory variables by group and p-values for explanatory variables and their interactions with group of smokers, where the response variable is the biomarker at Day 41–Day 14.
| Sub-group | Group | |||||||
|---|---|---|---|---|---|---|---|---|
| CC6 | TSS6 | CC1 | BT1 | TSS1 | ||||
| Sex | Male | 23 | 23 | 20 | 23 | 23 | ||
| Female | 23 | 26 | 22 | 24 | 21 | |||
| Age, years | ≥50 | 4 | 9 | 8 | 9 | 9 | ||
| 30–49 | 29 | 21 | 21 | 23 | 26 | |||
| 21–29 | 13 | 19 | 13 | 15 | 9 | |||
| BMI, kg/m2 | >30 (severely overweight) | 6 | 5 | 7 | 6 | 6 | ||
| 25–<30 (overweight) | 21 | 21 | 17 | 13 | 17 | |||
| <25 (normal) | 19 | 23 | 18 | 28 | 21 | |||
| Explanatory variables and their interaction with group of smokers | Biomarker | |||||||
| HPMA | HMPMA | NNAL | NAT | |||||
| 6 mg | 1 mg | 6 mg | 1 mg | 6 mg | 1 mg | 6 mg | 1 mg | |
| Sex | 0.8343 | 0.1632 | 0.3207 | 0.0719 | 0.0167 | 0.5415 | 0.0061 | 0.2014 |
| Sex*group | 0.2500 | 0.7198 | 0.0008 | 0.0208 | 0.2831 | 0.7382 | 0.0807 | 0.6478 |
| Age | 0.6171 | 0.1725 | 0.2828 | 0.4034 | 0.0343 | 0.7628 | 0.4398 | 0.0952 |
| Age*group | 0.0260 | 0.0826 | 0.3539 | 0.5210 | 0.0283 | 0.0495 | 0.0203 | 0.2721 |
| BMI | 0.7393 | 0.7670 | 0.9898 | 0.3126 | 0.3994 | 0.5351 | 0.3889 | 0.9567 |
| BMI*group | 0.5431 | 0.1956 | 0.4426 | 0.2075 | 0.3308 | 0.0957 | 0.0739 | 0.7346 |
BT1, 1 mg ISO tar yield reduced-toxicant product with treated tobacco in blend; CC1, 1 mg ISO tar yield commercial cigarette; CC6, 6 mg ISO tar yield commercial cigarette; HMPMA, 3-hydroxy-1-methylpropylmercapturic acid; HPMA, 3-hydroxypropylmercapturic acid; NAT, N-nitrosoanatabine; NNAL, 4-(methylnitrosamino)-1-(3-pyridyl)-1-butanol; TSS1, 1 mg ISO tar yield reduced-toxicant product with tobacco substitute sheet; TSS6, 6 mg ISO tar yield reduced-toxicant product with tobacco substitute sheet.
For statistically significant effects we assess differences between categories with post-hoc tests (α=0.1). For HMPMA levels, although differences between sexes were expected for subjects smoking different products, we found a significant difference within the TSS6 group (reduction in HMPMA levels; 63.7 μg per cigarette for men vs. 40.1 μg per cigarette for women, p=0.0094). A similar effect was observed within the TSS1 RTP group (31.5 μg per cigarette vs. 17.5 μg per cigarette, p=0.0564). Statistical significance for the variable sex for NNAL and NAT is likely to reflect a significant increase in biomarker levels for males in the CC6 group (Supplemental Data, Table 5).
Differences in responses were seen for different age-groups, owing to significant mean decreases in HPMA levels for smokers aged 30–49 years in the TSS6 RTP group compared with those in smokers aged 50 years and older (mean at 43 μg per cigarette vs. 12 μg per cigarette, p=0.0503). NNAL levels differed between smokers aged 21–29 and those aged 30–49 years in the CC6 group (0.5 μg per cigarette decrease vs. 6 μg per cigarette increase, p=0.0093). Finally, NAT results were similar to the HPMA results in the TSS6 RTP group. Greater reductions were seen in the 30–49 year age-group than the 50 years and older age-groups (4.3 ng per cigarette vs. 0.5 ng per cigarette, p=0.0657).
Body mass index did not show any significant effect on biomarker levels.
As sample sizes were small, we calculated means and 95% CI to see whether they would be more informative than testing statistical significance. Increases in biomarker levels were shown for male sub-groups belonging to the 6 mg control group across all biomarkers and in HPMA for females. In the other groups results seem to be similar for both genders (Supplemental Data, Table 5). With respect to age, results suggest that subjects aged 50 years or older did not experience reductions in HPMA levels in the TSS6 RTP group, whereas these were very significant in other age-groups. A similar effect is seen for NAT.
Discussion
These statistical analyses help us to explore whether all or only a sub-set of subjects experienced changes in BoE levels, which could not be assessed in the group analyses of the original clinical study [14]. Calculation of RCVs is suggested to be a suitable approach for assessing BoE changes at the individual level in sequential results. Our findings for four BoE suggest that the RCVs could be used effectively to monitor other BoE levels and for interpretation of data in future clinical studies.
Other simplistic approaches were explored to try to illustrate statistical concepts, such as within- and between-subject variability, in an intuitive manner and to evaluate the impact of the statistical reference values, but the RCV approach presented several advantages. RCVs are based on changes over time rather than on levels at a single time-point. Thus, this approach seems to enable assessment of the magnitude of change by individual, whereas changes are not shown by the other approaches because they remain within the static overall reference limits [38]. Data from more than two time-points can be used with the RCV method, and is indeed preferable to improve estimates of subjects’ variability. This method also enables dissociation of biological variability from analytical variability.
Some disadvantages to the RCV method have previously been put forward [39, 40] but could be related to issues in the clinical practice rather than being disadvantages of the approach itself. Fraser [39] listed as disadvantages the overwhelming amount of statistical information that reached clinicians, uncritical use of Z-scores and possible dependence of RCVs on the frequency of the analysis and health status. To apply the method correctly, sophisticated equipment, education of personnel and development of common terminologies might be required.
The number of subjects in our study who experienced significant reductions for some biomarkers encourages continued research in this area. Nearly half of the subjects in the BT1 RTP group experienced a reduction for NAT and HPMA, and in the TSS6 RTP group around 30% had a reduction in HPMA. As noted by Hatsukami and colleagues [9], however, these reductions cannot be used to assess disease risk associated with RTPs, and reductions could not be compared with the BoE levels in non-smokers or after smoking cessation. Hecht et al. [41], however, showed levels of NNAL that were 7.6% of the original values 6 weeks after cessation. Reductions of this degree were not achieved by any of the RTPs in our study.
Extrapolation of calculated RCV values to other settings might be limited. Subjects smoking products in different tar bands are likely to yield different RCVs, and whether the RCVs reported here are representative of those for the specific tar bands tested (1 mg or 6 mg) would need to be assessed further. Within-subject variation is generally assumed to represent the homeostatic mechanism in humans and, therefore, to be constant [33]. Within-subject variation might be similar in subjects with different health statuses [40], particularly in those with chronic stable diseases [42]. The stability of within-subject variation between conditions could be also applicable to smokers of similar tar bands, which would facilitate calculation of RCVs by determining analytical variation and the expected mean for the BoEs of interest. Some biological endpoints may randomly fluctuate around the homeostatic point with a log-normal rather than normal distribution and, therefore, an alternative method for calculating RCVs should be applied [40, 43].
Although it has been stated that within-subject variability for most analytes does not correlate with the length of time between analyses, in some cases the CVI could increase as the time over which the analyses are performed lengthens. Variations between CVI values could lead to an increased risk of false-positive or false-negative results [44]. Petersen [45] suggests that repeated sampling should be performed as a measure to control for false positives. The repeat samples must come from the same subjects but with enough time between samples to avoid auto-correlation of measurements, although before the homeostatic set-point occurs. If the repeated sample confirms the result, the probability of false-positive results decreases considerably. The 75% of changes we observed in the first 2-week period of our clinical trial were confirmed in the second 2-week period.
Sex was shown to be a statistically significant factor for change in HMPMA level and, therefore, it should be considered in statistical models of group effect, and separate RCVs for males and females should be generated. We studied endpoints adjusted for the number of cigarettes smoked by subject. The use of creatinine normalisation and urine volume are other adjustments that have been used with urinary biomarkers [46, 47]. Pinches et al. [47] suggest that correction for creatinine is more appropriate than correction for volume when comparing biomarker values between sexes.
In our reconsideration of question 21 in the list of research priorities from the CTP [11], we conclude that is not possible to determine whether the observed changes in BoEs in smokers reflect biological relevance. Nevertheless, the methodology presented in this report permits evaluation of serial changes in BoEs for harmful and potentially harmful smoke constituents from tobacco products by dividing variability in relation to its source. Smokers experiencing changes outside the within-subject variability (>RCV) may be viewed as experiencing a significant change in BoE levels, although the impact of those changes in the subject is difficult to evaluate and outside the scope of this paper.
In this context, RCVs may be used to monitor BoE levels at the individual level in cigarette switching studies. Estimates of the variability of BoE levels among subjects may aid sample size calculations for cigarette switching studies assessing these endpoints. Estimates of biological variability could be used as a guide for MRTP developers to set minimum targets in smoke toxicant yields that promote a reduction in exposure to these toxicants for all users.
Conflict of interest statement
Authors’ conflict of interest disclosure: The authors stated that there are no conflicts of interest regarding the publication of this article. Research funding played no role in the study design; in the collection, analysis, and interpretation of data; in the writing of the report; or in the decision to submit the report for publication.
Research funding: The work was funded by British American Tobacco.
Employment or leadership: The authors declare that OMC, CJS, AE and CJP are current employees of British American Tobacco. IM was the principal investigator at the clinic where the study was carried out and is employed by Momentum Pharma Services in Hamburg, Germany.
References
1. Stratton K, Shetty P, Wallace R, Bondurant S, editors. Clearing the smoke: assessing the scientific base for tobacco harm reduction. Washington, DC: National Academy of Sciences, 2001.Suche in Google Scholar
2. Doll R, Peto R, Wheatley K, Grey R, Sutherland I. Mortality in relation to smoking: 40 years observation on male British doctors. Br Med J 1994;309:901–1110.1136/bmj.309.6959.901Suche in Google Scholar PubMed PubMed Central
3. Fowles J, Dybing E. Application of toxicological risk assessment principles to the chemical constituents of cigarette smoke. Tob Control 2003;12:424–30.10.1136/tc.12.4.424Suche in Google Scholar PubMed PubMed Central
4. Burns DM, Dybing E, Gray N, Hecht SS, Anderson C, Sanner T, et al. Mandated lowering of toxicants in cigarette smoke: a description of the World Health Organisation TobReg proposal. Tob Control 2008;17:132–41.10.1136/tc.2007.024158Suche in Google Scholar PubMed PubMed Central
5. Public law 111-31 The family smoking prevention and tobacco control act. Available from: http://www.gpo.gov/fdsys/pkg/PLAW-111publ31/pdf/PLAW-111publ31.pdf. Accessed 22 July, 2013.Suche in Google Scholar
6. Scientific standards for studies on modified risk tobacco products. Available from: http://www.nap.edu/catalog.php?record_id#equal#13294. Accessed 22 July, 2013.Suche in Google Scholar
7. Public workshop: scientific evaluation of modified risk tobacco product (MRTP) applications. Available from: http://www.fda.gov/TobaccoProducts/NewsEvents/ucm259201.htm. Accessed 22 July, 2013.Suche in Google Scholar
8. Shields PG, Connolly G, Cummings M, Djordjevic M, Hatsukami DK, Henningfield JE, et al. Providing a science base for the evaluation of tobacco products. Available from: https://gushare.georgetown.edu/lombardicomm/Website/Tobacco/conceptual_framework.pdf. Accessed 22 July, 2013.Suche in Google Scholar
9. Hatsukami DK, Benowitz NL, Rennard SO, Oncken C, Hecht SS. Biomarkers to assess the utility of potential reduced exposure tobacco products. Nicotine Tob Res 2006;8:600–22.10.1080/14622200600576628Suche in Google Scholar PubMed
10. Hatsukami DK, Hanson K, Briggs A, Parascandola M, Genkinger JM, O’Connor R, et al. Clinical trials methods for evaluation of potential reduced exposure products. Cancer Epidemiol Biomarkers Prev 2009;18:3143–95.10.1158/1055-9965.EPI-09-0654Suche in Google Scholar PubMed PubMed Central
11. Center for tobacco products, food and drug administration research priorities. Available from: http://www.fda.gov/downloads/TobaccoProducts/NewsEvents/UCM293998.pdf. Accessed 22 July, 2013.Suche in Google Scholar
12. Ashley DL, O’Connor RJ, Bernert JT, Watson CH, Polzin GM, Jain RB, et al. Effect of differing levels of tobacco-specific nitrosomines in cigarette smoke on the levels of biomarkers in smokers. Cancer Epidemiol Biomarkers Prev 2010;19:1389–98.10.1158/1055-9965.EPI-10-0084Suche in Google Scholar PubMed PubMed Central
13. Sarkar M, Kapur S, Frost-Pineda K, Feng S, Wang J, Liang Q, et al. Evaluation of biomarkers of exposure to selected cigarette smoke constituents in adult smokers switched to carbon-filtered cigarettes in short-term and long-term clinical studies. Nicotine Tob Res 2008;10:1761–72.10.1080/14622200802443718Suche in Google Scholar PubMed
14. Shepperd CJ, Eldridge A, Camacho OM, McAdam K, Proctor CJ, Meyer I. Changes in levels of biomarkers of exposure observed in a controlled study of smokers switched from conventional to reduced toxicant prototype cigarettes. Regul Toxicol Pharmacol 2013;66:147–62.10.1016/j.yrtph.2013.02.007Suche in Google Scholar PubMed
15. McAdam KG, Gregg EO, Bevan M, Dittrich DJ, Hemsley S, Liu C, et al. Design and chemical evaluation of reduced machine yield cigarettes. Regul Toxicol Pharmacol 2012;62:138–50.10.1016/j.yrtph.2011.11.007Suche in Google Scholar PubMed
16. Shepperd CJ, Eldridge AC, Mariner DC, McEwan M, Errington G, Dixon M. A study to estimate and correlate cigarette smoke exposure in smokers in Germany as determined by filter analysis and biomarkers of exposure. Regul Toxicol Pharmacol 2009;55:97–109.10.1016/j.yrtph.2009.06.006Suche in Google Scholar PubMed
17. Shepperd CJ, Eldridge AC, Errington G, Dixon M. A study to evaluate the effect on mouth level exposure and biomarkers of exposure estimates of cigarette smoke exposure following a forced switch to a lower ISO tar yield cigarette. Regul Toxicol Pharmacol 2011;61(Suppl 3):S13–24.10.1016/j.yrtph.2011.05.011Suche in Google Scholar PubMed
18. Leischow SJ, Zeller M, Backinger CL. Research priorities and infrastructure needs of the Family smoking prevention and tobacco control act: science to inform FDA policy. Nicotine Tob Res 2012;14:1–6.10.1093/ntr/ntr057Suche in Google Scholar PubMed
19. McAdam KG, Gregg EO, Liu C, Dittrich DJ, Duke MG, Proctor CJ. The use of a novel tobacco-substitute sheet and smoke dilution to reduce toxicant yields in cigarette smoke. Food Chem Toxicol 2011;49:1684–96.10.1016/j.fct.2011.04.002Suche in Google Scholar PubMed
20. Liu C, DeGrandpré Y, Porter A, Griffiths A, McAdam K, Voisine R, et al. The use of a novel tobacco treatment process to reduce toxicant yields in cigarette smoke. Food Chem Toxicol 2011;49:1904–17.10.1016/j.fct.2011.02.015Suche in Google Scholar PubMed
21. Branton PJ, McAdam KG, Duke MG, Liu C, Curle M, Mola M, et al. Use of classical adsorption theory to understand the dynamic filtration of volatile toxicants in cigarette smoke by active carbons. Absorption Sci Technol 2011;29:117–38.10.1260/0263-6174.29.2.117Suche in Google Scholar
22. Branton PJ, McAdam KG, Winter DB, Liu C, Duke MG, Proctor CJ. Reduction of aldehydes and hydrogen cyanide yields in mainstream cigarette smoke using an amine functionalised ion exchange resin. Chem Cent J 2011;5:15.10.1186/1752-153X-5-15Suche in Google Scholar PubMed PubMed Central
23. Kavvadias D, Scherer G, Urban M, Cheung F, Errington G, Shepperd J, et al. Simultaneous determination of four tobacco-specific N-nitrosamines (TSNA) in human urine. J Chromatogr B Analyt Technol Biomed Life Sci 1999;877:1185–92.10.1016/j.jchromb.2009.03.009Suche in Google Scholar PubMed
24. Riedel K, Scherer G, Engl J, Hagedorn HW, Tricker AR. Determination of three carcinogenic aromatic amines in urine of smokers and nonsmokers. J Anal Toxicol 2006;30:187–95.10.1093/jat/30.3.187Suche in Google Scholar PubMed
25. Scherer G, Urban M, Hagedorn HW, Feng S, Kinser RD, Sarkar M, et al. Determination of two mercapturic acids related to crotonaldehyde in human urine: influence of smoking. Hum Exp Toxicol 2007;26:37–47.10.1177/0960327107073829Suche in Google Scholar PubMed
26. Ramsauer B, Sterz K, Hagedorn HW, Engl J, Scherer G, McEwan M, et al. A liquid chromatography/tandem mass spectrometry (LC-MS/MS) method for the determination of phenolic polycyclic aromatic hydrocarbons (OH-PAH) in urine of non-smokers and smokers. Anal Bioanal Chem 2011;399:877–89.10.1007/s00216-010-4355-7Suche in Google Scholar PubMed
27. Feng S, Kapur S, Sarkar M, Muhammad R, Mendes P, Newland K, et al. Respiratory retention of nicotine and urinary excretion of nicotine and its five major metabolites in adult male smokers. Toxicol Lett 2007;173:101–6.10.1016/j.toxlet.2007.06.016Suche in Google Scholar PubMed
28. Sheldon C, Nachi R, Newland K, Lin P, Lee J. LC-MS/MS quantitation of acrolein biomarker, 3-HPMA (3-hydroxypropylmercapturic acid) in human urine. Association of Pharmaceutical Scientists, 2003, Poster.Suche in Google Scholar
29. International Federation of Clinical Chemistry (IFCC). Approved recommendation (1987) on the theory of reference values. Part 5. Statistical treatment of collected reference values. Determination of reference limits. J Clin Chem Clin Biochem 1987;5:645–56.Suche in Google Scholar
30. Clinical Laboratory Standards Institute. Defining, establishing, and verifying reference intervals in the clinical laboratory approved guidelines, 3rd ed. Wayne, PA: Clinical Laboratory Standards Institute, 2008.Suche in Google Scholar
31. Harris EK, Yasaka T. On the calculation of “reference change” for comparing two consecutive measurements. Clin Chem 1983;29:25–30.10.1093/clinchem/29.1.25Suche in Google Scholar
32. Fraser CG, Harris EK. Generation and application of data on biological variation in clinical chemistry. Crit Rev Clin Lab Sci 1989;27:409–37.10.3109/10408368909106595Suche in Google Scholar PubMed
33. Fraser FG. Biological variation: from principles to practice. Washington, DC: AACC Press, 2001.Suche in Google Scholar
34. Aarsand AK, Petersen PH, Sandberg S. Estimation and application of biological variation of urinary delta-aminolevulinic acid and porphobilinogen in healthy individuals and in patients with acute intermittent porphyria. Clin Chem 2006;52:650–6.10.1373/clinchem.2005.060772Suche in Google Scholar PubMed
35. Cheuvront SN, Fraser CG, Kenefick RW, Ely BR, Sawka MN. Reference change values for monitoring dehydration. Clin Chem Lab Med 2011;49:1033–7.10.1515/CCLM.2011.170Suche in Google Scholar PubMed
36. Widjaja A, Morris RJ, Levy JC, Frayn KN, Manley SE, Turner RC. Within- and between-subject variation in commonly measured anthropometric and biochemical variables. Clin Chem 1999;45:561–6.10.1093/clinchem/45.4.561Suche in Google Scholar
37. Fraser CG, Lippi G, Plebani M. Reference change values may need some improvement but are invaluable tools in laboratory medicine. Clin Chem Lab Med 2012;50:963–4.10.1515/cclm.2011.826Suche in Google Scholar
38. Fraser GC. Reference change values: the way forward in monitoring. Ann Clin Biochem 2009;46:264–5.10.1258/acb.2009.009006Suche in Google Scholar PubMed
39. Cooper G, DeJonge N, Ehrmeyer S, Yundt-Pacheco J, Jansen R, Ricós C, et al. Collective opinion paper on findings of the 2010 convocation of experts on laboratory quality. Clin Chem Lab Med 2011;49:793–802.10.1515/CCLM.2011.149Suche in Google Scholar PubMed
40. Fraser CG. Reference change values. Clin Chem Lab Med 2011;50:807–12.10.1515/cclm.2011.733Suche in Google Scholar
41. Hecht SS, Carmella SG, Chen M, Koch JF, Miller AT, Murphy SE, et al. Quantitation of urinary metabolites of a tobacco-specific lung carcinogen after smoking cessation. Cancer Res 1999;59:590–6.Suche in Google Scholar
42. Ricós C, Iglesias N, García-Lario JV, Simón M, Cava F, Hernández A, et al. Within-subject biological variation in disease: collated data and clinical consequences. Ann Clin Biochem 2007;44:343–52.10.1258/000456307780945633Suche in Google Scholar PubMed
43. Fokkma MR, Hermann Z, Muskiet FA, Moecks J. Reference change values for brain natriuretic peptides revisited. Clin Chem 2006;52:1602–3.10.1373/clinchem.2006.069369Suche in Google Scholar PubMed
44. Omar F, Van der Watt GF, Pillay TS. Reference change values: how useful are they? J Clin Pathol 2008;61:426–7.10.1136/jcp.2007.054833Suche in Google Scholar PubMed
45. Petersen PH, Sandberg S, Fraser CG, Goldschmidt H. Influence of index of individuality on false positives in repeated sampling from healthy individuals. Clin Chem Lab Med 2001;39:160–5.10.1515/CCLM.2001.027Suche in Google Scholar PubMed
46. Carmella SG, Akerkar SA, Richie JP Jr, Hecht SS. Intraindividual and interindividual differences in metabolites of the tobacco-specific lung carcinogen 4-(methylnitrosamino)-1-(3-pyridyl)-1-butanone (NNK) in smokers’ urine. Cancer Epidemiol Biomarkers Prev 1995;4:635–42.Suche in Google Scholar
47. Pinches MD, Betts CJ, Bickerton SJ, Beattie L, Burdett LD, Thomas HT, et al. Evaluation of novel urinary renal biomarkers: biological variation and reference change values. Toxicol Pathol 2012;40:541–9.10.1177/0192623311432436Suche in Google Scholar PubMed
©2014 by Walter de Gruyter Berlin Boston
This work is licensed under the Creative Commons Attribution-NonCommercial 4.0 International License.
Artikel in diesem Heft
- Masthead
- Masthead
- Editorial
- Point of care testing: evolving scenarios and innovative perspectives
- Review
- Point-of-care testing: where is the evidence? A systematic survey
- Mini Review
- Vulnerability of point-of-care test reagents and instruments to environmental stresses: implications for health professionals and developers
- Opinion Paper
- Twenty-five years of idiopathic calcium nephrolithiasis: has anything changed?
- Genetics and Molecular Diagnostics
- Optimizing the purification and analysis of miRNAs from urinary exosomes
- General Clinical Chemistry and Laboratory Medicine
- Extensive study of human insulin immunoassays: promises and pitfalls for insulin analogue detection and quantification
- Absorptive chemistry based extraction for LC-MS/MS analysis of small molecule analytes from biological fluids – an application for 25-hydroxyvitamin D
- Evaluation of 3-epi-25-hydroxyvitamin D3 cross-reactivity in the Roche Elecsys Vitamin D Total protein binding assay
- Quantification of linezolid in serum by LC-MS/MS using semi-automated sample preparation and isotope dilution internal standardization
- Comparison of two immunoassays for measurement of faecal calprotectin in detection of inflammatory bowel disease: (pre)-analytical and diagnostic performance characteristics
- Reference Values and Biological Variations
- Reference change values to assess changes in concentrations of biomarkers of exposure in individuals participating in a cigarette-switching study
- Reference values of fetal serum β2-microglobulin in the Chinese: evaluation of its clinical usefulness
- Cancer Diagnostics
- Gut neuroendocrine tumor blood qPCR fingerprint assay: characteristics and reproducibility
- Androgen deprivation decreases prostate specific antigen in the absence of tumor: implications for interpretation of PSA results
- Radioimmunoassay of free plasma metanephrines for the diagnosis of catecholamine-producing tumors
- Infectious Diseases
- Plasma endothelial cell-specific molecule-1 (ESM-1) in management of community-acquired pneumonia
- A soluble form of the macrophage-related mannose receptor (MR/CD206) is present in human serum and elevated in critical illness
- Letters to the Editor
- Evaluation of a JAK2 V617F quantitative PCR to monitor residual disease post-allogeneic hematopoietic stem cell transplantation for myeloproliferative neoplasms
- Is magnetic resonance imaging really innocent?
- Clinical sample stability and measurement uncertainty
- A specific and sensitive activated partial thromboplastin time (APTT)-based factor VIII inhibitor screening assay
- Evaluating the inappropriateness of repeated laboratory testing in a teaching hospital of South Italy
- Could kidney glomerular filtration impairment represent the “Achilles heel” of HE4 serum marker? A possible further implication