Improving the cleaning quality of tube lumen instruments by imaging analysis and deep learning techniques
-

 ,
,

Abstract
Objectives
The complex structure of tube lumen instruments (TLIs) makes them more difficult to clean compared to solid instruments. This study aims to improve the cleaning quality inspection of reusable TLIs, ensuring patient safety and clinical reliability.
Methods
This study improves the inspection of TLI cleaning quality using imaging analysis and deep learning techniques. Internally cleaned TLIs were imaged using an electronic endoscope by clinical staff, and the resulting images formed the original dataset. To enhance the quality of the TLI images and augment the dataset, image preprocessing techniques such as enhancement, slicing, and threshold filtering were applied. Based on the sliced image dataset, baseline models with relatively better performance were selected by comparing the performance of multiple deep learning models in TLI image classification. To further improve the model’s performance, two attention mechanisms were introduced to focus on important features
Results
The optimized model outperforms the baseline model in both performance and stability. Specifically, the FA-ResNet18 model with the concurrent space and channel squeeze and excitation (scSE) attention mechanism performs the best, with accuracy, macro precision, macro recall and macro F2 metrics all exceeding 98.3 %.
Conclusions
This method can effectively reduce the risk of errors caused by subjective factors and visual fatigue in manual inspection.
Introduction
Benefiting from the development of minimally invasive surgery, most traditional surgical procedures have been replaced by laparoscopic techniques. However, during diagnosis and treatment, laparoscopic instruments are exposed to body fluids, blood and other pathogenic microorganisms. After use, non-water-soluble dirt such as bloodstains, secretions, and tissues may be left behind, where pathogenic microorganisms may be present. The slenderness and fragility of tube lumen instruments (TLIs) and the complex structures of the internal grooves, dead spaces and movable joints make it more difficult to clean than ordinary solid medical instruments. If the cleaning process is not thorough, then residual contaminants inside the TLI may not be detected, leading to the formation of biofilms, which could make sterilization more challenging [1], 2]. Therefore, ensuring the cleanliness of instruments is a prerequisite for reducing the likelihood of health care-associated infections [3], [4], [5].
It is important to inspect the cleaning quality of medical devices to detect residual contaminants and to ensure the safety and reliability of the instruments. Several traditional methods are often used to inspect the cleaning quality of instruments, such as the visual inspection of white through strips, residual protein tests [6], and adenosine triphosphate (ATP) tests [7]. The white through-strip method is widely adopted as a visual inspection method to assess cleaning quality [4], primarily due to its low cost and ease of use. However, this method has high labor costs and low accuracy. In contrast, residual protein and ATP tests have been proven to be highly accurate, but test consumables are expensive. In addition, these methods are unable to detect potential injury problems with TLIs. In recent years, many health care institutions and researchers have proposed improving cleaning methods [5], [8], [9], [10], [11], comparing several cleaning techniques to determine the most effective strategy for cleaning different types of instruments. However, whether automated cleaning equipment or manual cleaning is used, the results of TLI cleaning are unstable [8]. Thus, it is imperative to establish dependable evaluation methods to ensure the quality of TLI cleaning [12].
Ofstead et al. [13] presented their initial experience with the use of endoscopes for gastrointestinal endoscopy, where they used current cleaning methods rather than seeking a more rigorous cleaning process. Using an endoscope to visually inspect a fully dried and stored gastrointestinal endoscope, several foreign objects, including rust spots, bloodstains, scratches, and filaments, were detected. Thaker et al. [14] used a prototype endoscope to examine sterilized and dried gastrointestinal endoscopes and found moisture, residual lubricating fluid and visible biofilm. The results of relevant studies have demonstrated the clear advantages of visual cleaning quality inspection through endoscopy. Both the American National Standards Institute, Association for the Advancement of Medical Devices and the Centers for Disease Control and Prevention have confirmed the clinical value of visual inspection [15]. Rici noted that optical inspection methods can be effective in assessing problems with internal channels in flexible and semi-rigid endoscopes [16]. The approach depends heavily on the subjective experience of the inspector, which may result in the inspection results being affected by a number of factors, such as visual fatigue and lighting conditions.
Optical-based machine vision is used to recognize captured image information by simulating biological vision. It has become an effective method for replacing manual visual inspection, with the advantages of low cost, high efficiency, and high accuracy. There are two main approaches in machine vision-based detection: i) Automatic feature learning and classification using convolutional neural networks (CNNs), which have the advantages of high robustness and high performance. For example, in [17], a CNN-based approach was proposed for the classification of diseased potatoes. Liu et al. [18] developed a deep learning-based RGB image classification model for classifying various coal particles at two density levels with different moisture gradients. Cengiz et al. [19] used wavelet transform to process noisy images and used deep learning techniques for breast cancer classification. Shinozuka et al. [20] developed a deep CNN model for accurately identifying surgical phases during laparoscopic cholecystectomy; ii) Feature extraction and classification using machine learning algorithms. For example, Gómez-Sirvent et al. [21] used image processing techniques and machine learning methods to detect and classify defects in images of semiconductor wafer materials. In addition, Sun et al. [22] proposed a machine vision-based method for detecting and classifying weld defects and achieved good detection results on a real production line. Traditional machine learning techniques, on the other hand, cannot automatically extract high-level feature representations from raw data and instead require the manual selection and extraction of low-level features from images. Consequently, these algorithms show poor generalization performance for complex tasks.
It is now possible to solve the problem of surgical instrument cleaning using image processing, machine learning and deep learning techniques. For example, Wagner et al. [23] proposed a deep learning-assisted intraoperative instrument cleaning station aimed at achieving autonomous cleaning of instruments during laparoscopic surgery. However, the study focused on identifying instrument tips and did not adequately assess the cleaning quality inside TLIs. To fill this gap, the present study investigates TLI images and further summarizes their relevant properties.
The inside of the TLIs age unevenly after frequent cleaning and sterilization, which can lead to differences in color, texture, or brightness within them, as shown in Figure A.1(a) and (b). These differences make it more difficult to process and analyze images of TLIs.
Sometimes, defects in TLIs have visual features that are similar to those of background areas, making it difficult to detect and distinguish them from qualified TLIs. For example, as shown in Figure A.1(c) and (d), these similarities may include subtle scratches or stains. To solve this problem, higher-level feature extraction and classification techniques are needed.
As shown in Figure A.1(e) and (f), the end structure of TLIs contains irregular features. These irregular features increase the complexity of image analysis.
Given the above factors, the novelty of this research is the use of imaging analysis and deep learning techniques to enhance the identification of TLI cleaning quality. The main contributions are as follows:
The collected images were obtained through internal imaging of TLIs that had been thoroughly cleaned after clinical use, providing a real and reliable database for our study.
Image enhancement techniques were used to improve image quality. An image slicing method was utilized to solve the problem of an insufficient number of TLI images. This method preserves the details of the original image and ensures that the input image meets the input size requirements of the model. In addition, we conducted threshold filtering on the sliced images to remove invalid data with local highlighting.
We adopted the transfer learning method and selected the model with better performance as the baseline model by comparing the performances of different transfer learning models. Then, we introduced two attention mechanisms to optimize the baseline model to obtain a more stable and accurate TLI image classification model.
Materials and methods
A method for the detection and recognition of TLI images, which consists of four key components, is proposed in this paper, as shown in Figure 1. First, image data were acquired from TLIs that were thoroughly cleaned after clinical use. Second, to optimize image quality and augment the TLI dataset, image enhancement and image slicing were applied on the original images, followed by threshold filtering of the sliced subimages. Third, a comprehensive comparison and evaluation of multiple transfer learning models for TLI image classification were conducted, from which the model with better performance was selected as the baseline model. To further improve the performance of the models, we introduced different attention modules to enhance the attention and extraction of key features. To ensure cleaning and safety inside TLIs, it is important to build a model that exhibits consistent performance and high accuracy to properly identify instruments with defects.
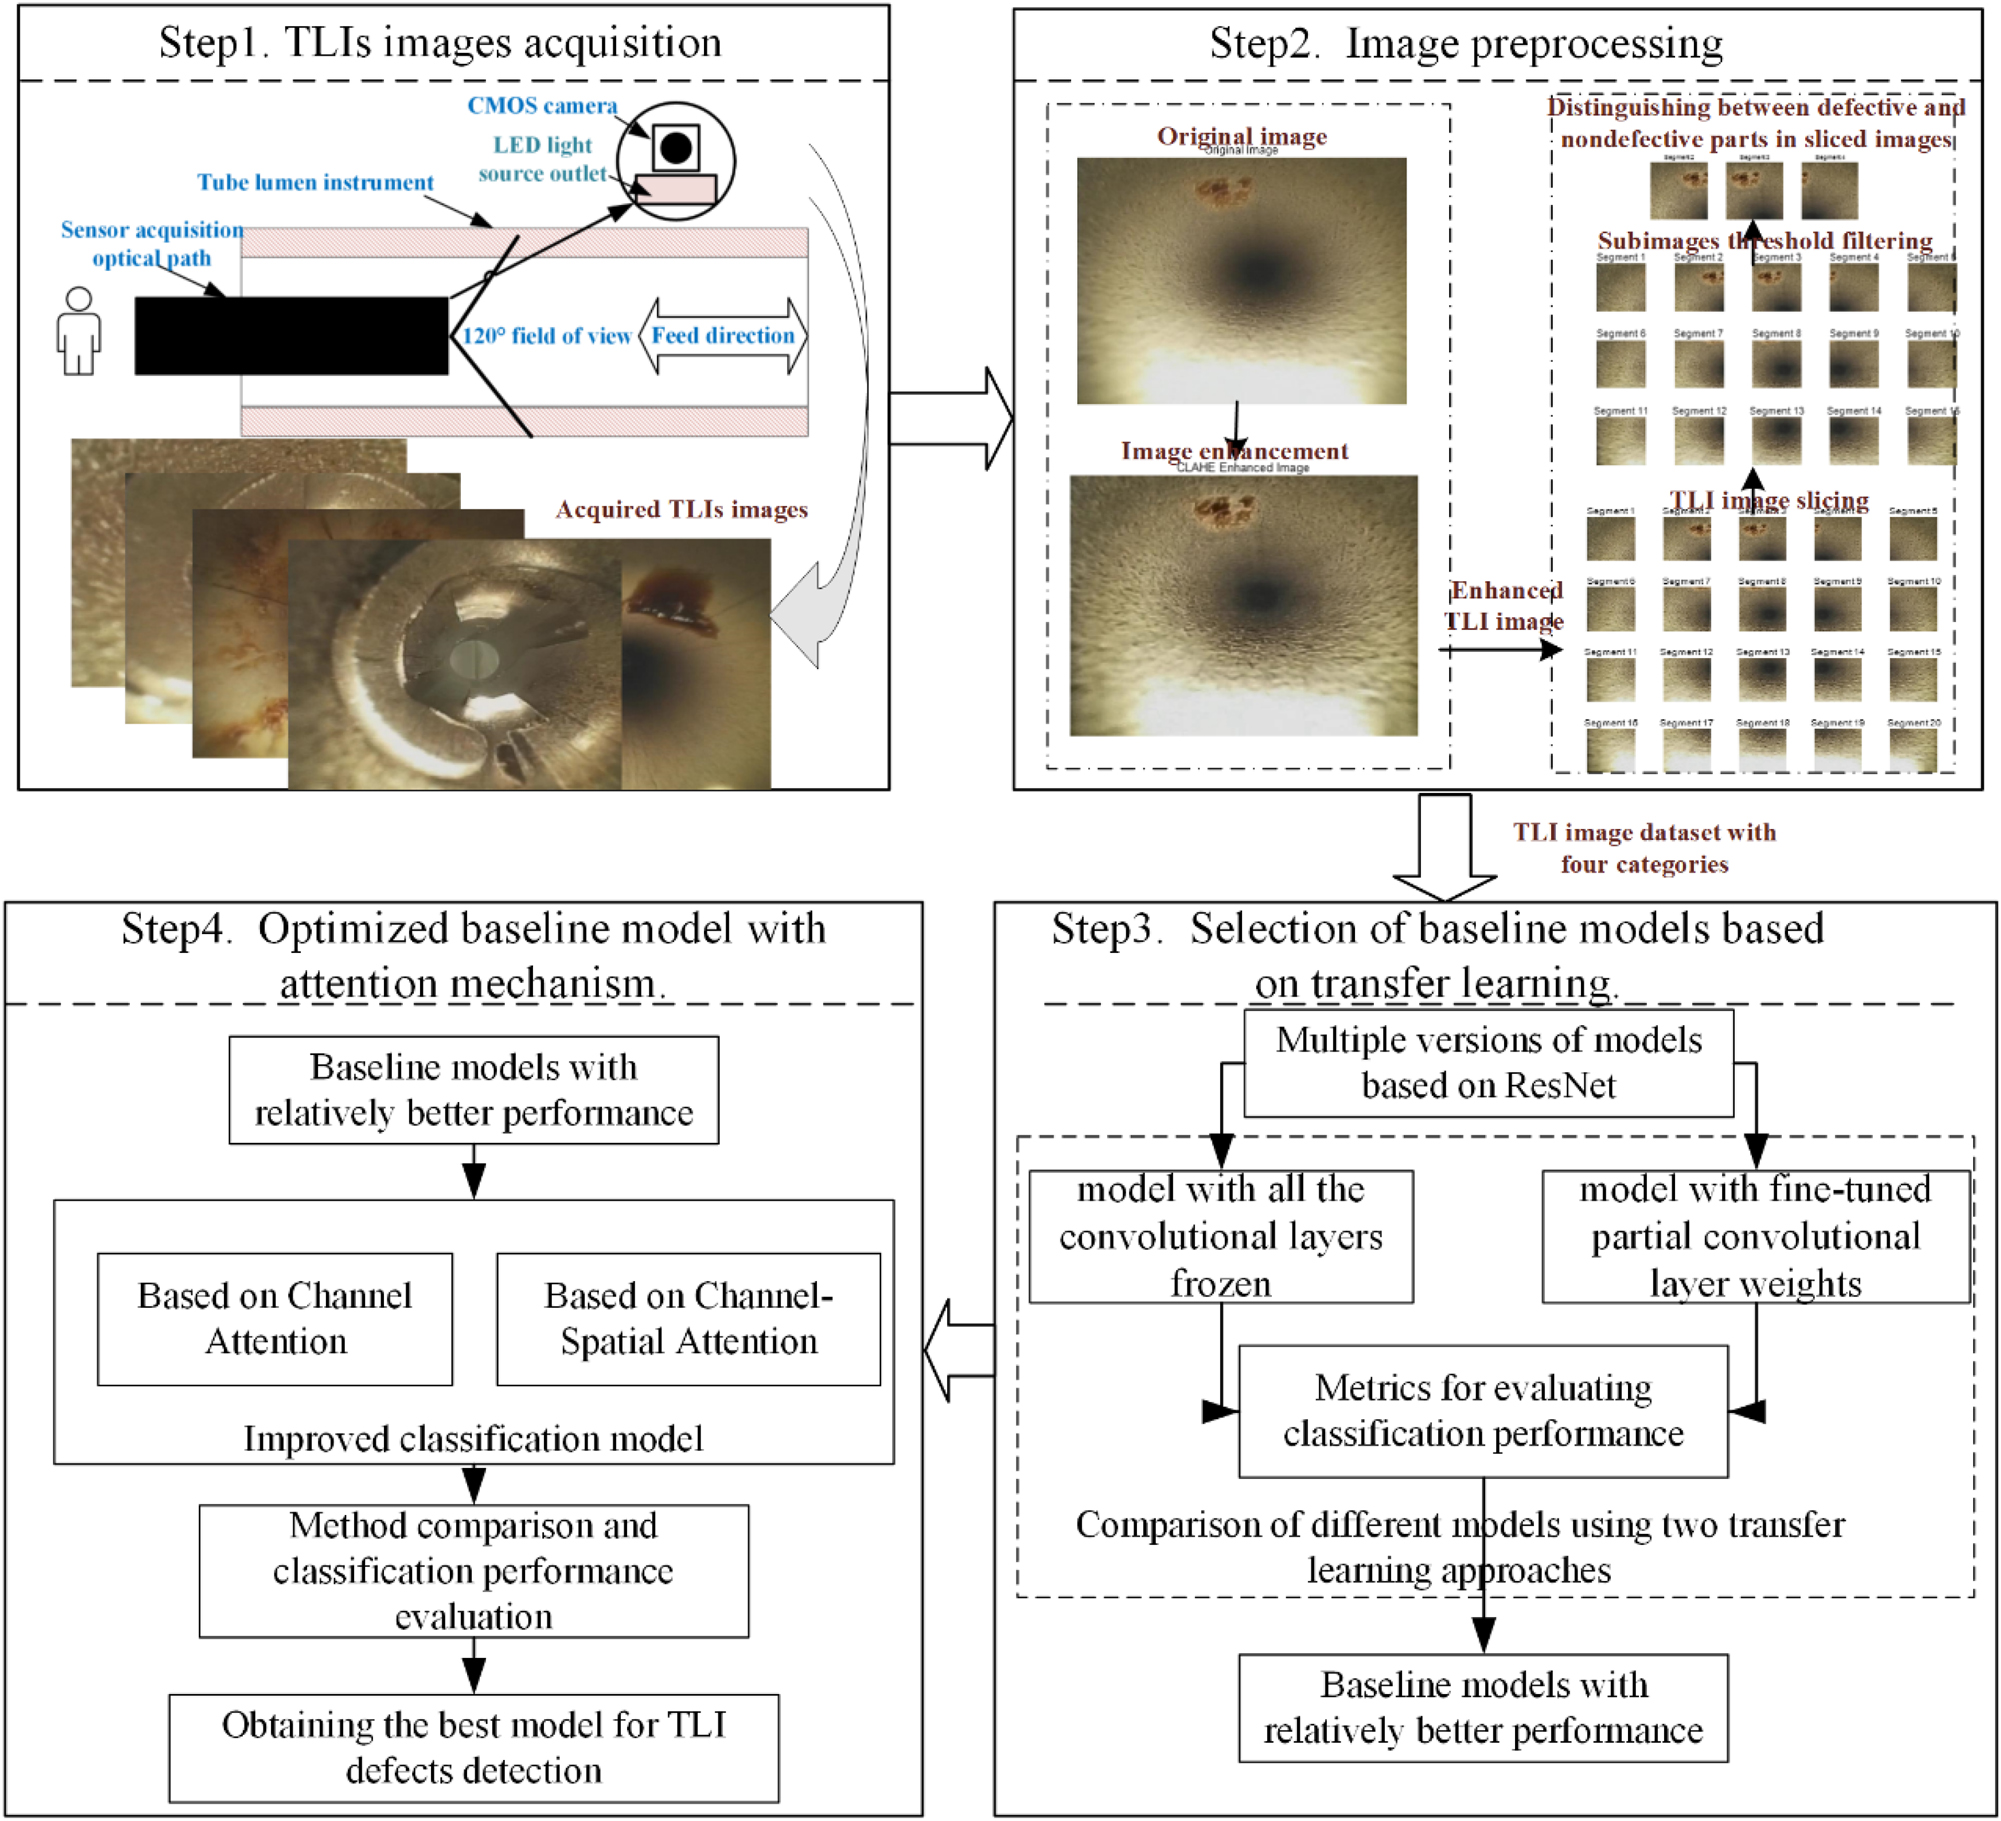
A flowchart of the TLI image classification method based on imaging analysis and deep learning.
TLI image acquisition
The sample data analyzed in this study were obtained from a central sterile supply department. Surgical instruments received between June 2021 and March 2022 were used and processed for manual or machine cleaning. Among these instruments, two common surgical TLIs, namely, suction tips and surgical forceps, were selected for the study because of their frequent use in the clinic. To perform channel inspection of the TLIs, an electronic endoscope model MAG-NJ400 was used. The field acquisition is shown in Figure 2(a). Due to the slender structure of TLIs, it is not possible to use the conventional camera spindle acquisition method perpendicular to the inspection surface [24], nor is it possible to design a multiangle acquisition method with multiple cameras arranged in a circular pattern [25].
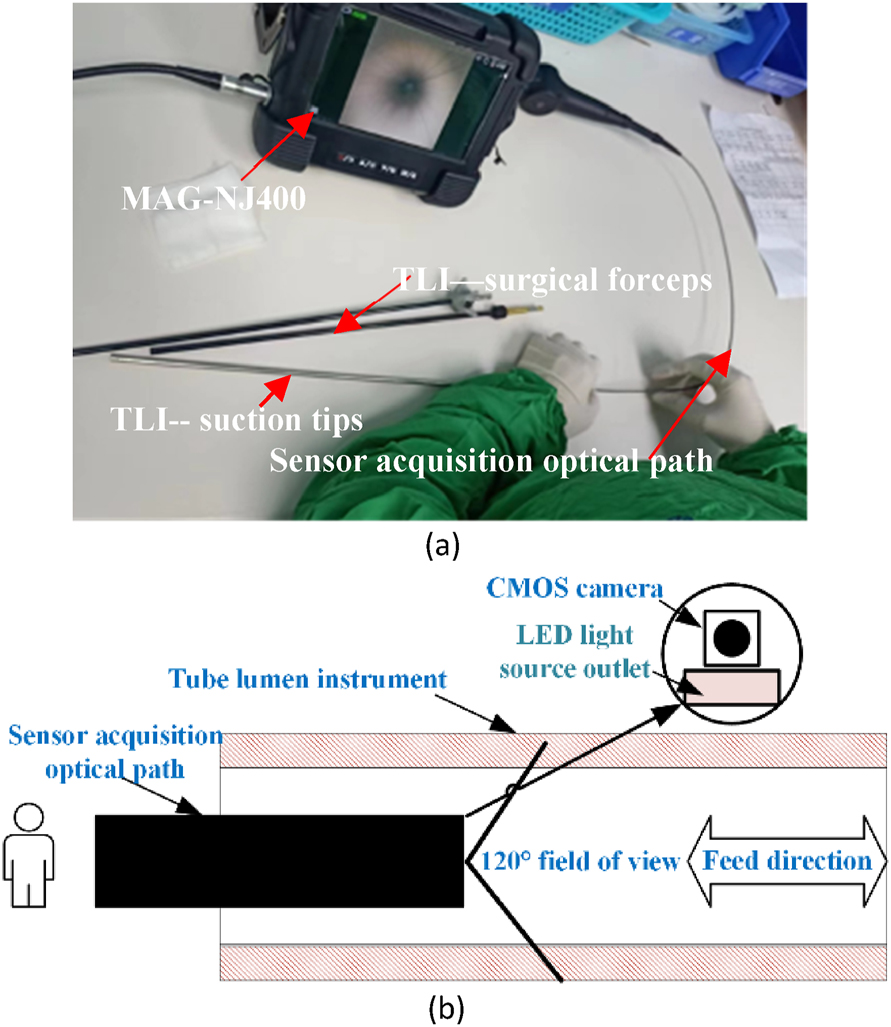
TLIs images acquisition strategy. (a) On-site photos of actual data acquisition. (b) Schematic diagram of the data acquisition method for axial feeds.
To solve this problem, an alternative image acquisition method was used. Figure 2(b) shows a schematic of the acquisition. We used a 0.3 megapixel CMOS camera sensor with a 120° field of view. At the front of the optical path, there was a thin LED exit, positioned off-center from the lens. The resolution of the acquired image was 640 × 480 pixels. The sensor optical path was extended inside the TLIs to perform axial image acquisition in the direction of the spindle by manually controlling the feed rate. During the inspection process, the inspector needed to focus on whether there were still foreign objects left inside and recorded the results of the inspection.
The acquisition of large-scale image data of TLI defects is very time-consuming. In this study, approximately 501 images were collected through imaging of TLIs that had been thoroughly cleaned after surgery to construct a research dataset. Despite the relatively small size of the dataset, we emphasize that these images are highly representative in clinical practice, representing typical defects and different coverage areas. During the data collection process, we relied on medical device cleaning quality monitoring technicians to label the image categories. These technicians have a long history of practical experience in medical device cleaning quality inspection. The image set is categorized into qualified and defective based on the type of data. A “qualified” image is completely free of residue and scratches inside the TLI after the cleaning process. In other words, a “qualified” image should be visually completely clean and spotless. “Defective” images include two main categories: blood residue and surface scratches, which represent poor cleaning quality. These defects are clearly visible in the image. In addition, we further classified the two previously categorized image types into two groups: the middle part and the end of the TLIs, based on the internal location of the images within the TLIs. According to the different combinations of image types and location information, the dataset consists of four types: middle-qualified TLIs (79 images), end-qualified TLIs (106 images), middle-defects TLIs (110 images) and end-defects TLIs (206 images). Among the middle-defect TLIs, 33 images show surface scratches, while the remaining 77 images display blood residue. Notably, the surface scratches are primarily concentrated in the middle section of the TLIs.
Data preprocessing
Due to the low resolution of imaging devices, image shaking during acquisition, internal structure irregularity and uneven aging inside TLIs, the TLIs images acquired usually show low contrast and unclear detailed information. In addition, the present TLI image dataset is relatively limited in size, which introduces some challenges to the training of deep learning models.
To address these problems, we used image processing methods. First, image enhancement was used, which tends to improve the quality and contrast of the image to present the detailed information of the image more clearly. Second, we introduced an image slicing analysis method, that can slice an image into multiple small pieces (subimages) to increase the size of the defect data. The sliced subimages retained all the details and reduced the computational load while meeting the model input size requirements. Finally, the threshold filtering method was used to exclude invalid data containing locally highlighted regions, thus improving the quality of the dataset.
Image enhancement
In this study, contrast-limited adaptive histogram equalization (CLAHE) was used for image enhancement [26]. This method utilizes the inherent ability of the human eye to perceive image contrast and brightness. The basic principle was to divide the image into several small image blocks and apply histogram equalization to each block, applying contrast limits to prevent noise. To further remove artifacts from the boundaries of each block, bilinear interpolation was applied after equalization. In the image enhancement method applied in this paper, the TLI images were first converted to the LAB color space. Contrast-limited adaptive histogram equalization was then applied to the luminance (L) component. To perform the equalization, the image was divided into 16 × 16 pixel blocks and a contrast limiting factor of 0.005 was applied to control the contrast within these blocks. The enhanced L component was then combined with the original A and B components to produce a new LAB image. Finally, the enhanced LAB image was converted back to the RGB color space to produce enhanced TLI images.
TLI image slicing
To further improve the completeness of the image analysis and to effectively address image boundary cases, we adopted an overlapping image slicing strategy. This strategy involved slicing the TLI images into a series of subimages with overlapping parts to ensure the continuity and completeness of the information. Specifically, we set the overlap ratio to 0.5, while the sliced image size was set to 224 × 224 pixels. By using Eqs. (1) and (2), a single original TLI image can be sliced into a set
where seg_size is the size of the segmented image, overlap_ratio is the overlap ratio, ⌈x⌉ is x rounded up, height and wide are the height and width of the original image, respectively.
Subimages threshold filtering
For the set S of subimages that result from slicing, the total number of gray values in the subimages that exceeded a set threshold T (set to 208 in this paper) was calculated according to Eqs. (3) and (4). Next, by using Eq. (5), we calculated the ratio of the number of pixels that exceeded the threshold (N) to the total number of pixels (H*W). If this proportion exceeded the set threshold P (20 % in this paper), the subimage was labeled as invalid data and deleted from the set S.
where I indicator (x) is the indicator function, Ii, j is the pixel value of image I at position (i, j), N is the sum of the number of pixels above threshold T, P is the proportion of pixels above the threshold T, and H and W are the height and width of the sliced image, respectively.
Transfer learning with ResNet for TLI image classification
Traditional CNN models are trained by randomly initializing weights and iteratively updating them using a backpropagation algorithm until convergence or stopping conditions are met. This training procedure is usually time-consuming, and to achieve satisfactory performance, a large number of training samples are required to ensure the reliability and generalizability of the model. At present, the available datasets are limited for TLI images, which makes traditional CNN models prone to overfitting.
Transfer learning has become a frequently utilized approach to solve this issue. Transfer learning methods include instance-based, feature-based, and shared parameter-based transfers [27]. Instance-based transfer requires that two tasks have similar instance distributions, and feature-based transfer depends on sharing similar low-level features. However, it is unwise to directly apply the pretrained model on ImageNet to the acquired TLI image dataset. Because of the differences in classes between TLI images and natural images, both transfer learning approaches may not be directly applicable to TLI images classification. In contrast, the transfer method based on shared parameters can better address this problem better. Local detail information of images, such as edges, textures and colors, is captured by low-level features, which are shared among different tasks. By sharing low-level features, the model training is accelerated, and the model performance is improved. The high-level features can be fine-tuned or adjusted for specific target tasks to better fit the characteristics of the TLI image dataset.
ResNet is a deep convolutional neural network model that shows excellent performance among many CNNs [28]. The unique residual block structure and the design of residual connections are the key factors in its success. By using residual connections, ResNet successfully solves the problems of gradient disappearance and gradient explosion. The connection enables the model to better capture the abstract features in the image, thus significantly improving the classification performance. Additionally, residual connectivity makes the network easier to optimize and train. ResNet provides several versions of the model, such as ResNet-101, ResNet-50, and ResNet-18 [29]. Each model version has a specific residual block structure that is suitable for feature representation of different classification tasks. In this study, we chose the ResNet model pretrained on the ImageNet dataset as a starting point and transferred it to the TLI image classification task. This transfer learning strategy could reduce the risk of overfitting, improve model performance, and accelerate the training of models.
Attention mechanism model
In this study, two attention mechanisms, namely the squeeze-and-excitation network (SE Net) [30] and concurrent spatial and channel squeeze & excitation (scSE) [31], are used separately to optimize the baseline model for TLI image classification. The SE Net attention mechanism has several advantages, including fewer parameters and easy embedding. It dynamically adjusts the importance of each channel by learning the relationships between channels, thus enhancing the focus on key features. On the other hand, the scSE attention mechanism represents an enhanced version of SE Net, which combines spatial attention and channel attention to capture the correlation between channels and spatial locations more completely in the feature map. The introduction of these attention modules in the baseline model is intended to evaluate the impact of different attention mechanisms on the classification accuracy of TLI images and to improve the distinction between qualified and defective TLIs.
SE Net is an attention mechanism that adaptively learns the importance of each channel. It consists of two main steps: squeeze and excitation. The squeeze step entails a spatial compression of the feature map by global average pooling, which compresses the dimension of the original feature dimension of the original feature map from H × W × C to 1 × 1 × C. This step enables the feature map to perceive a wider range of global information and helps to extract important channel features. To enhance model generalizability, excitation is applied to compress and reduce the number of feature map channels through two fully connected layers to obtain the correlation between channels and to calculate the importance weight of each channel for the overall feature representation.
scSE adopts a parallel spatial attention and channel attention mechanism. The channel attention part of scSE in this paper retains the SE Net structure for capturing correlations between different channels in the feature map. Spatial attention is performed using a 1 × 1 convolution of the channel dimension of the feature map, which is compressed from the original H × W × C dimension to the H × W × 1 dimension, and then the importance weight of each spatial location is obtained by a stimulus operation. Figure 3 illustrates the network structure of scSE.

Concurrent spatial and channel squeeze & excitation structure diagram.
Performance evaluation metrics
Using the model to classify TLI images, we focused on model’s ability to accurately identify TLIs with defects. The accuracy, recall, precision, and F2 score were used as evaluation metrics to assess the performance of the mode. In addition, to reduce the potential risk of missed detections, we used the F2 score, which emphasizes recall more than the F1 score. Considering that TLI image classification is a multicategory problem, we calculated the precision, recall, and F2 score for each category and then averaged them as shown in Eqs. (6)–(9). This process helps to comprehensively evaluate the performance of the model in the TLI image classification.
where N denotes the number of classes and is set to 4; β is set to 2; TP i denotes the number of true positives in the i-th class; TN i denotes the number of true negatives in the i-th class; FP i denotes the number of false positives in the ith class; and FN i denotes the number of false negatives in the i-th class. Recall i denotes the recall rate of the i-th class, and precision i denotes the precision rate of the i-th class.
Results
To evaluate the validity of the proposed method, we conduct experiments using a pre-acquired TLI dataset. All the experiments were implemented on a computing server equipped with an Intel(R) Core (TM) i7-9700 processor @ 3 GHz and an RTX3060 GPU with 12 GB of RAM. MATLAB software was chosen for this study to perform various comparative analyses.
Data preprocessing
Comparisons are made between the various image enhancement outcomes of CLAHE, HE, and contrast adjustment methods. As shown in Figure 4(a), the CLAHE method yields better results in processing the TLI images. It can effectively enhance the details of the image by expanding the distribution of the gray histogram, which can improve the visual effect and make defects more visible. In contrast, HE is limited in its effectiveness in processing local areas that are too bright or too dark, thus easily leading to a loss of detail. Contrast adjustment methods result in changes to image brightness and color. Moreover, the contrast adjustment method yields insignificant results when applied to low-contrast areas.
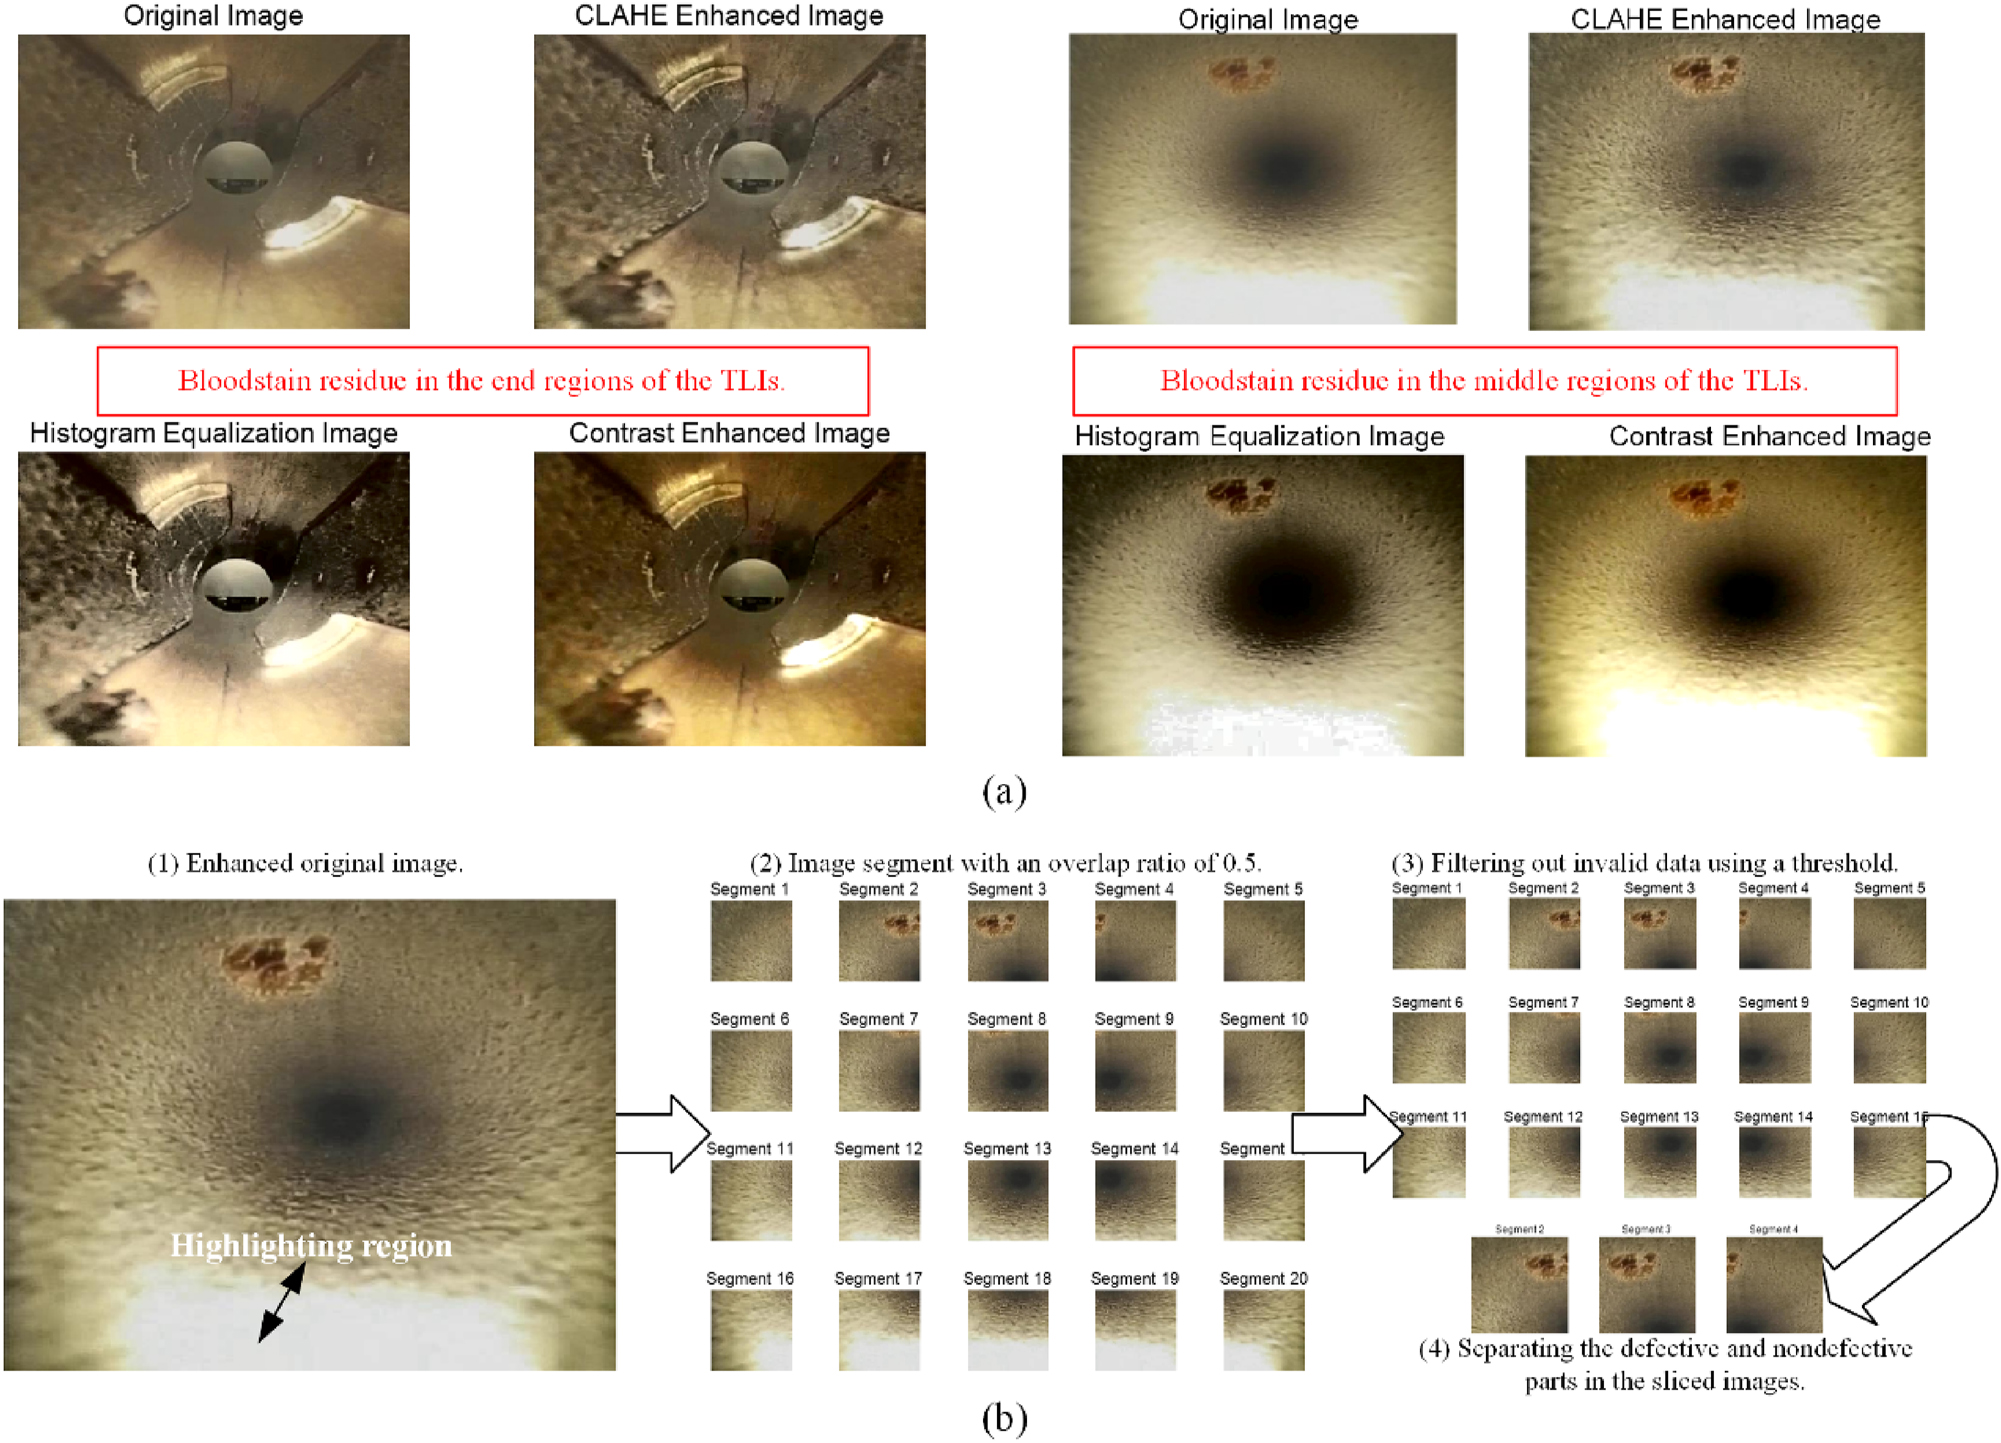
Image preprocessing process and results.
Image slicing and threshold filtering were implemented on all the images after image enhancement. For example, one of the images was segmented into multiple small blocks, as shown in Figure 4(b-2). Then, the highlighted regions that were not relevant to TLI image detection were removed by threshold filtering, as shown in Figure 4(b-3). Finally, the sliced images were separated. Namely, the nondefective sliced images were distinguished from the defective sliced images, as shown in Figure 4(b-4).
The results obtained after applying image slicing and threshold filtering are shown in Figure 4(b). As seen from the sliced images, each slice contained local information about a specific region, which improved the quality of the dataset. Importantly, the sliced images completely captured the defective parts, thus increasing the diversity of the data. Moreover, the sliced image size met the input requirements of the ResNet model and helped to reduce the computational load of the model.
After image enhancement, slicing, and thresholding, we obtained a TLI image dataset with four categories: 2,633 images of End-defect TLIs, 1,291 images of Middle-defect TLIs, 2,078 images of End-qualified TLIs, and 1,992 images of Middle-qualified TLIs.
Selected baseline model
Considering the large difference between TLI images and the ImageNet dataset, low-level features can share basic features while high-level features are more abstract and more important for the classification of TLI images. Therefore, two different strategies were used in transfer learning to adapt the TLI image classification task and determine the best baseline model.
The first approach: ResNet model with all the convolutional layers frozen (FA-ResNet). In this approach, a ResNet model pretrained on the ImageNet dataset was used, and the weights of all the convolutional layers were frozen. Then the original fully connected layers and classification layers in the model were removed. A new fully connected layer was added with the number of output nodes set to 4, and a classification layer with 4 node output nodes was added. This approach allowed the model output to be mapped to the 4 classes and the class probabilities to be calculated using the softmax function. Using this fine-tuning approach, the last three layers of the model were trained, including the newly added fully connected layer, the softmax layer, and the weights of the previous layer.
The second approach involves the use of a ResNet model with fine-tuned partial convolutional layer weights (FT-ResNet). Based on the first model, we unfroze part of the convolutional layers of the ResNet model and allowed them to participate in training. However, as the number of unfrozen layers increased, the learned generic features were destroyed, leading to overfitting in the TLI image classification task. Therefore, the strategy of fine-tuning only the last ResNet convolutional block was chosen for this study.
Two different transfer learning approaches were used for the three models: ResNet18, ResNet50 and ResNet101. The performance of the models was evaluated on the TLI image classification task to determine the better baseline model. To ensure the stability of the model’s recognition results, we employed 5-fold cross-validation. For each fold, data augmentation techniques, including random horizontal and vertical flipping, were applied to the training set to increase the diversity of the data. These augmentation methods effectively prevented the neural network from overfitting and avoiding memorization of training image details, thereby enhancing the model’s generalizability. It is important to note that the augmented images were only used in the training set and did not appear in the test set. The model was trained using the Adam optimization algorithm with 20 epochs, an initial learning rate of 0.003, and a batch size of 64.
As shown in Figure 5, FA-ResNet18 outperforms FA-ResNet50 and FA-ResNet101 in classifying the End-qualified and Middle-defect categories, demonstrating stronger recognition capabilities in these areas. In contrast, the deeper model FA-ResNet50 excels in classifying the End-defect and Middle-qualified categories. FT-ResNet50 outperforms FT-ResNet18 and FT-ResNet101 in the End-qualified and Middle-defect categories, while FT-ResNet101 performs better in classifying the End-defect and Middle-qualified categories compared to the other models. However, all models still exhibit noticeable misclassifications between the End-defect and End-qualified categories, indicating that there is room for further improvement in this classification task.

Confusion matrices of baseline models after cross-validation. (a) FA-ResNet18. (b) FA-ResNet50. (c) FA-ResNet101. (d) FT-ResNet18. (e) FT-ResNet50. (f) FT-ResNet101.
To quantitatively evaluate model performance, Table 1 presents a comparison of the classification results based on various metrics. When all convolutional layers were frozen, the transfer learning classification performance of ResNet18 and ResNet50 exceeded 95 %, outperforming ResNet101, which achieved 93.8 %. After fine-tuning some convolutional layers, both ResNet50 and ResNet101 surpassed 95 %, outperforming ResNet18, which achieved 94.3 %. However, training the ResNet101 model took significantly more time. A comparison of the two transfer learning approaches shows that, considering both model performance and training time, the FA-ResNet18 and FT-ResNet50 models provided better performance in TLI image classification. Furthermore, the classification results of both models are close to the human eye’s recognition accuracy for natural images (94.9 %) [28].
Comparison of different models using cross-validation based on two transfer learning approaches.
| Evaluation metrics |
FA-ResNet model | FT-ResNet model | ||||
|---|---|---|---|---|---|---|
| ResNet18 | ResNet 50 | ResNet 101 | ResNet 18 | ResNet 50 | ResNet 101 | |
| Accuracy/-% | 95.81 ± 0.36 | 95.57 ± 0.72 | 93.67 ± 2.16 | 94.17 ± 0.73 | 95.58 ± 0.62 | 95.15 ± 0.78 |
| Macro recall/-% | 95.80 ± 1.48 | 95.57 ± 2.22 | 93.89 ± 2.57 | 94.35 ± 1.69 | 95.76 ± 1.59 | 95.24 ± 1.87 |
| Macro precision/-% | 95.98 ± 2.05 | 95.82 ± 1.84 | 93.85 ± 3.42 | 94.11 ± 1.89 | 95.55 ± 1.53 | 95.28 ± 1.56 |
| Macro F2-score/-% | 95.83 ± 1.24 | 95.62 ± 1.97 | 93.86 ± 2.09 | 94.30 ± 1.64 | 95.71 ± 1.37 | 95.25 ± 1.76 |
| Avg training time/-s | 485.8 | 1,515.1 | 2,614.5 | 499.8 | 1,547.5 | 2,766.5 |
In addition, we also evaluated the performance of smaller models, including GoogleNet, MobileNet, and EfficientNet, in TLI image transfer learning. According to Appendix Table 1, EfficientNet demonstrated the best classification performance, with all evaluation metrics exceeding 96 %. MobileNet followed, closely matching ResNet50’s performance but exhibiting higher variability, as indicated by its larger standard deviation. GoogleNet demonstrated slightly lower performance, with classification metrics below 95 % and the highest standard deviation among the models. It is important to note that EfficientNet requires significantly longer training times compared to the other models. Considering both model performance and training efficiency, we selected FA-ResNet18 and FT-ResNet50 as the baseline models, as they provide a better balance between performance and computational efficiency.
Optimizing the baseline model with attention mechanisms
After determining the baseline models, we introduced the SE and scSE attention mechanisms to optimize the model. Initially, all convolutional layers of the baseline model were frozen. Then, the fully connected and classification layers were removed, and the SE and scSE attention modules were appended after the final convolutional block of ResNet, resulting in four improved models: FA-ResNet18-SE, FA-ResNet18-scSE, FT-ResNet50-SE, and FT-ResNet50-scSE. This approach aimed to retain the baseline model’s overall structure and feature extraction capabilities while enhancing the model’s ability to focus on key regions in TLI images. All comparative experiments were conducted using 5-fold cross-validation to accurately assess the impact of incorporating the SE and scSE attention mechanisms on the performance of each baseline model.
Figure 6 displays the overall confusion matrices of models with attention mechanisms after cross-validation. Among these models, FA-ResNet18-scSE outperforms the others in the End-defect category, while the results for the End-qualified and Middle-qualified categories are quite similar across the models. In the Middle-defect category, FA-ResNet18 with attention performs better than FT-ResNet50 with attention.

Confusion matrices of models with attention mechanisms after cross-validation. (a) FA-ResNet18-SE. (b) FA-ResNet18-scSE. (c) FT-ResNet50-SE. (d) FT-ResNet50-scSE.
The performance comparison of models with attention mechanisms, based on 5-fold cross-validation, is shown in Table 2. FA-ResNet18-scSE achieves the highest accuracy at 98.34 %, slightly surpassing FA-ResNet18-SE, which achieves 98.20 %. Both FT-ResNet50-SE (98.12 %) and FT-ResNet50-scSE (98.17 %) show similar performance, with slightly lower accuracy compared to FA-ResNet18-scSE. In terms of macro recall, FA-ResNet18-scSE leads with 98.31 %, followed by FA-ResNet18-SE at 98.28 %, FT-ResNet50-scSE at 98.15 %, and FT-ResNet50-SE at 98.14 %. Similarly, FA-ResNet18-scSE also shows the highest macro precision at 98.35 %, with FA-ResNet18-SE at 98.21 %, FT-ResNet50-scSE at 98.19 %, and FT-ResNet50-SE at 98.15 %. Finally, for the macro F2-score, FA-ResNet18-scSE remains the top performer with 98.32 %, while FA-ResNet18-SE, FT-ResNet50-SE, and FT-ResNet50-scSE follow with scores of 98.26 %, 98.14 %, and 98.16 %, respectively.
Performance comparison of models with attention mechanisms using cross-validation.
| Evaluation metrics | FA-ResNet18-SE | FA-ResNet18-scSE | FT-ResNet50-SE | FT-ResNet50-scSE |
|---|---|---|---|---|
| Accuracy/-% | 98.20 ± 0.48 | 98.34 ± 0.60 | 98.12 ± 0.52 | 98.17 ± 0.46 |
| Macro recall/-% | 98.28 ± 1.05 | 98.31 ± 0.76 | 98.14 ± 0.92 | 98.15 ± 0.87 |
| Macro precision/-% | 98.21 ± 1.17 | 98.35 ± 0.81 | 98.15 ± 1.17 | 98.19 ± 0.93 |
| Macro F2-score/-s | 98.26 ± 0.73 | 98.32 ± 0.51 | 98.14 ± 0.61 | 98.16 ± 0.57 |
Overall, in the TLI image classification task, models with attention mechanisms exhibit strong performance across all metrics, with those incorporating the scSE mechanism showing a notable improvement. FA-ResNet18-scSE consistently outperforms the other models in accuracy, macro recall, macro precision, and macro F2-score, demonstrating superior classification capability. While FT-ResNet50-SE and FT-ResNet50-scSE perform similarly, their results are slightly lower compared to FA-ResNet18-scSE. The results show that models with attention mechanisms achieve detection levels higher than those of human eyes. The optimized model can identify defective TLIs more accurately, providing more reliable support for TLI cleaning quality inspection.
We further studied the effect of image quality on classification performance by inputting the enhanced and original images into the FA-ResNet18-scSE model. The final classification results are in Appendix Table 2.
The results show that the enhanced image leads to better model classification performance, which emphasizes that image enhancement has a positive effect on improving the model classification performance. On the other hand, downsampling of the original image is required when using CNN models for classification, which may result in loss of image details. In contrast, the method using image slicing is able to retain more pixel and detail information from the original image while meeting the CNN input requirements. It further improves the classification performance on TLI images and overcomes the problem of information loss caused by downsampling.
Conclusions
This study aims to classify the cleaning quality of TLIs, distinguishing them as either “qualified” or “defective”. We performed image analysis on the collected TLI data and conducted a comparative study of several models. Based on the experimental results, the following conclusions were drawn.
Image enhancement of TLI images can improve the model classification performance. Using the image slicing method, the sliced subimages can retain all the details of the original image and meet the input size requirements of the ResNet model. Given the limited TLI dataset, the dataset size is expanded by image slicing, which further improves the model performance.
The candidate baseline models for TLI image classification were determined by comparing multiple models for transfer learning. Among these, the baseline models (FA-ResNet18 and FT-ResNet50) perform well in terms of accuracy and stability, providing a reliable foundation for subsequent experiments.
Two attention mechanisms, SE Net and scSE, were introduced to enhance the baseline models. The experimental results demonstrated that the model with the added scSE attention mechanism outperformed others in terms of performance and stability in TLI image classification
The results show that the proposed method can accurately classify the post-cleaning status of TLIs, and this method will further enhance the safety of surgical patients and ensure reliability. There are some limitations of our study. First, our dataset contains a limited variety of TLIs, which could impact the generalizability of our findings. Second, we employed binary classification to assess the cleaning quality of the TLIs, distinguishing between qualified and defective categories. However, we did not conduct a detailed classification of surface scratches or bloodstain residue defects.
To overcome these limitations, future research could expand the variety of medical instruments, enrich the TLI image classification dataset, and provide a detailed classification of defect types. These changes will allow us to better evaluate the generalizability and adaptability of our proposed method to various TLI data. Furthermore, the model obtained from the study will be applied to actual clinical practice and the validity of the model in clinical testing will be verified in collaboration with clinical experts. These steps will help promote the application and spread of our research in clinical practice.
Funding source: Yonghua Chu
Award Identifier / Grant number: grant No. 2022C03111 from the Key Research and Development Program of Zhejiang Provincial Science and Technology Department.
Funding source: Panpan Xu
Award Identifier / Grant number: grant No. ZRY2021C024 from the Excellent Research Start-up Fund Project of Zhejiang Provincial People’s Hospital.
-
Research ethics: Not applicable.
-
Informed consent: Not applicable.
-
Author contributions: The authors have accepted responsibility for the entire content of this manuscript and approved its submission.
-
Use of Large Language Models, AI and Machine Learning Tools: None declared.
-
Conflict of interest: Authors state no conflict of interest.
-
Research funding: This work was supported in part by grant No. 2022C03111 from the Key Research and Development Program of Zhejiang Provincial Science and Technology Department, and grant No. ZRY2021C024 from the Excellent Research Start-up Fund Project of Zhejiang Provincial People’s Hospital.
-
Data availability: The datasets used in this study are available upon request from the corresponding author. However, a data sharing agreement is required to ensure appropriate use of the data.
The complex structure of tube lumen instruments (TLIs) makes them more difficult to clean than solid instruments. To improve the inspection of TLI cleaning quality and ensure patient safety and clinical reliability, this study proposes a method based on imaging analysis and deep learning techniques. This method effectively reduces the risk of false or missed detections caused by subjective judgment and visual fatigue during manual inspection.
See, Figure A.1, Appendix Tables 1 and 2.
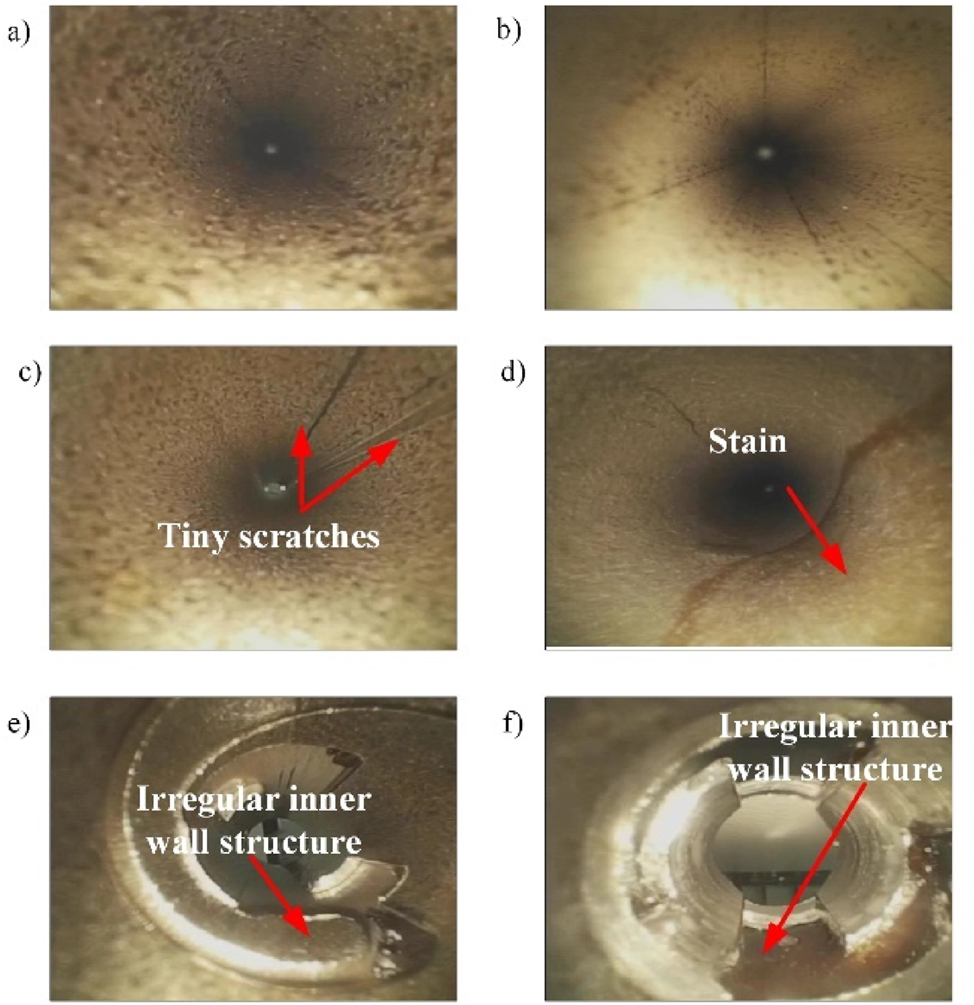
Images of typical defects inside the TLI.
Classification performance of transfer learning methods using other CNNs.
| Evaluation metrics | GoogleNet | MobileNet | EfficientNet |
|---|---|---|---|
| Accuracy/-% | 94.07 ± 2.22 | 94.96 ± 0.52 | 96.37 ± 0.40 |
| Macro recall/-% | 94.38 ± 2.94 | 95.10 ± 2.17 | 96.26 ± 1.43 |
| Macro precision/-% | 94.36 ± 3.32 | 95.03 ± 3.09 | 96.47 ± 1.12 |
| Macro F2-score/-% | 94.35 ± 2.63 | 95.05 ± 1.48 | 96.38 ± 1.15 |
| Avg training time/s | 557.5 | 1,348.0 | 3,762.7 |
Effect of image enhancement and the original image on model classification performance.
| Input image | Accuracy/-% | Macro-R/-% | Macro-P/-% | Macro-F2/-% |
|---|---|---|---|---|
| Raw image | 77.25 | 74.11 | 73.53 | 72.88 |
| Image enhancement | 83.83 | 81.51 | 84.74 | 81.27 |
References
1. Hervé, R, Keevil, C. Current limitations about the cleaning of luminal endoscopes. J Hosp Infect 2013;83:22–9. https://doi.org/10.1016/j.jhin.2012.08.008.Suche in Google Scholar PubMed
2. de Melo Costa, D, de Oliveira Lopes, LK, Vickery, K, Watanabe, E, de Oliveira Leão, LSN, de Paula, MC, et al.. Reprocessing safety issues associated with complex-design orthopaedic loaned surgical instruments and implants. Injury 2018;49:2005–12. https://doi.org/10.1016/j.injury.2018.09.006.Suche in Google Scholar PubMed
3. Masia, MD, Dettori, M, Deriu, GM, Bellu, S, Arcadu, L, Azara, A, et al.. ATP bioluminescence for assessing the efficacy of the manual cleaning procedure during the reprocessing of reusable surgical instruments. Healthcare 2021;9:352. https://doi.org/10.3390/healthcare9030352.Suche in Google Scholar PubMed PubMed Central
4. Organization WH. Decontamination and reprocessing of medical devices for health-care facilities. Geneva, Switzerland: World Health Organization; 2016.Suche in Google Scholar
5. de Melo Costa, D, Castillo, R, Vickery, K, Tipple, AFV, de Oliveira Lopes, L, Hu, H. Hinged surgical instruments: efficacy of double manual cleaning versus automated cleaning on biofilm removal. J Hosp Infect 2022;124:67–71. https://doi.org/10.1016/j.jhin.2022.03.011.Suche in Google Scholar PubMed
6. Alfa, MJ. Medical instrument reprocessing: current issues with cleaning and cleaning monitoring. Am J Infect Control 2019;47:A10–16. https://doi.org/10.1016/j.ajic.2019.02.029.Suche in Google Scholar PubMed
7. Visrodia, KH, Ofstead, CL, Yellin, HL, Wetzler, HP, Tosh, PK, Baron, TH. The use of rapid indicators for the detection of organic residues on clinically used gastrointestinal endoscopes with and without visually apparent debris. Infect Control Hosp Epidemiol 2014;35:987–94. https://doi.org/10.1086/677148.Suche in Google Scholar PubMed
8. de Souza Evangelista, S, Guimaraes, NR, Garcia, NB, Dos Santos, SG, de Oliveira, AC. Effectiveness of manual versus automated cleaning on Staphylococcus epidermidis biofilm removal from the surface of surgical instruments. Am J Infect Control 2020;48:267–74. https://doi.org/10.1016/j.ajic.2019.08.024.Suche in Google Scholar PubMed
9. Beni, HH, Shafiei, Z, Ghadami, A. A comparative study of the manual, automated, and ultrasonic surgical-instrument cleaning methods. J Iran Med Counc 2022;5:486–93.Suche in Google Scholar
10. de Souza Evangelista, S, dos Santos, SG, de Resende Stoianoff, MA, de Oliveira, AC. Analysis of microbial load on surgical instruments after clinical use and following manual and automated cleaning. Am J Infect Control 2015;43:522–7. https://doi.org/10.1016/j.ajic.2014.12.018.Suche in Google Scholar PubMed
11. Hu, T, Yi, L, Tang, Y, Chen, Y, Hu, R. Enhancing nighttime surgical instrument cleaning efficiency: an ECRS-based approach. Med Sci Monit: Int Med J Exp Clin Res 2023;29:e940346–940341. https://doi.org/10.12659/msm.940346.Suche in Google Scholar
12. Zühlsdorf, B, Emmrich, M, Floss, H, Martiny, H. Cleaning efficacy of nine different cleaners in a washer–disinfector designed for flexible endoscopes. J Hosp Infect 2002;52:206–11. https://doi.org/10.1053/jhin.2002.1284.Suche in Google Scholar PubMed
13. Ofstead, CL, Wetzler, HP, Eiland, JE, Heymann, OL, Held, SB, Shaw, MJ. Assessing residual contamination and damage inside flexible endoscopes over time. Am J Infect Control 2016;44:1675–7. https://doi.org/10.1016/j.ajic.2016.06.029.Suche in Google Scholar PubMed
14. Thaker, AM, Kim, S, Sedarat, A, Watson, RR, Muthusamy, VR. Inspection of endoscope instrument channels after reprocessing using a prototype borescope. Gastrointest Endosc 2018;88:612–19. https://doi.org/10.1016/j.gie.2018.04.2366.Suche in Google Scholar PubMed
15. Stephenson, K. Visual inspection of flexible endoscope working channels. Vend Vantage: Communiqué; 2016.Suche in Google Scholar
16. Ricci, MS, Lozupone, A, Colombo, B, Di Matteo, FM, Silvestri, S. Structural integrity monitoring of the endoscopes working channels: a visual inspection approach. In: 2021 IEEE international workshop on metrology for industry 4.0 & IoT (MetroInd4. 0 & IoT). Rome, Italy: IEEE; 2021.10.1109/MetroInd4.0IoT51437.2021.9488463Suche in Google Scholar
17. Arshaghi, A, Ashourin, M, Ghabeli, L. Detection and classification of potato diseases potato using a new convolution neural network architecture. Trait Du Signal 2021;38. https://doi.org/10.18280/ts.380622.Suche in Google Scholar
18. Liu, Y, Zhang, Z, Liu, X, Wang, L, Xia, X. Performance evaluation of a deep learning based wet coal image classification. Miner Eng 2021;171:107126. https://doi.org/10.1016/j.mineng.2021.107126.Suche in Google Scholar
19. Cengiz, E, Kelek, MM, Oğuz, Y, Yılmaz, C. Classification of breast cancer with deep learning from noisy images using wavelet transform. Biomed Eng/Biomed Tech 2022;67:143–50. https://doi.org/10.1515/bmt-2021-0163.Suche in Google Scholar PubMed
20. Shinozuka, K, Turuda, S, Fujinaga, A, Nakanuma, H, Kawamura, M, Matsunobu, Y, et al.. Artificial intelligence software available for medical devices: surgical phase recognition in laparoscopic cholecystectomy. Surg Endosc 2022;36:7444–52. https://doi.org/10.1007/s00464-022-09160-7.Suche in Google Scholar PubMed PubMed Central
21. Gómez-Sirvent, JL, de la Rosa, FL, Sánchez-Reolid, R, Fernández-Caballero, A, Morales, R. Optimal feature selection for defect classification in semiconductor wafers. IEEE Trans Semicond Manuf 2022;35:324–31. https://doi.org/10.1109/tsm.2022.3146849.Suche in Google Scholar
22. Sun, J, Li, C, Wu, X-J, Palade, V, Fang, W. An effective method of weld defect detection and classification based on machine vision. IEEE Trans Ind Inf 2019;15:6322–33. https://doi.org/10.1109/tii.2019.2896357.Suche in Google Scholar
23. Wagner, L, Kolb, S, Leuchtenberger, P, Bernhard, L, Jell, A, Wilhelm, D. Deep learning assisted intraoperative instrument cleaning station for robotic scrub nurse systems. at - Automatisierungstechnik 2023;71:572–9. https://doi.org/10.1515/auto-2023-0062.Suche in Google Scholar
24. Zhang, H, Jin, X, Wu, QJ, Wang, Y, He, Z, Yang, Y. Automatic visual detection system of railway surface defects with curvature filter and improved Gaussian mixture model. IEEE Trans Instrum Meas 2018;67:1593–608. https://doi.org/10.1109/tim.2018.2803830.Suche in Google Scholar
25. Li, D, Xie, Q, Gong, X, Yu, Z, Xu, J, Sun, Y, et al.. Automatic defect detection of metro tunnel surfaces using a vision-based inspection system. Adv Eng Inform 2021;47:101206. https://doi.org/10.1016/j.aei.2020.101206.Suche in Google Scholar
26. Lu, Z, Miao, J, Dong, J, Zhu, S, Wang, X, Feng, J. Automatic classification of retinal diseases with transfer learning-based lightweight convolutional neural network. Biomed Signal Process Control 2023;81:104365. https://doi.org/10.1016/j.bspc.2022.104365.Suche in Google Scholar
27. Zhuang, F, Qi, Z, Duan, K, Xi, D, Zhu, Y, Zhu, H, et al.. A comprehensive survey on transfer learning. Proc IEEE 2020;109:43–76. https://doi.org/10.1109/jproc.2020.3004555.Suche in Google Scholar
28. He, K, Zhang, X, Ren, S, Sun, J. Deep residual learning for image recognition. In: Proceedings of the IEEE conference on computer vision and pattern recognition. Las Vegas, USA: IEEE; 2016.10.1109/CVPR.2016.90Suche in Google Scholar
29. Loey, M, Manogaran, G, Taha, MHN, Khalifa, NEM. A hybrid deep transfer learning model with machine learning methods for face mask detection in the era of the COVID-19 pandemic. Measurement 2021;167:108288. https://doi.org/10.1016/j.measurement.2020.108288.Suche in Google Scholar PubMed PubMed Central
30. Hu, J, Shen, L, Sun, G. Squeeze-and-excitation networks. In: Proceedings of the IEEE conference on computer vision and pattern recognition. Salt Lake City, USA: IEEE; 2018.10.1109/CVPR.2018.00745Suche in Google Scholar
31. Roy, AG, Navab, N, Wachinger, C. Concurrent spatial and channel ‘squeeze & excitation’in fully convolutional networks. In: Medical Image computing and computer assisted intervention–MICCAI 2018: 21st international conference. Granada, Spain: Springer; 2018.10.1007/978-3-030-00928-1_48Suche in Google Scholar
© 2025 the author(s), published by De Gruyter, Berlin/Boston
This work is licensed under the Creative Commons Attribution 4.0 International License.
Artikel in diesem Heft
- Frontmatter
- Research Articles
- Design and optimization of a high-definition transcranial electrical stimulation device with envelope wave
- Free gas micro-/nano-bubble water: a novel dispersion system to prepare ultrasound imaging vehicles
- MEMS-based narrow-bandwidth magnetic field sensors: preliminary assessment of prototypes regarding coercivity, remanence, and sensitivity
- Novel low-cost approach to build large-scale flexible sensors for spatially distributed ground reaction force measurements
- Does helical plating for proximal humeral shaft fractures benefit bone healing? – an in silico analysis in fracture healing
- Meta-analysis of animal experiments on osteogenic effects of trace element doped calcium phosphate ceramic/PLGA composites
- Classification of anemic condition based on photoplethysmography signals and clinical dataset
- Improving the cleaning quality of tube lumen instruments by imaging analysis and deep learning techniques
- Machine learning prediction of effective radiation doses in various computed tomography applications: a virtual human phantom study