
Recognition analysis of spiral and straight-line drawings in tremor assessment
-
Attila Z. Jenei

 ,
Dávid Sztahó
,
Dávid Sztahó

Abstract
Objectives
No standard, objective diagnostic procedure exists for most neurological diseases causing tremors. Therefore, drawing tests have been widely analyzed to support diagnostic procedures. In this study, we examine the comparison of Archimedean spiral and line drawings, the possibilities of their joint application, and the relevance of displaying pressure on the drawings to recognize Parkinsonism and cerebellar dysfunction. We further attempted to use an automatic processing and evaluation system.
Methods
Digital images were developed from raw data by adding or omitting pressure data. Pre-trained (MobileNet, Xception, ResNet50) models and a Baseline (from scratch) model were applied for binary classification with a fold cross-validation procedure. Predictions were analyzed separately by drawing tasks and in combination.
Results
The neurological diseases presented here can be recognized with a significantly higher macro f1 score from the spiral drawing task (up to 95.7 %) than lines (up to 84.3 %). A significant improvement can be achieved if the spiral is supplemented with line drawing. The pressure inclusion in the images did not result in significant information gain.
Conclusions
The spiral drawing has a robust recognition power and can be supplemented with a line drawing task to increase the correct recognition. Moreover, X and Y coordinates appeared sufficient without pressure with this methodology.
Introduction
Conditions impacting the peripheral and central nervous system are categorized as neurological diseases. Their presence can substantially impact an individual’s quality of life in many areas. Furthermore, it represents a dominant and expanding health, economic, and sociological challenge. The growing and aging population contributes even more substantially to the global burden [1], 2].
Unfortunately, a majority of these disorders are asymptomatic in their early stages. Therefore, patients only consult a doctor later in their more advanced, symptomatic state. While there are clinically established rating scales for neurological conditions, and trained movement disorders specialists can effectively identify these disorders, challenges still exist in diagnosing neurological conditions [3]. Specialists primarily rely on the visual inspection of symptoms, the usage of medications, laboratory tests, and imaging devices (Computed Tomography, Magnetic Resonance Imaging) [4]. Therefore, much research is being conducted to support the neurologist’s decision-making process and to detect diseases as early as possible [5].
In this study, two major categories are discussed and examined: (1) parkinsonism (Parkinson’s disease (PD) and Secondary Parkinsonism (SP)) and (2) disorders involving the cerebellum (Essential tremor (ET) and other cerebellar dysfunction (CD)). The distinctive symptoms associated with each category are scrutinized to identify them using visual drawing representation. This novel approach leverages drawing-based tasks to explore potential diagnostic tools for these conditions.
Parkinsonism is an umbrella term that encompasses all conditions that exhibit cardinal features such as rigidity, bradykinesia, tremor, and/or postural instability. In other words, it is a clinical syndrome with various movement impairments [6]. From an etiological point of view, parkinsonism can be divided into groups, with the largest being Parkinson’s disease and secondary parkinsonism [7]. Although the symptoms in these groups are similar, their origins differ. Parkinson’s disease, a form of parkinsonism, is idiopathic and associated with the destruction of dopamine-producing cells of the basal ganglia (mainly the substantia nigra pars compacta). Its cause and cure are unknown. The severity of symptoms and the progression of Parkinson’s disease vary, but with appropriate management, the symptoms can often be controlled.
In contrast, the underlying cause of secondary parkinsonism is known, such as drug side effects, vascular problems, or exposure to toxins. There is no uniform diagnostic procedure for both of them. Diagnosis is typically made by a neurologist through visual inspection of symptoms and tests to rule out other diseases [8], 9].
The cerebellum has many connections with the brainstem, cerebrum, and spinal cord. Its task is to coordinate movements and maintain balance. Thus, it plays an essential role in walking, posture, pointing, and complex movements. Cerebellar dysfunction can have several causes, which may result in gait disturbances, speech problems, tremors, and insufficient execution of movements [10]. Other cerebellar dysfunctions considered in this study include conditions like Holmes tremor and cerebellar outflow tremor, all of which involve distinct cerebellar pathways leading to specific tremor characteristics. Essential tremor is inherited as an autosomal dominant trait in over half of the cases, and it typically has a posture- and action-dependent tremor component. It is also linked to cerebellar dysfunction, the most common type of pathological tremor. Furthermore, ET worsens over time and is most common in people after age 40 (PD is most common after 60) [11].
In contrast to Parkinsonian resting tremors, ET occurs during voluntary movements. Thus, the primary motor feature is kinetic tremor; however, patients may manifest other types of tremors. The tremor typically affects the hands bilateral, with a frequency between 4 and 12 Hz [12].
In clinical practice, several movement tests (such as walking, arm stretching, pointing to a target, and sitting at rest) help to examine the patient’s symptoms [13], 14]. In addition, simpler drawings and handwriting tests appeared [15], 16]. During these, the neurologist monitors the patient’s symptoms similarly, and these samples can be stored for later tests. Furthermore, the automatic analysis of these samples would represent an objective evaluation compared to the subjective evaluation of the neurologist [17].
The spiral pattern-based drawing task is simple enough yet requires complex movement coordination. Due to the continuity of the spiral, it highlights hypokinesia, tremor frequency, amplitude, and direction. Furthermore, it does not carry the stylistic differences of handwriting [18]. Therefore, many researchers use it to test for parkinsonism and cerebellar dysfunction [19], [20], [21], [22]. In addition, waveforms, straight lines, and particular objects are also examined as complement tasks [23], 24]. Based on these, the question arises as to which the patient should draw during an examination if the neurologist were to stick with only one type of drawing (primer drawing test). Also, joint usage of the different drawing tasks may increase the detectability of the symptoms and diseases.
Chakraborty et al. investigated the combined use of spiral and wave drawing patterns to classify Parkinson’s disease [24]. They hypothesize that combining these two drawing types gives a more confident prediction than using them separately. Their tests were performed on recordings of 28 control and 27 subjects with PD. 102 spiral and 102 wave drawings were processed after augmentation. Two separate convolutional models were created for the spiral and wave inputs, whose prediction led to logistic regression and random forest classifiers. By averaging the predictions of these two classifiers, the final decision for a subject resulted in 93.3 % accuracy and 93.9 % f1-score. Further comparison with a single model was not done in that study.
In addition, other analysis domains (movement sensors) also include the joint analysis of data from several sensors to achieve better classification than with a single sensor [25], [26], [27]. Our research aims to extend beyond these findings by exploring additional drawing patterns and integrating both cerebellar dysfunction and Parkinsonism diagnoses.
Before the spread of deep learning algorithms, knowledge-based features were determined from digital data using signal processing, which were statistically analyzed and classified using classification algorithms. Studies prove that pen pressure is essential in recognizing Parkinsonism and cerebellar involvement [28], [29], [30], [31]. On the other hand, another study reports that using only the 2D coordinates may be sufficient, excluding pressure (for ET) [22]. Furthermore, with the advent of convolutional networks, manually extracted features were replaced by convolutional kernel method-based feature extraction [32]. As a result, the network itself can extract useful information from input images. This approach is similar to that of the neurologist, who also studies the image already drawn visually. However, while the literature tends toward the usefulness of pressure among hand-crafted features, there is no clear research in convolutional network-based studies. This is an even more critical question, as the widely used devices (phones, tablets) usually cannot measure pressure. A possible performance deterioration must be revealed due to the lack of pressure data.
With our present research, we introduce three key contributions: (1) A direct comparison of diagnostic accuracy between spiral and straight-line drawings, (2) The evaluation of combined drawing tasks to improve detection rates, (3) An investigation into the significance of pen pressure as a feature in convolutional networks for Parkinsonism and cerebellar involvement.
The database and applied methods are described in the next section, and then, in the third section, the results are presented and discussed. The key findings are summarized and concluded in the last section.
Materials and methods
The examination process is illustrated in Figure 1. The database contains the raw drawing data of a healthy population, patients with Parkinsonism and cerebellar dysfunction, which are processed further to create images. By dividing the dataset, deep learning algorithms are developed with the training data set (pre-trained and custom models) and then evaluated with the test set. Each step of the process is presented in detail in the subsections below.
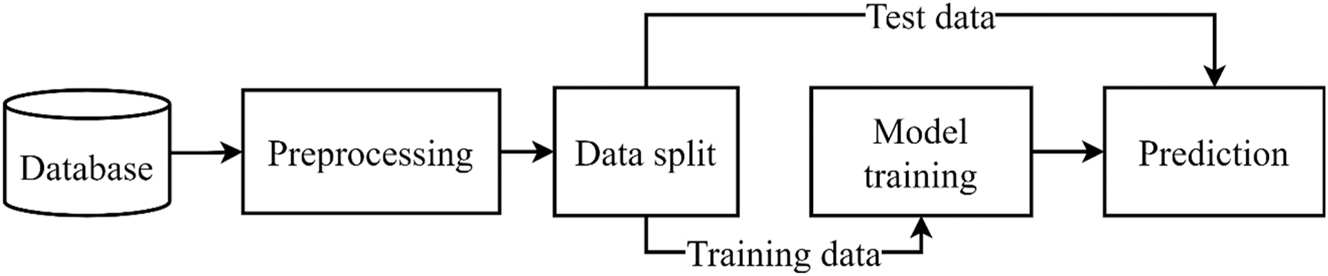
General schematic of examination’s process.
Hungarian drawing database
The drawing database included recordings from healthy and patients with neurological conditions. All subjects were informed in advance about the purpose and details of the research, and they consented to the recording and their use in the research. The recordings were conducted using an external electronic drawing board (Genius MousePen i608X). A clinical neurosurgeon acknowledged the diagnosis, right-handedness, and tremor presence in the patients. Patients with PD and SP were assessed according to the Unified Parkinson’s Disease Rating Scale (UPDRS) motor score [13]. Patients with ET and CD were evaluated based on the Drawing B task (Spiral) from the Fahn-Tolosa-Marin Tremor Rating Scale (FTM) [33]. All patients with PD and SP were assessed using the scoring task for better comparison, as presented in Table 1. PD patients may present features of micrographia and tremors in rare cases during the drawing sessions.
A detailed summary of the Hungarian drawings database.
| Major label | Minor label | Median age | Stand. dev. of age | Male/female | Total number | Median FTM | Stand. dev. of FTM |
|---|---|---|---|---|---|---|---|
| CS | CD | 59.6 | 19.7 | 8/5 | 13 | 3.0 | 1.0 |
| ET | 66.3 | 12.4 | 18/11 | 29 | 3.0 | 1.0 | |
| PS | PD | 59.4 | 6.0 | 19/7 | 26 | 2.0 | 0.7 |
| SP | 66.7 | 10.2 | 30/21 | 51 | 1.0 | 0.9 | |
| HC | – | 53.0 | 15.7 | 6/18 | 24 | – | – |
At least one spiral (standard Archimedes’ spiral) and one straight line pattern-based drawing for the right hand were recorded from each person. These drawing patterns were selected from the FTM Tremor Rating Scale. During the recording, the subjects had to follow the drawing patterns placed under the cover of the drawing board in the following way. In the case of the spiral drawing pattern, they started from the center of the spiral and moved between the lines of the spiral pattern to arrive at the end of the pattern (right-directional spiral). In the case of the line, the subjects moved between two bounding lines from a starting point to the endpoint from left to right, resulting in a horizontal line. The diameter for the spiral pattern was 5 cm and included four rounds. For the line drawing, the distance between the starting and end points was 17 cm, and 0.5 cm between the boundaries vertically. In both cases, the palm and the fingers did not touch the drawing cover to prevent compensatory maneuvers.
X and Y coordinates and the pressure value at the pen tip were recorded. The resolution of the drawing board was 14,668 × 11,334, the range of the pressure value was 0–1,023, and the sampling frequency was 110 Hz.
The database included 29 Essential tremor and 13 other Cerebellar Dysfunction patients. These were subsequently treated together as cerebellar symptoms (CS). In addition, 26 patients with Parkinson’s disease and 51 patients with Secondary Parkinsonism were treated together for Parkinson-like symptoms (PS). 24 healthy individuals were also included as a control group (HC). The detailed structure of the database is contained in Table 1. The mean age and the sex distribution of the HC group appear to be significant (using the Mann-Whitney test). However [34], found no statistically significant difference in how men and women drew the spiral under guided drawing conditions.
Image pre-processing
The raw data were centered on unifying drawing images. So, each drawing started from the (0,0) point. The coordinate values were normalized between −1 and 1. Two versions of the images were created: (1) colored images, in which pressure information was added, and (2) monochrome without pressure information. Instead of line width, colorization has been chosen to include pressure because initial experiments have shown that the applied neural network structures could learn more information this way. As a result, four images were created for each person: spiral (colored with pressure and monochrome), straight line (colored with pressure and monochrome).
The resolution of the final images was 224 × 224 with 24-bit depth (3 color channels) to match the neural network input sizes. This pre-processing phase was done in Python 3.6 with numpy (v1.19.5) and matplotlib (v3.3.4) using brg color map. An example of the final images for the colorized version can be seen in Figure 2.
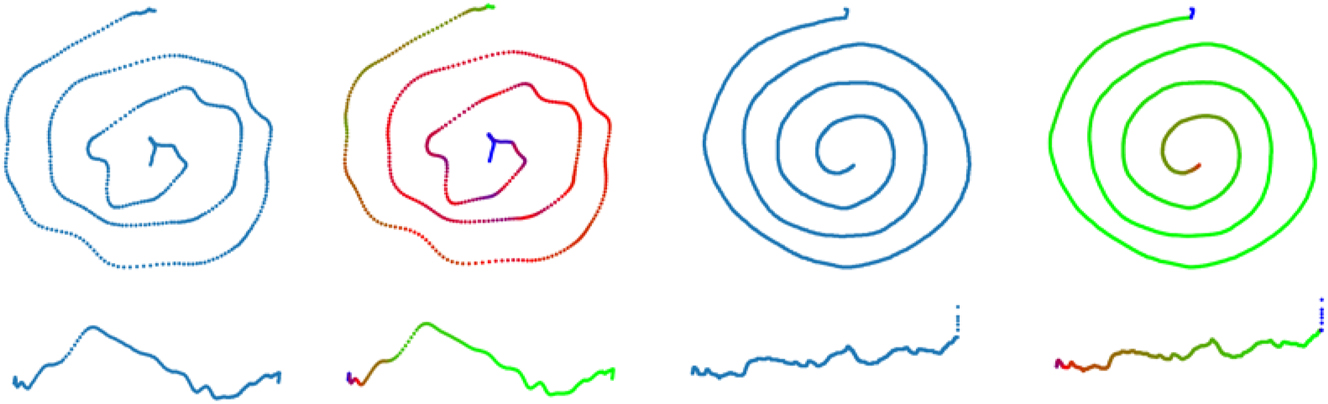
Example of a spiral (upper images) and a line (lower images) samples from the database. The left side shows a CT case and the right side shows an HC case. In every case, the left images are monochrome and the right ones are coloured with pin-pressure values. Both types of drawing are square images, which is the reason why the vertical component of the line drawing is stressed (rather than a smooth line for the HC example).
Feature extraction and classification
Two approaches were used for feature extraction: (1) pre-trained models and (2) model from scratch. On the one hand, pre-trained networks were assumed to provide robust features due to their training on a large data set. For this purpose, MobileNet [35], ResNet50 [36] and Xception [37] were examined. All three models were trained on the ImageNet database. The weights were frozen for feature extraction, and the top (original classifier) was not included. The resolution of internal images was uniform (224, 224, 3). On the other hand, a simple convolutional model from scratch was also developed (as a baseline). This model contained five convolutional blocks. The number of convolutional blocks was chosen based on the images’ complexity and the database’s size (smaller and bigger models were also probed initially). Such a convolutional block had a Convolution2D layer (filter number is 8, size 5 × 5, same padding and ReLU activation function), a MaxPooling layer (filter size 2 × 2), and a DropOut (neuron drop ratio: 0.1) layer.
The output of the pre-trained models was transformed into feature vectors using the GlobalPooling layer and the Flatten layer for our simple model. These vectors represented input images in a compact, 1D format. Then, there were Dense layers with 64, 8, and 2 output dimensions, respectively, for all four models. DropOut layers were included with a neuron drop ratio of 0.1 between the Dense layers. Finally, a Softmax activation function was added to the output to generate predictions. A schematic diagram of this procedure is shown in Figure 3.
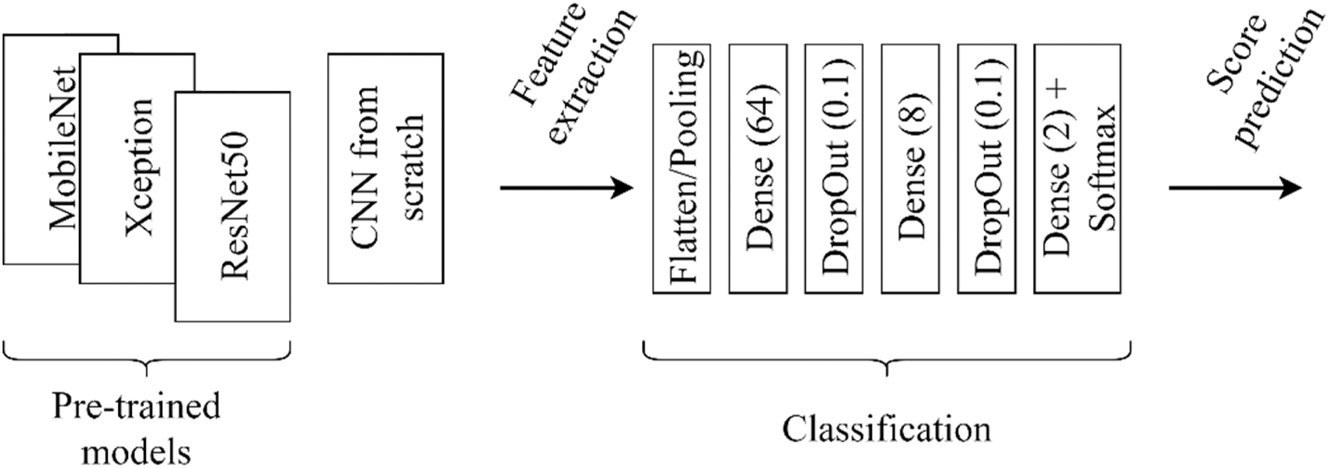
Schematic of feature extraction and classification.
Evaluation and metrics
The input images and corresponding labels were randomly shuffled before feeding them to the networks. The labels were transformed into categorical variables. The stratified k-fold method was used for model evaluation, where the number of folds was 10. Adam optimizer (with 0.001 learning rate), categorical cross entropy as loss function and categorical accuracy as monitoring metric were chosen for model compiling.
In the case of pre-trained models, only the classification part was trained with 100 epochs. In the case of the baseline model, it was also necessary to train the convolutional part. Thus, 500 epochs were chosen. These parameters were based on the results achieved on a single 10 % validation set in a preliminary phase. During training, the batch size was 32 by default.
Balanced accuracy and macro f1 score were applied to evaluate the performance of the models. The former is the mean of the sensitivity and specificity (Eq. (1)). It also considers the proportion of the classes (imbalanced data) compared to the traditional accuracy metric. The latter is the harmonic mean of precision and sensitivity (Eq. (2)). The “macro” means the unweighted average of the f1 value calculated for both labels. Notations in Eqs. (1) and (2) are TP as True Positive, TN as True Negative, FP as False Positive, and FN as False Negative samples.
The following binary classification (HC-PS, HC-CS) experiments were conducted using the evaluation mentioned above with all four models:
Classification using spiral drawings
without pressure display
with pressure display
Classification using straight-line drawings
without pressure display
with pressure display
Aggregation of spiral and straight-line predictions using soft voting
without pressure display
with pressure display
Experiment (1) and (2) supplement the idea of which drawing type carry more information (achieve higher classification performance) related to the disorders. Experiments (1) and (2) also examined the relevance of pressure information in Parkinsonism and cerebellar dysfunction for both spiral and straight-line drawings. Finally, experiment (3) determines whether additional information can be revealed using multiple drawing types per individual. Individual model predictions (per drawing type) are fused together for this.
The final prediction is calculated using Eq. (3), where yfinal∈{0,1} is the final prediction, ys∈{0,1} is the prediction from spiral drawing, yl∈{0,1} is the prediction from line drawing, and Θ is a weighting between the spiral and line predictions. Θ was evaluated from 0 to 1 with 0.1 steps.
The initial predictions are provided by the Softmax function at the end of the models for each drawing task. These predictions assign samples to the preferred class using a decision threshold. However, a weighted prediction was generated by defining a ratio between the drawing tasks subject-wise using Eq. (3).
The decision threshold for yfinal, ys, yl was 0.5. In other words, the sample that received a prediction score above 0.5 was classified as a positive sample (PS or CS), while below this number, the sample was assigned to the negative class (HC).
Each cross-validation case was executed five times for each model. Metrics were calculated with the resulting predictions. Finally, these metrics were averaged along the executions.
Mann-Whitney non-parametric statistical test was used on macro f1 scores between the groups in interest to test significance. These groups are defined as the experiment points. The null hypothesis states that the macro f1 scores come from the same population. The significance level was set to 0.05 as a generally used limit. In the Results section, the p-value of the test will be compared to the significance level to assess the null hypothesis.
Results
Results on spiral and straight-line drawings
The results obtained on the spiral drawings are shown in Table 2. The top four rows show the results obtained without pressure mapping and the bottom four with pressure mapping. The first five columns belong to the HC-CS classification, and the last five columns to the HC-PS classification. Notations in the table are sens – sensitivity, spec – specificity, b. acc – balanced accuracy, f1 – macro f1 score, std. f1 – standard deviation of macro f1 score along the five executions.
Results of spiral drawings for binary classification (HC-CS, HC-PS). The best results are marked in bold.
| Models | HC-CS | HC-PS | |||||||||
|---|---|---|---|---|---|---|---|---|---|---|---|
| sens | spec | b. acc | f1 | std. f1 | sens | spec | b. acc | f1 | std. f1 | ||
| Without pressure | Xception | 91.7 % | 91.0 % | 91.3 % | 90.6 % | 1.4 % | 94.3 % | 71.7 % | 83.0 % | 84.1 % | 2.2 % |
| MobileNet | 91.7 % | 98.6 % | 95.1 % | 95.6 % | 2.5 % | 96.4 % | 65.8 % | 81.1 % | 83.6 % | 2.3 % | |
| ResNet50 | 88.3 % | 93.8 % | 91.1 % | 91.1 % | 1.9 % | 94.3 % | 73.3 % | 83.8 % | 84.8 % | 2.0 % | |
| Baseline | 96.7 % | 89.1 % | 92.9 % | 91.4 % | 2.6 % | 90.9 % | 69.2 % | 80.1 % | 80.2 % | 2.3 % | |
| With pressure | Xception | 86.7 % | 90.0 % | 88.3 % | 88.0 % | 2.5 % | 97.7 % | 69.2 % | 83.4 % | 86.2 % | 1.9 % |
| MobileNet | 93.3 % | 97.6 % | 95.5 % | 95.7 % | 1.4 % | 96.1 % | 72.5 % | 84.3 % | 86.1 % | 2.3 % | |
| ResNet50 | 90.9 % | 95.7 % | 93.3 % | 93.4 % | 1.6 % | 93.8 % | 60.0 % | 76.9 % | 78.7 % | 2.2 % | |
| Baseline | 86.7 % | 84.8 % | 85.7 % | 84.7 % | 4.8 % | 93.0 % | 70.8 % | 81.9 % | 82.5 % | 2.3 % | |
-
The best performance according to b. acc is marked with bold per classification cases (HC-CS and HC-PS).
Between the two classification problems (HC-CS and HC-PS), HC-CS recognition performs better than HC-PS. Without pressure information, the baseline model and MobileNet gave the most prominent difference, 11.2 %, and 12.0 %, between the classification problems. In this case, Xception and ResNet50 performed 6.4 % better on average for the HC-CS than HC-PS. When pressure is applied, the greatest difference is a 14.7 % macro f1 score with ResNet50 between HC-CS and HC-PS. On the other hand, our baseline model and the Xception did not result in a detectable difference.
Bearing the pressure presentation on spiral images resulted as follows. HC-CS recognition was more likely to improve without pressure. At the same time, HC-PS classification slightly decreased without pressure data. In concrete terms, Xception and the baseline model had a 2.6 and 6.7 % decrease in the macro f1 score with pressure. Meanwhile, ResNet50 showed a 2.3 % improvement with pressure. In the case of HC-PS classification, Xception, MobileNet, and the Baseline model show a decrease without pressure data (2.3 % macro f1 score on average). Only ResNet50 showed a 6.1 % improvement without pressure.
Applying the Mann-Whitney test, no significant difference can be observed between the macro f1 scores resulting with and without pressure data for both symptom classification problems (HC-PS p-value: 0.701, HC-CS p-value: 0.435).
Table 3 presents the results of the straight-line drawings. The names of the columns and abbreviations of the metrics are the same as in Table 2. Examining straight lines, there is no longer a considerable difference between the HC-CS and HC-PS results. The maximum macro f1 score difference is 4.7 % using MobileNet without pressure data.
Results of straight-line drawings for binary classification (HC-CS, HC-PS). The best results are marked in bold.
| Models | HC-CS | HC-PS | |||||||||
|---|---|---|---|---|---|---|---|---|---|---|---|
| sens | spec | b. acc | f1 | std. f1 | sens | spec | b. acc | f1 | std. f1 | ||
| Without pressure | Xception | 61.7 % | 82.9 % | 72.2 % | 72.6 % | 2.3 % | 93.5 % | 48.3 % | 70.9 % | 73.2 % | 3.4 % |
| MobileNet | 80.0 % | 88.6 % | 84.3 % | 84.3 % | 1.8 % | 94.3 % | 60.8 % | 77.5 % | 79.6 % | 2.8 % | |
| ResNet50 | 70.9 % | 81.4 % | 76.1 % | 75.9 % | 1.1 % | 93.0 % | 49.2 % | 71.1 % | 73.2 % | 2.2 % | |
| Baseline | 74.2 % | 90.5 % | 82.3 % | 83.0 % | 3.0 % | 94.8 % | 62.5 % | 78.7 % | 80.8 % | 3.5 % | |
| With pressure | Xception | 68.3 % | 80.0 % | 74.2 % | 74.0 % | 4.0 % | 92.5 % | 52.5 % | 72.5 % | 74.3 % | 0.9 % |
| MobileNet | 78.3 % | 88.1 % | 83.2 % | 83.2 % | 1.4 % | 95.1 % | 61.7 % | 78.4 % | 80.6 % | 2.8 % | |
| ResNet50 | 60.0 % | 83.8 % | 71.9 % | 72.4 % | 2.9 % | 90.1 % | 49.2 % | 69.6 % | 70.9 % | 4.5 % | |
| Baseline | 74.2 % | 88.6 % | 81.4 % | 81.8 % | 2.7 % | 92.7 % | 68.3 % | 80.5 % | 81.5 % | 3.7 % | |
-
The best performance according to b. acc is marked with bold per classification cases (HC-CS and HC-PS).
Regarding the pressure use, a similar tendency in results was obtained as with the spiral drawings. In the classification of HC-CS, the macro f1 score drop was 1.4 % (with the Xception) when no pressure data was used. The other models achieved an average 1.9 % better macro f1 score without pressure. In the HC-PS classifications, all four models showed better results with pressure except the ResNet50. However, no significant difference can be measured between the macro f1 scores according to the pressure presentation.
Tables 2 and 3 also show differences between spiral and line results. All models performed better for both classification problems using spiral drawings than lines (comparing them model-wise). The minimum improvement is 2.9 % (Baseline model with pressure), and the maximum gain is 21.0 % (ResNet50 with pressure) for HC-CS. That is a minimum of 1.4 and a maximum of 12.4 increase on average in correctly classified samples. Examining HC-PS results, the Baseline model gained similar results for both drawing tasks (0.6–1% macro f1 score differences). For all other models, the macro f1 score of the spiral classifications exceeded the line ones. The maximum gain was 11.9 % (+8 correctly assigned samples) using Xception with pressure data.
Overall, the macro f1 scores of the spiral experiments appeared significantly different from the straight-line experiments’ (HC-PS p-value<0.000, HC-CS p-value<0.000).
Results of prediction aggregation using soft voting
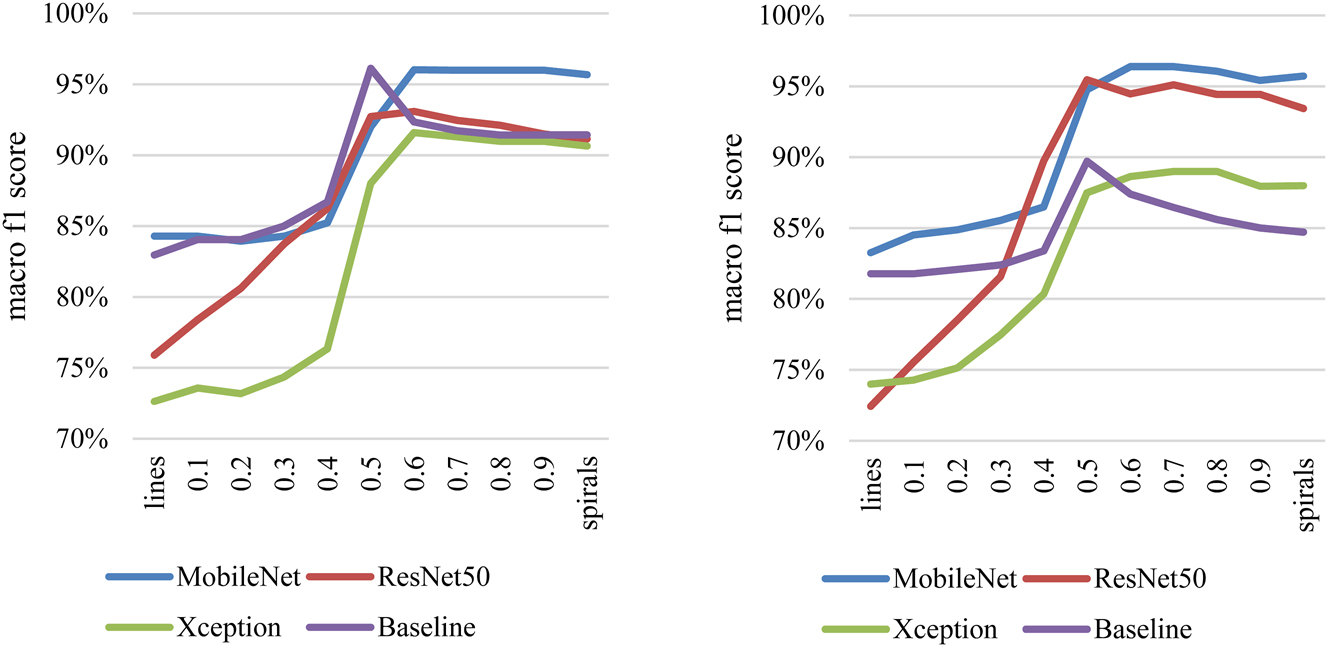
Figure 4 shows the macro f1 scores obtained by aggregating the predictions of the spiral and line drawings for HC-PS. The left figure contains the results of the experiments with pressure, and the right figure the experiments without pressure. The macro f1 score is shown in percentage on the vertical axis, and the weighting factor (Θ) is presented from Eq. (3) on the horizontal axis. If Θ is 0, then purely line results are shown. If Θ is 1, then purely spiral results are displayed. Models are marked with different colors.
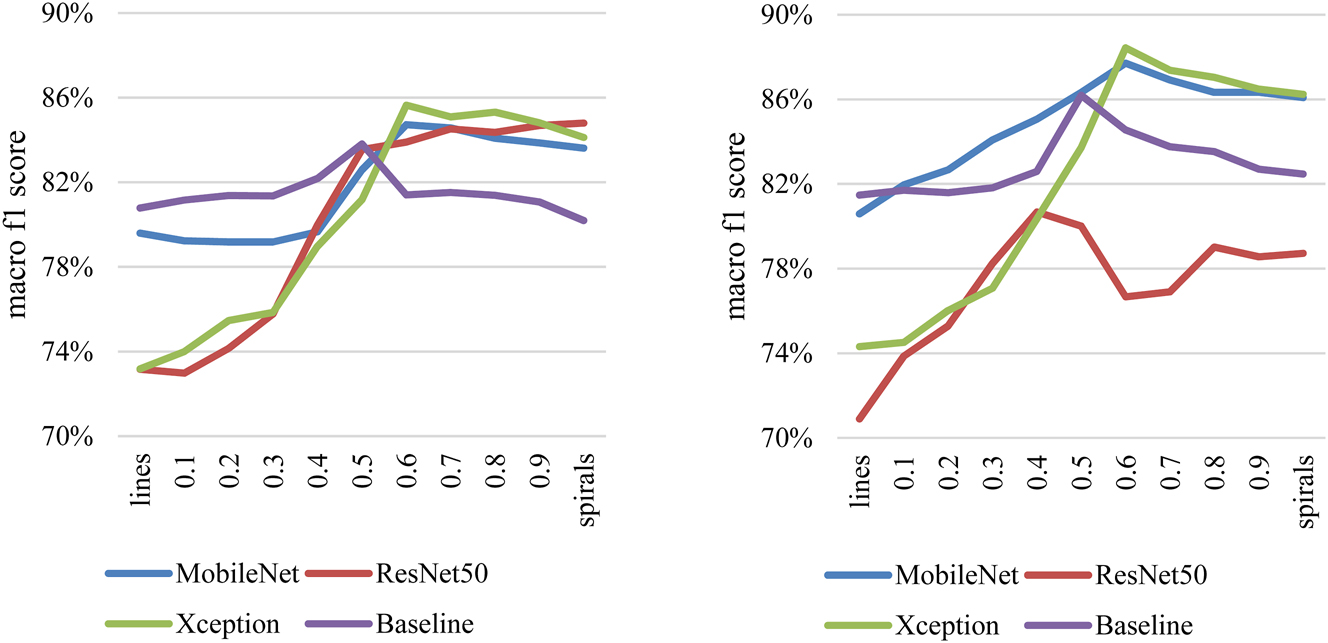
Macro f1 score results with aggregation of images without pressure data (left side) and of images with pressure data (right side) in HC-PS classification.
There is an increasing trend from lines towards the spiral results. A clear peak can be observed between the extreme points for all models. A maximum 3.0 % macro f1 score increase can be acknowledged at the peak compared to the pure spiral results with the Baseline model on monochrome data. This means classifying two additional samples into the appropriate category. The improvement is more conspicuous when peak values are compared to the line’s f1 scores.
With pressure data, a greater difference can be observed. A minimum of 1.6 % (MobileNet) and a maximum of 3.7 % (Baseline) increase can be seen in the macro f1 scores. Respectively, it is an additional one and three samples classified correctly.
Figure 5 similarly shows the macro f1 score obtained by aggregating the line and spiral results for the HC-CS classifications. The notations are the same as in Figure 4. An increasing trend is also observed. However, there is less of a prominent peak between the two extremes (except the Baseline). On the left figure, all models show a macro f1 score improvement of 0.3–4.7 % compared to the spiral results. The maximum gain is achieved with the Baseline model. These represent 0.2–3 additional correctly classified individuals. Similar results can be seen with pressure data. The improvement is between 0.7 and 5 % in the macro f1 score. This means a maximum of 3.4 more correct samples with the Baseline model.
Macro f1 score results with aggregation of images without pressure data (left side) and of images with pressure (right side) for HC-CS classification.
Significant differences were perceived between the peak and the extreme points’ (pure spiral or line) macro f1 scores regardless of the pressure inclusion (HC-PS p-value: 0.011, HC-CS p-values: 0.032).
Conclusions and discussion
Many researchers explore the potential of using different drawings in neurological diagnosis, particularly for conditions where diagnostic procedures are still evolving. Although clinical criteria exist for conditions like PD and ET, integrating AI-based assessments could enhance accuracy and objectivity in diagnosis, providing valuable support.
Drawing tasks based on spiral patterns are widely applied, while others are less common. Therefore, we investigated whether a spiral or a straight line (available from the same person) results in better recognition of parkinsonism and cerebellar involvement. The second objective of the research was to analyze whether the combined prediction of the two types of drawings reveals additional information regarding the diseases.
Furthermore, a consensus has appeared in the literature that pressure – as a descriptive characteristic – carries valuable information regarding both parkinsonism and cerebellar dysfunction. Therefore, we also examined whether pressure is relevant in drawing images using automatic deep-learning feature extraction.
A drawing database recorded from Hungarian subjects was used for examination, which consisted of healthy individuals and patients with parkinsonism or cerebellar dysfunction. From each subject, a spiral and a straight line sample were recorded with the right hand (dominant hand). Pre-trained models and a model from scratch (Baseline) were used for examination tasks. We created them so that all models’ classification was the same. Only feature extraction parts differed from model to model.
Our results showed that the symptoms of cerebellar dysfunction can be recognized with higher performance than the symptoms of Parkinsonism in the case of spiral drawings. The difference was not conspicuous with straight lines. The potential explanation could stem from Parkinsonism being characterized by muscle rigidity, impaired coordination and slowness (tremor at rest does not appear or only appears less on drawings) [18]. These characteristics affect the drawing time, which is not shown in a static picture. However, a typical symptom of cerebellar involvement is a tremor or inaccuracy in voluntary activities. This results in a more visible difference compared to healthy drawings.
Spiral drawings’ results outperformed straight-line drawings’ in almost every case. This observation is consistent with the literature. Namely, the most examined drawing is the Archimedes spiral (or its variant). Thus, spiral drawing is recommended if the neurologist relies on just one type of drawing.
A joint analysis of different types of drawings (spiral, straight line in our case) can help establish a more accurate diagnosis. Our research used a weighting factor between the spiral and line models’ predictions per individual to gain the outcome. This approach resulted in 3.7 % for HC-PS and a 5.0 % macro f1 score gain for HC-CS, which means an additional three correctly classified subjects on average. A possible reason is that certain people come close to the model’s decision limit when analyzing the pure drawings. At this limit, misclassification could occur because the model is uncertain about the class. Their results can be improved and clarified with the help of a secondary (supplementary) drawing that reduces uncertainty.
Finally, our results indicated that highlighting the pressure on the images provides additional information for HC-PS. However, it did not appear to be significant. Examining HC-CS results, the pressure appeared disturbing and did not contribute positively to the models’ performance. Still, this did not prove to be significant either.
The limitation of our study is the size and demographic diversity of the database. We used pre-trained feature extraction models to resolve the sample size barrier, which obtained results comparable to the literature’s findings. Gender differences also do not significantly influence the outcome, according to the [33] study.
In summary, it can be concluded that spiral drawings are primarily recommended for both HC-PS and HC-CS classification, while line drawings can be used as a supplementary task. Excluding the pressure data does not deteriorate the classification performance, which impresses the currently widely distributed devices.
-
Research ethics: Not applicable: The recording is non-invasive, sensitive data were not recorded. Also, the subjects cannot be identified from the recordings.
-
Informed consent: All subjects were informed in advance about the purpose and details of the research, and they gave their consent to the recording and their use in the research.
-
Author contributions: All authors have accepted responsibility for the entire content of this manuscript and approved its submission.
-
Use of Large Language Models, AI and Machine Learning Tools: None declared.
-
Conflict of interest: Authors state no conflict of interest.
-
Research funding: None declared.
-
Data availability: The dataset is not publicly available.
References
1. Neurological disorders: public health challenges. Geneva: World Health Organization; 2006. [Online]. https://apps.who.int/iris/handle/10665/43605 [Accessed 20 January 2023].Suche in Google Scholar
2. Deuschl, G, Wenzelburger, R, Löffler, K, Raethjen, J, Stolze, H. Essential tremor and cerebellar dysfunction Clinical and kinematic analysis of intention tremor. Brain 2000;123:1568–80. https://doi.org/10.1093/brain/123.8.1568.Suche in Google Scholar PubMed
3. Chandra, V, Pandav, R, Laxminarayan, R, Taanner, C, Manyam, B, Rajkumar, S, et al.. Neurological disorders. In: Jamison, DT, Breman, JG, Measham, AR, Alleyne, G, Claeson, M, Evans, DB, et al.., editors. Disease Control Priorities in Developing Countries, 2nd ed. Washington (DC): The International Bank for Reconstruction and Development/The World Bank; 2006.Suche in Google Scholar
4. Tolosa, E, Wenning, G, Poewe, W. The diagnosis of Parkinson’s disease. Lancet Neurol 2006;5:75–86. https://doi.org/10.1016/s1474-4422(05)70285-4.Suche in Google Scholar
5. Raghavendra, U, Acharya, UR, Adeli, H. Artificial intelligence techniques for automated diagnosis of neurological disorders. Eur Neurol 2019;82:41–64. https://doi.org/10.1159/000504292.Suche in Google Scholar PubMed
6. Shrimanker, I, Tadi, P, Sánchez-Manso, JC. Parkinsonism. In: StatPearls, Treasure Island (FL): StatPearls Publishing; 2022. [Online]. http://www.ncbi.nlm.nih.gov/books/NBK542224/ [Accessed 23 January 2023].Suche in Google Scholar
7. Oertel, WH, Fahn, S. Parkinsonism. In: Thomas, B, Louis, RC, Johannes, D, Hans-Christoph, D, Christopher, K, editors. Neurological Disorders: Course and Treatment, 2nd ed. Gulf Professional Publishing; 2003:1021–79 pp.10.1016/B978-012125831-3/50269-0Suche in Google Scholar
8. Hubert, HF, Andre, M, Mayur, P. The body language of movement disorders. In: Hubert, HF, editor. A Practical Approach to Movement Disorders: Diagnosis and Management, 2nd ed. New York, NY: Springer Publishing Company; 2021.Suche in Google Scholar
9. Keener, A, Bordelon, Y. Parkinsonism. Semin Neurol 2016;36:330–4. https://doi.org/10.1055/s-0036-1585097.Suche in Google Scholar PubMed
10. Lenka, A, Louis, ED. Revisiting the clinical phenomenology of “Cerebellar Tremor”: beyond the intention tremor. Cerebellum 2019;18:565–74. https://doi.org/10.1007/s12311-018-0994-6.Suche in Google Scholar PubMed
11. Welton, T, Cardoso, F, Carr, JA, Chan, L-L, Deuschl, G, Jankovic, J, et al.. Essential tremor. Nat Rev Dis Primers 2021;7:83. https://doi.org/10.1038/s41572-021-00314-w.Suche in Google Scholar PubMed
12. Bhidayasiri, R. Differential diagnosis of common tremor syndromes. Postgrad Med 2005;81:756–62. https://doi.org/10.1136/pgmj.2005.032979.Suche in Google Scholar PubMed PubMed Central
13. Goetz, CG, Fahn, S, Martin, PM, Poewe, W, Sampiaio, C, Stebbins, GT, et al.. Movement disorder society-sponsored revision of the unified Parkinson’s disease rating scale (MDS-UPDRS): process, format, and clinimetric testing plan. Mov Disord 2007;22:41–7. https://doi.org/10.1002/mds.21198.Suche in Google Scholar PubMed
14. Farkas, Z, Szirmai, I, Kamondi, A. Impaired rhythm generation in essential tremor. Mov Disord 2006;21:1196–9. https://doi.org/10.1002/mds.20934.Suche in Google Scholar PubMed
15. Broderick, MP, Van Gemmert, AWA, Shill, HA, Stelmach, GE. Hypometria and bradykinesia during drawing movements in individuals with Parkinson’s disease. Exp Brain Res 2009;197:223–33. https://doi.org/10.1007/s00221-009-1925-z.Suche in Google Scholar PubMed
16. Ali, SM, Arjunan, SP, Peters, J, Dumbrava, LP, Ding, C, Eller, M, et al.. Wearable sensors during drawing tasks to measure the severity of essential tremor. Sci Rep 2022;12:5242. https://doi.org/10.1038/s41598-022-08922-6.Suche in Google Scholar PubMed PubMed Central
17. Wille, A, Sangaré, M, Winter, S. Analysis of patterns in tremor diagnosis spiral drawings for automated classification. Biomed Eng/Biomed Tech 2013;58:000010151520134278.10.1515/bmt-2013-4278Suche in Google Scholar PubMed
18. Alty, J, Cosgrove, J, Thorpe, D, Kempster, P. How to use pen and paper tasks to aid tremor diagnosis in the clinic. Practical Neurol 2017;17:456–63. https://doi.org/10.1136/practneurol-2017-001719.Suche in Google Scholar PubMed PubMed Central
19. Islam, RMD, Matin, A, Nahiduzzaman, M, Siddiquee, SM, Hasnain, SFM, Shovan, S, et al.. A novel deep convolutional neural network model for detection of Parkinson disease by analysing the spiral drawing. In: Uddin, MS, Bansal, JC, editors. Proceedings of International Joint Conference on Advances in Computational Intelligence. Singapore: Springer; 2021.10.1007/978-981-16-0586-4_13Suche in Google Scholar
20. Lopez-de-Ipina, K, Solé-Casals, J, Faúndez-Zanuy, M, Calvo, PM, Sesa, E, Roure, J, et al.. Automatic analysis of Archimedes’ spiral for characterization of genetic essential tremor based on Shannon’s entropy and fractal dimension. Entropy 2018;20:531. https://doi.org/10.3390/e20070531.Suche in Google Scholar PubMed PubMed Central
21. Kamble, M, Shrivastava, P, Jain, M. Digitized spiral drawing classification for Parkinson’s disease diagnosis. Measurement: Sensors 2021;16:100047. https://doi.org/10.1016/j.measen.2021.100047.Suche in Google Scholar
22. Solé-Casals, J, Anchustegui-Echearte, I, Marti-Puig, P, Calvo, PM, Bergareche, A, Sánchez-Méndez, J, et al.. Discrete cosine transform for the analysis of essential tremor. Front Physiol 2019;9:1947. https://doi.org/10.3389/fphys.2018.01947.Suche in Google Scholar PubMed PubMed Central
23. Fahn, S, Tolosa, E, Marín, C. Clinical rating scale for tremor. In: Jankovic, J, Tolosa, E, editors. Parkinson’s disease and movement disorders, 2nd ed. Baltimore: Williams & Wilkins; 1993:225–34 pp.Suche in Google Scholar
24. Tolonen, A, Cluitmans, L, Smits, E, van Gils, M, Maurits, N, Zietsma, R. Distinguishing Parkinson’s disease from other syndromes causing tremor using automatic analysis of writing and drawing tasks. In: 2015 IEEE 15th international conference on bioinformatics and bioengineering (BIBE). Belgrade, Serbia: IEEE; 2015.10.1109/BIBE.2015.7367690Suche in Google Scholar
25. Chakraborty, S, Aich, S, Seong-Sim, J, Han, E, Park, J, Kim, H-C. Parkinson’s disease detection from spiral and wave drawings using convolutional neural networks: a multistage classifier approach. In: 2020 22nd international conference on advanced communication technology (ICACT). Korea: IEEE; 2020.10.23919/ICACT48636.2020.9061497Suche in Google Scholar
26. Barth, J, Sünkel, M, Bergner, K, Schickhuber, G, Winkler, J, Klucken, J, et al.. Combined analysis of sensor data from hand and gait motor function improves automatic recognition of Parkinson’s disease. In: 2012 annual international conference of the IEEE Engineering in Medicine and Biology Society. San Diego, CA: IEEE; 2012.10.1109/EMBC.2012.6347146Suche in Google Scholar PubMed
27. Oung, QW, Hariharan, M, Lee, LH, Basah, SN, Sarillee, M, Lee, CH. Wearable multimodal sensors for evaluation of patients with Parkinson disease. In: 2015 IEEE International Conference on Control System, Computing and Engineering (ICCSCE). Penang, Malaysia: IEEE; 2015.10.1109/ICCSCE.2015.7482196Suche in Google Scholar
28. Zhao, A, Li, J, Dong, J, Qi, L, Zhang, Q, Li, N, et al.. Multimodal gait recognition for neurodegenerative diseases. IEEE Trans Cybern 2022;52:9439–53. https://doi.org/10.1109/tcyb.2021.3056104.Suche in Google Scholar PubMed
29. Drotár, P, Mekyska, J, Rektorová, I, Masarová, L, Smékal, Z, Faundez-Zanuy, M. Evaluation of handwriting kinematics and pressure for differential diagnosis of Parkinson’s disease. Artif Intell Med 2016;67:39–46. https://doi.org/10.1016/j.artmed.2016.01.004.Suche in Google Scholar PubMed
30. Sonnet, KS, Ferleger, BI, Ko, AL, Chizeck, HJ, Herron, JA. Multi-class classification and feature analysis of FTM drawing tasks in a digital assessment of tremor. In: 2020 IEEE 20th international conference on bioinformatics and bioengineering (BIBE), Cincinnati, OH, USA; 2020.10.1109/BIBE50027.2020.00061Suche in Google Scholar
31. Gil-Martín, M, Montero, JM, San-Segundo, R. Parkinson’s disease detection from drawing movements using convolutional neural networks. Electronics 2019;8:907. https://doi.org/10.3390/electronics8080907.Suche in Google Scholar
32. Peters, J, Motin, MA, Perju-Dumbrava, L, Ali, SM, Ding, C, Eller, M, et al.. Computerised analysis of writing and drawing by essential tremor phenotype. BMJ Neurol Open 2012;3:e000212. https://doi.org/10.1136/bmjno-2021-000212.Suche in Google Scholar PubMed PubMed Central
33. Navamani, TM. Efficient deep learning approaches for health Informatics. In: Sangaiah, AK, editor. Deep learning and parallel computing environment for bioengineering systems; 2019.10.1016/B978-0-12-816718-2.00014-2Suche in Google Scholar
34. Hess, CW, Wang, C, Yu, Q, Boschung, S, San Luciano, M, Saunders-Pullman, R, et al.. Normative data for digitized spiral analysis: evaluation of age and gender effects. Mov Disord 2012;27.Suche in Google Scholar
35. Howard, AG, Thu, M, Chen, B, Kalenichenko, D, Wang, W, Weyand, T, et al.. MobileNets: efficient convolutional neural networks for mobile vision applications. [arxiv] 2017, https://doi.org/10.48550/ARXIV.1704.04861.Suche in Google Scholar
36. He, K, Zhang, X, Ren, S, Sun, J. Deep residual learning for image recognition. [arxiv] 2015, https://doi.org/10.48550/ARXIV.1512.03385.Suche in Google Scholar
37. Chollet, F. Xception: deep learning with depthwise separable convolutions. [arxiv] 2016, https://doi.org/10.48550/ARXIV.1610.02357.Suche in Google Scholar
© 2024 the author(s), published by De Gruyter, Berlin/Boston
This work is licensed under the Creative Commons Attribution 4.0 International License.
Artikel in diesem Heft
- Frontmatter
- Review
- Hydrogel promotes bone regeneration through various mechanisms: a review
- Research Articles
- Wear investigation of implant-supported upper removable prothesis with electroplated gold or PEKK secondary crowns
- Straight and helical plating with locking plates for proximal humeral shaft fractures – a biomechanical comparison under physiological load conditions
- Integration of neuromuscular control for multidirectional horizontal planar reaching movements in a portable upper limb exoskeleton for enhanced stroke rehabilitation
- Recognition analysis of spiral and straight-line drawings in tremor assessment
- Combination of edge enhancement and cold diffusion model for low dose CT image denoising
- High-performance breast cancer diagnosis method using hybrid feature selection method
- A multimodal deep learning-based algorithm for specific fetal heart rate events detection