Clinical spectrum of COVID-19 patients and decreased serum level of miR-146a as a sign of inflammation
-
 ,
,

Abstract
Background
There is increasing evidence that inflammation is an important determinant in COVID-19 pathogenesis. Several studies describe cytokines and microRNAs as important regulators of immune and inflammatory responses in other diseases, regarding them as valuable biomarkers.
Aim
Identify a potential relationship between cytokines (interleukin [IL]-6, IL-8) and microRNAs (miR-146a-5p, miR-155-5p) and clinical characteristics of COVID-19 patients, focusing on disease severity and mortality risk.
Methods
Serum expression levels of miR-146a, miR-155, IL-6, IL-8, C-reactive protein, ferritin, and neutrophil-to-lymphocyte ratio, of 25 mild, 73 moderate, and 39 severe COVID-19 patients from Quito-Ecuador, were determined to correlate outcomes with clinical parameters.
Results
In all groups, overweight and obesity were the most prevalent comorbidities (75.91%). Serum levels of IL-6 were significantly elevated in patients with moderate and severe COVID-19 (analysis of variance [ANOVA] p ≤ 0.000). miR-146a was significantly decreased in moderate and severe COVID-19 patients when compared with mild cases (ANOVA p = 0.002). ROC curve analysis showed that selected cut-off values for miR-146a > 3.999 ΔCt for mild vs moderate condition (sensitivity 83.56%, specificity 48%) and miR-146a > 3.999 ΔCt for mild vs severe condition (sensitivity 84.62%, specificity 40%), and IL-6 ≥ 72.25 pg/mL (sensitivity 78.95%, specificity 60.61%) when combined with clinical pretest probability, can be used to predict aggravation and death in COVID-19 patients. Odds ratios (ORs) of miR-146a (OR = 4.322) and IL-6 (OR = 3.198) indicate an increased risk of worsening and death, respectively, when cut-off points were taken into consideration.
Conclusion
This study shows that elevated inflammatory IL-6 and decreased serum levels of anti-inflammatory miR-146a-5p can be discriminatory markers of COVID-19 severity and mortality.
Introduction
Infected individuals with SARS-CoV-2 display a variety of symptoms and clinical severity depending on their age, comorbidities, and genetics [1,2,3]. Moreover, its evolution and outcome are based on the immunological response of the subject [4]. In severe COVID-19 cases, acute respiratory distress syndrome (ARDS) is the most severe form of lung impairment. Consequently, numerous key biomarkers have been studied and connected to the primary causes of multi-organ failure in severe COVID-19 cases, including immune-mediated vascular injury (vasculitis) and cytokine-mediated coagulation abnormalities [5]. The inflammatory cytokine storm secretion described in ARDS can lead to multiple organ failure [6]. Previous research has demonstrated that individuals with respiratory dysfunction had higher levels of interleukin (IL)-6, suggesting a potential common mechanism of inflammatory cytokine-mediated lung damage in COVID-19 patients [7]. There is increasing evidence that the severity of COVID-19 infection is directly correlated with high circulating IL-6 levels [8,9,10]. Additionally, some reports have described elevated serum concentrations of IL-6 in non-survivors of COVID-19 patients [11,12,13]. Certainly, immune-mediated inflammation plays an important role in the pathogenesis of COVID-19; for that reason, new laboratory biomarkers such as microRNAs could be useful to guide treatment and prognosis.
Non-coding RNAs called microRNAs perform crucial functions in regulating the expression of genes, which have been suggested to be valuable biomarkers in various pathological conditions, including viral infections [14,15,16]. Two microRNAs, miR-146a and miR-155, are important regulators of inflammatory processes [17,18].
It is described that miR-146a is an NF-κB-dependent gene. By a negative feedback regulatory loop involving the down-regulation of the IL-1 receptor and tumor necrosis factor (TNF) receptor, miR-146 regulates Toll-like receptors and cytokine inflammatory signaling [19]. Additionally, miR-155 has been described as a key negative regulator of innate immune responses in respiratory diseases since it directly targets IL-13 receptor alpha1 (IL-13Rα1), involved in the regulation of the M1/M2 equilibrium in macrophages by the modulation of the IL-13 effects [20,21].
In the current study, we determined the levels of anti-inflammatory miR-146a-5p and miR-155-5p in the serum of mild, moderate, and severe COVID-19 patients from Quito-Ecuador. We associated the levels of these microRNAs with clinical parameters, serum-related COVID-19 mediators, and biomarkers such as IL-6, IL-8, neutrophil-to-lymphocyte ratio (NLR), ferritin, and C-reactive protein.
Materials and methods
Study design
Anonymized secondary data from medical records from two state hospitals from Quito-Ecuador – Pablo Arturo Suarez Hospital and Calderon General Teaching Hospital – were considered in this cross-sectional, analytical, observational study between April 25, 2021, and July 29, 2022.
Population and sample size
We randomly selected 137 patients with symptoms of pneumonia of unknown cause from general wards and intensive care units from two hospitals in Quito city. To be eligible for participation in the research, patients must be adults and have a diagnosis of COVID-19 based on WHO interim guidelines: have a COVID-19 status verified by real-time polymerase chain reaction, chest computerized tomography (CT), and complete panel of routine laboratory tests, including blood count, biochemical parameters, coagulation tests, and urinalysis. Patients who did not meet the above inclusion criteria were excluded from the study. Based on sequential organ failure assessment (SOFA), PaO2/FiO2, and CO-RADS (tomographic severity scores), patients were categorized as mild (n = 25), moderate (n = 73), and severe (n = 39) COVID-19 cases. Each organ system was assigned a value ranging from 0 (normal) to 4 (very abnormal), with a minimum SOFA score of 0 and a maximum score of 24. According to the Berlin ARDS consensus, the PaO2/FiO2 score is mild if it is less than 300, moderate if it is less than 200, and severe if it is less than 100. CO-RADS was used to assess the suspicion of pulmonary involvement by COVID-19 on a scale from 1 (very low) to 5 (very high).
Data collection
Demographic variables (age and sex), clinical data (weight, height, blood pressure, temperature, heart rate, oxygen saturation, glucose, haemogram, C-reactive protein, ferritin, D-dimer, lipid, renal and hepatic profile), and clinical scales, such as the SOFA and the acute physiology and chronic health evaluation II were collected from electronic clinical records.
Blood samples taken from patients upon hospital admission and during the diagnosis of SARS-CoV-2 were analyzed to determine levels of ILs (IL-6, IL-8) and miR-146a, miR-155 expression. It is important to mention that the miR-146a analyzed in our study was the anti-inflammatory isomer miR-146a-5p. The samples were processed and analyzed at the Research Institute of Biomedicine at Central University of Ecuador. Samples were centrifuged at 3,500 rpm for 15 min to separate the serum. The serum was then aliquoted into 1.5 mL microtubes and stored at −80°C until processing. Photometry (Humalyzer 4000, Human Diagnostics Worldwide) was used to assess the levels of high-density lipoprotein, low-density lipoprotein, cholesterol, and triglycerides.
Serum inflammatory biomarkers
Immunological tests for IL-6 and IL-8 levels were performed to determine IL-6 and IL-8 serum levels. Pre-assembled standard kits (DIAsource; KAP1261; Belgium, and R&D Systems Inc.; D8000C; USA) were used for IL-6 and IL-8 quantifications, respectively. The minimum detection values for IL-6 and IL-8 were 0 pg/mL. According to the manufacturer’s recommendations, data were analyzed using the Multiskan Sky Spectrophotometer and the software SKanIt version 5.0.
Quantification of microRNAs by real-time PCR
Total RNA from serum was extracted using the Nucleic Acid Extraction Kit (Magnetic Bead Method) (Zybio, China) following the manufacturer’s instructions. Briefly, 15 μL of proteinase K and 200 μL of each sample were pipetted into each well. This kit works with a semi-automatic instrument that includes a magnetic separator that allows the movement of the extracted RNA from well to well. The magnetic beads present in the plate of the kit have specific polymeric groups capable of absorbing nucleic acids. Residual impurities were removed by the washing buffer included on the plate. The RNA was separated from the magnetic beads by changing the liquid phase conditions using 50 μL of elution buffer. Before the nucleic acid extraction procedure, a synthetic non-human (C. elegans) miRNA cel-miR-39, MiRNA Mimic (MSY000010), was added to the samples to account for differences in RNA isolation. NanoDrop One (Thermo Fisher Scientific) was used to evaluate the concentration and purity of each RNA sample. To determine the expression of miR-146a and miR-155, the TaqMan MicroRNA Reverse Transcription kit (Applied Biosystems, USA) was used with specific steam-looped primers to synthesize cDNA. The master mix used contained 3.30 U/μL of MultiScribe Reverse Transcriptase, 0.25 U/μL de RNase Inhibitor, 0.25 nM of each dNTPs, 1× RT buffer, 50 nM of individual miR RT Primer, and 2 ng/μL of RNA. In a conventional thermal cycler (GenAmp PCR System 2700, Applied Biosystems), retrotranscription was performed at 16°C for 30 min, 42°C for 30 min, and 85°C for 5 min. qPCR was performed in a QuantStudio 5 Real-Time PCR System (Applied Biosystems) using TaqMan Universal PCR Master Mix kit (Thermo Fisher Scientific, USA). The final volume used was 20 μL, with 0.5× Primer/Probe (hsa-miR-146a-5p, hsa-miR-155-5p, cel-miR-39) (Table S1) and 0.5× TaqMan Master Mix No UNG, and 5 μL of cDNA. The qPCR conditions were 2 min at 50°C, 10 min at 95°C, followed by 40 cycles of 15 s at 95°C, and 1 min at 60°C.
Statistical analysis
The Kolmogorov–Smirnov test was used to confirm the normality of the data. The chi-square test was used to compare the categorical variables between the three COVID-19 groups. One-way analysis of variance (ANOVA) with Gabriel’s post hoc test for normally distributed data or Kruskal–Wallis with Dunn’s post hoc test for non-normally distributed data were used to compare continuous variables.
ROC curve analysis was performed to assess the potential use of microRNAs and ILs as severity indicators and also to determine cut-off points using the Youden index for the measured variables, complemented with the calculated area under the ROC curve (AUC) as a quantitative measure of the discrimination power of markers between two groups. At the multivariate level, the Wald method of regression of the forward logistic procedure was used to determine the predictors of severity in COVID-19 patients using variables that were statistically associated with the bivariate analysis. Statistical significance was established for a value of p < 0.05. Odds ratios (ORs) greater than one were used to indicate that the outcome was more likely to occur in one group. All statistical analyses were performed using SPSS software v25 (IBM), and GraphPad Prism (version 5.02) software was used for figures.
-
Ethical approval: The research related to human use has been complied with all the relevant national regulations, institutional policies and in accordance with the tenets of the Helsinki Declaration and has been approved by the authors’ institutional review board or equivalent committee. This study was approved by the Expedited Committee of the Ministry of Health (Agreement 00003-2020 and 00104-2020) and subsequently renewed by the Human Research Ethics Committee of the Central University of Ecuador (approval number 091-020, April 25, 2021).
-
Informed consent: Informed consent has been obtained from all individuals included in this study.
Results
A total of 137 COVID-19 patients were studied. Table 1 shows the demographic and clinical characteristics of mild, moderate, and severe COVID-19 groups. The mean age was 53.78 years (18–94 years). Age and gender did not significantly differ across the groups (ANOVA, p = 0.7). The most prevalent comorbidities across all categories were overweight and obesity, which occurred in 87.20% of severe COVID-19 patients and in 75.91% of cases overall. Temperature showed significant differences between mild and moderate, as well as between mild and severe COVID-19 (36.36°C ± 0.51 vs 36.63 ± 0.53; p = 0.011); (36.36°C ± 0.51 vs 36.65°C ± 0.68; p = 0.021). Respiratory rate exhibited significant differences between moderate and severe COVID-19 patients (22.22 ± 3.53 vs 25.62 ± 5.91; p = 0.001). Triglycerides showed significant differences between mild and severe patients (216.25 ± 55.05 vs 336.54 ± 166.44; p = 0.004). Oxygen saturation, alanine transaminase (ALT), and blood urea nitrogen (BUN) exhibited a significant difference when comparing the three groups (ANOVA p = 0.005, p = 0.029, and p = 0.021) (Table 1).
Clinical characteristics of mild, moderate, and severe COVID-19 groups
| Mild COVID-19 n = 25 | Moderate COVID-19 n = 73 | Severe COVID-19 n = 39 | p-value | |
|---|---|---|---|---|
| Female, n (%) | 9 (36.00) | 23 (31.50) | 12 (30.80) | 0.897 |
| Male, n (%) | 16 (64.00) | 50 (68.50) | 27 (69.20) | |
| Age (years), x ± SD | 52.88 ± 13.73 | 52.37 ± 13.01 | 54.54 ± 12.49 | 0.700 |
| BMI (kg/m2), x ± SD | 27.09 ± 4.17 | 29.25 ± 4.93 | 29.52 ± 5.98 | 0.191 |
| Overweight/obesity, n (%) | 13 (68.4) | 57 (83.80) | 34 (87.20) | 0.507 |
| Temperature (°C) | 36.36 ± 0.51 | 36.63 ± 0.53 | 36.65 ± 0.68 | 0.028 Mild/moderate p = 0.011 Mild/severe p = 0.021 |
| Blood pressure (mmHg), mean Dias/Sys | 119.48/71.16 | 123.03/72.69 | 126.31/73.28 | 0.500 |
| Respiratory rate, x ± SD | 24.60 ± 7.64 | 22.22 ± 3.53 | 25.62 ± 5.91 | 0.005 Moderate/severe p = 0.001 |
| Oxygen saturation (%), x ± SD | 90.28 ± 6.82 | 89.92 ± 9.24 | 87.31 ± 9.43 | 0.005 Mild/severe p = 0.002 Moderate/severe p = 0.009 |
| Glucose (mg/dL), x ± SD | 148.44 ± 108.6 | 144.92 ± 149.85 | 162.64 ± 90.84 | 0.051 |
| Cholesterol, x ± SD (mg/dL) | 166.71 ± 37.82 | 182.56 ± 56.45 | 196.90 ± 74.10 | 0.012 Mild/severe p = 0.004 |
| Triglycerides (mg/dL), x ± SD | 216.25 ± 55.05 | 274.48 ± 135.18 | 336.54 ± 166.44 | 0.012 Mild/severe p = 0.004 |
| HDL (mg/dL), x ± SD | 38.43 ± 17.21 | 30.96 ± 13.78 | 40.67 ± 26.91 | 0.072 |
| LDL (mg/dL), x ± SD | 85.03 ± 35.92 | 96.82 ± 54.66 | 96.76 ± 70.40 | 0.657 |
| Urea, x ± SD | 44.75 ± 23.58 | 40.32 ± 35.97 | 67.62 ± 30.27 | 0.110 |
| ALT, x ± SD | 42.79 ± 26.77 | 56.72 ± 34.22 | 73.53 ± 36.19 | 0.029 Mild/severe p = 0.008 |
| AST, x ± SD | 37.82 ± 16.23 | 50.55 ± 28.15 | 53.27 ± 29.63 | 0.202 |
| Creatinine, x ± SD | 0.93 ± 0.50 | 1.14 ± 1.05 | 1.01 ± 0.43 | 0.235 |
| BUN, x ± SD | 20.40 ± 10.72 | 21.58 ± 15.41 | 33.24 ± 14.26 | 0.021 Mild/severe p = 0.019 Moderate/severe p = 0.008 |
BMI: body mass index, HDL: high-density lipoprotein, LDL: low-density lipoprotein, ALT: alanine transaminase, AST: aspartate aminotransferase, BUN: blood urea nitrogen, n (%): the number (percentage) of patients who had the data of the respective test, x ± SD: mean and standard deviation. A chi-square test was performed for categorical variables (sex, BMI). ANOVA/Gabriel test or Kruskal–Wallis/Dunn tests were performed for continuous variables. Bold values denote a statistically significant result between the groups at p < 0.05 level.
Regarding hematological parameters, it was observed a significant difference in lymphocytes %, neutrophil %, and NLR when comparing the three groups (ANOVA p ≤ 0.000). Red blood cell count, monocytes %, basophils %, and median platelet volume (MPV) showed significant difference only when comparing two groups (ANOVA p = 0,050, p = 0,006, p = 0.016, and p = 0.016, respectively) (Table 2).
Haematologic parameters in mild, moderate, and severe COVID-19 groups
| Mild COVID-19 (mean ± SD) | Moderate COVID-19 (mean ± SD) | Severe COVID-19 (mean ± SD) | p-value | |
|---|---|---|---|---|
| Red blood cell count (M/μL) | 5.20 ± 0.86 | 4.78 ± 0.73 | 4.81 ± 0.75 | 0.050 Mild/moderate p = 0.042 |
| Haematocrit (%) | 62.72 ± 80.64 | 43.08 ± 6.94 | 44.36 ± 5.84 | 0.063 |
| Haemoglobin (gr/dL) | 15.22 ± 2.40 | 14.09 ± 2.35 | 14.64 ± 1.98 | 0.087 |
| Lymphocytes (%) | 17.23 ± 9.56 | 11.44 ± 7.39 | 8.21 ± 4.80 | <0.000 Mild/moderate p = 0.005 Mild/severe p = 0.000017 Moderate/severe p = 0.023 |
| Monocytes (%) | 5.49 ± 2.79 | 4.34 ± 2.50 | 3.37 ± 1.88 | 0.006 Mild/severe p = 0.001 |
| Neutrophils (%) | 76.44 ± 11.48 | 81.96 ± 12.62 | 87.20 ± 5.75 | <0.000 Mild/moderate p = 0.010 Mild/severe p = 0.000095 Moderate/severe p = 0.040 |
| NLR | 6.46 ± 4.41 | 11.74 ± 10.16 | 15.72 ± 11.67 | <0.000 Mild/moderate p = 0.008 Mild/severe p = 0.00018 Moderate/severe p = 0.039 |
| Eosinophils (%) | 0.41 ± 0.81 | 0.85 ± 2.13 | 0.24 ± 0.37 | 0.962 |
| Basophils (%) | 0.34 ± 0.17 | 0.54 ± 0.88 | 0.54 ± 0.31 | 0.016 Mild/moderate p = 0.013 Mild/severe p = 0.012 |
| MPV (fl) | 7.89 ± 1.79 | 8.74 ± 1.84 | 8.97 ± 1.68 | 0.016 Mild/moderate p = 0.023 Mild/severe p = 0.005 |
SD: standard deviation, NLR: neutrophil-lymphocyte ratio, MPV: median platelet volume. ANOVA/Gabriel test or Kruskal–Wallis/Dunn tests were performed for continuous variables. Bold values denote statistically significant results between the groups at p < 0.05 level.
The serum markers IgG (positive index) and IL-6 showed a significant increase in severe patients when comparing the three groups (ANOVA p = 0.008 and p ≤ 0.000, respectively). Delta Ct of miR-146a showed a significant increase in severe COVID-19 patients when comparing mild-to-moderate and severe patients (ANOVA p = 0.037). IL-8, D-dimer, ferritin, and C-reactive protein did not show significant differences (Table 3). miR-155 was not significantly different; nevertheless, a correlation between the serum levels of both microRNAs (R = 0.415; p < 0.001) was observed.
Biomarkers in mild, moderate, and severe COVID-19 groups
| Mild COVID-19 (mean ± SD) | Moderate COVID-19 (mean ± SD) | Severe COVID-19 (mean ± SD) | p-value | |
|---|---|---|---|---|
| IgG positive index | 5.06 ± 4.00 | 8.48 ± 4.94 | 8.81 ± 5.66 | 0.008 Mild/moderate p = 0.004 Mild/severe p = 0.005 |
| IL-6 (pg/mL) | 58.34 ± 71.96 | 105.65 ± 112.15 | 235.66 ± 351.25 | <0.000 Mild/moderate p = 0.025 Mild/severe p = 0.00005 Moderate/severe p = 0.010 |
| IL-8 (pg/mL) | 65.40 ± 129.57 | 87.80 ± 163.19 | 218.96 ± 598.04 | 0.189 |
| miR-146a (ΔCt) | 4.61 ± 2.43 | 5.85 ± 2.17 | 5.83 ± 1.90 | 0.037 Mild/moderate p = 0.042 Mild/severe p = 0.083 |
| miR-155 (ΔCt) | 5.59 ± 2.44 | 5.84 ± 3.09 | 4.87 ± 3.44 | 0.283 |
| D-dimer (mg/mL) | 460.7 ± 623.3 | 3099.5 ± 3646.8 | 1465.3 ± 1636.4 | 0.173 |
| Ferritin (ng/mL) | 1128.70 ± 978.43 | 1664.8 ± 2238.6 | 1069.3 ± 602.8 | 0.413 |
| C-reactive protein (mg/dL) | 19.67 ± 12.18 | 18.16 ± 12.86 | 24.10 ± 9.27 | 0.063 |
SD: standard deviation, IgG: Immunoglobulin G, IL: Interleukin, miR: microRNA, ΔCt: delta Ct. ANOVA/Gabriel test or Kruskal–Wallis/Dunn tests were performed for continuous variables. Bold values denote a statistically significant result between the groups at p < 0.05 level.
Figure 1 illustrates the serum expression of tested miR-146a vs the reference microRNA syn-cel-miR-39 expressed in fold change. Serum expression of miRN-146a was significantly decreased in moderate and severe COVID-19 patients when compared to mild ones (p = 0.02 and p = 0.04) (Figure 1).
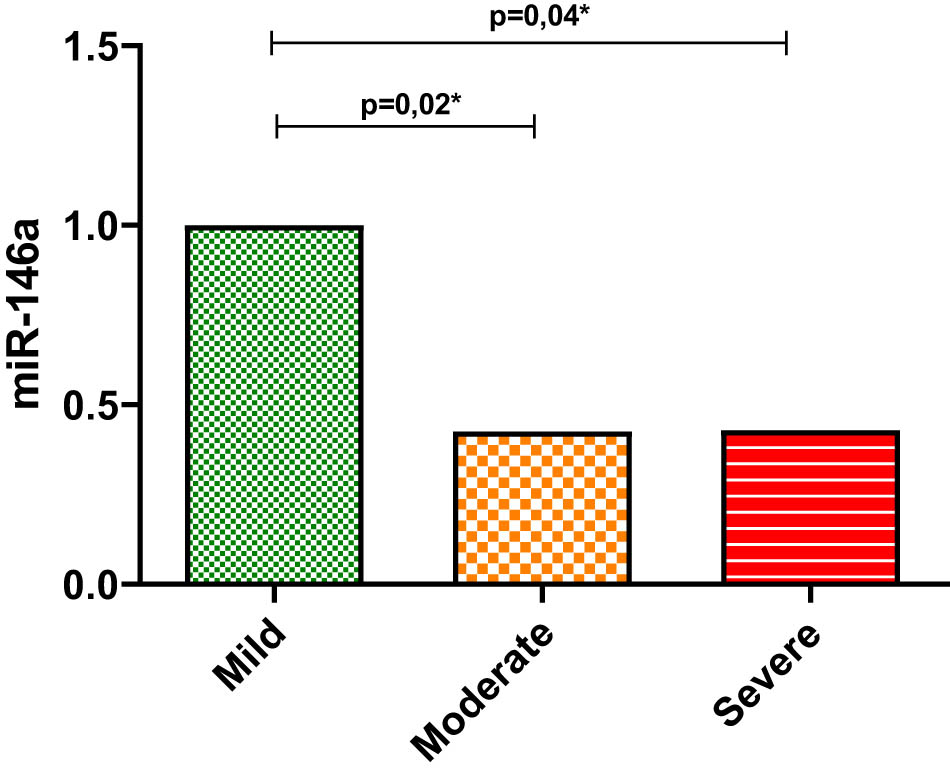
Expression levels of serum miR-146a in COVID-19 patients. Mean and standard deviation of the fold change values of miR-146a (reference microRNA syn-cel-miR-39) in the serum of mild COVID-19 patients compared to moderate and severe COVID-19 patients. Differences between groups were tested using the Kruskal–Wallis/Dunn test. Levels of significance were set at p < 0.05.
In addition, ROC curve analysis was used to examine if the biomolecular markers (IL-6 and miR-146a) that resulted significantly (p < 0.05) in the ANOVA analysis could be predictors of the severity outcome. The cut-off points that predicted severity were: IL-6 > 29.52 pg/mL for mild vs moderate condition (CI 0.531–0.777; sensitivity 73.97% and specificity 48%), IL-6 > 66.45 pg/mL for mild vs severe condition (CI 0.676–0.906; sensitivity 74.36% and specificity 76%), and IL-6 > 53.50 pg/mL for moderate vs severe condition (CI 0.55–0.76; sensitivity 76.92% and specificity 47.95%). Moreover, the statistically significant cut-off values for miR-146a > 3.999 ΔCt for mild vs moderate condition (CI 0.513–0.781; sensitivity 83.56% and specificity 48%) and miR-146a > 3.999 ΔCt for mild vs severe condition (CI 0.506–0.792; sensitivity 84.62% and specificity 40%) (Figure 2).

ROC curves showing the AUC and cut-off points for the different inflammatory biomarkers (IL-6, miR-146a) associated with COVID-19 severity. AUC: area under the curve, miR: microRNA, IL-6: interleukin-6.
Furthermore, ROC curve analysis was performed to determine if IL-6 could predict death in COVID-19 patients. Using the Youden Index, we defined the optimal cut-off point of IL-6 ≥ 72.25 pg/mL (CI 0.6703–0.8343; sensitivity 78.95% and specificity 60.61%) (Figure 3).

ROC curve showing the AUC and cut-off points for inflammatory biomarker IL-6 associated with survival of patients with COVID-19. AUC: area under the curve, IL-6: interleukin-6.
Univariate and multivariate logistic analyses were used to determine the relationship between cut-off points of these inflammatory biomarkers and death due to COVID-19. Univariate analysis showed that miR-146a (OR = 2.190, p = 0.016) suggested an increased risk of disease aggravation, while biomarker IL-6 (OR = 7.385, p = 0.000) connoted an increased risk of mortality, when cut-off points were taken into consideration. Additionally, multivariate analysis showed that miR-146a indicated an increased risk of worsening when cut-off points are taken into consideration (OR = 4.322, p = 0.015) (Table 4).
Univariate and multivariate logistic regression of COVID-19 severity based on biomarker miR-146a ΔCt, and death based on biomarker IL-6
| Univariate | Multivariate | |||||||||
|---|---|---|---|---|---|---|---|---|---|---|
| B | p-value | OR | OR 95% CI | B | p-value | OR | OR 95% CI | |||
| Ll | Hl | LI | HI | |||||||
| miR-146a ΔCt > 3.999 | 0.784 | 0.016 | 2.190 | 1.157 | 4.144 | 1.464 | 0.015 | 4.322 | 1.335 | 13.991 |
| IL-6 > 72.25 pg/mL | 0.199 | 0.000 | 7.385 | 2.599 | 20.986 | |||||
IL-6: interleukin-6, miR: microRNA, B: beta coefficient, OR: odds ratio, LI: lower limit, HI: upper limit.
Discussion
Our study aimed to determine the expression patterns of microRNAs (hsa-miR-146a-5p and hsa-miR-155-5p) and inflammatory markers, including complete blood count, C-reactive protein, and cytokines (IL-6, IL-8) in the serum of patients with mild, moderate, and severe COVID-19 to be able to identify new potential biomarkers for disease monitoring and progression.
Numerous studies, including our own, demonstrated that the severity of COVID-19 is positively correlated with the percentage of neutrophils, NLR, percentage basophils, MPV cholesterol, triglycerides, ALT, BUN, and IgG positive index. Besides, showing a decrease in the percentage of lymphocytes and monocytes [22,23,24,25] as severity of exacerbates.
The response of the host to SARS-CoV-2 infection is known to have a substantial impact on individual clinical outcomes. It is widely recognized that elevated levels of cytokines, including IL-6, IL-8, and TNF, together with immune cell infiltration in affected organs and lymphopenia, aggravate COVID-19 due to hyper-inflammatory reactions [26]. Patients with comorbidities such as overweight, obesity, diabetes, and cardiovascular disorders are at a higher risk of developing a severe COVID-19 condition due to the inflammatory processes already ongoing as a result of their coexisting conditions [27,28]. Among the groups analyzed in the present study, the most common comorbidities were overweight and obesity, accounting for 75.91% of cases, and more frequently observed in severe COVID-19 patients.
One important hallmark of SARS-CoV-2 infection is the immune dysregulation that can potentially initiate a cytokine storm, which causes the hyperactivation of immune cells within many organs, including the lungs, heart, and brain. Leading to the alteration of physiological indicators, including microRNAs, which control the expression of genes by translation regulation [29]. Multiple investigations have demonstrated the critical function of microRNAs in regulating a range of biological processes, including cell division, inflammation, apoptosis, and the immune response to viral infection [30,31]. MicroRNAs are therefore informative biomarkers that control the inflammatory process and interact with cytokines generated in COVID-19, making them an important indicator of the severity of the disease [32]. SARS-CoV-2 infection triggers a cascade of intracellular signaling resulting in the induction of transcription of proinflammatory cytokines, including IL-1, IL-6, TNF-α, and IFN-γ through the modulation of the Toll-like signaling [33]. At the same time, to prevent an excessive immune response during the activation of the immune system, the production of microRNAs is stimulated [30]. For instance, miR-146a acts as a negative feedback regulator, attenuating the NF-κB signaling by the downregulation of its target genes: IL-1 receptor-associated kinase 1 and the TNF receptor-associated factor 6 [34], which suppresses the production of pro-inflammatory cytokines [35]. Thus, an alteration of this fine-tuning mechanism can provoke a cytokine storm by an exacerbated inflammatory response triggered by the uncontrolled production of pro-inflammatory cytokines [30].
The findings of the present investigation align with those of prior research, showing that a decreased expression of serum miR-146a is associated with an increased risk of disease aggravation [17,18,36] when comparing mild vs moderate groups (p = 0.02) and mild vs severe groups (p = 0.04) of COVID-19 patients. The sensitivity and specificity values of miR-146a at ≥35.47 CT cut-off point represent a correlation with the grade of clinical status; therefore, those values could be useful complementary data to make patient evaluation. The interpretation of those values to assess the severity of patients should be integrated with the context of other biomarkers of inflammation, so that the low specificity cannot be considered as a predictor of excess severe cases. The miRNA-146a cut-off value must be integrated with the pretest probability of clinical or epidemiological severity (prevalence). Therefore, the positive and negative probability index can be calculated, and the entity’s post-test diagnostic and exclusion probability or degree of severity may be established. In future research, this biomarker can produce variable interactions that could statistically improve the level of discernment or enable the creation of diagnostic or prognostic scores.
Reduced expression of anti-inflammatory miR-146a-5p in severe patients is therefore associated with increased production of IL-6, which has been observed in critically ill COVID-19 patients, where IL-6 functions as an essential signaling amplifier [36]. For instance, a study by Vélez-Páez et al. proposes IL-6 as a biomolecular marker that exhibits good discriminating power to differentiate between survivors and non-survivors patients with severe COVID-19, with a cut-off value for IL-6 of ≥11 pg/mL (p = 0.005). Presumably, the low IL-6 cut-off point shown in this study is related to the idiosyncratic and genetic factors of the subgroups of critical patients considered, as well as the requirement of invasive mechanical ventilation. Thus, requiring lower levels of IL-6 to trigger a dysregulated and severe clinical response. Additionally, IL-6 was found to predict mortality with an OR of 17.07, considering the cut-off value [37]. Similar to other studies, we identified this inflammatory marker as an important predictor of mortality. Our results evidenced a significant increase in IL-6 serum levels among the three groups of COVID-19 patients (mild, moderate, and severe) (ANOVA p = 0.0002). Demonstrating that the downregulation of anti-inflammatory miR-146a-5p may contribute to the severity of COVID-19 as a result of the induction of excessive cytokine production, along with a deficiency in the feedback mechanism that controls inflammatory damage in tissues [38].
In our study, the expression level of miR-155 was not significantly higher in moderate and severe COVID-19 patients, contrary to other research findings [17,18]. However, we did find a positive correlation between the blood levels of miR-155 and miR-146a. Furthermore, this study employed ROC curve analysis to determine the cut-off point of IL-6 associated with the survival of patients with COVID-19. The chosen thresholds (≥72.25 pg/mL, p = 0.000) showed a strong potential to differentiate between survivors and non-survivors, with an OR of 7.385.
Despite not finding a significant difference in our study, we did see a clear rising trend for D-dimer, which has been considered a predictive factor in COVID-19. This also holds for the inflammatory markers C-reactive protein and IL-8. The small sample size and high degree of variability may have been contributing factors.
Conclusion
The identification of biomarkers for mortality prediction is a crucial resource for physicians seeking early diagnosis and suitable treatments. Increased inflammatory IL-6 levels and decreased serum anti-inflammatory miR-146a-5p expression can be discriminating biomarkers of COVID-19 severity. Since microRNAs play a crucial role in controlling the innate immune response to viral infection, our findings offer significant new insights into the pathogenesis of COVID-19.
Limitations
In this study, the sample size analyzed was the major limitation, interfering in the establishment of highly accurate models of prediction. Moreover, this study did not include healthy controls to establish a threshold for microRNA levels and did not consider the effect of pharmacological modulation on the activity and function of microRNAs. For future investigations, these factors, along with the analysis of other types of samples that could be obtained in a less invasive way, such as saliva, urine, or sputum, should be considered.
Besides, due to the COVID-19 pandemic, the data used in this study were limited, and only the available information in the database of the public hospitals part of the study was included.
Acknowledgments
The authors would like to thank the Central University of Ecuador for covering the publication fee of this manuscript.
-
Funding information: The Central University of Ecuador contributed to the publication fee.
-
Author contributions: Lucy Baldeón Rojas: conceptualization, data curation, formal analysis, and writing the original manuscript. Jorge Pérez-Galarza: conceptualization, data curation, formal analysis, and writing the original manuscript. Valeria Alulema: data analysis, writing the manuscript draft. Yosselin Vicuña-Almeida: reviewing and editing the manuscript. Marco Salinas-Pinta: data analysis, writing the manuscript draft. Cristina Cañadas Herrera: writing, reviewing, and editing the manuscript. Jorge Luis Vélez-Paez: writing, reviewing, and editing the manuscript draft. Brenda Ruiz Borja: data collection and editing of the manuscript. César Prócel Ramírez: problem statement, writing, and editing the manuscript. Juan Heredia: data collection and writing the manuscript draft. Diego Barahona: data collection and writing of the manuscript. Fernando Sempértegui Ontaneda: data analysis and editing of the final version of the manuscript.
-
Conflict of interest: The authors state no conflicts of interest.
-
Data availability statement: The datasets generated during and/or analyzed during the current study are available from the corresponding author (C.C.H.) on reasonable request.
References
[1] Choudhri Y, Maslove DM, Rauh MJ. COVID-19 and the genetics of inflammation. Crit Care Med. 2023;51(6):817–25.10.1097/CCM.0000000000005843Search in Google Scholar PubMed PubMed Central
[2] Bakhshandeh B, Sorboni SG, Javanmard AR, Mottaghi SS, Mehrabi MR, Sorouri F, et al. Variants in ACE2; potential influences on virus infection and COVID-19 severity. Infect Genet Evol. 2021;90:104773.10.1016/j.meegid.2021.104773Search in Google Scholar PubMed PubMed Central
[3] Vabret N, Britton GJ, Gruber C, Hegde S, Kim J, Kuksin M, et al. Immunology of COVID-19: current state of the science. Immunity. Vol. 52, United States of America: Cell Press; 2020. p. 910–41.Search in Google Scholar
[4] Li Q, Wang Y, Sun Q, Knopf J, Herrmann M, Lin L, et al. Immune response in COVID-19: what is next? Cell Death Differ. 2022;29:1107–22.10.1038/s41418-022-01015-xSearch in Google Scholar PubMed PubMed Central
[5] Keykavousi K, Nourbakhsh F, Abdollahpour N, Fazeli F, Sedaghat A, Soheili V, et al. A review of routine laboratory biomarkers for the detection of severe COVID-19 disease. Int J Anal Chem. 2022;2022(1):9006487.10.1155/2022/9006487Search in Google Scholar PubMed PubMed Central
[6] Zanza C, Romenskaya T, Manetti AC, Franceschi F, La Russa R, Bertozzi G, et al. Cytokine storm in COVID-19: Immunopathogenesis and therapy. Medicina (B Aires). 2022;58(2):144.10.3390/medicina58020144Search in Google Scholar PubMed PubMed Central
[7] Basheer M, Saad E, Kananeh M, Asad L, Khayat O, Badarne A, et al. Cytokine patterns in COVID-19 patients: Which cytokines predict mortality and which protect against? Curr Issues Mol Biol. 2022;44(10):4735–47.10.3390/cimb44100323Search in Google Scholar PubMed PubMed Central
[8] Coomes EA, Haghbayan H. Interleukin‐6 in Covid‐19: A systematic review and meta‐analysis. Rev Med Virol. 2020;30(6):1–9.10.1002/rmv.2141Search in Google Scholar PubMed PubMed Central
[9] Mulchandani R, Lyngdoh T, Kakkar AK. Deciphering the COVID‐19 cytokine storm: Systematic review and meta‐analysis. Eur J Clin Invest. 2021;51(1):e13429.10.1111/eci.13429Search in Google Scholar PubMed PubMed Central
[10] Ulhaq ZS, Soraya GV. Interleukin-6 as a potential biomarker of COVID-19 progression. Med Mal Infect. 2020;50(4):382–3.10.1016/j.medmal.2020.04.002Search in Google Scholar PubMed PubMed Central
[11] Potere N, Batticciotto A, Vecchié A, Porreca E, Cappelli A, Abbate A, et al. The role of IL-6 and IL-6 blockade in COVID-19. Expert Rev Clin Immunol. 2021;17(6):601–18.10.1080/1744666X.2021.1919086Search in Google Scholar PubMed
[12] Nagant C, Ponthieux F, Smet J, Dauby N, Doyen V, Besse-Hammer T, et al. A score combining early detection of cytokines accurately predicts COVID-19 severity and intensive care unit transfer. Int J Infect Dis. 2020;101:342–5.10.1016/j.ijid.2020.10.003Search in Google Scholar PubMed PubMed Central
[13] Matsushima K, Yang D, Oppenheim JJ. Interleukin-8: An evolving chemokine. Cytokine. 2022;153:155828.10.1016/j.cyto.2022.155828Search in Google Scholar PubMed
[14] Jadideslam G, Ansarin K, Sakhinia E, Alipour S, Pouremamali F, Khabbazi A. The MicroRNA-326: Autoimmune diseases, diagnostic biomarker, and therapeutic target. J Cell Physiol. 2018;233(12):9209–22.10.1002/jcp.26949Search in Google Scholar PubMed
[15] Ambros V. The functions of animal microRNAs. Nature. 2004;431:350–5.10.1038/nature02871Search in Google Scholar PubMed
[16] Barbu MG, Condrat CE, Thompson DC, Bugnar OL, Cretoiu D, Toader OD, et al. MicroRNA involvement in signaling pathways during viral infection. Front Cell Dev Biol. 2020;8:143.10.3389/fcell.2020.00143Search in Google Scholar PubMed PubMed Central
[17] Fernández-Pato A, Virseda-Berdices A, Resino S, Ryan P, Martínez-González O, Pérez-García F, et al. Plasma miRNA profile at COVID-19 onset predicts severity status and mortality. Emerg Microbes Infect. 2022;11(1):676–88.10.1080/22221751.2022.2038021Search in Google Scholar PubMed PubMed Central
[18] Donyavi T, Bokharaei-Salim F, Baghi HB, Khanaliha K, Janat-Makan MA, Karimi B, et al. Acute and post-acute phase of COVID-19: Analyzing expression patterns of miRNA-29a-3p, 146a-3p, 155-5p, and let-7b-3p in PBMC. Int Immunopharmacol. 2021;97:107641.10.1016/j.intimp.2021.107641Search in Google Scholar PubMed PubMed Central
[19] Taganov KD, Boldin MP, Chang KJ, Baltimore D. NF-kappaB-dependent induction of microRNA miR-146, an inhibitor targeted to signaling proteins of innate immune responses. Proc Natl Acad Sci U S A. 2006;103(33):12481–6.10.1073/pnas.0605298103Search in Google Scholar PubMed PubMed Central
[20] Bondanese VP. Identification of host miRNAs that may limit human rhinovirus replication. World J Biol Chem. 2014;5(4):437–56.10.4331/wjbc.v5.i4.437Search in Google Scholar PubMed PubMed Central
[21] Martinez-Nunez RT, Louafi F, Sanchez-Elsner T. The interleukin 13 (IL-13) pathway in human macrophages is modulated by microRNA-155 via direct targeting of interleukin 13 receptor α1 (IL13Rα1). J Biol Chem. 2011;286(3):1786–94.10.1074/jbc.M110.169367Search in Google Scholar PubMed PubMed Central
[22] Trofin F, Nastase E-V, Vâţă A, Iancu L, Luncă C, Buzilă E, et al. The immune, inflammatory and hematological response in COVID-19 patients, according to the severity of the disease. Microorganisms. 2023;11(2):319.10.3390/microorganisms11020319Search in Google Scholar PubMed PubMed Central
[23] Lamichhane A, Pokhrel S, Thapa TB, Shrestha O, Kadel A, Joshi G, et al. Associated biochemical and hematological markers in COVID-19 severity prediction. Adv Med. 2023;2023:6216528.10.1155/2023/6216528Search in Google Scholar PubMed PubMed Central
[24] Yan X, Chen G, Jin Z, Zhang Z, Zhang B, He J, et al. Anti‐SARS‐CoV‐2 IgG levels in relation to disease severity of COVID‐19. J Med Virol. 2022;94(1):380–3.10.1002/jmv.27274Search in Google Scholar PubMed PubMed Central
[25] Ok F, Erdogan O, Durmus E, Carkci S, Canik A. Predictive values of blood urea nitrogen/creatinine ratio and other routine blood parameters on disease severity and survival of COVID ‐ 19 patients. J Med Virol. 2021;93(2):786–93.10.1002/jmv.26300Search in Google Scholar PubMed PubMed Central
[26] Kessel C, Vollenberg R, Masjosthusmann K, Hinze C, Wittkowski H, Debaugnies F, et al. Discrimination of COVID-19 from inflammation-induced cytokine storm syndromes using disease-related blood biomarkers. Arthritis Rheumatol. 2021;73(10):1791–9.10.1002/art.41763Search in Google Scholar PubMed PubMed Central
[27] Bhaskar S, Sinha A, Banach M, Mittoo S, Weissert R, Kass JS, et al. Cytokine storm in COVID-19 – immunopathological mechanisms, clinical considerations, and therapeutic approaches: the REPROGRAM consortium position paper. Front Immunol. 2020;11:1648.10.3389/fimmu.2020.01648Search in Google Scholar PubMed PubMed Central
[28] Wang W, Zhao Z, Liu X, Liu G, Xie D, Xu Z, et al. Clinical features and potential risk factors for discerning the critical cases and predicting the outcome of patients with COVID-19. J Clin Lab Anal. 2020;34(10):1–8.10.1002/jcla.23547Search in Google Scholar PubMed PubMed Central
[29] Chiappetta S, Sharma AM, Bottino V, Stier C. COVID-19 and the role of chronic inflammation in patients with obesity. Int J Obes. 2020;44(8):1790–2.10.1038/s41366-020-0597-4Search in Google Scholar PubMed PubMed Central
[30] Gilyazova I, Asadullina D, Kagirova E, Sikka R, Mustafin A, Ivanova E, et al. MiRNA-146a—A key player in immunity and diseases. Int J Mol Sci. 2023;24(16):12767.10.3390/ijms241612767Search in Google Scholar PubMed PubMed Central
[31] Ergun S, Sankaranarayanan R, Petrovic N. Clinically informative microRNAs for SARS-CoV-2 infection. Epigenomics. 2023;15(13):705–16.10.2217/epi-2023-0179Search in Google Scholar PubMed PubMed Central
[32] Rasizadeh R, Aghbash PS, Nahand JS, Entezari-Maleki T, Baghi HB. SARS-CoV-2-associated organs failure and inflammation: a focus on the role of cellular and viral microRNAs. Virol J. 2023;20(1):1–22.10.1186/s12985-023-02152-6Search in Google Scholar PubMed PubMed Central
[33] Pérez-Galarza J, Prócel C, Cañadas C, Aguirre D, Pibaque R, Bedón R, et al. Immune response to SARS-CoV-2 infection in obesity and T2D: Literature review. Vaccines. 2021;9(2):1–20.10.3390/vaccines9020102Search in Google Scholar PubMed PubMed Central
[34] Saba R, Sorensen DL, Booth SA. MicroRNA-146a: a dominant, negative regulator of the innate immune response. Front Immunol. 2014;5:578.10.3389/fimmu.2014.00578Search in Google Scholar PubMed PubMed Central
[35] Jankovic M, Nikolic D, Novakovic I, Petrovic B, Lackovic M, Santric-milicevic M. miRNAs as a potential biomarker in the COVID-19 infection and complications course, severity, and outcome. Diagnostics. 2023;13(6):1091.10.3390/diagnostics13061091Search in Google Scholar PubMed PubMed Central
[36] Keikha R, Hashemi-Shahri SM, Jebali A. The miRNA neuroinflammatory biomarkers in COVID-19 patients with different severity of illness. Neurologia. 2023;38(6):e41–51.10.1016/j.nrl.2021.06.005Search in Google Scholar PubMed PubMed Central
[37] Vélez-Páez JL, Baldeón-Rojas L, Cañadas Herrera C, Montalvo MP, Jara FE, Aguayo-Moscoso S, et al. Receiver operating characteristic (ROC) to determine cut-off points of clinical and biomolecular markers to discriminate mortality in severe COVID-19 living at high altitude. BMC Pulm Med. 2023;23(1):1–10. 10.1186/s12890-023-02691-2.Search in Google Scholar PubMed PubMed Central
[38] Roganovi J. Downregulation of microRNA-146a in diabetes, obesity and hypertension may contribute to severe COVID-19. Med Hypotheses. 2021;146;110448.10.1016/j.mehy.2020.110448Search in Google Scholar PubMed PubMed Central
© 2025 the author(s), published by De Gruyter
This work is licensed under the Creative Commons Attribution 4.0 International License.
Articles in the same Issue
- Research Articles
- Anti-arthritic potential of crude sulfated polysaccharide from marine macroalgae Sargassum ilicifolium (Turner) C. Agardh: Regulation of cytokine cascade
- Bio-based hydrogel patches made of κ-carrageenan enriched with degalactosylated xyloglucan for wound dressing applications
- Clinical spectrum of COVID-19 patients and decreased serum level of miR-146a as a sign of inflammation
- Review Articles
- Quest for space: Tenacity of DNA, Protein, and Lipid macromolecules in intracellular crowded environment
- The impact of exercise on mitochondrial biogenesis in skeletal muscle: A systematic review and meta-analysis of randomized trials
- Communication
- Entropy and mechanistic concepts after intraovarian platelet-rich plasma: Experimental considerations for local tissue responses mediated by NF-κB and TNF-α