
The Strategic Adoption of Environmental Corporate Social Responsibility with Network Externalities
-
Mingqing Xing


Abstract
This paper adopts a green managerial delegation model in a polluting network industry wherein consumers form fulfilled rational expectations of network externalities. We show that firms are consistently incentivized to undertake ECSR (environmental corporate social responsibility) under price competition, while positive network externalities can increase the strategic level of ECSR. We also show that product substitutability between network products can play an important role in determining a firm’s strategic level of ECSR and resulting profits. Finally, ECSR is conducive to increasing environmental quality and social welfare in a high-polluting network industry. Therefore, the strategic adoption of ECSR in a network industry is Pareto-improving as environmental damage becomes serious.
1 Introduction
Environmental corporate social responsibility (ECSR) is growing in importance due to public pressure regarding environmental concerns about climate change. Many global corporations participate in greenhouse gas reduction programs and have issued ECSR statements and outlined related activities in their annual reports.[1] The strategic promotion of ECSR has become a top priority on the business agenda of many industries and international organizations. The encouragement of ECSR is also a key policy agenda in the USA and EU through best practice guidance and, where appropriate, intelligent regulations and fiscal incentives. For example, in 2019, the United Nations launched an environmental protection initiative called “Action for the Earth,” which was responded to by Microsoft, Sony, Ubisoft, Niantic, and other ICT companies. Microsoft recently announced its ECSR plan to share the social responsibility of protecting the environment with other companies and achieve carbon negative emissions by 2030. Specifically, Microsoft will allocate US $1 billion to establish the “Climate Innovation Fund” to develop global carbon emission reduction and elimination technologies. It will also produce 825,000 Xbox consoles using carbon-neutral technology to eliminate the adverse impact of game equipment production on the environment. Apple also announced an investment of US $4.7 billion in Green Bonds, helping to develop green technology innovation, accelerating its progress toward the goal of becoming carbon neutral across its supply chain by 2030.
Many economics theorists have shown that firms can use ECSR strategically, despite its high cost, as it can improve reputation and increase profits, as it can either increase market demand or decrease compliance costs as government regulations increase. For example, Liu, Wang, and Lee (2015) and Buccella, Fanti, and Gori (2021) considered the demand-increasing effect of ECSR and showed that firms might undertake ECSR to raise profits. In the presence of emission taxes, Poyago-Theotoky and Yong (2019), Buccella, Fanti, and Gori (2022), Xu, Chen, and Lee (2022), and Park and Lee (2023) examined a green managerial delegation contract based on ECSR. They showed that firms’ profits increase with the construction of an environmental incentive scheme that induces regulators to lower the emissions tax rate, reducing total tax expenditures. Finally, without considering government regulation and the demand-increasing effect of ECSR, Hirose, Lee, and Matsumura (2017, 2020 and Lee and Park (2019, 2021 examined voluntary ECSR under price competition. They demonstrated that firms could earn higher profits when ECSR increases market prices in which strategic complementary relationships exist.
On the other hand, literature on the information and communications technology (ICT) industry has examined the effects of positive externalities on firms’ strategies for network industries such as software, mobile communications, and computer-based online products (e.g. Katz and Shapiro 1985; Shy 2001; Birke 2009). In such industries, it is natural to observe that the utility of a particular consumer increases with the number of other users. In recent years, due to the dramatic development of network industries, many scholars have studied how the presence of positive network externalities may alter the standard results under imperfect competition. For example, several recent works have examined the model of strategic delegation (Bhattacharjee and Pal 2014; Chirco and Scrimitore 2013; Choi and Lee 2021; Choi, Lee, and Lim 2020; Choi, Lee, and Lee 2022; Fanti and Buccella 2016; Hoernig 2012; Lee, Choi, and Han 2018).
However, the impact of ECSR in network industries has been largely, and surprisingly, neglected. The present work aims to fill this gap and investigates the effects of network externalities on the ECSR activities within network industries. In the presence of positive network externalities, an increase in ECSR to reduce negative externalities caused by pollution has an offset effect on output production when the firms consider both positive and negative externalities simultaneously. That is, the presence of positive network externalities can induce firms to produce more outputs while focusing on negative environmental externalities can prompt firms to produce fewer outputs and emissions. Thus, competition structure may affect prices and, therefore, the relative impacts of these contrasting externalities. In particular, if firms price competitively, they act more aggressively in the product market, which has an indirect positive effect on profits via consumer expectations, and this effect is larger with stronger network externalities.
Furthermore, if firms can choose strategic levels of ECSR under strategic complementary relationships, a higher ECSR can increase the market price through a cost pass-through effect which also has an indirect positive impact on profits. As a result, depending on the critical strength of network externalities, strategic concerns regarding ECSR under price competition can play an important role in changing the offset effect between these contrasting positive and negative externalities. Our analysis highlights the strategic role of ECSR in a polluting network industry as a profitable instrument on the business agenda.
In this paper, we adopt a green managerial delegation model wherein firms choose the level of ECSR and the prices of network products that are fully incompatible while consumers form a rational passive expectation of total demand before firms choose price and ECSR, which is correctively fulfilled at the equilibrium (Choi, Lee, and Lim 2020; Katz and Shapiro 1985). We show that firms consistently are incentivized to undertake ECSR because strategic ECSR decisions have a strategic complementary relationship under price competition. Thus, costly investment in ECSR can increase market prices and profits through the cost pass-through effect. We also show that network externalities can enhance this cost pass-through effect. However, substitutability between network products can play an important role in determining a firm’s ECSR and profits. We further show that undertaking ECSR increases environmental quality and social welfare in a high-polluting network industry. Therefore, the strategic adoption of ECSR in this type of industry can create a win-win situation under price competition when environmental damage becomes serious. Finally, we extend the analysis into (i) the case of (partial) compatibility between network products and (ii) the case of commitment to the output, and discuss the robustness of our findings in an endogenous choice game of ECSR among firms.
The remainder of this paper is organized as follows: We present a basic model in Section 2 and examine the main results in Section 3. We analyze the endogenous choice of ECSR and discuss (partial) compatibility and the commitment to the output in Section 4. The final section concludes the study.
2 The Basic Model
We consider a duopoly market where two firms (firms 1 and 2) provide differentiated network products that are fully incompatible and compete for prices. Following Fanti and Buccella (2017), we assume the following inverse demand function:
where p i (q i ) is the price (output) of product i, z i is consumers’ expectation of the total sales of firm i, n (0 < n < 1) is the strength of network effects and b is the degree of product substitutability. Using (1), we obtain the following demand function:
The production process of firms brings about polluting emissions. We assume that one unit of output produces one unit of pollution. Firm i realizes the emission reduction of y
i
by bearing the abatement cost
where c (0 < c < a) denotes the marginal production cost. Social welfare is defined as the sum of profits and consumer surplus (
We consider a green managerial delegation model where the owner of firm i chooses a strategic level of ECSR to maximize its profit (π i ) while the manager of firm i determines the abatement level (y i ) and the price (p i ) to maximize the following objective function:
where h i (h i ≥ 0) is the strategic degree of ECSR for firm i.[4]
The timing of the game is as follows. In stage 1, consumers form fulfilled expectations about the sizes of the networks that each firm is associated. In stage 2, the firms’ owners choose h i . In stage 3, the managers decide the price (p i ) and emission reduction level (y i ).
3 Analysis
In the third stage, manager i decides the price and abatement level. The first-order conditions are:
where w = a − c. The second-order conditions are satisfied because
Note that one firm’s equilibrium price is increasing in its level of ECSR and consumers’ expected network size for this firm. Also, both firms engage in abatement activities if the ECSR degree is positive (h i > 0).
In the second stage, owner i chooses the optimal h i to maximize its profit. Submitting (7) into (3) gives π i (h 1, h 2, z 1, z 2). The derivative of π i with respect to h i is:
The second-order conditions are satisfied because
Combining (7), (9), and (2), we derive:
In the first stage, consumers form fulfilled expectations about the sizes of the network that each firm is associated. Thus, z i = q i , i = 1, 2. We obtain:
Submitting (11) into (9) gives:
Proposition 1
(i)
Proposition 1 (i) states that firms are incentivized to undertake ECSR in a polluting network industry. This is because the strategic level of ECSR has strategic complementary relationship under price competition which causes a cost pass-through effect. That is, as ECSR increases, the equilibrium price increases, which supports firm profits. Proposition 1 (ii) states that the stronger the network effect, the larger the optimal level of ECSR for firms. This implies that network externalities can enhance the cost pass-through effect of ECSR. That is, firms will commit more to ECSR to mitigate competition if the network externalities are stronger. This finding can strengthen the results of Hirose, Lee, and Matsumura (2017, 2020 and Lee and Park (2019), who examined voluntary ECSR in the absence of network externalities.
The profits, environmental damage, and social welfare in equilibrium are:[5]
To analyze the effects of firms’ ECSR on profits, environmental damage, and welfare, we also consider a situation of both firms not undertaking ECSR (i.e., h i = 0). We obtain the following equilibrium results:[6]
Proposition 2
(i) When b is large,
Proposition 2 implies that the substitutability between network products can play an important role in determining firm profit. When product substitutability is high, undertaking ECSR increases firm profits in a polluting network industry. However, when substitutability is low, and product competition is weak, undertaking ECSR benefits firms only when network effects are weak. Otherwise, the price-increasing effect caused by strategic ECSR will be outweighed by the quantity-increasing impact of network externalities.
Proposition 3
(i) D* < D
N
; (ii) There exists
Proposition 3 implies that undertaking ECSR decreases environmental damage and increases social welfare in a high-polluting network industry. Thus, the strategic adoption of ECSR under price competition with network externalities can increase industry profits and environmental qualities, especially when environmental damage is severe, which can eventually increase social welfare in a high-polluting network industry. Therefore, the strategic adoption of ECSR in a network industry is Pareto-improving as environmental damage becomes serious.
4 Extension and Discussion
4.1 Compatibility Between Network Products
In this extension, we consider that the two networks, one formed around the product of each firm, are (partially) imperfectly compatible with each other.
In (19) k denotes the degree of network compatibility. Following Naskar and Pal (2020) and Choi, Lee, and Lee (2022), we assume that the degree of network compatibility is given by the degree of product differentiation: k = b.
Using a similar procedure to Section 3, we can obtain the equilibrium results. When both firms undertake ECSR, they are:[8]
In addition, when both firms do not undertake ECSR, they are:[9]
Proposition 1′
(i)
Proposition 1′ resembles Proposition 1, wherein firms are incentivized to undertake ECSR, but it further states that the compatibility of network products enhances the degree of ECSR. That is, the strategic complementary relationships among ECSR activities are stronger with compatibility between network products.
Proposition 2′
(i) There exists
Proposition 2′ resembles Proposition 2. That is, the substitutability between network products can play an important role in determining firm profit. However, the proposition further states that the compatibility of network products can increase firm profits, as the degree of ECSR is higher under compatibility between network products, which enhances the cost pass-through effect of ECSR.
Proposition 3′
(i)
Proposition 3′ resembles Proposition 3. That is, undertaking ECSR is conducive to decreasing environmental damage and increasing social welfare in a high-polluting network industry. However, it further states that the compatibility of network products can reduce the environmental quality and increase social welfare, that is, D I > D* and SW I > SW*. Thus, higher network externalities caused by full compatibility between two competing network products might not be desirable for improving environmental quality. It also implies that there might be an appropriate degree of partial compatibility between the two network products.
4.2 The Endogenous Choice of ECSR
In the previous analysis in Section 3, we considered two symmetric situations regarding whether both firms undertake ECSR. In this extension, we examine the robustness of our findings in an endogenous choice game of ECSR. Then, we can consider the following four possible situations in Table 1, including an asymmetric situation where one firm undertakes ECSR while the other does not.
The profits matrix.
| Firm 2 | Firm 1 | |
|---|---|---|
| No ECSR | ECSR | |
| No ECSR | (
|
(
|
| ECSR | (
|
(
|
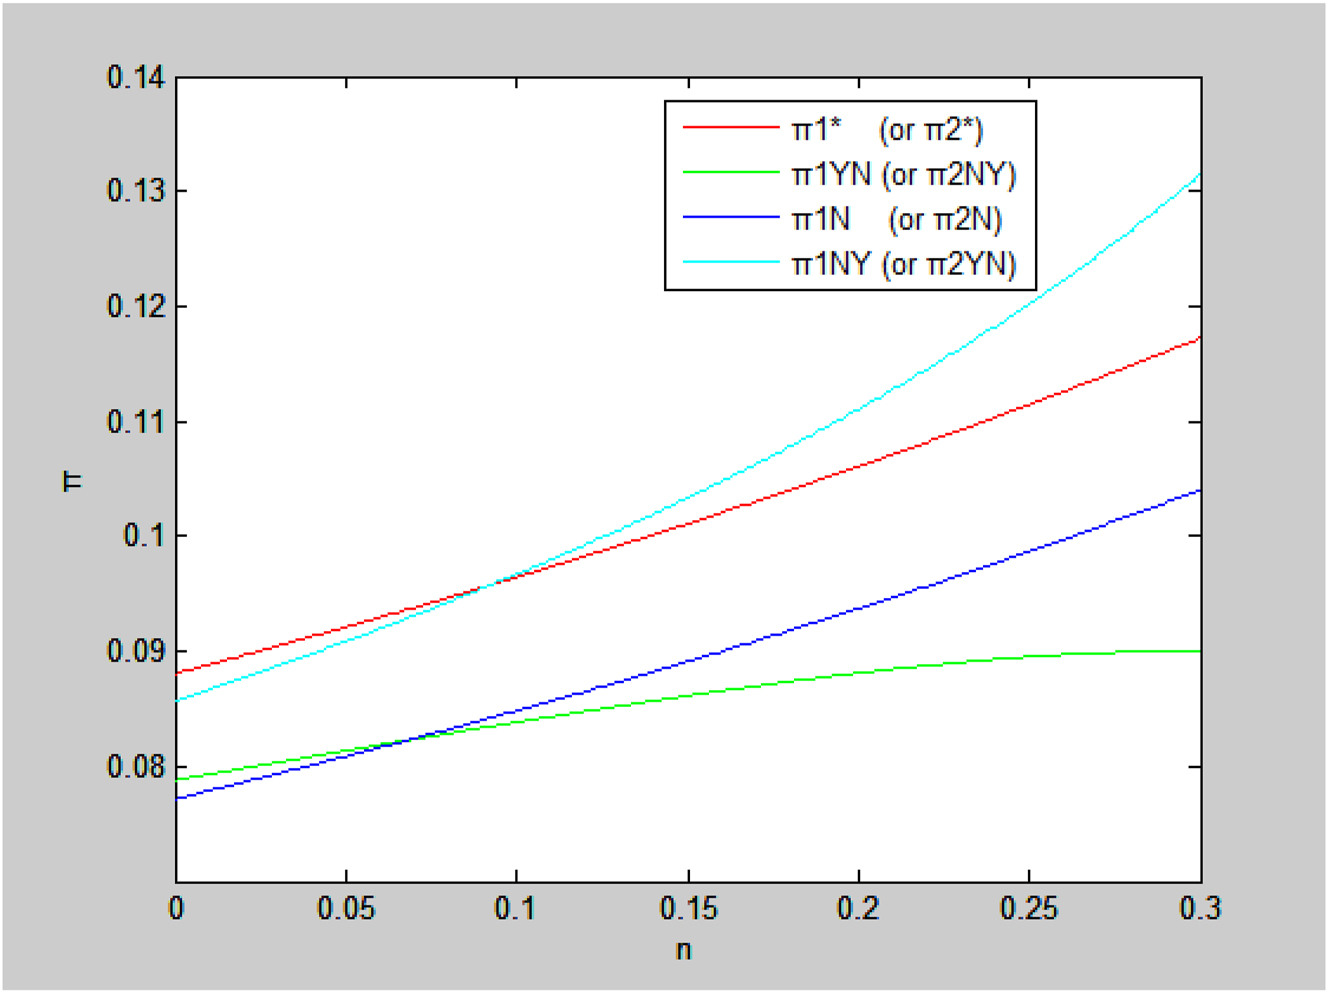
Using a similar procedure to Section 3, we can obtain the following equilibrium profits if firm 1 undertakes ECSR and firm 2 does not (YN), or symmetrically, if firm 2 undertakes ECSR and firm 1 does not (NY):[12]
The mathematical analysis is complicated; thus, we find an equilibrium of an endogenous choice of ECSR by numerical simulations and illustrate the results in [Figure 1] where w = 1, b = 0.8 and d = 0.5. In Figure 1, one can identify three regions for n, delimited by two thresholds, let us define them as n′ (n′ ≈ 0.068) and n″ (n″ ≈ 0.092). It can be easily shown that, given the payoff structures in each region, we have that: (i) for 0 < n < n′, ECSR is the dominant strategy, and the equilibrium is pareto-efficient (from the firms’ perspective); (ii) for n′ < n < n″, there are multiple equilibria with the ECSR equilibrium payoff dominant; (iii) for n″ < n, no ECSR is the dominant strategy and the equilibrium is pareto-inefficient. This result shows that both firms undertake ECSR in equilibrium if the strength of the network effects is not sufficiently high. This guarantees our main findings in the main context.
The equilibrium profits under four situations if b is large.
4.3 Commitment to the Output
We consider an alternative assumption made in the literature on network industry: firms can commit to announced level of output. In this situation, the inverse demand function is given by:
In order to ensure that the impact of each firm’s output on its product price is higher than that of its competitors, we assume that n < 1 − b in this section.
Using a similar procedure to Section 3, we can obtain the equilibrium results. When both firms undertake ECSR, they are:[13]
where
and
In addition, when both firms do not undertake ECSR, they are:[14]
Comparing the equilibrium outcomes shows that our main findings in the basic model are still robust in the following Propositions with some modifications.
Proposition 1″
(i)
Proposition 2″
Proposition 3″
(i) D
# < D
N″; (ii) There exists
5 Conclusions
We incorporated network externalities into a green delegation model wherein polluting firms in a network industry adopt strategic ECSR under price competition. Under consumers’ rational passive expectations formation, we showed that firms are consistently incentivized to undertake ECSR and the positive network externalities can increase the strategic level of ECSR. We also showed that product substitutability could play an important role in determining ECSR profit results in network industries. Finally, we demonstrated that undertaking ECSR is conducive to increasing environmental quality and social welfare in a high-polluting network industry. Therefore, the strategic adoption of ECSR in a polluting network industry is Pareto-improving as environmental damage becomes serious.
In future research, we can examine partial compatibility between network products in a more general framework. We can also consider a responsive expectation by the consumers where consumers form their expectation of total demand in the stage where firms choose price and ECSR (Choi, Lee, and Lim 2020, 2022).
Funding source: Ministry of Education of the Republic of Korea and the National Research Foundation of Korea
Award Identifier / Grant number: NRF-2021S1A5A01063872
Funding source: Soft Science Project of Shandong Provincial Key R&D Plan
Award Identifier / Grant number: 2021RKY05095
Funding source: Natural Science Foundation of Shandong Province
Award Identifier / Grant number: ZR2020MG072
-
Research funding: We thank the funding support from the Natural Science Foundation of Shandong Province [grant number ZR2020MG072], Soft Science Project of Shandong Provincial Key R&D Plan [grant number 2021RKY05095] and Ministry of Education of the Republic of Korea and the National Research Foundation of Korea (NRF-2021S1A5A01063872).
-
Conflict of interest: The authors declare no conflict of interest.
Proof of Proposition 1
(i) When 0 < b < 1 and 0 ≤ n < 1, 1 − b > 0 and
Proof of Proposition 2
where
Proof of Proposition 3
Because
We set
Proof of Proposition 1′
(i) When 0 < b < 1 and 0 < n < 1, 1 − b > 0 and
Proof of Proposition 2′
Proof of Proposition 3′
Because
We set
Since 0 < d < d 3, SW I − SW* > 0.□
Proof of Proposition 1″
When 0 < b < 1, 0 ≤ n < 1 and n < 1 − b, 1 − n > 0, 1 − n − b > 0 and ψ > 0. Thus,
Proof of Proposition 2″
Because
Proof of Proposition 3″
Because
References
Bhattacharjee, T., and R. Pal. 2014. “Network Externalities and Strategic Managerial Delegation in Cournot Duopoly: Is There a Prisoners’ Dilemma?” Review of Network Economics 12 (4): 343–53. https://doi.org/10.1515/rne-2013-0114.Search in Google Scholar
Birke, D. 2009. “The Economics of Networks: A Survey of the Empirical Literature.” Journal of Economic Surveys 23 (4): 762–93. https://doi.org/10.1111/j.1467-6419.2009.00578.x.Search in Google Scholar
Buccella, D., L. Fanti, and L. Gori. 2021. “To Abate, or Not to Abate? A Strategic Approach on Green Production in Cournot and Bertrand Duopolies.” Energy Economics 96: 105164. https://doi.org/10.1016/j.eneco.2021.105164.Search in Google Scholar
Buccella, D., L. Fanti, and L. Gori. 2022. “‘Green’ Managerial Delegation Theory.” Environment and Development Economics 27: 223–49. https://doi.org/10.1017/s1355770x21000206.Search in Google Scholar
Chirco, A., and M. Scrimitore. 2013. “Choosing Price or Quantity? the Role of Delegation and Network Externalities.” Economics Letters 121 (3): 482–6. https://doi.org/10.1016/j.econlet.2013.10.003.Search in Google Scholar
Choi, K. S., and D. J. Lee. 2021. “Network Externalities and Endogenous Timing in Managerial Firms.” Managerial and Decision Economics 43 (5): 1462–75. https://doi.org/10.1002/mde.3467.Search in Google Scholar
Choi, K. S., D. J. Lee, and S. Y. Lim. 2020. “Managerial Delegation of Competing Vertical Chains with Vertical Externality.” The B.E. Journal of Theoretical Economics 20 (2): 20190029. https://doi.org/10.1515/bejte-2019-0029.Search in Google Scholar
Choi, K. S., D. J. Lee, and K. D. Lee. 2022. “Biased Managers with Network Externalities.” Scottish Journal of Political Economy, https://doi.org/10.1111/sjpe.12340.Search in Google Scholar
Fanti, L., and D. Buccella. 2016. “Network Externalities and Corporate Social Responsibility.” Economics Bulletin 36 (4): 2043–50.Search in Google Scholar
Fanti, L., and D. Buccella. 2017. “Bargaining Agenda in a Unionised Monopoly with Network Effects: When Corporate Social Responsibility May Be Welfare-Reducing.” Economia Politica 34 (3): 471–89. https://doi.org/10.1007/s40888-016-0051-1.Search in Google Scholar
Hirose, K., S. H. Lee, and T. Matsumura. 2017. “Environmental Corporate Social Responsibility: A Note on the First-Mover Advantage under Price Competition.” Economics Bulletin 37 (1): 214–21.Search in Google Scholar
Hirose, K., S. H. Lee, and T. Matsumura. 2020. “Noncooperative and Cooperative Environmental Corporate Social Responsibility.” Journal of Institutional and Theoretical Economics 176 (3): 549–71. https://doi.org/10.1628/jite-2020-0035.Search in Google Scholar
Hoernig, S. 2012. “Strategic Delegation under Price Competition and Network Effects.” Economics Letters 117 (2): 487–9. https://doi.org/10.1016/j.econlet.2012.06.045.Search in Google Scholar
Katz, M. L., and C. Shapiro. 1985. “Network Externalities, Competition, and Compatibility.” The American Economic Review 75: 424–40.Search in Google Scholar
Lee, S. H., and C. H. Park. 2019. “Eco-firms and the Sequential Adoption of Environmental Corporate Social Responsibility in the Managerial Delegation.” The B.E. Journal of Theoretical Economics 19 (1): 20170043. https://doi.org/10.1515/bejte-2017-0043.Search in Google Scholar
Lee, S. H., and C. H. Park. 2021. “Corporate Environmentalism in a Managerial Delegation and Abatement Subsidy Policy.” Asia-Pacific Journal of Accounting & Economics 28 (5): 546–61. https://doi.org/10.1080/16081625.2019.1587302.Search in Google Scholar
Lee, D. J., K. S. Choi, and J. J. Han. 2018. “Strategic Delegation under Fulfilled Expectations.” Economics Letters 169: 80–2. https://doi.org/10.1016/j.econlet.2018.05.016.Search in Google Scholar
Liu, C. C., L. F. S. Wang, and S. H. Lee. 2015. “Strategic Environmental Corporate Social Responsibility in a Differentiated Duopoly Market.” Economics Letters 129: 108–11. https://doi.org/10.1016/j.econlet.2015.02.027.Search in Google Scholar
Naskar, M., and R. Pal. 2020. “Network Externalities and Process R&D: A Cournot–Bertrand Comparison.” Mathematical Social Sciences 103: 51–8. https://doi.org/10.1016/j.mathsocsci.2019.11.006.Search in Google Scholar
Park, C. H., and S. H. Lee. 2023. “Emission Taxation, Green R&D, and Managerial Delegation Contracts with Environmental and Sales Incentives.” Managerial and Decision Economics 44 (4): 2366–77, https://doi.org/10.1002/mde.3822.Search in Google Scholar
Poyago-Theotoky, J., and S. K. Yong. 2019. “Managerial Delegation Contracts, “Green” R&D and Emissions Taxation.” The B.E. Journal of Theoretical Economics 19 (2): 1–19. https://doi.org/10.1515/bejte-2017-0128.Search in Google Scholar
Shy, O. 2001. The Economics of Network Industries. Cambridge: Cambridge University Press.10.1017/CBO9780511754401Search in Google Scholar
Xu, L. L., and S. H. Lee. 2022. “Non-cooperative and Cooperative Environmental Corporate Social Responsibility with Emission Taxes.” Managerial and Decision Economics 43 (7): 2846–62. https://doi.org/10.1002/mde.3567.Search in Google Scholar
Xu, L. L., Y. Y. Chen, and S. H. Lee. 2022. “Emission Tax and Strategic Environmental Corporate Social Responsibility in a Cournot–Bertrand Comparison.” Energy Economics 107: 105846. https://doi.org/10.1016/j.eneco.2022.105846.Search in Google Scholar
© 2023 the author(s), published by De Gruyter, Berlin/Boston
This work is licensed under the Creative Commons Attribution 4.0 International License.
Articles in the same Issue
- Frontmatter
- Research Articles
- Screening with Privacy on (Im)persistency
- Quality, Shelf Life, and Demand Uncertainty
- Transfers and Resilience in Economic Networks
- Technology Adoption under Negative External Effects
- Management Centrality in Sequential Bargaining: Implications for Strategic Delegation, Welfare, and Stakeholder Conflict
- Financial and Operational Creditors in Bankruptcy Resolution: A General Equilibrium Approach Under Three Game-Theoretic Division Rules with an Application to India
- Product Differentiation and Trade
- A Theoretical Analysis of Collusion Involving Technology Licensing Under Diseconomies of Scale
- Product Quality and Product Compatibility in Network Industries
- How the Future Shapes Consumption with Time-Inconsistent Preferences
- Notes
- The Strategic Adoption of Environmental Corporate Social Responsibility with Network Externalities
- Strategic Environmental Corporate Social Responsibility (ECSR) Certification and Endogenous Market Structure
- A Note on a Moment Inequality