Natural Disasters and Capital Accumulation: The Role of Precautionary Saving and Capital Market Openness
-
JungJae Park


Abstract
We quantitatively investigate the macroeconomic effects of natural disasters using a standard RBC model with a focus on their impact on capital accumulation. Natural disasters can have ambiguous effects on domestic capital accumulation, through their two opposing effects on households’ incentives for domestic capital accumulation. On the one hand, natural disasters hurt domestic capital accumulation due to their destructive nature. On the other hand, a high natural disaster risk leads households to increase precautionary savings, which can increase the long-run capital stock when it is invested domestically. Our quantitative results show that in a closed economy, the long-run capital stock exhibits a “U” shape with respect to the intensity of natural disasters, and that in a small open economy, the long-run capital stock monotonically decreases with respect to the intensity of natural disasters. This result can provide an explanation to Skidmore, M., and H. Toya. 2002. “Do Natural Disasters Promote Long-Run Growth?” Economic Inquiry 40 (4): 664–87 puzzling empirical finding: Lack of observed negative long-run relationship between natural disasters and long-run capital stock/economic output. Moreover, in the event study analysis on the short-run macroeconomic dynamics during the natural disaster crises, we find that households’ capital flight can exacerbate output costs of the natural disasters. This finding is also in line with Noy, I. 2009. “The Macroeconomic Consequences of Disasters.” Journal of Development Economics 88 (2): 221–31 puzzling finding that capital market openness adversely affects the short-run output cost of natural disasters.
1 Introduction
Over the past few decades, there has been a marked increase in the frequency and severity of natural disasters worldwide, with notable examples including the 1990 Luzon earthquake (Philippines), the catastrophic 2004 Indian Ocean tsunami (Indonesia), and the 2017 Hurricane Maria (Puerto Rico). This trend of more frequent and severe natural disasters has drawn the attention of policymakers and academics alike, highlighting the need for greater understanding of the macroeconomic consequences of natural disasters.
Despite a consensus that natural disasters are harmful due to their destructive nature, empirical studies in the literature have not yet reached a consensus on the relationship between natural disasters and economic output/growth, whether in the short run or long-run.[1] Several empirical studies such as Skidmore and Toya (2002) and Cavallo et al. (2013) find a positive or non-negative relationship between natural disasters and economic output/growth, whereas Felbermayr and Gröschl (2014) and Noy (2009) find, on impact, negative effects of natural disasters on economic output/growth. Felbermayr and Gröschl (2014) surveyed the 14 empirical studies investigating the effects of natural disasters on GDP per capita. They find that among 368 point estimates from these studies, about 38 % are statistically insignificant at the 10 % level; of the statistically significant estimates, about 44 % are positive, whereas the remaining 56 % are negative.
Standard neoclassical growth theory also does not provide a clear answer to this puzzling empirical finding. When a natural disaster initially strikes, destroying part of a country’s capital stock, economic output immediately decreases. As the country’s capital stock deviates from its steady state level, households rapidly increase domestic investment to replenish the destroyed capital stock, putting the country back to its original steady state. That is, the standard neoclassical growth theory predicts that a one-off natural disaster would lead to a temporary decline in output, without affecting long-run capital accumulation and the rate of technological progress.
However, natural disasters are recurrent, and this disaster risk influences households’ consumption and investment decisions, leading to long-term macroeconomic effects. At first glance, one might conclude that a high risk of natural disasters reduces physical capital accumulation, thus reducing long-run economic output/growth. But such a conclusion can be partial, as there are two opposing forces at play on capital accumulation, thus affecting economic output/growth. On the one hand, natural disasters hurt capital accumulation both directly and indirectly. Directly, natural disasters recurrently destroy a country’s capital stock, thus increasing the effective depreciation rate of domestic capital. Indirectly, this increase in the effective depreciation rate undermines households’ incentive for domestic investment by lowering the expected return on capital. On the other hand, in the face of a natural disaster risk, households tend to engage in precautionary saving to insure against an income loss during natural disaster crises. Sawada (2013) and Skidmore (2001) find that the high risk of natural disasters like earthquakes has contributed to Japanese households’ high propensity to save, leading to a high level of capital accumulation. Skidmore and Toya (2002) and Loayza et al. (2012) conducted regression analyses examining the impact of natural disasters on physical capital accumulation and found that, in most cases, natural disasters have little to no effect or positive effects on physical capital accumulation.
In a closed economy, one extreme on the spectrum of capital market openness, this increase in the domestic saving due to precautionary motives can contribute to domestic capital accumulation, because domestic savings are domestically invested in a closed economy. However, in an open economy, the opposite extreme on the spectrum of capital market openness, households can invest their saving abroad by purchasing foreign assets in the international financial market. In this case, the increase in saving, driven by precautionary motives, could not contribute to capital accumulation. Therefore, the relative strengths of the two opposing forces combined with the degree of capital market openness ultimately determine the long-run levels of capital stock and output for a country facing a risk of natural disasters. It is difficult to disentangle the effects of each force under different types of capital market openness without using a structural model.
To provide a quantitative assessment of the macroeconomic effects of natural disasters, we use an otherwise standard RBC model augmented with a natural disaster shock. We model a natural disaster as a recurring shock that destroys a portion of the existing capital stock. To capture the non-linear effects of substantial capital stock destruction and households’ precautionary saving, the model, which is calibrated to a sample of emerging market economies, is solved and simulated with a global solution method.
In the quantitative analysis, we find that natural disasters make the economy’s business more volatile in general, mainly through high volatility of investment. This result is consistent with Raddatz (2007), which finds that natural disasters play a role in accounting for high volatility of emerging market economies’ business cycles.
Moreover, the long-run average capital stock obtained from the simulated ergodic distribution displays different patterns with respect to intensity of natural disasters, under different types of capital account openness. In a closed economy model, the average long-run capital stock exhibits a “U” shape with respect to the intensity of natural disasters: for mild natural disasters, the long-run capital stock initially decreases, as the intensity of natural disasters increases. However, once their intensity exceeds a certain threshold, the long-run capital stock starts to grow with the intensity of natural disasters. It is because as the natural disaster risk increases, the increase in domestic investment resulting from households’ precautionary savings more than compensates for the decrease in capital stock caused by the natural disasters. On the other hand, in the small open economy model, in which households have an option to save in the international financial markets, the long-run capital stock monotonically decreases with increasing natural disaster intensity. In the face of increasing disaster risk, households still increase their precautionary saving, not in the form of domestic investment, but in the form of risk-free foreign financial assets, thus leading to capital flight. That is, our model predicts that capital market openness negatively affects physical capital accumulation for the countries facing high natural disaster risk, and we find suggestive empirical evidence supporting this prediction.
Because of this non-linear relationship between the long-run capital stock and intensity of natural disasters under different types of capital market openness, our structural model indicates that the long-run cross-country regression between natural disasters and the long-run capital stock/economic growth could yield a positive or a non-significant correlation, as in Skidmore and Toya (2002)’s[2] puzzling empirical finding.
Moreover, in the countries with a high degree of capital account openness, households during times of natural disaster crises have a strong incentive for “capital flight”- transferring their resources out of their country to buy safe foreign assets. Our quantitative analysis on short-run macroeconomic dynamics around the natural disaster crisis, using the event study technique to simulated data, indicates that this capital flight for the countries with a high degree of capital account openness exacerbates output costs of natural disasters at the time of natural disasters, especially when natural disasters are persistent.[3] This is consistent with Noy (2009)’s puzzling empirical finding that capital market openness exacerbates output costs of natural disasters. To our best knowledge, our paper is the first paper which finds an important role of precautionary saving and capital account openness in capital accumulation and economic output for the countries facing a high risk of natural disasters.
Our results can have policy implications for governments of countries of high natural disaster risks. A capital control policy which bans capital flight can contribute to domestic capital accumulation in the long-run, but it comes at the expense of household welfare. This implication is in line with Liu, Spiegel, and Zhang (2021), which finds that the Chinese government’s capital control policy has contributed to China’s economic growth at the cost of household welfare. When natural disasters are persistent, the capital control policy which bans capital flight can mitigate the short-run output costs of natural disasters.
1.1 Related Literature
In recent years, the economic impact of natural disasters has become an increasingly important area of research. Despite the growing body of literature on this topic, the majority of studies tend to be empirical in nature. While these studies have contributed valuable insights into the macroeconomic effects of natural disasters, there has been relatively little work using structural models to analyze the macroeconomic effects of natural disasters. Cantelmo, Melina, and Papageorgiou (2023) and Marto, Papageorgiou, and Klyuev (2018) among others use a small open economy DSGE model with a similar natural disaster shock to investigate the macroeconomic effects of natural disasters, but they mostly focus on welfare implications of natural disasters and the effectiveness of a government’s disaster mitigation policy after the natural disaster crises. Our paper complements their work by investigating the long-run impacts of natural disasters on capital accumulation.
Moreover, Cantelmo, Melina, and Papageorgiou (2023) assumes an ad-hoc function for a government’s external borrowing/saving decision, not allowing households for any access to international financial markets, but our paper allows households to optimally choose the amount of borrowing/saving in the international financial markets. Even though incorporating households’ endogenous borrowing/saving in the international financial markets significantly increases computational complexity, our paper successfully identifies the important role of capital market openness in capital accumulation, a factor Cantelmo, Melina, and Papageorgiou (2023) does not address. Our paper shows that households’ precautionary saving in the face of natural disaster risk, along with their interaction with access to international financial markets, plays a crucial role in determining a country’s long-run capital accumulation, and consequently its long-run output. Moreover, we find that these factors also influence the short-term output costs of natural disasters as well.
The remainder of the paper is structured as follows. Section 2 presents the model. Section 3 presents the quantitative analysis of the macroeconomic effects of natural disasters. Section 4 presents empirical evidence evaluating the model’s prediction. Section 5 concludes.
2 Model
We introduce a natural disaster shock into an otherwise standard small open economy RBC model with endogenous capital accumulation (Mendoza 1991). The natural disaster shock is modeled as an exogenous shock which destroys a certain fraction of the existing capital stock of economy. Further detail regarding the natural disaster shock will be presented later in this section. The economy is populated by a continuum of identical households and firms. The households own the firms and provide capital and labor service to firms, which use both inputs to produce the tradable consumption good, which is the numeraire in this economy. Households accumulate capital through investment and have access to the international financial market, where they can borrow or save through issuing or buying risk-free non-contingent bonds to/from foreign creditors at the world risk-free rate r*. Finally, households have perfect information about the stochastic process governing the natural disaster shock and form expectations accordingly. In the Section 3.1.2, we also consider the closed economy case, in which households have no access to the international financial markets.
2.1 Households
The representative household has the preferences given by
where C t denotes consumption, L t labor, and β the time discount factor. We use the following GHH (Greenwood, Hercowitz, and Huffman 1988) preference, which is widely used in the open economy business cycle literature, because it is known to well match the business cycles for the emerging market economies. The period utility function is given by
2.1.1 Capital Accumulation and Natural Disaster Shock
The household owns the capital and rent it to the representative firm with the real rental rate of
Capital is accumulated according to the following law of the motion:
where δ is a depreciation rate, I
t
investment, and
Moreover, we have the following standard capital adjustment cost given by:
The capital adjustment cost is typically used to prevent excessive volatility of investment in the small open economy business cycle models.
The household borrows or saves in the form of one period non-contingent bonds B t [5] in the international financial markets. In the benchmark model, we assume that households in this country has full access to the international financial markets. The period budget constraint for the representative household is given by
where w t is a wage rate. The risk-free rate in the international financial markets is constant at r*.
2.2 Firms and Production
Firms employ labor L t and capital K t to produce a final good Y t using the following production function:
where A t is a total factor productivity (TFP) shock. The total factor productivity shock (TFP) A t is governed by the following AR(1) process:
where ϵ t is i.i.d and follows a normal distribution of N(0, σ ϵ ). Finally the production function F(.) exhibits constant returns to scale.
2.3 Recursive Formulation
The Bellman equation for the representative household is given by:
subject to the following constraints:
We have two exogenous variables
2.3.1 Discussion on the Effects of Natural Disasters on Capital Accumulation
Natural disaster risk has two opposing effects on households’ incentives for capital accumulation. On the one hand, natural disasters hurt capital accumulation both directly and indirectly. Directly, natural disasters recurrently destroy a country’s capital stock, thus increasing the effective depreciation rate of domestic capital. Indirectly, this increase in the effective depreciation rate undermines households’ incentive for domestic investment by lowering the expected return on domestic capital. On the other hand, natural disasters increase income uncertainty for households: households suffer from an income loss when natural disasters destroy the domestic capital. In the face of increased income uncertainty, households tend to engage in precautionary saving to insure against an income loss during natural disaster crises. It must be noted that natural disasters pose a downside income risk, and compared to the mean preserving increase in income uncertainty, households’ precautionary saving can be larger.[7]
In a closed economy, in which all households’ saving is invested domestically (i.e., S = I), it is not clear whether the long-run capital stock would increase or decrease in the presence of natural disaster risk. On the other hand, in an open economy, in which households saving does not have to directly flow into domestic investment (i.e., S ≠ I), households facing a high risk of natural disasters have an option to save in the form of foreign bonds (i.e., B t > 0) in the international financial markets rather than domestic capital. Hence, in the case of the open economy model, access to the international financial markets could work to discourage households’ incentive for domestic investment, thereby adversely affecting capital accumulation. In the next section, we solve and simulate the model to quantify the effects of natural disasters, with a focus on the two opposing forces affecting capital accumulation.
3 Quantitative Analysis
3.1 Calibration and Quantitative Performance of the Model
3.1.1 Calibration and Functional Forms
The model is calibrated to match a number of business cycle moments for emerging market economies.[8] Table 1 lists baseline parameters. A period is a year. The risk aversion coefficient γ is set to be 2. The parameter that determines the labor supply elasticity of wage in the GHH utility function ω is set equal to 2, which is within the range of the values used in the literature. The annual interest rate is set at 4 %. Labor’s share of income α and the subjective discount factor for the household β are, respectively, set to be 0.6 and 0.96. The annual capital depreciation rate δ is 0.1, which is a widely used value in the emerging market economy business cycle literature. To estimate a stochastic process for the total productivity shock, we need a reliable series for emerging market economies’ Solow residuals. However, many emerging market economies do not provide reliable labor statistics. We set the persistence parameter of the TPF shock ρ to be 0.6, which is the estimate for Mexico from Boz, Daude, and Durdu (2008), and we set the volatility parameter of TFP shock σ ϵ to match the average volatility of HP filtered output for the emerging market economies, 3.98 % (Uribe and Schmitt-Grohé 2017). The capital adjustment cost κ is set to be 0.175 to match the average volatility of investment to GDP ratio for the emerging market economies (Uribe and Schmitt-Grohé 2017).
Parameters.
| Parameter | Value | Description | Source/target moments |
|---|---|---|---|
| γ | 2 | Risk aversion parameter | Literature |
| r f | 4 % | Annual risk free rate | Standard value |
| ω | 2 | Curvature parameter of labor supply | Literature |
| α | 0.6 | Labor income share | Literature |
| β | 0.96 | Subjective discount factor | Annual interest rate of 4 % |
| δ | 0.1 | Annual depreciation rate | Literature |
| κ | 0.175 | Capital adjustment cost | Volatility of investment for EME’s (Uribe and Schmitt-Grohé 2017) |
| ρ | 0.6 | Persistence of TFP shock | Estimate for Mexico (Boz, Daude, and Durdu 2008) |
| σ ϵ | 0.0245 | Volatility of TFP shock | Volatility of GDP for EME’s (Uribe and Schmitt-Grohé 2017) |
| η | 0.022 | Fraction of decrease in the existing capital | % Decrease in GDP at the time of disaster |
| p dd | 0.333 | Probability of recurring natural disaster | Persistence of natural disaster |
| p nn | 0.965 | Transition probability of natural disaster | Annual frequency of natural disaster |
The natural disaster shock
The realization Z d corresponds to when a natural disaster shock hits the economy, whereas Z nd normal times (no disaster). In the transition matrix Π Z , p dd is the probability of a natural disaster occurring again in the next period, given the economy gets hit with the natural disaster shock in the current period. Likewise, p nd is a transition probability of the economy getting hit with a disaster shock in the subsequent period, given that the economy is in normal times in the current period. We calibrate these probabilities such that the annual frequency of a natural disaster shock is 5 % (i.e., once in every 20 years), which falls in the range of estimates for the emerging market economies from Cantelmo, Melina, and Papageorgiou (2023), and that the recurring probability of natural disaster is computed using the persistence of the disaster shock from Gourio (2012), Isoré and Szczerbowicz (2017), and Cantelmo, Melina, and Papageorgiou (2023). The calibrated p dd and p nd are, respectively, 0.333 and 0.965.
The degree of persistence of natural disasters varies significantly depending on the type of disaster. Natural disasters are classified into two types based on their duration: slow-onset disasters and rapid-onset disasters. Geological disasters, such as earthquake and volcano eruption, are generally considered rapid-onset disasters, while climate-related disasters, such as drought and sea-level rise, are slow-onset disasters. In this paper, we investigate the quantitative effects of a slow-onset disaster, which emerges gradually over time and is primary attributed to climate change. Compared to the rapid-onset disasters, this slow-onset disaster demonstrates a high degree of persistence. In Appendix A we present the main quantitative findings for the case of an i.i.d natural disaster shock, intended to model a rapid-onset disaster. We find that the persistence of the disaster shock also has significant macroeconomic effects in both the short and long-run by affecting household’s consumption and investment decisions.
The parameter η, representing the fraction of the existing capital stock destroyed at the time of a natural disaster, is calibrated to 0.022 (i.e., a natural disaster shock destroys 2.2 % of the existing capital stock) to match the average decrease in GDP of 1 percent at the time of the natural disaster. This decrease in GDP at the time of the natural disaster is also in the range of estimates by Cantelmo, Melina, and Papageorgiou (2023) using the data for a sample of 129 countries spanning the years from 1998 to 2017.
3.1.2 Quantitative Performance of Model
3.1.2.1 Business Cycle and Long-Run Moments
Table 2 shows the business cycle and long-run moments from the simulations under different scenarios for the small open economy benchmark model. The first column shows those moments for the calibrated benchmark model with a natural disaster shock, and the simulation results for the other columns are obtained with using a different parameter at a time, holding the other parameters at those in the baseline calibration. Compared to the case of no natural disaster (column 2), the business cycles for the model with natural disasters exhibits higher volatility, with output volatility being 1.8 % higher, consumption volatility 1.5 % higher, and investment volatility 4.6 % higher. This result is consistent with Raddatz (2007)’s empirical finding that natural disasters accounts for a significant fraction of the business cycle volatility of the emerging market economies.
Business cycle and long-run moments from simulations.
| (I) Baseline (η = 0.022) | (II) No disaster (η = 0) | (III)η = 0.01 | (IV)η = 0.05 | (V)η = 0.07 | (VI) Frequent disaster | |
|---|---|---|---|---|---|---|
| σ(Y) | 3.98 | 3.91 | 3.93 | 4.21 | 4.32 | 4.02 |
| σ(C)/σ(Y) | 0.67 | 0.66 | 0.67 | 0.70 | 0.74 | 0.68 |
| σ(I)/σ(Y) | 3.79 | 3.62 | 3.65 | 4.54 | 4.64 | 3.85 |
| E(Y) | 2.95 | 3.00 | 2.98 | 2.92 | 2.91 | 2.90 |
| E(C) | 2.09 | 2.13 | 2.11 | 2.08 | 2.08 | 2.06 |
| E(K) | 8.29 | 8.48 | 8.38 | 8.16 | 8.11 | 8.08 |
| E(K/Y) | 2.81 | 2.83 | 2.82 | 2.80 | 2.79 | 2.71 |
| E(B/Y) | −19.4 % | −21.5 % | −21.1 % | −8.44 % | 6.73 % | −18.03 % |
-
Y, C, I, K, and B respectively denote GDP, consumption, investment, capital stock, and external bond holdings. When computing the volatility (σ), all variables are HP-filtered with a smoothing parameter of 100. E(x) is the mean value of x obtained from the simulated ergodic distribution. The simulated volatilities of output and investment precisely their empirical counterparts, which are our target moments.
The long-run average capital stock, denoted as E(K) and obtained from the simulated ergodic distribution for the benchmark model, is lower (8.29) than that of no natural disasters (8.48); this lower level of long-run capital stock results in a lower level of the long-run average output for the case of natural disasters. That is, the natural disaster shock, which on impact destroys 2.2 % of the existing capital stock, leads to a decrease in the long-run average output by 1.7 % from 3.00 to 2.95.
Columns 3 through 5 show the business cycle and long-run moments for varying degrees of natural disaster intensity. As a natural disaster gets more severe, business cycles become increasingly more volatile, and the long run average capital stock decreases in tandem with the long-run average output. Finally, as the frequency of natural disasters increases from once every 20 years to once every 10 years (last column), business cycles become more volatile, and the average long-run capital stock and output decrease.
Our quantitative results indicate that natural disasters hurt the small open economy’s long-run output through a decrease in the long-run capital accumulation. These results support the empirical studies documenting the negative long-run economic effects of natural disasters but contradicting Skidmore and Toya (2002) ’s findings among others. However, in Section 3.2.3, in which we conduct a sensitivity analysis with respect to the intensity of natural disasters for the economies with different types of capital market openness, we show how our structural model can predict positive or insignificant long-run effects of natural disasters on capital accumulation and economic output.
Moreover, as natural disasters become more severe, the average ratio of external bond holdings to GDP
When the natural disaster is significantly severe (η = 0.07), the country experiences capital flight[9] so that it has a positive foreign bond holding (i.e.,
The Figure 1 shows the simulated ergodic distributions of capital stock (K) and foreign bond holdings (B) for the cases of the baseline calibration (Column 1 of Table 2) and severe natural disasters (the last column), thus comparing the stochastic steady states of the two cases.[10] This figure illustrates households’ portfolio choice between the domestic capital (K) and foreign bonds (B) for the cases of two different disaster intensities. For the case of the severe natural disaster, the ergodic distribution of capital stock (grey) is located to the left compared to the benchmark case (black), with a lower mean of 8.11. However, there is a stark contrast in the ergodic distributions of the foreign bond holdings between the two cases: households confronted with severe natural disasters tend to have positive foreign bond holdings (B > 0), indicating a great shift from domestic capital to foreign bonds. That is, in the case of a small open economy, the increase in households’ savings tends to be invested in the form of risk-free foreign bonds, rather than in domestic capital, when natural disasters are severe.
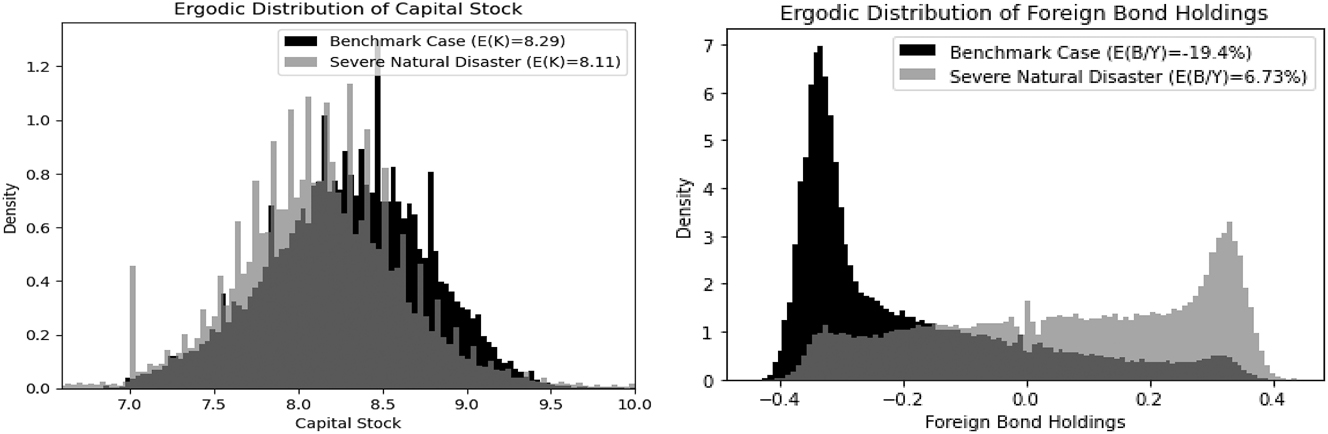
Simulated ergodic distributions of capital stock and foreign bond holdings.
3.2 Exploring the Model’s Mechanism
In this section, we examine the model’s mechanism, focusing on the roles of households’ precautionary saving behavior in the face of natural disaster risk and capital market openness in capital accumulation. To this end, we present the policy functions of the model for both the small open economy and closed economy cases, and conduct a sensitivity analysis with respect to the intensity of natural disasters under different types of capital market openness.
3.2.1 Small Open Economy Case (S ≠ I)
Figure 2 presents policy functions across the capital stock K for domestic saving (S = Y − C), investment (I), and current account (CA = S − I) for three different levels of disaster intensity during normal times. The figure separately illustrates the two opposing effects of natural disasters on households’ incentives for capital accumulation. As a natural disaster gets more severe, households increase domestic saving (top left panel), which could have a positive effect on domestic capital accumulation if additional savings are invested domestically. However, they simultaneously decrease domestic investment (top right panel), which has a negative effect on domestic capital accumulation. Thus, in a small open economy, natural disasters’ two opposing effects lead to a divergence between domestic saving and investment.
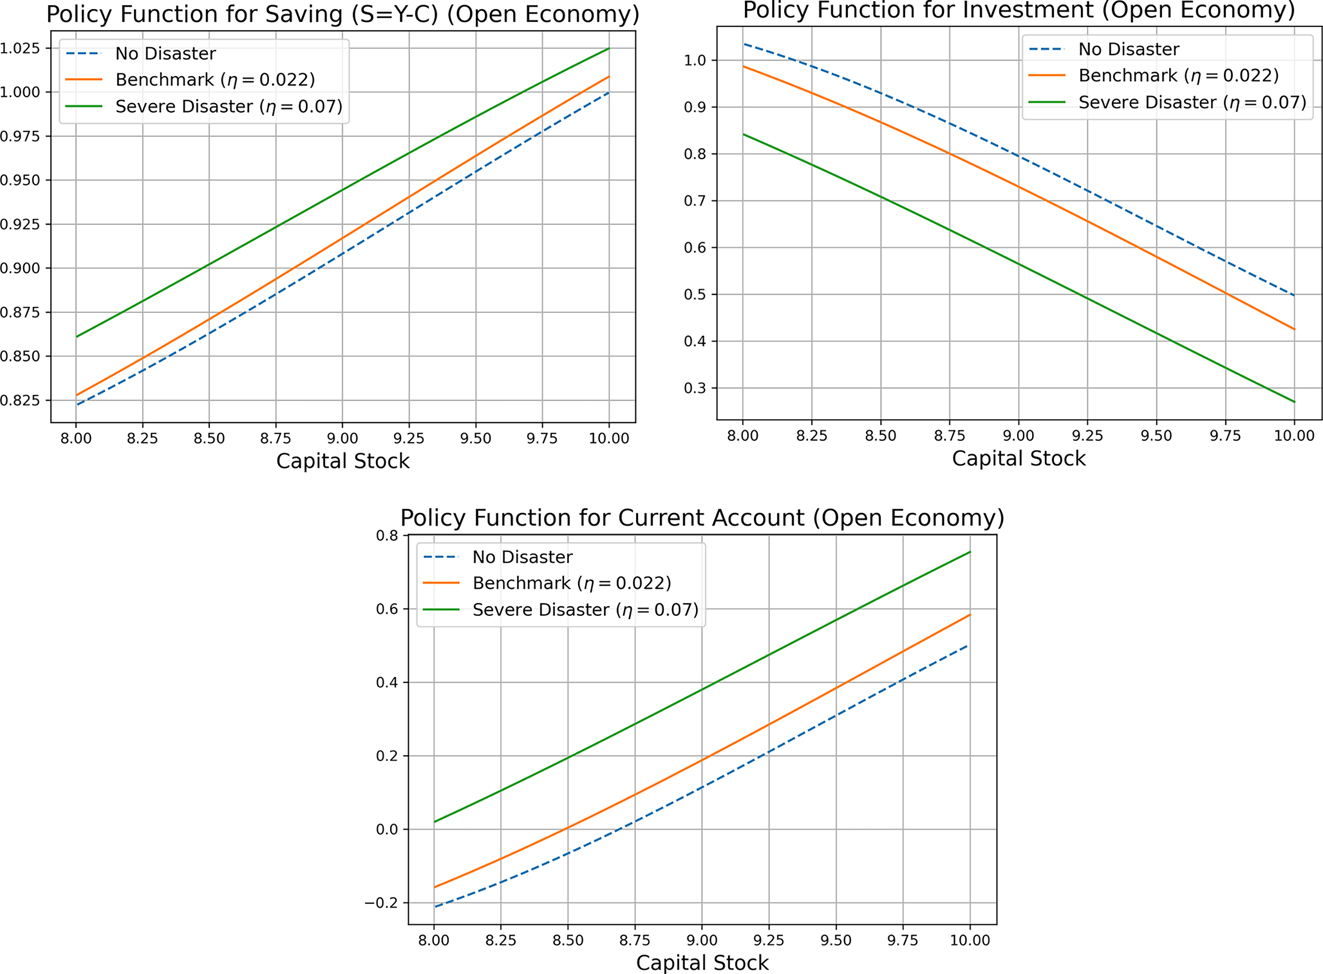
Policy functions for domestic saving (S=Y–C) and investment w.r.t intensity of natural disasters. Note: the policy functions are obtained for the case of no disaster, fixing the bond holdings (B) and TFP shock (A) at their respective steady state values.
In a small open economy, where households have an option to save/borrow in the international financial markets, the excessive domestic saving (S − I) flows out of the country, thus improving the current account (CA> 0). The policy functions for the current account (bottom panel) show why there is a stark contrast in the ergodic distributions of the foreign bond holdings between the two cases in the Figure 1. For the benchmark case, the current account is in deficit around the steady state level of capital stock (
Figure 3 presents the policy functions for varying degrees of household risk aversion (γ), a key parameter determining the degree of households’ precautionary saving in our model. As households become more risk-averse (i.e., as γ increases), they increase domestic saving but decrease investment, thus improving the current account. This result highlights the important role of households’ precautionary saving in determining the long-run capital accumulation.
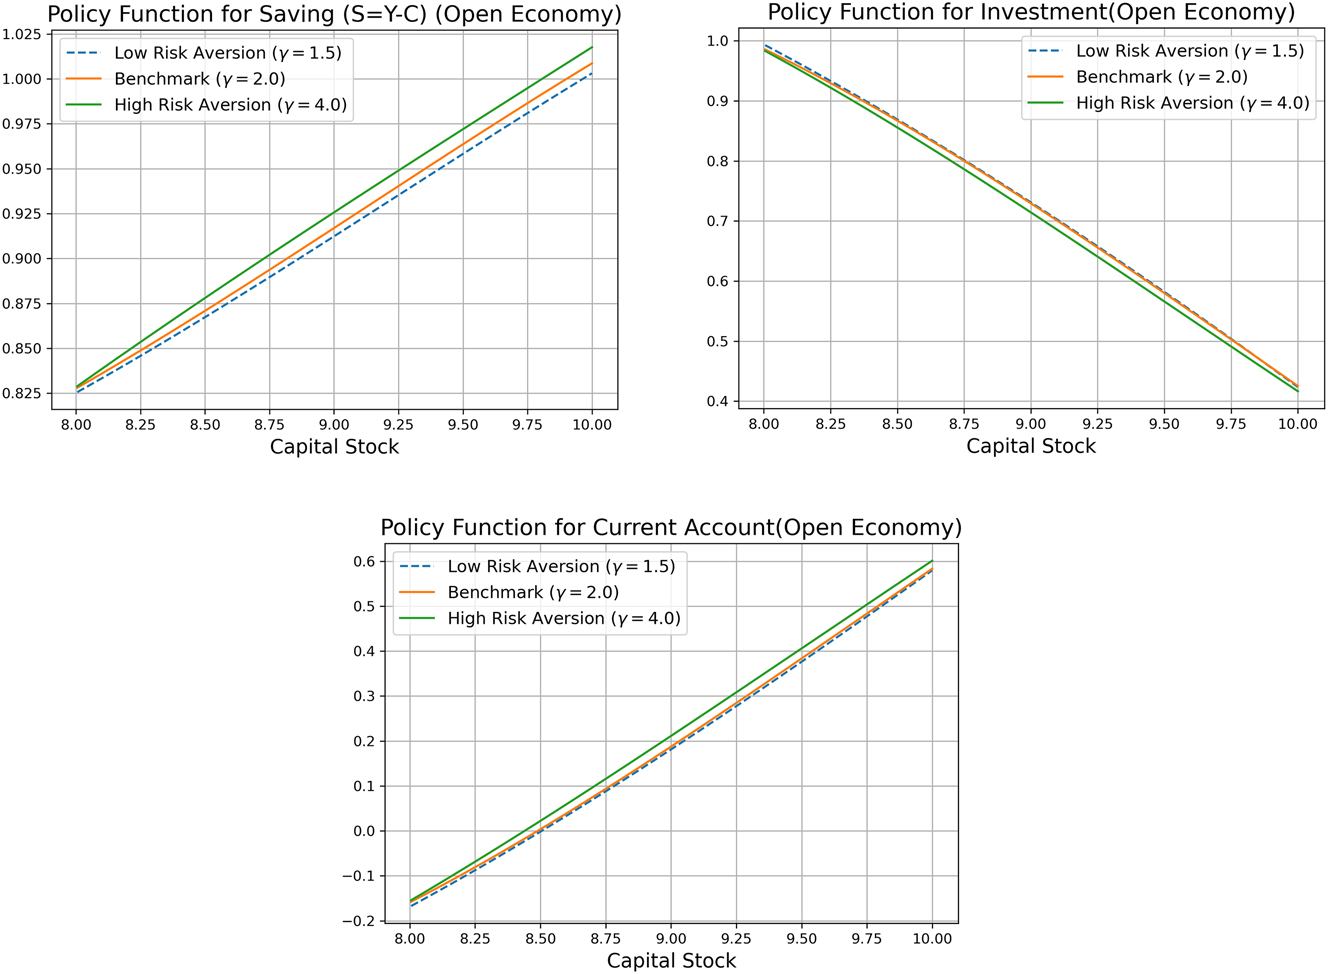
Policy functions for domestic saving (S=Y–C) and investment w.r.t household’s risk aversion (γ). Note: the policy functions are obtained for the case of no disaster, fixing the bond holdings (B) and TFP shock (A) at their respective steady state values.
In the Appendix B we present the policy functions for additional two scenarios for the small open economy case: (i) varying frequencies of natural disaster and (ii) different degrees of persistence of natural disaster crises. The main takeaway from the Appendix B is that as natural disasters become more harmful, whether through increased frequency or persistence, households increase domestic savings due to precautionary motives but decrease investment, similar to the results as in the Figures 2 and 3, leading to a divergence between saving and investment in a small open economy.
3.2.2 Closed Economy Case (S=I)
In this section, we show the quantitative results for the case of a closed economy. As we discussed in the previous section (subsection 2.3), in a closed economy where saving abroad (i.e., buying foreign bonds B) is not an option for households, domestic saving is equal to domestic investment (S = I). Then, unlike the small open economy case featuring a separation between domestic saving and investment, the relative strengths of the two opposing forces affecting capital accumulation would determine the long-run level of capital stock/output. We use the same parameters for simulation as those in the benchmark parameters in Table 1 except for the world interest rate r*.[11]
Figure 4 plots the average long run capital stock, output, and consumption obtained from the simulated ergodic distribution of each variable for the case of a closed economy, as the intensity of natural disaster, denoted by η, increases. The blue solid line with circles denotes the cases in which the household risk aversion parameter γ in the utility function is set to 2 (the benchmark value), and the orange dashed line denotes those in which households are more risk averse (γ = 4).
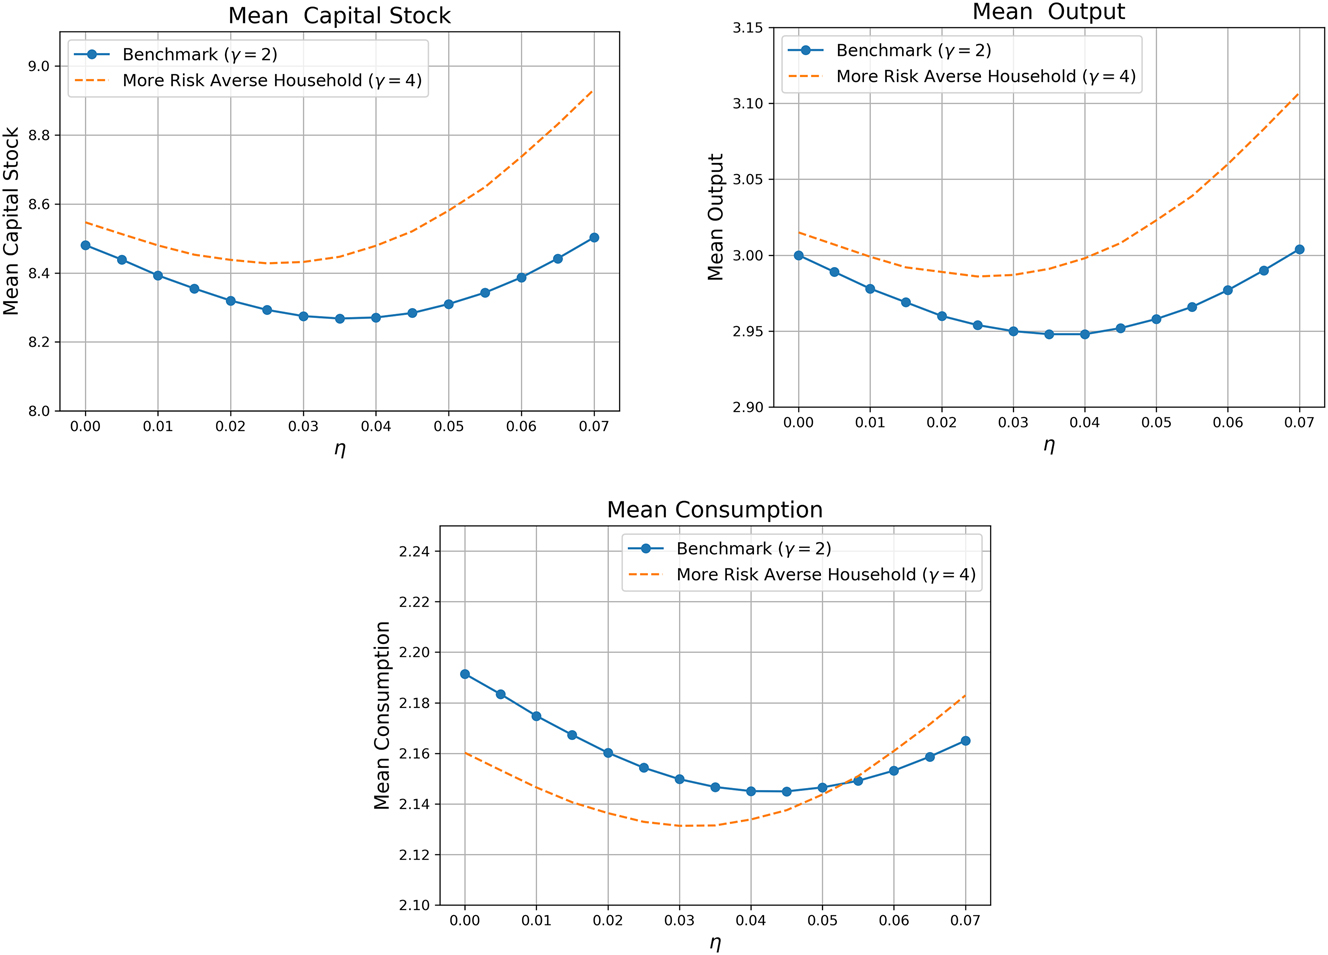
Long run average capital stock, output, and consumption w.r.t intensity of natural disasters (closed economy). Note: η denotes the intensity of natural disasters, the fraction of the existing capital stock destroyed when a natural disaster shock hits the economy.
The long-run average capital stock shows a “U” shape with respect to the intensity of natural disasters for the closed economy case. For mild natural disasters, the long-run average capital stock first decreases in tandem with the long-run average output/consumption, as η increases. Above a certain threshold of η* at around 0.035, the long-run capital stock starts to increase with η. When natural disasters are severe, households aware of the high risk significantly increase precautionary savings with the increasing intensity of natural disasters in order to prepare for a substantial income loss associated with capital destruction during a natural disaster crisis, and unlike the small open economy case, in which households save in the international financial markets, this increase in the precautionary savings directly flows into capital accumulation for the closed economy case. When this increase in investment, driven by households’ precautionary saving motives, gets to exceed the decrease in the amount of capital due to natural disasters, the long-run capital stock gets to increase. For the closed economy, one extreme on the spectrum of capital account openness, the relative strength of the two opposing forces determines the long-run average capital stock, and thereby the long-run average output and consumption.
When we recalibrate the model to a higher level of households’ risk aversion (γ = 4), a key parameter determining the degree of precautionary saving in our model, the long-run average capital and output are higher than those under the case of lower risk aversion (γ = 2). Moreover, the long run capital stock starts to increase at a lower threshold value of η. It should be, however, noted that the long-run average consumption in the high risk aversion case (orange dashed line) is lower than the low risk aversion case (the bottom panel of Figure 4) for most values of η. This indicates that heightened precautionary saving, resulting from increased household risk aversion, actually leads to an “inefficiently” high level of capital (i.e., much higher than the steady-state capital stock K* achieved under the Golden Rule of saving in the Solow (1956) model), thereby reducing household consumption and welfare.
3.2.2.1 Policy Functions for Saving (Investment) in a Closed Economy
The left panel of Figure 5 presents the policy functions for households’ saving (S = I) across the capital stock K for different values of η and illustrates the underlying mechanism driving the “U”-shaped relationship between the long-run capital stock and the intensity of natural disasters. As η increases, natural disasters cause greater destruction of the capital stock during the crises period. In response, households increase domestic savings (investment) during normal times, but for a low range of η (η < η*), the increase in saving (investment) is not sufficient to compensate for the destruction of the capital stock during the natural disaster crises; then the long run capital stock decreases with η (the left segment of “U” shape). In contrast, when the natural disasters are more severe, as η increases from 0.05 (the green dashed line) to 0.07 (the red solid line), the rise in domestic savings is significantly larger than the increase observed when η increases from 0 to 0.22. When natural disasters are severe, households aware of the high disaster risk significantly increase their investment (saving) in domestic capital in anticipation of a substantial income drop during natural disaster crises. When the increase in investment induced by households’ precautionary saving exceeds the decrease in the capital stock due to the natural disasters, the long-run capital stock increases with η (the right segment of “U” shape).
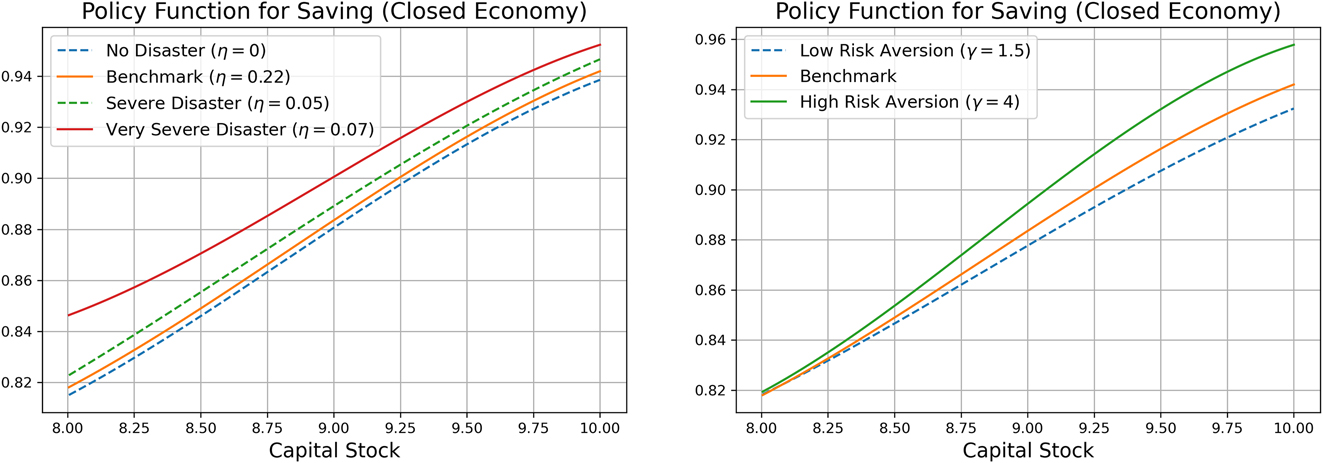
Policy functions for domestic saving (investment) (closed economy). Note: The policy functions are plotted against the capital stock (K) for the case of no disaster
The right panel of Figure 5 shows the policy functions for households’ saving for different values of γ. As households become more risk-averse, they increase domestic saving across the capital stock, which is consistent with the Figure 4, showing that the long-run average capital and output for the high risk aversion case are higher than those under the low risk aversion case (γ = 2). This figure, therefore, highlights the important role of precautionary saving in determining the long-run capital stock in a closed economy.
In the Appendix B we present the policy functions for additional two scenarios: (i) varying frequencies of natural disaster and (ii) different degrees of persistence of natural disaster crises for the closed economy case. The main takeaway from the Appendix B is that as natural disasters become more harmful, whether through increased frequency or persistence, the eventual determination of the average long-run capital stock for the closed economy depends on the relative magnitudes of the increase in investment and the decrease in capital stock resulting from natural disasters.
3.2.3 Sensitivity Analysis with Respect to Intensity of Natural Disaster under Different Types of Capital Market Openness
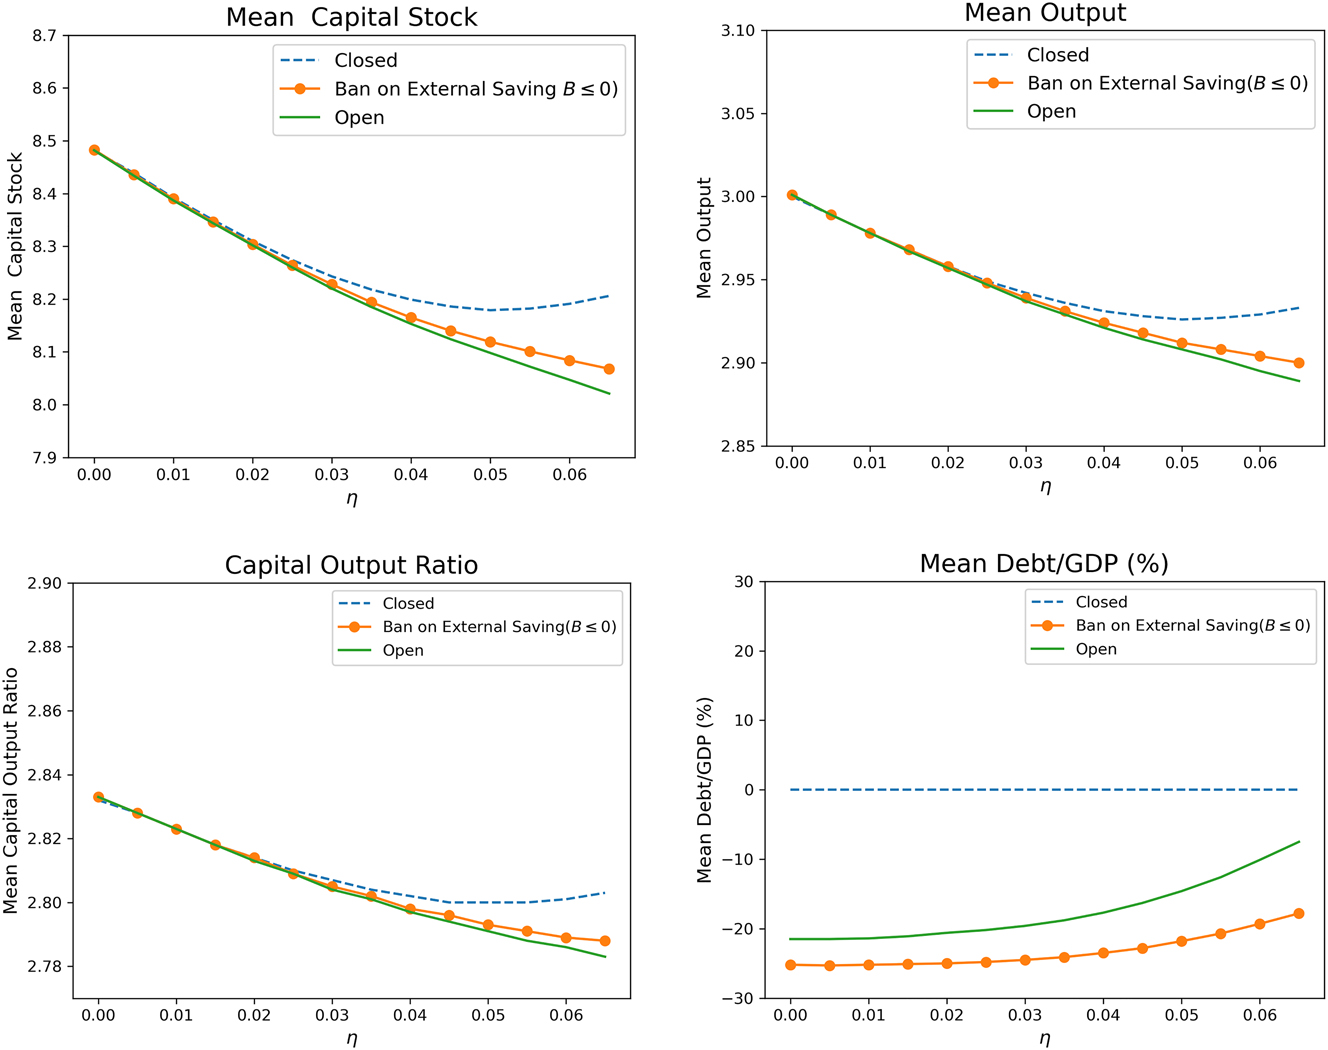
In this section, we conduct a sensitivity analysis with respect to the intensity of natural disasters, η, under different types of capital market openness, to investigate the long-run macroeconomic effects of natural disaster risk. Besides η, all other parameters are set to those in the baseline calibration. Figure 6 shows the simulation results. The blue dashed line, orange line with circles, and green solid line, respectively, denote the cases of a closed economy, a small open economy with a complete ban on external saving, an extreme form of quantity-based capital control policy intended to curb capital flight associated with natural disasters,[12] and the small open economy case with full access to the international financial markets as in the benchmark model.
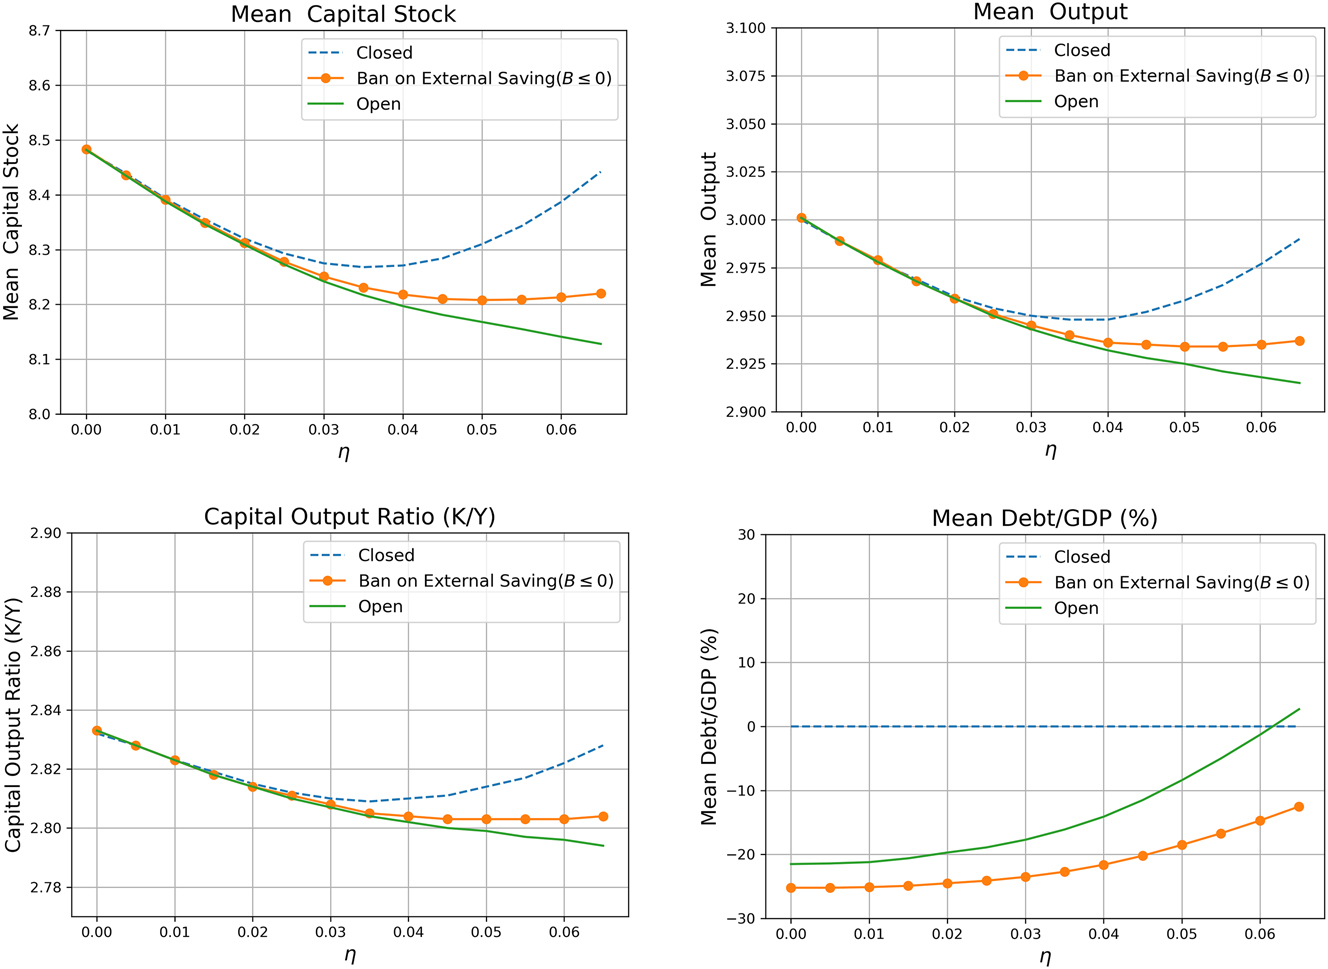
Sensitivity analysis w.r.t intensity of natural disasters under different types of capital market openness. Note: η denotes the intensity of natural disasters, the fraction of the existing capital stock destroyed when a natural disaster shock hits the economy. In a closed economy, the external debt to GDP ratio is, by definition, zero.
As with the closed economy case, the long-run average capital stock, capital output ratio, and output for the case of the ban on external saving (orange line) exhibit a “U” shape, even if it has less curvature compared to that of the closed economy, with respect to the intensity of natural disasters. This indicates that even in a partially open economy, households increase precautionary savings in the face of increasingly devastating natural disasters, and that a government’s policy which completely bans capital flight can contribute to domestic capital accumulation when natural disasters are severe. In contrast, when households have full access to the international financial markets, the long-run capital stock, capital-output ratio, and output monotonically decrease with the intensity of natural disasters. Moreover, for values of η above 0.06, the small open economy gets to become a net lender
The government’s policy of banning external saving while still allowing external borrowing does not increase the long-run domestic capital stock as significantly as in a closed economy (i.e., less pronounced U-shape), in which both external borrowing and saving are not allowed, when the natural disasters are severe. This indicates that an option to borrow externally is also important for households’ incentives for domestic capital accumulation.
In a closed economy capital is not only a factor of production, but also a consumption smoothing vehicle, with which households can increase households’ consumption through de-investment. Figure 7 plots the mean long-run capital stock for the closed economy case with different costs of de-investment (i.e., I < 0), using the same value of the parameter determining the cost of capital accumulation (I > 0) as in the benchmark calibration. That is, for the capital adjustment cost function-
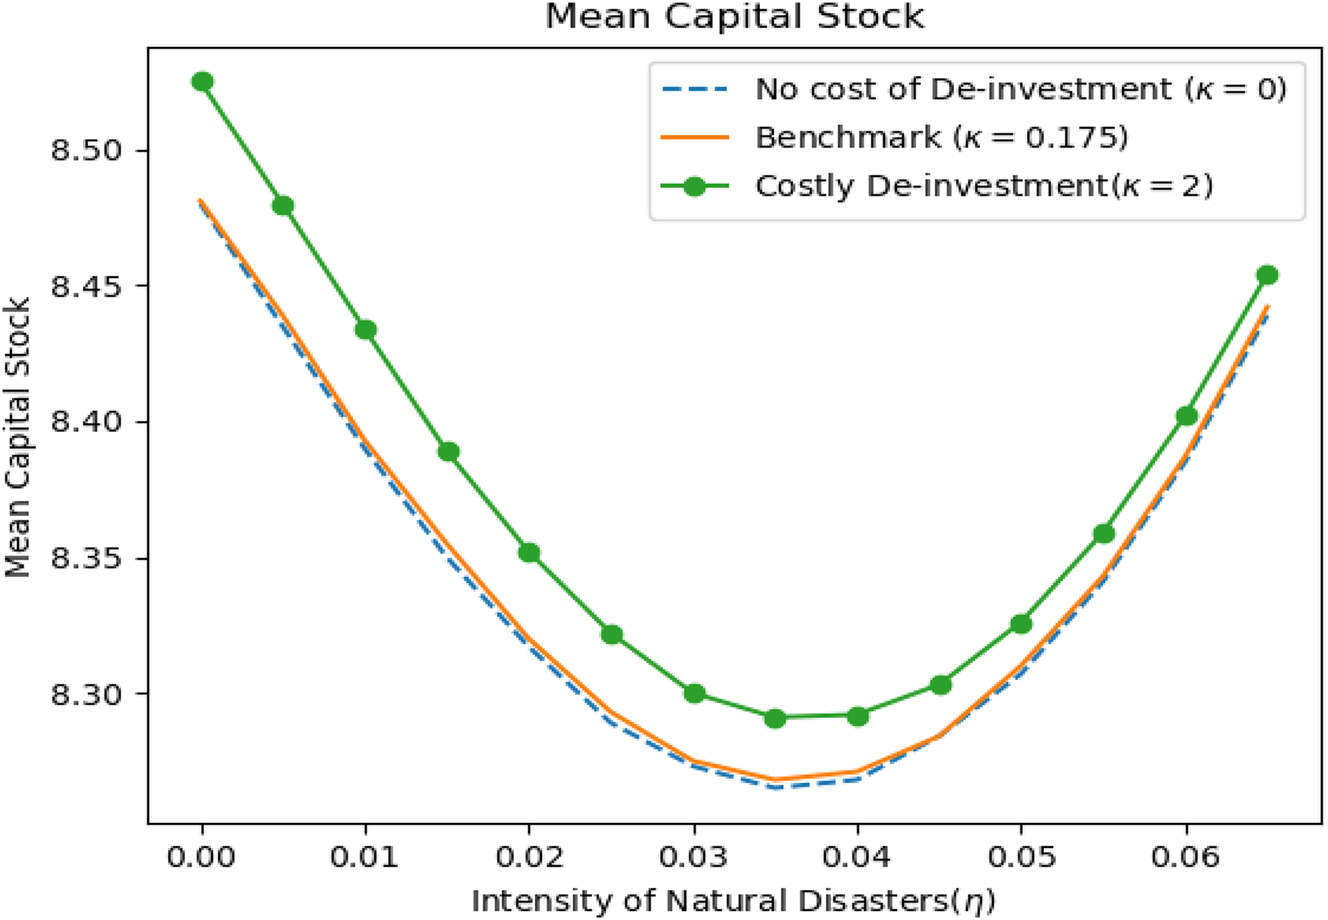
Long-run capital stock for different values of costly De-investment (closed economy case).
Figure 8 plots the value function
![Figure 8:
Comparison of value functions under different types of capital market openness. Note: The figure shows the value functions
E
Z
V
A
t
,
Z
t
ϵ
,
K
t
,
B
t
${E}_{Z}\left[V\left({A}_{t},{Z}_{t}^{{\epsilon}},{K}_{t},{B}_{t}\right)\right]$
for the three different types of capital market openness. The expectation is taken over Z using the stationary probability that a natural disaster shock occurs. A, B, and K are, respectively, set to 1, 0, and 8.48-the mean capital stock for the case of no natural disaster.](/document/doi/10.1515/bejm-2024-0040/asset/graphic/j_bejm-2024-0040_fig_008.jpg)
Comparison of value functions under different types of capital market openness. Note: The figure shows the value functions
Given that both the closed economy model and the model with a government’s capital control on external saving exhibit higher average output and capital stock than the small open economy, this result implies that the “forced” investment of the household’s saving into domestic capital serves to increase domestic capital, but at the same time it causes economic inefficiency, especially distorting households’ inter-temporal allocative efficiency as represented by the standard Euler equation.[14] This result is in line with Liu, Spiegel, and Zhang (2021), which finds that the Chinese government’s capital control policy has contributed to China’ economic growth by bolstering domestic industries, albeit at the cost of household welfare.
Appendix A we presents the business cycle and long-run moments, and the sensitivity analysis with respect to the intensity of natural disasters for the case of an i.i.d natural disaster shock, the case aimed to model rapid-onset natural disasters like earthquakes. Even with the i.i.d shock, we have qualitatively similar results. However, compared with the case of the benchmark persistent disasters, we find that the business cycles become more stable, and that households engage less precautionary saving for the i.i.d shock case. Since the i.i.d disaster shock case entails a lower recurrence probability of natural disasters, households are less concerned about a significant income loss during a disaster crisis. In the Section 3.3, in which we investigate the natural disaster’s short-run macroeconomic effects, we find that depending on the persistence of the disaster shock, households show different optimal saving/investment decisions during the natural disaster crises.
3.3 Short-Run Macroeconomic Dynamics Around Natural Disaster Crisis under Different Types of Capital Market Openness
Noy (2009) empirically investigates the short-run output cost of natural disasters and finds that for the emerging market economies, a one standard deviation increase in the intensity of natural disasters is associated with a reduction in the annual output growth rate by 9 percentage points following the disaster. Noy (2009) argues that this output cost is excessively large, far beyond what could be predicted by a standard growth model. Noy (2009) also discovers that the output cost of natural disaster increases with the degree of capital account openness, using the Chinn-Ito index (Chinn and Ito 2008) as a proxy. Given that empirical growth studies typically associate a high degree of capital account openness with positive economic output/growth, this latter finding can be puzzling, although Noy (2009) conjectures that capital flight during natural disaster crises can be a culprit.
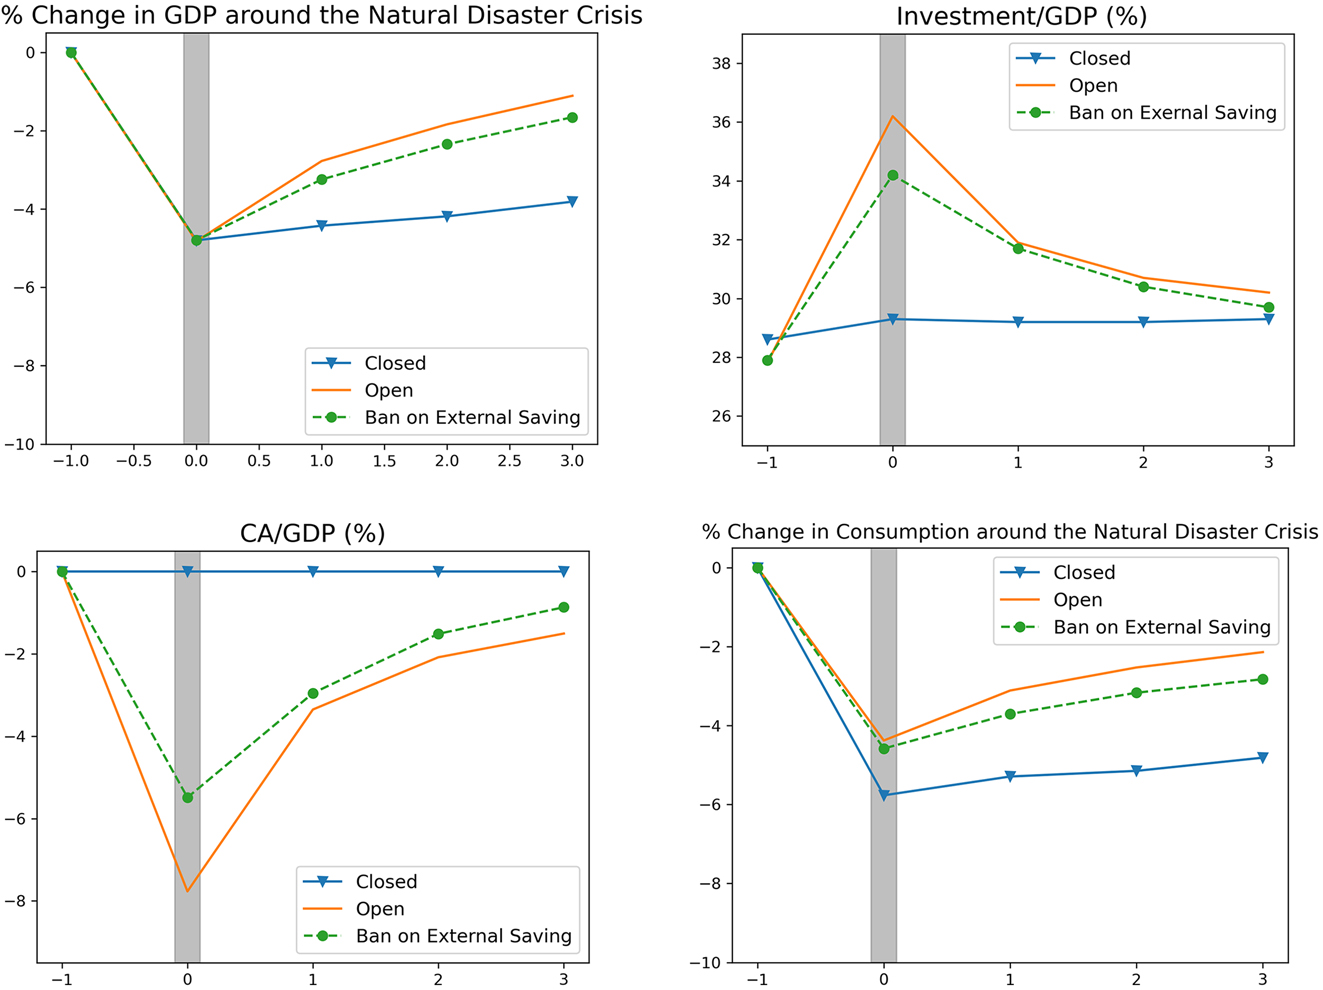
To investigate the short-run macroeconomic dynamics around natural disaster crises, we employ event study techniques to simulated time series data. The top left panel of Figure 9 plots the model’s average path of percentage changes in GDP relative to the level at period −1 around the natural disaster crisis. The event window spans 5 years, with the natural disaster crisis normalized to date 0 (shaded area in the figure). At period 0, a severe natural disaster shock with η being 0.07 is fed into the model, hitting the model economy. All the variables at period −1, such as output, capital stock (K −1), and TFP shock are set to their mean values from the stochastic steady state of the model economy. We simulate the model for 1000 times using the TFP and Natural disaster shock processes and the optimal policy functions for the endogenous variables in the model, and the value at each period is the average of the 1000 simulated points. Hence the top left panel of the Figure 9 represents the average behavior of percentage changes in output around the natural disaster crisis, given that the model was at the stochastic stationary state at period −1. The blue solid line with triangles, solid orange line and green dashed line with circles, respectively, denote the cases of a closed economy, a small open economy with full access to international financial markets and a small open economy with a ban on external saving with the aim of preventing capital flight resulting from natural disasters.
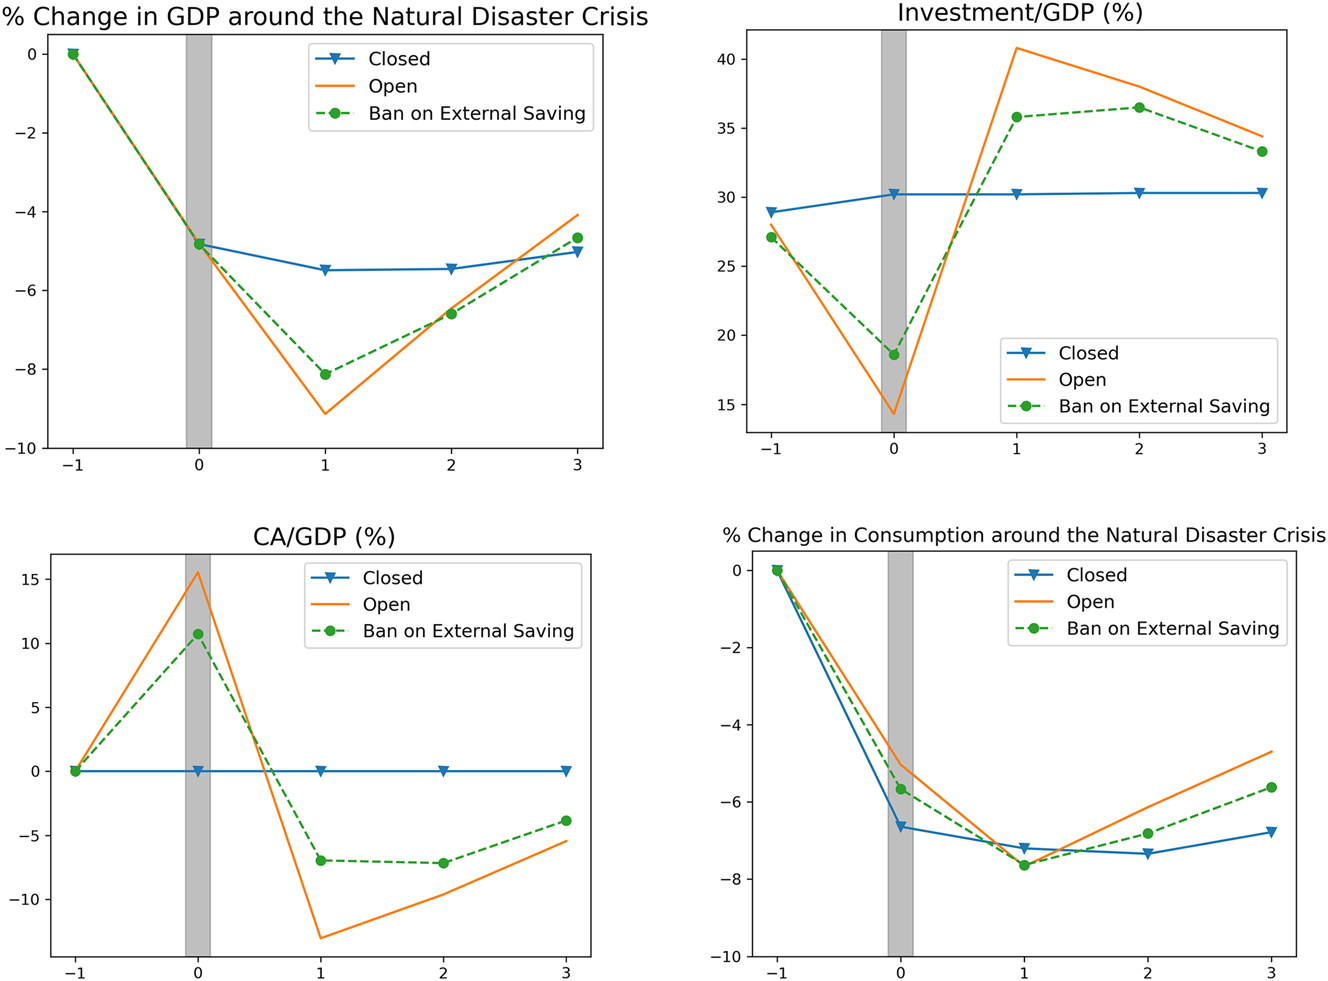
Short-run macroeconomic dynamics around natural disaster crisis under different types of capital market openness. Note: at t=0 (grey bar), the natural disaster shock with η = 0.07 hits the model economy. The simulated line represents the average of 1000 data points, each simulated for the relevant variable for every period under consideration. For the closed economy, the current account over GDP is zero by definition. For the investment and current account, the ratios of investment to GDP (I/Y) and the current account to GDP (CA/Y) are plotted. For the GDP and consumption, we plot their percentage changes from the steady state values.
At period 0, when the natural disaster shock hits the economy, output decreases by about 4.8 % in all cases; this nearly uniform decrease is attributed to the fact that the capital stock at period 0 (K
0) was chosen in advance at period −1, and that at period −1, all the variables are set to the mean values from the ergodic distributions. This results in almost the same K
0 using the optimal policy function for capital (
However, at period 0, investment shows significantly different behaviors across the models with different types of capital account openness. It should be noted that at t=0, households are aware that due to the persistence of the natural disaster shock, there is a substantial likelihood of its recurrence in the next period (t=1). With the possible impending natural disaster, households in the economies with certain access to the international financial markets substantially reduce their investment and move their resources out of the country (i.e. capital flight); they rather wait now and want to replenish the destroyed domestic capital once the natural disaster has finally ended. The substantial decrease in domestic investment leads to a significant drop in the GDP at period t=1, about 9 % decrease from the mean value of GDP at period −1. In other words, households’ capital flight in anticipation of an impending natural disaster results in a sharp decrease in output at period 1 through a sharp decrease in domestic investment at period 0. The magnitude of this decrease in GDP is comparable to the empirical estimate of Noy (2009), which argues that this large GDP decrease is far beyond what could be predicted by a standard growth model. However, our model predicts that capital flight can really exacerbate the short-run output cost of natural disasters through a sharp decrease in domestic investment, when natural disasters are persistent.
Households’ capital flight can be seen in a surge in the current account (the bottom left panel) for all the open economy cases except for the closed economy.[15] Among the open economy models, the output decline is the largest for the case of the open economy with full access to international financial markets (the orange solid line), because the households have no restrictions on moving their resources in and out of the country. On the other hand, for the case of the closed economy, which must finance its investment with its own saving, it does not reduce its domestic investment at the time of the natural disaster; it rather slightly increases its investment to replenish the capital stock destroyed from the natural disaster: its cannot rely on external borrowing to replenish the destroyed capital. As a result, output in the closed economy does not decrease as sharply at the period following the natural disaster (t=1) compared to the cases of the open economies.
This result is consistent with Noy (2009)’s two puzzling empirical findings regarding the short-run output cost of natural disasters: i) The short-run output cost of natural disaster is very large. ii) Capital market openness adversely affects the output cost of natural disasters. With access to international financial markets, whether full or partial, households, being aware of the recurring likelihood of natural disasters, have a strong incentive for capital flight, which in turn exacerbates the output cost of natural disasters.
3.3.1 When the Natural Disaster Shock is not Persistent
We conduct the same event study using an i.i.d natural disaster shock (i.e., no persistence in the natural disaster shock process), aimed to model rapid-onset natural disasters like earthquakes as opposed to the persistent natural disaster shock for slow-onset natural disasters. Figure 10 shows the results, and these results with an i.i.d disaster shock are sharply contrasted with those with a persistent disaster shock. In particular, when the natural disasters are not persistent, households do not delay their investment upon the economy being hit by a natural disaster, in contrast to their response to a persistent disaster shock. The GDP immediately rebounds at t=1, not further decreasing as in the case of the persistent shock. For the two open economy cases, the current account sharply decreases at the time of natural disasters, as households significantly borrow from abroad to finance immediate domestic investment to replenish the destroyed capital stock. That is, when the disaster shock is not persistent, we do not observe capital flight. This result indicates that capital control policies, which aim to ban capital flight, can mitigate the short-run output costs of natural disasters, only when they are persistent.
Macroeconomic dynamics around natural disaster crisis (i.i.d natural disaster shock). Note: at t=0, the natural disaster shock with η = 0.07 hits the model economy. For the closed economy, the current account over GDP is zero by definition. For the investment and current account, the ratios of investment to GDP (I/Y) and the current account to GDP (CA/Y) are plotted. For the GDP and consumption, we plot their percentage changes from the steady state values.
4 Empirical Evidence
4.1 Suggestive Empirical Evidence Supporting the Main Prediction of the Model
The main prediction of our model is that the capital market openness negatively affects physical capital accumulation for those countries facing severe natural disaster risk (left bottom panel of Figure 6). In this subsection, we provide suggestive empirical evidence supporting our main prediction of model, with a focus of the role of capital market openness in capital accumulation.
Figure 11 shows the scatterplots of capital-output ratio (K/Y) against the Chinn-Ito index for emerging market economies with high natural disaster risk for the last four decades (1980s, 1990s, 2000s, and 2010s). The Y-axis is the 10-year average capital output ratio (K/Y), and X-axis is the 10 year average of the Chinn-Ito index for the respective decade. There are nineteen emerging market countries[16] in the sample, which are classified as high natural disaster risk countries by the INFORM Risk Index,[17] a global open-source risk assessment for humanitarian crises and disasters developed by the Inter-Agency Standing Committee Reference Group. The INFORM Risk Index assesses natural disaster risk for 191 countries worldwide and creates an index for natural hazards ranging form 0 to 8, with 8 indicating the highest natural hazard risk. Countries with an index score of 6 or higher are considered to have high natural disaster risk. The figure shows that there is a negative association between the degree of capital market openness and capital-output ratio across the last four decades.
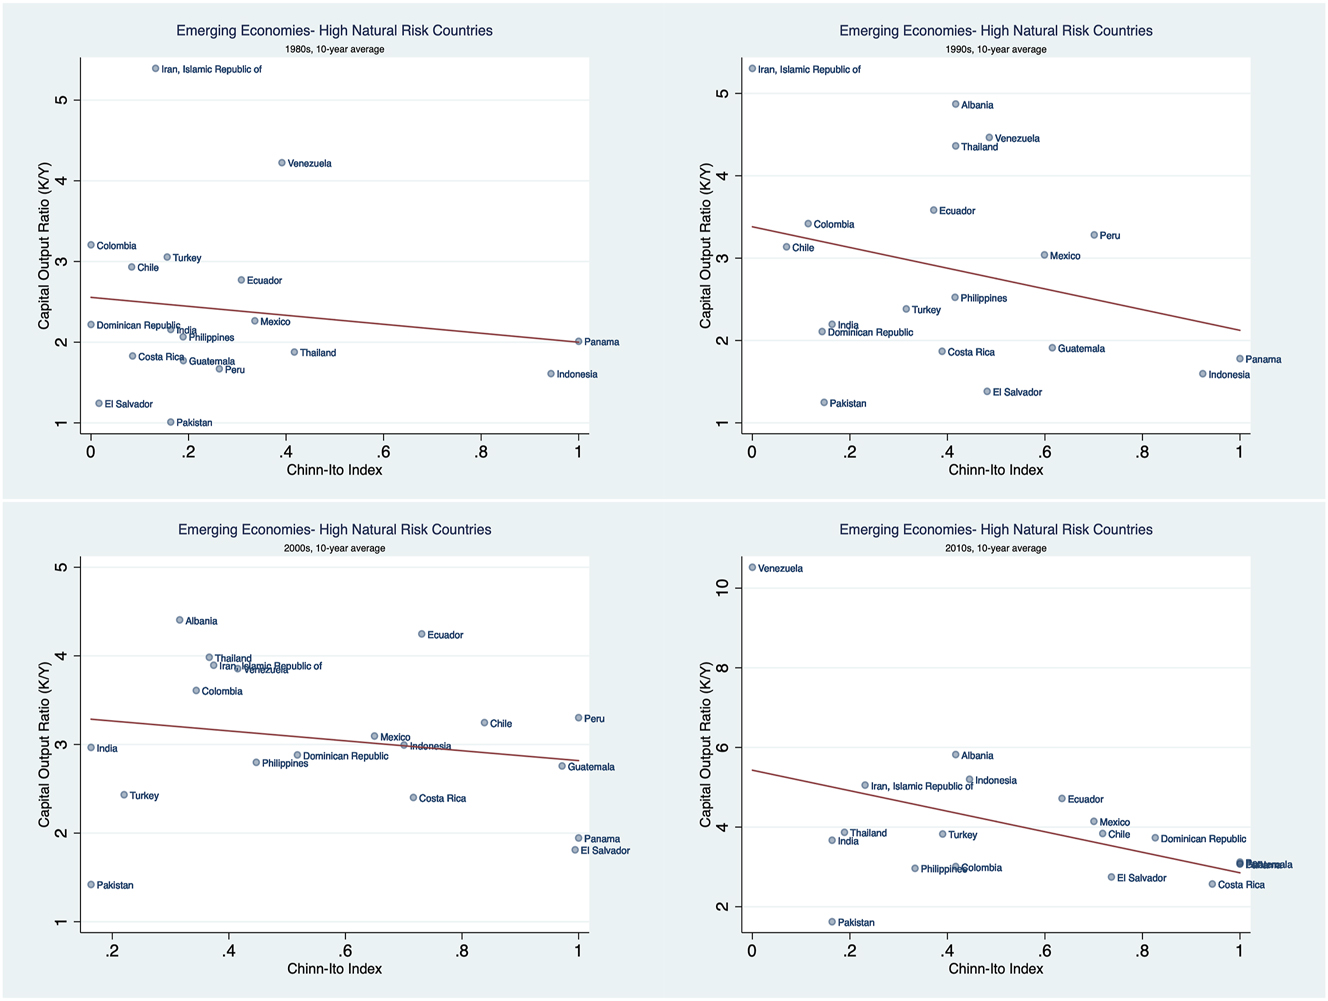
Scatterplot of K/Y against capital market openness. Note: We also conducted three regression analyses for 95 countries classified as emerging market economies, as identified by the IMF in the October 2022 Fiscal Monitor. The three regression models are as follows.
i denotes a country, t a decade, (K/Y) i,t the 10 year average of capital output ratios for the country i and during the decade t. μ t is a time fixed effect and μ i a country fixed effect. KAO i,t represents the 10 year average of Chinn-Ito index, which measures the degree of capital market openness. NH i is the natural hazard risk index for country i, as provided by the INFORM Risk Index. D i is a dummy variable indicating whether the country faces high natural disaster risk, taking a value of one when NH i ≥ 6.
The main estimated coefficient of interest is β 1 in the second and third regression equation (eq (14) and (15)). The negative value of β 1 aligns with our model’s prediction: capital market openness exacerbates the negative effect of natural disaster risk on capital accumulation.
Table 3 reports the regression results. The first regression result shows that there is a negative association between both natural disaster risk and capital market openness and capital accumulation. These results are consistent with our model’s prediction that natural disasters and capital market openness generally have a negative effect on capital accumulation. It must be noted that there is no consensus in the empirical literature that capital market openness has a positive effect on economic growth or capital accumulation (Bonfiglioli 2008; Damasceno and Guedes 2024; Kose et al. 2006), although these studies do not control for a country’s natural disaster risk.
Regression Results (Dependent Variable: 10-year average of K/Y).
| Model 1 | Model 2 | Model 3 | |
|---|---|---|---|
| NH | −0.0765*** | ||
| (0.0139) | |||
| KAO | −0.637*** | −0.335 | −0.753*** |
| (0.0818) | (0.247) | (0.0975) | |
| KAO × NH | −0.108** | ||
| (0.0501) | |||
| KAO × D | −0.282* | ||
| (0.170) | |||
| Time fixed effect | ✓ | ✓ | ✓ |
| Country fixed effect | ✓ | ✓ | |
| Observations | 2,980 | 2,980 | 2,980 |
| Number of countries | 95 | 95 | 95 |
| R-Squared | 0.167 | 0.724 | 0.723 |
-
Standard errors in parentheses. ***p<0.01, **p<0.05, *p<0.1.
The estimated coefficient of β 1 on the interaction term between capital market openness and natural disaster risk (Model 2: KAO × NH) is negative at the 5 % level. That is, capital market openness exacerbates the negative effect of natural disaster risk on capital accumulation. Moreover, the estimated coefficient of β 1 on the interaction term (Model 3:KAO × D) is also negative at 10 % level. This result is also consistent with our model’s prediction that for the countries facing with high natural disaster risk, capital market openness negatively impacts capital accumulation.
4.2 Why We don’t Observe a Negative Long-Run Relationship Between Natural Disasters and Long Run Capital Stock/Economic Output?
The sensitivity analysis in the subsection can provide an explanation to the puzzling empirical finding in the literature: lack of observed negative long-run relationship between natural disasters and long-run capital stock/economic output. Skidmore and Toya (2002) [18] among others find that in the cross-country empirical analysis over the period from 1960 through 1990, there is a positive correlation or a non-significant correlation between natural disaster risk and the long-run physical capital stock/economic growth, after controlling for economic variables considered to be important in the empirical growth literature. They suggest that this finding is puzzling, because a high risk of capital destruction due to natural disasters should reduce physical capital investment and therefore, curtail the long run capital stock.
Since the mid-1980s, an increasing number of countries have started to liberalize their capital accounts, opening up to international financial markets, but to varying degrees as indicated in Chinn and Ito (2008) and Fernández et al. (2016). Our model predicts that when an economy has full access to international financial markets, its long-run capital stock/output is negatively associated with the intensity of natural disasters as many researchers expected, but that with partial or no access to international financial markets, the relationship between natural disasters and long-run capital stock/output can be positive or negative, depending on the level of the intensity of natural disasters as in the “U” shape of the long-run capital stock/output (Figure 6). During the sample period from 1960 through 1990 in Skidmore and Toya (2002), most countries exhibited limited degrees of capital account openness as in Figure 12, and for those countries in the sample, our model predicts a non-linear relationship between natural disasters and the long-run capital stock/output.
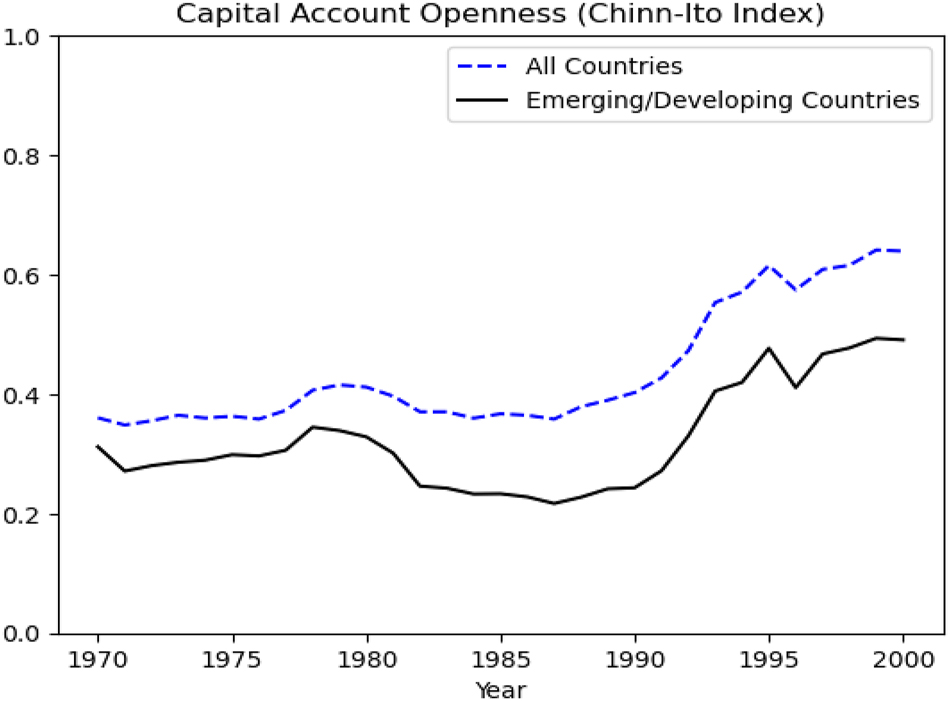
Average Chinn-Ito index for countries in Skidmore and Toya (2002)’s sample during 1970–2000. Note: All countries refer to the subset of 50 countries in Skidmore and Toya (2002)’s sample that have an available Chinn-Ito index (Chinn and Ito 2006), and the blue dashed line represents the average Chinn-Ito index for the 50 countries spanning the years 1970 through 2000. Emerging/developing countries are the 34 countries in the sample, classified by IMF as emerging market economies or developing countries. A value of one in Chinn-Ito index indicates that the capital account restrictions are non-existent.
5 Conclusions
We investigate the macroeconomic effects of natural disasters using a quantitative RBC model with a focus on their impact on capital accumulation. Natural disasters can have non-linear effects on domestic capital accumulation, through their two opposing effects on households’ incentive for capital accumulation. On the one hand, both directly and indirectly, they hurt domestic capital accumulation due to their destructive nature. On the other hand, a high natural disaster risk leads households to increase precautionary saving, which can increase domestic capital stock when it is invested domestically. Our quantitative results shows that depending on the types of capital market openness, there can be a negative or positive relationship between the intensity of natural disasters and long-run capital stock, and thus a negative or positive relationship between the intensity of natural disasters and long-run economic output. This result can provide an explanation to Skidmore and Toya (2002)’s puzzling empirical finding. Moreover, in the event study analysis on the short-run macroeconomic dynamics during the natural disaster crises, we find that capital flight during the natural disaster crises can exacerbate output costs of the natural disasters. This finding is also in line with Noy (2009)’s finding that capital market openness exacerbates the output cost of natural disasters.
Our results can have policy implications for governments of countries of high natural disaster risks. A capital control policy which bans capital flight can contribute to domestic capital accumulation in the long-run, but it comes at the expense of household welfare. When natural disasters are persistent, the capital control policy which bans capital flight can mitigate the short-run output costs of natural disasters.
Funding source: R. K. Cho Research Cluster Program
Award Identifier / Grant number: R. K. Cho Research Cluster Program
Acknowledgements
JungJae Park is grateful for the financial support from Yonsei university (New Faculty Research Seed Funding (2021–2024)).
Appendix A: Quantitative Results for the Case of I.I.D Natural Disaster Shock
In Appendix A, we present the main quantitative results for the case of an i.i.d natural disaster shock, the case aimed to model rapid-onset natural disasters like earthquakes. We modify the Markov chain for the natural disaster shock so that the shock process is i.i.d, and that the unconditional probability of a natural disaster shock occurring is maintained at 5 % (once every 20 years), the same as in the benchmark model. Apart from the degree of the persistence in the natural disaster shock process, we use the same values for all other parameters as in the benchmark model. The main findings are as follows.
First, when the natural disaster shock process exhibits no persistence, (i.e., the occurrence of a natural disaster shock in the current period does not increase the likelihood of the shock recurring in the subsequent period.), the business-cycle and long-run moments are relatively stable compared to those of the benchmark case (Table 4). Notably, the investment volatility is significantly lower than that of the benchmark case.
Business cycle and long-run moments from simulations (i.i.d disaster Shock).
| (I) Baseline (η = 0.022) | (II) No disaster (η = 0) | (III)η = 0.01 | (IV)η = 0.05 | (V)η = 0.07 | (VI) Frequent disaster | |
|---|---|---|---|---|---|---|
| σ(Y) | 3.94 | 3.91 | 3.92 | 4.05 | 4.17 | 3.97 |
| σ(C)/σ(Y) | 0.67 | 0.66 | 0.66 | 0.69 | 0.71 | 0.68 |
| σ(I)/σ(Y) | 3.63 | 3.62 | 3.61 | 3.76 | 3.90 | 3.66 |
| E(Y) | 2.96 | 3.00 | 2.98 | 2.91 | 2.88 | 2.90 |
| E(C) | 2.10 | 2.13 | 2.11 | 2.06 | 2.05 | 2.05 |
| E(K) | 8.30 | 8.48 | 8.39 | 8.09 | 7.99 | 8.09 |
| E(K/Y) | 2.81 | 2.83 | 2.82 | 2.79 | 2.78 | 2.79 |
| E (B/Y) | −20.6 % | −21.5 % | −21.4 % | −14.6 % | −4.55 % | −19.7 % |
-
Y, C, I, K, and B respectively denote GDP, consumption, investment, capital stock, and external bond holdings. When computing the volatility (σ), all variables are HP-filtered with a smoothing parameter of 100. E(x) is the mean value of x obtained from the ergodic distribution from simulation.
Second, since the i.i.d disaster case entails a lower recurrence probability of natural disasters, households are less concerned about a significant income loss during a crisis. Consequently households facing an iid shock tend to engage less precautionary saving compared to the case of the persistent shock. This households’ behavior results in increased external borrowing and a reduced level of the long-run capital stock (Table 4). Furthermore, in the case of the severe natural disaster shock (η = 0.07), we do not observe capital flight as seen in the benchmark case (5th column of Table 4).
Third, the sensitivity analysis with respect to the intensity of natural disasters (Figure 13) shows that due to a lesser degree of households’ precautionary saving, the long-run capital stock for the closed economy exhibits a less pronounced “U” shape. Additionally households tend to borrow more from abroad.
Sensitivity analysis w.r.t intensity of natural disasters (I.I.D disaster shock).
Business Cycle and Long-Run Moments (Small Open Economy Case)
Appendix B: Policy Functions for Saving and Investment under Different Scenarios
In Appendix B, we present the policy functions for saving and investment for the cases of i) different frequencies of natural disasters and ii) different degrees of persistence of natural disaster crises for the following three types of capital market openness: the small open economy, small open economy with a ban on external saving, and closed economy. The main takeaway from the Appendix B is that for the open economy cases, as natural disasters become more harmful, households increase domestic saving due to the precautionary motives but decrease investment, thus leading to a divergence between saving and investment. For the closed economy case, the relative strength of the two opposing forces affecting households’ incentives for capital accumulation determines the long-run capital stock.
Policy Functions for Saving and Investment w.r.t Frequency of Natural Disasters
Figure 14, 15, and 16 present policy functions for domestic saving and investment with respect to frequency of natural disasters under the three different types of capital market openness.
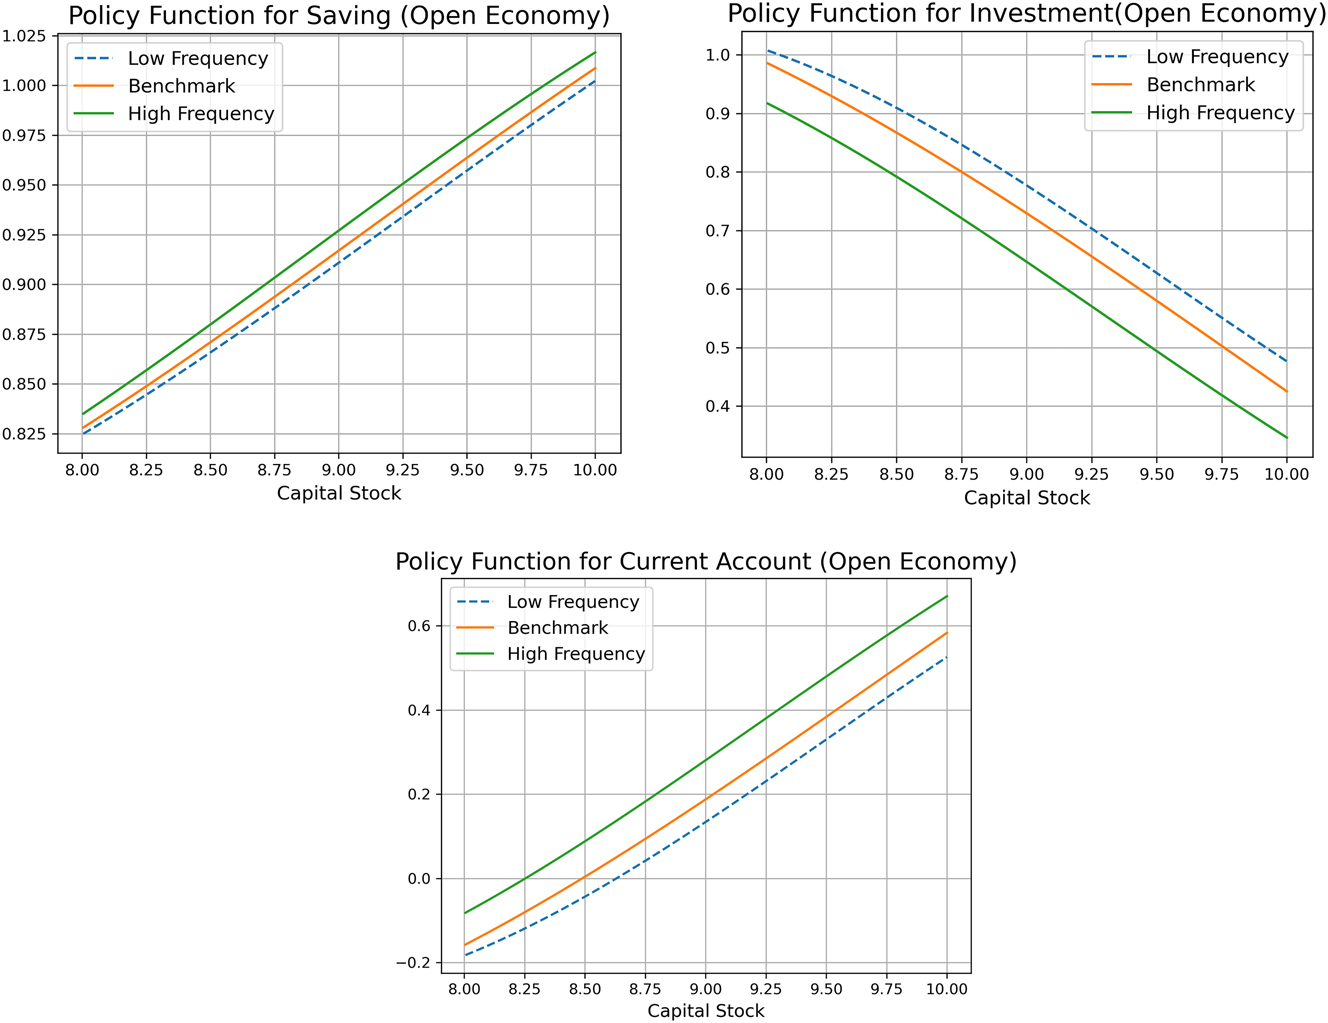
Policy functions for domestic saving (S=Y–C) and investment w.r.t frequency of natural disasters (small open economy). Note: The policy functions are obtained for the case of no disaster, fixing the bond holdings (B) and TFP shock (A) at their respective steady state values.
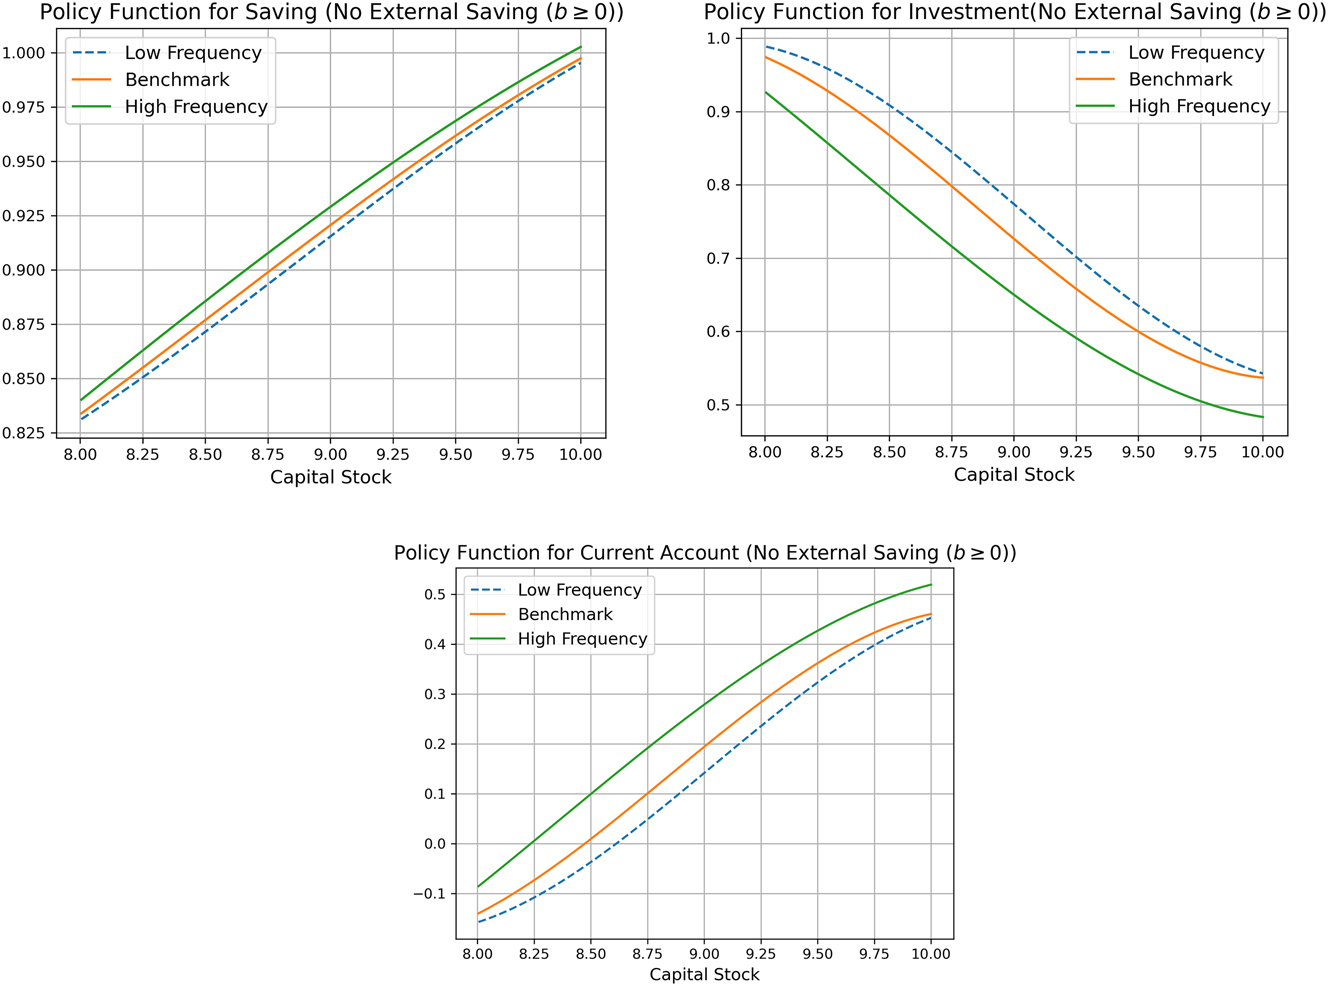
Policy functions for domestic saving (S=Y–C) and investment w.r.t frequency of natural disasters (open economy with ban on external saving). Note: The policy functions are obtained for the case of no disaster, fixing the bond holdings (B) and TFP shock (A) at their respective steady state values.
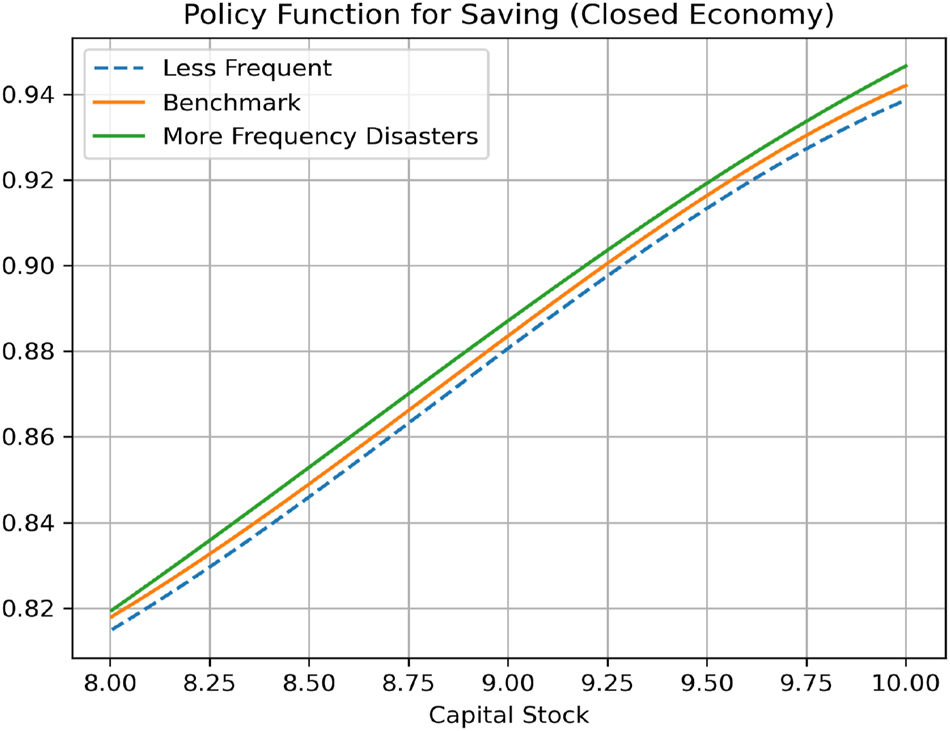
Policy functions for domestic saving (investment) w.r.t frequency of natural disasters (closed economy). Note: The policy functions are plotted against the capital stock (K) for the case of no disaster
Policy Functions for Saving and Investment w.r.t Persistence of Natural Disaster Crises
Figure 17, 18, and 19 present policy functions for domestic saving and investment with respect to the persistence of natural disaster crises under the three different types of capital market openness.
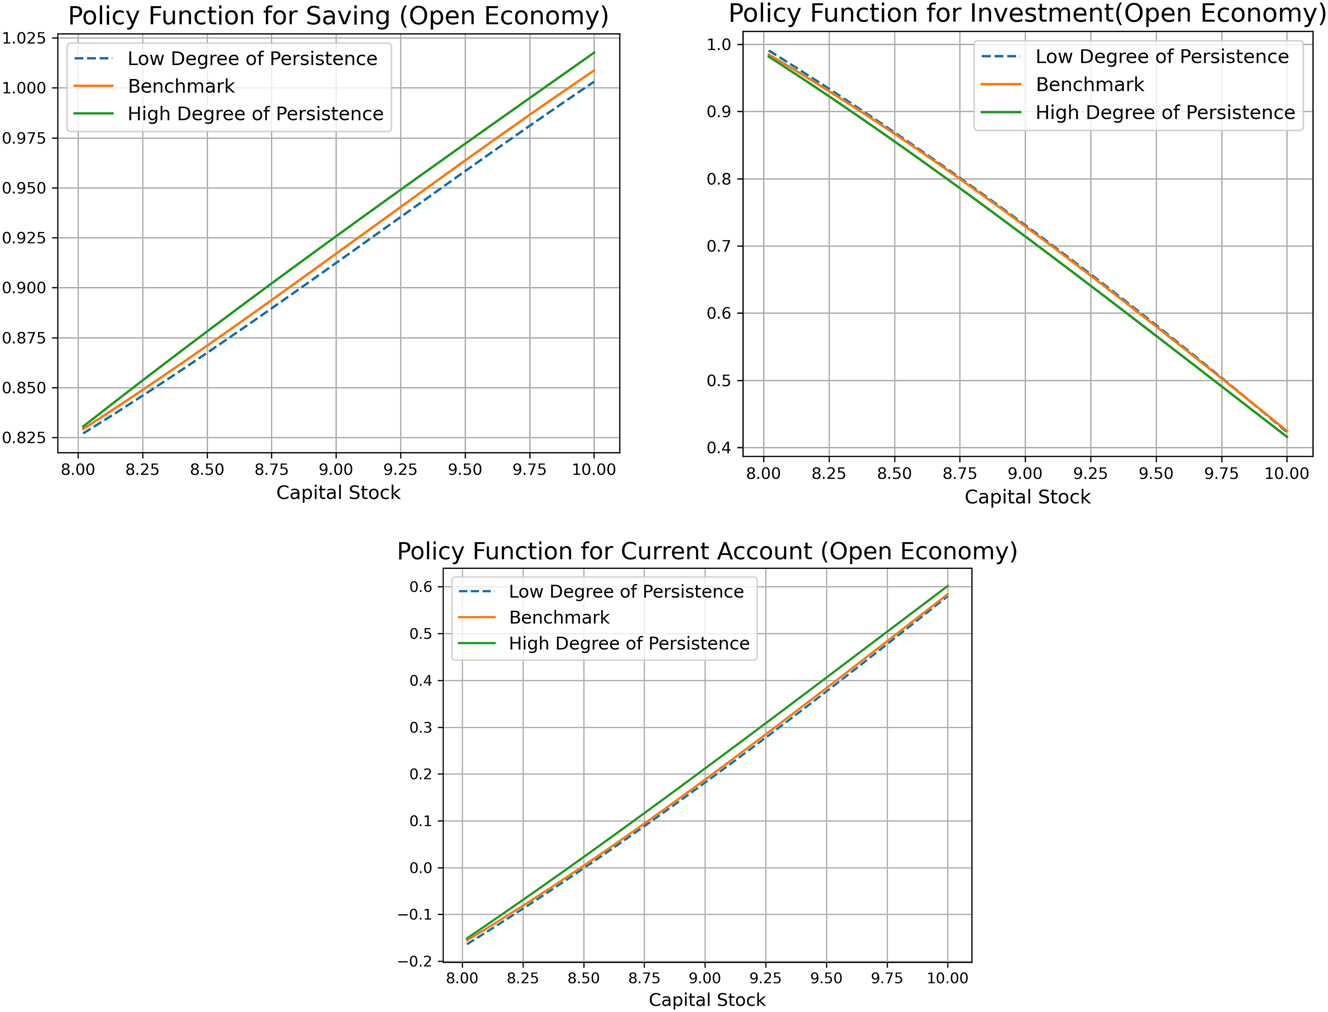
Policy functions for domestic saving (S=Y–C) and investment w.r.t persistence of natural disaster crises (small open economy). Note: The policy functions are obtained for the case of no disaster, fixing the bond holdings (B) and TFP shock (A) at their respective steady state values.
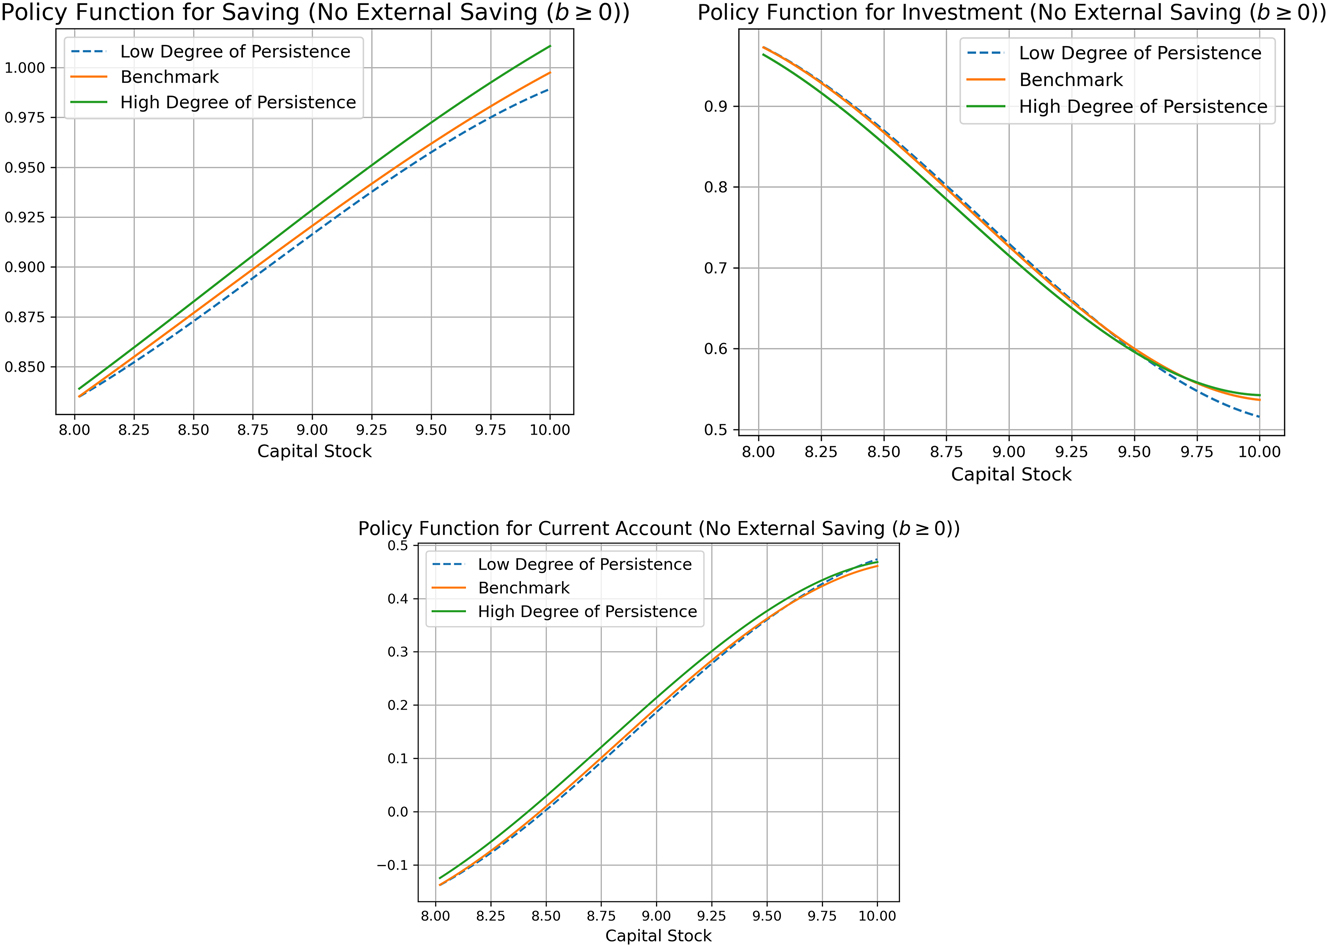
Policy functions for domestic saving (S=Y–C) and investment w.r.t persistence of natural disaster crises (open economy with ban on external saving). Note: The policy functions are obtained for the case of no disaster, fixing the bond holdings (B) and TFP shock (A) at their respective steady state values.
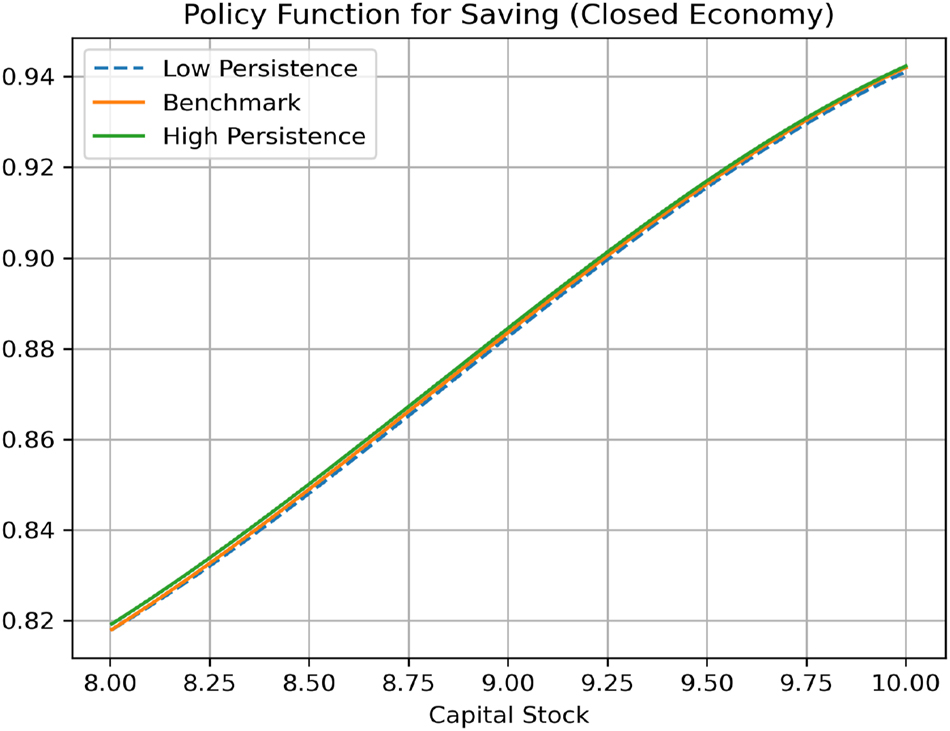
Policy functions for domestic saving (investment) w.r.t persistence of natural disaster crises (closed economy). Note: The policy functions are plotted against the capital stock (K) for the case of no disaster
References
Aiyagari, S. R. 1994. “Uninsured Idiosyncratic Risk and Aggregate Saving.” The Quarterly Journal of Economics 109 (3): 659–84. https://doi.org/10.2307/2118417.Search in Google Scholar
Bhargava, A., R. Bouis, A. Kokenyne, M. Perez-Archila, U. Rawat, and M. R. Sahay. 2023. Capital Controls In Times of Crisis–Do They Work? Washington D.C.: International Monetary Fund.Search in Google Scholar
Bonfiglioli, A. 2008. “Financial Integration, Productivity and Capital Accumulation.” Journal of International Economics 76 (2): 337–55. https://doi.org/10.1016/j.jinteco.2008.08.001.Search in Google Scholar
Boz, E., C. Daude, and C. B. Durdu. 2008. “Emerging Market Business Cycles Revisited: Learning about the Trend.” FRB International Finance Discussion Paper 927.10.2139/ssrn.1123981Search in Google Scholar
Cantelmo, A., G. Melina, and C. Papageorgiou. 2023. “Macroeconomic Outcomes in Disaster-Prone Countries.” Journal of Development Economics 161: 103037. https://doi.org/10.1016/j.jdeveco.2022.103037.Search in Google Scholar
Cavallo, E., S. Galiani, I. Noy, and J. Pantano. 2013. “Catastrophic Natural Disasters and Economic Growth.” Review of Economics and Statistics 95 (5): 1549–61. https://doi.org/10.1162/rest_a_00413.Search in Google Scholar
Chinn, M. D., and H. Ito. 2006. “What Matters for Financial Development? Capital Controls, Institutions, and Interactions.” Journal of Development Economics 81 (1): 163–92. https://doi.org/10.1016/j.jdeveco.2005.05.010.Search in Google Scholar
Chinn, M. D., and H. Ito. 2008. “A New Measure of Financial Openness.” Journal of Comparative Policy Analysis 10 (3): 309–22. https://doi.org/10.1080/13876980802231123.Search in Google Scholar
Damasceno, A. O., and D. R. Guedes. 2024. “Financial Openness, Capital Accumulation, and Productivity in Emerging and Developing Economies.” Economic Modelling 133: 106663. https://doi.org/10.1016/j.econmod.2024.106663.Search in Google Scholar
Epstein, G. A. 2005. Capital Flight and Capital Controls in Developing Countries. Cheltenham: Edward Elgar Publishing.10.4337/9781781008058Search in Google Scholar
Felbermayr, G., and J. Gröschl. 2014. “Naturally Negative: The Growth Effects of Natural Disasters.” Journal of Development Economics 111: 92–106. https://doi.org/10.1016/j.jdeveco.2014.07.004.Search in Google Scholar
Fernández, A., M. W. Klein, A. Rebucci, M. Schindler, and M. Uribe. 2016. “Capital Control Measures: A New Dataset.” IMF Economic Review 64: 548–74. https://doi.org/10.1057/imfer.2016.11.Search in Google Scholar
Fried, S. 2022. “Seawalls and Stilts: A Quantitative Macro Study of Climate Adaptation.” The Review of Economic Studies 89 (6): 3303–44. https://doi.org/10.1093/restud/rdab099.Search in Google Scholar
Gourio, F. 2012. “Disaster Risk and Business Cycles.” American Economic Review 102 (6): 2734–66. https://doi.org/10.1257/aer.102.6.2734.Search in Google Scholar
Greenwood, J., Z. Hercowitz, and G. W. Huffman. 1988. “Investment, Capacity Utilization, and the Real Business Cycle.” The American Economic Review: 402–17.Search in Google Scholar
Huggett, M., and S. Ospina. 2001. “Aggregate Precautionary Savings: When is the Third Derivative Irrelevant?” Journal of Monetary Economics 48 (2): 373–96. https://doi.org/10.1016/s0304-3932(01)00079-4.Search in Google Scholar
Ikefuji, M., and R. Horii. 2012. “Natural Disasters in a Two-Sector Model of Endogenous Growth.” Journal of Public Economics 96 (9-10): 784–96. https://doi.org/10.1016/j.jpubeco.2012.05.005.Search in Google Scholar
Isoré, M. 2018. “Changes in Natural Disaster Risk: Macroeconomic Responses in Selected Latin American Countries.” Economies 6 (1): 13. https://doi.org/10.3390/economies6010013.Search in Google Scholar
Isoré, M., and U. Szczerbowicz. 2017. “Disaster Risk and Preference Shifts in a New Keynesian Model.” Journal of Economic Dynamics and Control 79: 97–125. https://doi.org/10.1016/j.jedc.2017.04.001.Search in Google Scholar
Kose, M. A., E. S. Prasad, K. S. Rogoff, and S.-J. Wei. 2006. “Financial Globalization: A Reappraisal.” IMF Working Papers 2006 (189), https://doi.org/10.5089/9781451864496.001.Search in Google Scholar
Liu, Z., M. M. Spiegel, and J. Zhang. 2021. “Optimal Capital Account Liberalization in china.” Journal of Monetary Economics 117: 1041–61. https://doi.org/10.1016/j.jmoneco.2020.08.003.Search in Google Scholar
Loayza, N. V., E. Olaberria, J. Rigolini, and L. Christiaensen. 2012. “Natural Disasters and Growth: Going Beyond the Averages.” World Development 40 (7): 1317–36. https://doi.org/10.1016/j.worlddev.2012.03.002.Search in Google Scholar
Marto, R., C. Papageorgiou, and V. Klyuev. 2018. “Building Resilience to Natural Disasters: An Application to Small Developing States.” Journal of Development Economics 135: 574–86. https://doi.org/10.1016/j.jdeveco.2018.08.008.Search in Google Scholar
Mendoza, E. G. 1991. “Real Business Cycles in a Small Open Economy.” The American Economic Review: 797–818.Search in Google Scholar
Noy, I. 2009. “The Macroeconomic Consequences of Disasters.” Journal of Development Economics 88 (2): 221–31. https://doi.org/10.1016/j.jdeveco.2008.02.005.Search in Google Scholar
Raddatz, C. 2007. “Are External Shocks Responsible for the Instability of Output in Low-Income Countries?” Journal of Development Economics 84 (1): 155–87. https://doi.org/10.1016/j.jdeveco.2006.11.001.Search in Google Scholar
Sawada, Y. 2013. “The Economic Impact of Earthquakes on Households.” The Economic Impacts of Natural Disasters 250 (1), https://doi.org/10.1093/acprof:oso/9780199841936.003.0012.10.1093/acprof:oso/9780199841936.003.0012Search in Google Scholar
Skidmore, M. 2001. “Risk, Natural Disasters, and Household Savings in a Life Cycle Model.” Japan and the World Economy 13 (1): 15–34. https://doi.org/10.1016/s0922-1425(00)00056-6.Search in Google Scholar
Skidmore, M., and H. Toya. 2002. “Do Natural Disasters Promote Long-Run Growth?” Economic Inquiry 40 (4): 664–87. https://doi.org/10.1093/ei/40.4.664.Search in Google Scholar
Solow, R. M. 1956. “A Contribution to the Theory of Economic Growth.” Quarterly Journal of Economics 70 (1): 65–94. https://doi.org/10.2307/1884513.Search in Google Scholar
Tauchen, G. 1986. “Finite State Markov-Chain Approximations to Univariate and Vector Autoregressions.” Economics Letters 20 (2): 177–81. https://doi.org/10.1016/0165-1765(86)90168-0.Search in Google Scholar
Uribe, M., and S. Schmitt-Grohé. 2017. Open Economy Macroeconomics. Princeton: Princeton University Press.Search in Google Scholar
Van Aalst, M. K. 2006. “The Impacts of Climate Change on the Risk of Natural Disasters.” Disasters 30 (1): 5–18. https://doi.org/10.1111/j.1467-9523.2006.00303.x.Search in Google Scholar
van der Ploeg, F., and A. de Zeeuw. 2018. “Climate Tipping and Economic Growth: Precautionary Capital and the Price of Carbon.” Journal of the European Economic Association 16 (5): 1577–617. https://doi.org/10.1093/jeea/jvx036.Search in Google Scholar
© 2025 the author(s), published by De Gruyter, Berlin/Boston
This work is licensed under the Creative Commons Attribution 4.0 International License.
Articles in the same Issue
- Frontmatter
- Advances
- A Matter of Minutes: Unexpected FOMC Communication and Fed Credibility
- Do Firm-Level Shocks Generate Aggregate Fluctuations? A Cross-Country Analysis
- Financial Frictions at Entry, Average Firm Size, and Productivity
- Healthy Grands, Fertility and Pensions
- Contributions
- Robust Optimal Monetary Policies in Behavioral New Keynesian DSGE Models
- On the Impact of Fiscal Policy on Inflation: The Case of Fiscal Rules
- Gini in the Taylor Rule: Should the Fed Care About Inequality?
- Housing Booms and Busts: Dissecting Housing and MBS Markets Linkages
- Guardians of (In)Equality: Unmasking the Role of Military Spending in Shaping Income Inequality
- Natural Disasters and Capital Accumulation: The Role of Precautionary Saving and Capital Market Openness
- Short-Run Impacts of Floods: A Case Study from India