Earthquakes and Intertemporal Preferences: A Field Study in Italy
-
Giuseppe Attanasi
 ,
Patrizia Sbriglia
,
Patrizia Sbriglia

Abstract
In this paper, we report data drawn from a field study in an Italian region (Campania), where a disastrous earthquake took place in 1980. We rely on subjects’ responses to a questionnaire and on experimental measures. We compare the time preferences in two different samples, the first one constituted by subjects who directly experienced the earthquake and its aftermath effects, and the second one constituted by subjects who lived far away from the earthquake epicentre, but in urban areas with comparable socioeconomic features. Our aim is to test whether there are long run effects of environmental disasters on time preferences. We find significant differences, since individuals living close to the epicentre are more patient than subjects in the alternative sample, also controlling for risk aversion.
1 Introduction
Intertemporal preferences are a key factor in individuals’ utility functions and are widely studied in the economic fields of financial, investment, saving, and consumption decisions. Recently, the focus has been extended to areas concerning environmental changes, where long-term public policies are required, and individuals often face costly trade-offs between short and long-term consumption plans.
As far as environmental changes are concerned, however, individual discount factors are likely to be strongly affected by personal life experiences. For example, living in areas where health problems arising from environmental conditions are consistent, or where the probability of disastrous events is very high, may change individuals’ perspectives on life events and lead to a re-evaluation of time and priorities.
The Covid19 pandemics, the sudden and extreme climate changes or even the occurrence of natural disasters (earthquakes, volcanic eruptions, etc.) in the last decades have strongly increased the importance of testing the impact that such events may have on the individuals’ preferences and behaviour. While several works focus on the effects on altruism and cooperation (Pancotto, Giardini, and Righi 2024, in Italy), trust (Castillo and Carter 2011, in Honduras; Cassar, Healy, and Von Kessler 2017, in Thailand), and risk aversion (Reynaud and Aubert 2020, in Vietnam; Said, Afzal, and Turner 2015, in Pakistan, and Ingwersen, Frankenberg, and Thomas 2023, in India), few studies evaluate the impact on intertemporal preferences. In this context, Callen (2015) shows increased patience in the population hit by the Indian tsunami, while Cassar, Healy, and Von Kessler (2017) in Thailand, and Kuroishi and Sawada (2024) in Japan and in the Philippines report opposite evidence. However, empirical and behavioural studies are undertaken only a few years after the occurrence of the event, thus inducing a possible bias due to the emotional impact. In this paper, we assume a different perspective and report the data of a field study conducted in Italy in 2023 on subjects who experienced a significant natural disaster in 1980 (more than 40 years ago), that is, during the early stages of their lives. Therefore, we provide evidence on the long-term effects of catastrophes on time preferences.
Furthermore, we focus on a Western European country rather than on a developing country, where the population received effective and abundant recovery after the disastrous event. Hence, this work also meets the need of collecting data from various contexts, recognizing that economic conditions, liquidity constraints, ineffective recovery policies, and pre-existing levels of social capital may play an important role (Castillo and Carter 2011; Mackay, Mavisakalyan, and Tarverdi 2024). Our results suggest that environmental disasters may alter discount rates in a significant manner, since, in the long run individuals are more patient than subjects who did not experience the same event.
The outlay of the paper is as follows. Section 2 describes the field study, Section 3 the results, while Section 4 contains concluding remarks.
2 Field Study Design and Data Sample
The field study was run in Southern Italy in June, July and December 2023, in a territory where a disastrous earthquake took place in November 1980. It had a magnitude of 6.9 on the Richter scale, and almost destroyed 31 villages causing 2,735 deaths. The Italian National Institute of Geophysics and Volcanology compiled a list of towns hit by the earthquake according to the Mercalli scale and the Richter scale. Taking into account this list, we consider two treatments: Hit (subjects in the towns of Conza della Campania and Laviano, close to the epicentre: see the circle in Figure 1) and Not Hit (subjects in the towns of Piaggine and Monte San Giacomo, far from the epicentre: see the square in Figure 1).
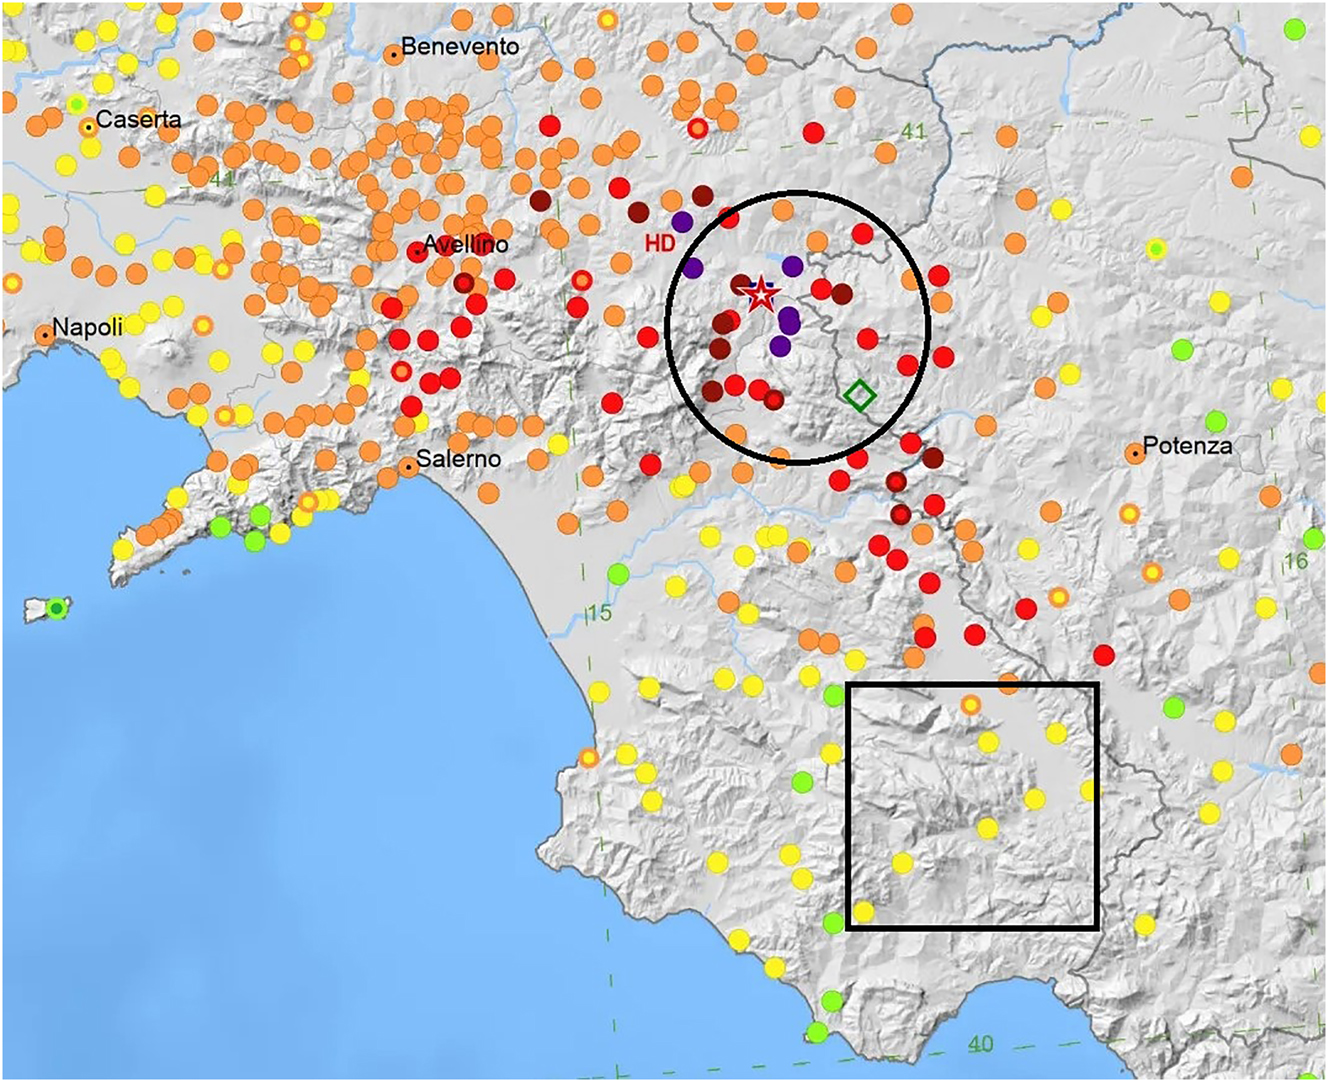
Earthquake’s destruction levels measured by the Mercalli Scale. Inside the circle, villages experienced high destruction (strong colours). Inside the square, villages experienced low destruction levels (light colours). The villages of Conza della Campania and Laviano are located inside the circle (hit by the earthquake), the villages of Monte San Giacomo e Piaggine are placed within the square (not hit by the earthquake). (Data source DBMI 15 – INGV).
Based on the results of the most recent Census, the population in the four urban areas ranges from roughly 1,200 in Piaggine to 1,400 in Monte San Giacomo, while it is 1,300 and 1,260 in Laviano and Conza della Campania, respectively. The distance between these small communities and the sea is over an hour by car. In terms of economic features, the percentages of employed individuals and those of workers in agriculture in the four urban areas are not statistically different. The only significant difference concerns the proportion of workers in the industrial sector, which is slightly greater in Conza della Campania.
We previously contacted the mayors of each village (and their teams), who assisted us in recruiting participants and organizing the experiments. Subjects were recruited by merely asking people on the street, in public meeting places, during local festivals, and in public buildings, while also distributing a brochure inviting to participate in the experiment. The final list of participants was compiled by verifying the ages of the subjects (between 55 and 85 years) and their residency in the village at the time of the earthquake; these verifications were made in cooperation with the municipal registry offices. Ours is indeed a convenience sample with no snowball sampling.[1]
To assess the impact of the earthquake, we employed a post-experiment questionnaire that asked participants whether they had experienced the disaster,[2] whether a family member had been injured or killed, and whether their households had suffered economic damages. We also considered the possibility that our results could be biased by selective migration. For example, if more risk-averse individuals migrated due to their fear of further earthquakes, we would expect to see less risk aversion among those who experienced the earthquake and did not emigrate. Therefore, the post-experiment questionnaire also gathered information about any emigration from the village over the preceding forty years. However, there had not been a significant migration in the aftermath of the earthquake, partly because the destroyed buildings had been completely reconstructed.[3]
The final sample included 169 subjects, 83 in the hit villages and 86 in the not hit areas.[4] Subjects earned between 0 and 41 euros and experiments lasted one hour.
The experiments were conducted using paper and pencils, with each session including 20 to 24 individuals (see Figure 1A in Appendix A). The relatively small group size, given the large space available, helped minimize confusion and allowed for close monitoring of participants’ understanding of the instructions.[5] In fact, our local collaborators were responsible for reporting any difficulties participants encountered during the experiment. In such cases, we provided further explanations, and if a participant clearly failed to comprehend the instructions, we excluded their data from the analysis.[6]
The experimental design comprised three sections;[7] (1) a trust game (the dataset is not reported here); (2) the elicitation of risky choices through two different lotteries (Attanasi et al. 2018) and (3) a questionnaire – in Appendix B – which contained questions on age, status in the labour market, amount of damages suffered during the earthquake, time and risk preferences.
The question related to intertemporal preferences, drawn from the Bank of Italy Survey on Household Income and Wealth, 2010, is the following:
“Imagine you have won the lottery and will receive a sum equal to the amount of income that your family earns in a year. You will receive the money in a year’s time. To obtain the money immediately would you give up 20 percent of your win? What about 10? And 5? And 2?”.[8]
The greatest percentage of lottery money sacrificed reflects each respondent’s Temporal Discount Preferences (TDP); for example, 0 is given if the respondent is not willing to sacrifice any money to anticipate the benefit. We transform these values into discount rates, by dividing the percentage given up in order to obtain the money immediately by 1 minus that percentage; following this formula, the discount rate of giving up 20 % is 0.25, given that [0.2/(1–0.2)] = 0.25.[9]
This question is basically very similar to that collected in most behavioural and empirical studies on individuals’ discount factors, yet it is framed in the gain domain rather than in the loss domain as in several experimental investigations. We used this methodology because, considering only one horizon time, it was easy to understand for subjects within the age range we consider.
The elicitation of risk preferences relies on the following question, drawn from the European Social Survey, 2020:
“In general, would you describe yourself as a person willing to take risks or do you try to avoid taking them? Answer with a rating from 1 (you are not willing to take risks at all) to 10 (you are always willing to take all risks)”.[10]
3 Results
Previous research has discussed the possible biases that arise when determining individuals’ time preferences (Frederick, Loewenstein, and O’Donoghue 2002). For instance, discount rates may be overestimated if risk aversion is not considered (Andersen et al. 2008). Therefore, we explicitly consider people’s risk aversion, which is elicited by experimental measures (two tasks from Attanasi et al. 2018) and subjects’ responses to the questionnaire (see last paragraph of Section 2). In Table 1, we report descriptive statistics. The p-values in the last column indicate that the only significant differences between the control group and the treatment group are related to age and discount rate. In particular, individuals in the hit villages exhibit lower discount rates (i.e. greater patience).
Summary statistics.
| Variablesa,b | Whole sample | Not hit | Hit | p-value |
|---|---|---|---|---|
| Age | 64.7 (0.74) | 67.9 (0.72) | 63.00 (0.57) | 0.00 |
| Female | 0.31 (0.04) | 0.33 (0.05) | 0.34 (0.05) | 0.95 |
| Education | 2.71 (0.07) | 2.77 (0.11) | 2.65 (0.08) | 0.32 |
| Unemployed | 0.08 (0.02) | 0.09 (0.03) | 0.06 (0.03) | 0.44 |
| Not in labor force | 0.11 (0.02) | 0.10 (0.03) | 0.12 (0.04) | 0.72 |
| Retired from work/in work | 0.80 (0.04) | 0.79 (0.04) | 0.80 (0.04) | 0.87 |
| RiskQ | 6.02 (0.21) | 5.78 (0.28) | 6.28 (0.32) | 0.35 |
| RiskG | 0.32 (0.04) | 0.34 (0.05) | 0.28 (0.05) | 0.21 |
| Movers | 0.24 (0.46) | 0.23 (0.45) | 0.25 (0.48) | 0.32 |
| Discount rate | 0.11 (0.01) | 0.13 (0.01) | 0.09 (0.01) | 0.01 |
| N. observations | 169 | 86 | 83 |
-
aNotes: Bold figures indicate statistically significant differences (Mann–Whitney test); bthe data are drawn from the survey questions, except for the variable RiskG, which was taken from the experimental task. Hit: Subjects who experienced the earthquake. Not Hit: Subjects who lived far away from the earthquake epicentre. Age: Continuous variable within the range of 55–85. Education: Educational attainment of subjects within the range of 1–4 (1: primary education or less; 2: lower secondary school; 3: upper secondary school; 4: university degree). Unemployed: Dummy variable equal to 1 if the subject was not working but actively looking for a job, and 0 otherwise. Not in labor force: Dummy variable equal to 1 if the subject was not working and not looking for a job, and 0 otherwise. Retired from work/in work: Dummy variable equal to 1 if the subject was either working or retired, and 0 otherwise. RiskQ: Risk preferences indicated by the survey questions, where low scores on a scale of 1–10 reveal a high level of risk aversion. RiskG: Dummy variable equal to 1 if the subject selected the most risky lottery in both experimental tasks, and 0 if he/she did not. Movers: Dummy variable equal to 1 if the respondent has left the village since the earthquake, 0 otherwise. Discount rate: The individual discount rate varies between 0 (when the respondent to the survey question is willing to wait one year to receive the entire winnings) and 0.25 (when the respondent is willing to forfeit 20 % of the winnings for immediate access). The intermediate values are 0.02, 0.05 and 0.11, when the subject is willing to forfeit 2 %, 5 % and 10 %, respectively, of the winnings. Consequently, lower numbers indicate greater patience.
Figure 2 illustrates the distribution of subjects from the hit and not-hit villages based on the share they are willing to give up in order to receive their winnings immediately (with corresponding discount rates provided in parentheses). The fraction of subjects willing to wait a full year to receive the entire win – 0 % of the win given up – is notably higher in the treatment (40 %) compared to the control group (16 %). Conversely, the fraction of subjects willing to forfeit 20 % of the win for immediate receipt is higher in the control (43 %) than in the treatment group (33 %).
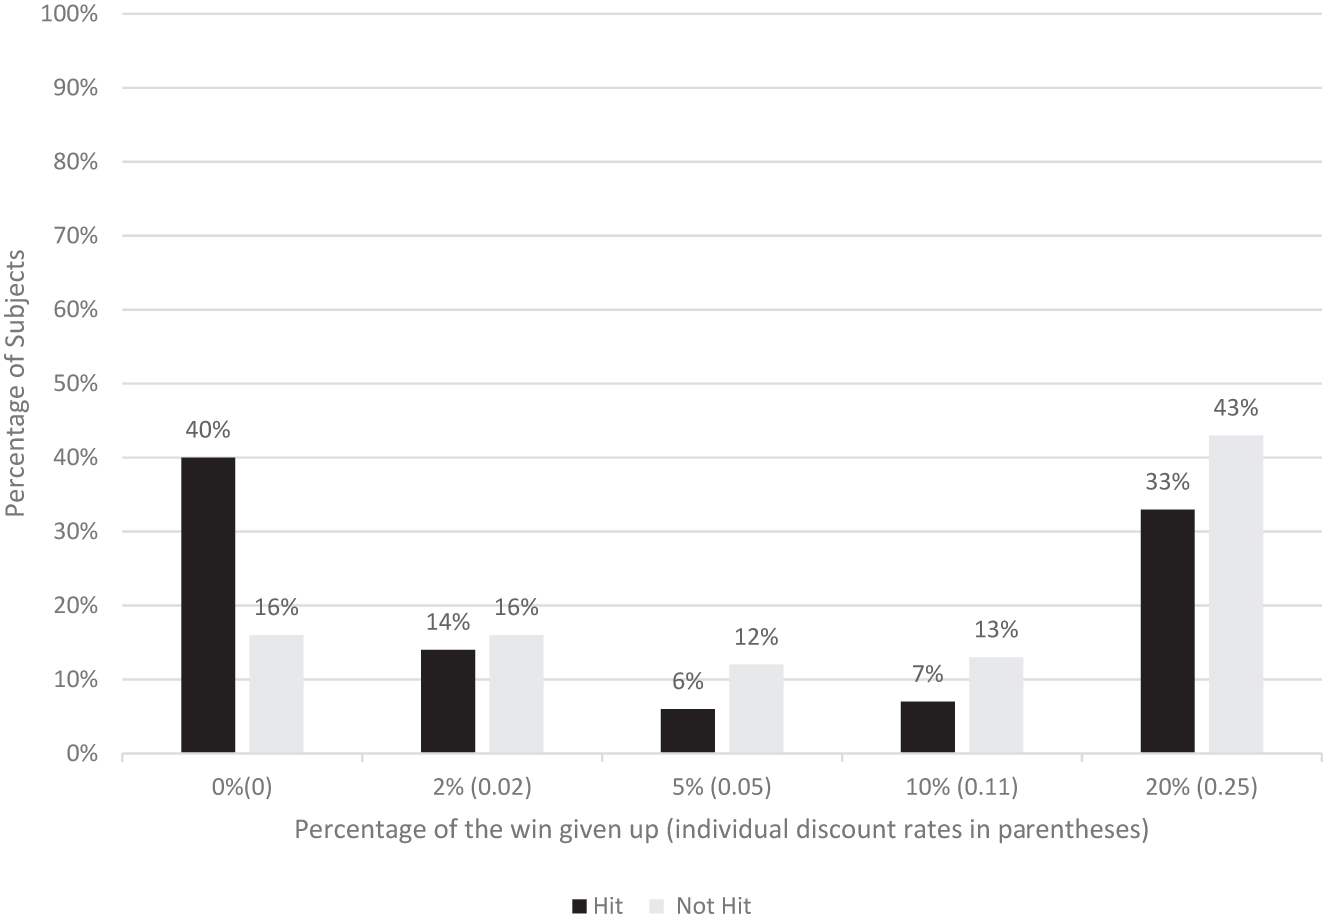
Distributions of our subjects in the hit (dark colour) and not-hit (light colour) villages, based on the amount given up in order to receive the win immediately.
Table 2 presents the findings from the estimation of a Tobit regression model. The dependent variable is the individual discount rate, which ranges from 0 (lower limit) to 0.25 (upper limit). Individuals who experienced the 1980 earthquake are shown to be more patient, as they demonstrate a lower discount rate.
Individual time preferences – Tobit, OLS, Probit estimates.
| Variables | Tobit – dependent variable: discount rate | OLS – dependent | Probit – dependent variable: | |||||
|---|---|---|---|---|---|---|---|---|
| variable: discount rate | choice to wait one year to | |||||||
| obtain the entire win | ||||||||
| Coeff. (std. errors) I | Coeff. (std errors) II | Coeff. (std errors) III | Coeff. (std. errors) IV | Coeff. (std. errors) V | Coeff. (std. errors) VI | Coeff. (std. errors) VII | Coeff. (std. errors) VIII | |
| Age | 0.10 (0.004) | 0.05 (0.4) | 0.10 (0.004) | 0.015 (0.15) | 0.03 (0.15) | −0.65 (0.019) | −0.79 (0.021) | |
| Age 55/64 | −0.031 (0.051) | |||||||
| Female | 0.078 (0.057) | 0.073 (0.056) | 0.076 (0.056) | 0.069 (0.052) | 0.03 (0.02) | 0.03 (0.019) | 0.009 (0.237) | 0.006 (0.233) |
| Education | −0.06b (0.028) | −0.063b (0.028) | −0.053a (0.029) | −0.053a (0.028) | −0.027b (0.01) | −0.024b (0.01) | 0.008 (0.132) | 0.007 (0.131) |
| Unemployed | −0.112 (0.078) | −0.093 (0.076) | −0.107 (0.076) | −0.1 (0.053) | −0.038 (0.028) | −0.043 (0.027) | −0.266 (0.401) | −0.083 (0.397) |
| Not labor force | −0.052 (0.089) | −0.054 (0.088) | −0.083 (0.092) | −0.077 (0.091) | −0.02 (0.031) | −0.031 (0.032) | 0.170 (0.359) | 0.264 (0.373) |
| Hit | −0.12b (0.055) | −0.13b (0.056) | −0.11b (0.055) | −0.105b (0.053) | −0.038b (0.019) | −0.034a (0.018) | 0.785c (0.252) | 0.69c (0.242) |
| RiskQ | −0.019b (0.009) | −0.019b (0.009) | −0.06b (0.003) | 0.067a (0.038) | ||||
| RiskG | −0.08a (0.054) | −0.023a (0.018) | 0.587b (0.228) | |||||
| Constant | 0.217 (0.33) | 0.283 (0.332) | 0.299 (0.334) | 0.386 (0.118) | 0.169 (0.119) | 0.182 (0.123) | −0.846 (1.66) | −0.917 (1.671) |
| N. observations | 169 | 169 | 169 | 169 | 169 | 169 | 169 | 169 |
| Log pseudolik. | −100.07 | −98.497 | −97.748 | −97.63 | −90.144 | −91.879 | ||
| F-stat | 1.95 | 1.89 | 2.19 | 2.52 | 2.38 | 3.03 | ||
| R 2 (pseudo R 2) | 0.09 | 0.21 | 0.1 | 0.09 | ||||
-
Notes: The dependent variable in both the Tobit and OLS models is the individual discount rate, while the dependent variable in the Probit model is a binary indicator that equals 1 if the respondent is willing to wait one year to receive the entire win, and 0 otherwise. Discount rate: The individual discount rate varies between 0 (when the respondent to the survey question is willing to wait one year to receive the entire winnings) to 0.25 (when the respondent is willing to forfeit 20 % of the winnings for immediate access). The intermediate values are 0.02, 0.05 and 0.11, when the subject is willing to forfeit 2 %, 5 % and 10 %, respectively, of the winnings. Consequently, lower numbers indicate greater patience. Age: Continuous variable within the range of 55–85. Age 55/64: Dummy equal to 1 if the subject’s age is between 55 and 64, and 0 otherwise. Education: Educational attainment of subjects (1: primary education or less; 2: lower secondary school; 3: upper secondary school; 4: university degree). Unemployed: Dummy variable equal to 1 if the individual was not working but actively looking for a job, and 0 otherwise (the excluded reference dummy in the empirical models is “Retired from Work/in Work”). Not in labor force: Dummy variable equal to 1 if the individual was not working and not looking for a job, and 0 otherwise (the excluded reference dummy in the empirical models is “Retired from Work/In Work”). Hit: Dummy variable equal to 1 if the subject experienced the earthquake, 0 otherwise (the excluded reference dummy is “Not Hit”). RiskQ: Risk preferences indicated by the survey questions, where low scores, on a scale of 1–10, reveal a high level of risk aversion. RiskG: Dummy equal to 1 if the subjects selected the most risky lottery in both experimental tasks, and 0 if they did not. aIndicates statistical significance at 10 % level; bindicates statistical significance at 5 % level; cindicates statistical significance at 1 % level.
Columns II–IV account for risk preferences that are obtained via the experimental tasks (RiskG, column II) and the questionnaire (RiskQ, columns III–IV). Consistently with earlier research, those who are less risk averse have lower discount rates (Andersen et al. 2008). After adjusting for risk aversion, the relationship between time preferences and the earthquake’s experience is essentially the same.
Control variables do not improve the explanatory power of the model except for “Education”: the coefficient on “Education” truthfully shows that patience is positively correlated with schooling levels as argued in Fuchs (1982, 2004] and Grossman (2000).
For robustness, we considered additional OLS estimates (columns V–VI) and Probit estimates (columns VII–VIII), and the results remained essentially the same.
Further estimates (available upon request) considered the magnitude of the earthquake’s physical and economic consequences, the likelihood that the economic damages had not been reimbursed, and the possibility that some subjects had moved away from their villages after 1980. Nevertheless, we did not add significant evidence and our conclusions remained unchanged.
4 Concluding Remarks
The process of intertemporal choice reflects a tension between the desire for immediate rewards and the recognition of long-term consequences (Urminsky and Zauberman 2014).
We contend that discount factors are context-dependent, meaning that exogenous shocks can significantly alter individuals’ intertemporal preferences. Cassar, Healy, and Von Kessler (2017) demonstrate that natural disasters reduce patience in the immediate aftermath of the event (about three years later). Specifically, disasters can have an emotional impact on the people involved by increasing the fear of losing everything in a short time.
However, discount factors are not constant over time (Urminsky and Zauberman 2014). Therefore, the influence of such shocks may differ in the long term compared to the short term. In this aspect, the results presented in this paper shed new light on the long-term effects of catastrophes on intertemporal preferences. We demonstrate that experiencing an earthquake in life can result in a long-term decrease in an individual’s discount rate.
We believe that, in the aftermath of catastrophic events, survival probabilities become more uncertain, which can lead to an increased preference for immediate rewards (see, e.g. d’Albis, Attanasi, and Thibault 2020). However, as recovery occurs and survival probabilities stabilize, individuals may revert to a more long-term focus. Following a lengthy but effective reconstruction process,[11] people in the hit areas tend to balance short-term benefits more effectively with long-term goals.
The discount factor has important implications for economic growth through the effects on saving and individuals’ investment in human capital. Thus, our results could offer further insights into a microeconomic explanation of the positive relationship identified in the literature between human capital accumulation and long-term growth (Shabnam 2014; Skidmore and Toya 2002).
Future research could enhance the relevance of our findings for the societies involved by investigating how they depend on the amount and timing of the recovery process and, more intriguingly, the potential intergenerational transmission of time preferences. In particular, using the same methodology as in our field study, future studies could compare education levels and saving plans among younger generations in affected versus unaffected populations. This would help to directly assess the impact of context-dependent intertemporal preferences on economic growth.
Funding source: Italian Ministry of University and Research (MUR)
Award Identifier / Grant number: PRIN 20229LRAHK
Acknowledgements
We thank the mayors of Conza della Campania, Laviano, Monte San Giacomo and Piaggine, the members of the mayors’ staffs, and other local collaborators who assisted us with the organization and execution of the experimental sessions, as well as the participants in the experiments. We also thank the participants of the following conferences for their helpful suggestions: 10th BEEN Meeting, University of Trento, 2023. HEDGE Conference, University of Pisa, 2024. EFLD Conference, DISES- Federico II University, CSEF, Naples, 2024. COBENARE Conference, Parthenope University, 2024.
-
Research funding: This work was supported by Italian Ministry of University and Research (MUR) under (PRIN 20229LRAHK).
References
Andersen, S., G. W. Harrison, M. I. Lau, and E. E. Rutström. 2008. “Eliciting Risk and Time Preferences.” Econometrica 76 (3): 583–618. https://doi.org/10.1111/j.1468-0262.2008.00848.x.Search in Google Scholar
Attanasi, G., N. Georgantzís, V. Rotondi, and D. Vigani. 2018. “Lottery- and Survey-Based Risk Attitudes Linked through a Multichoice Elicitation Task.” Theory and Decision 84 (3): 341–72. https://doi.org/10.1007/s11238-017-9613-0.Search in Google Scholar
Callen, M. 2015. “Catastrophes and Time Preference: Evidence from the Indian Ocean Earthquake.” Journal of Economic Behavior & Organization 118: 199–214. https://doi.org/10.1016/j.jebo.2015.02.019.Search in Google Scholar
Cassar, A., A. Healy, and C. Von Kessler. 2017. “Trust, Risk, and Time Preferences after a Natural Disaster: Experimental Evidence from Thailand.” World Development 90: 94–105.10.1016/j.worlddev.2016.12.042Search in Google Scholar
Castillo, M., and M. Carter. 2011. “Behavioral Responses to Natural Disasters.” Working Papers 1026, George Mason University, Interdisciplinary Center for Economic Science.Search in Google Scholar
d’Albis, H., G. Attanasi, and E. Thibault. 2020. “An Experimental Test of the Under-annuitization Puzzle with Smooth Ambiguity and Charitable Giving.” Journal of Economic Behavior & Organization 180: 694–717. https://doi.org/10.1016/j.jebo.2019.09.019.Search in Google Scholar
Frederick, S., G. Loewenstein, and T. O’Donoghue. 2002. “Time Discounting and Time Preference: A Critical Review.” Journal of Economic Literature 40 (2): 351–401. https://doi.org/10.1257/jel.40.2.351.Search in Google Scholar
Fuchs, V. 1982. “Time Preference and Health: An Exploratory Study.” In Economic Aspects of Health, edited by V. Fuchs, 93–120. Chicago: University of Chicago Press.Search in Google Scholar
Fuchs, V. 2004. “Reflections on the Socio-Economic Correlates of Health.” Journal of Health Economics 23 (4): 653–61. https://doi.org/10.1016/j.jhealeco.2004.04.004.Search in Google Scholar
Grossman, M. 2000. “The Human Capital Model.” In Handbook of Health Economics, Vol. 1, edited by A. J. Culyer, and J. P. Newhouse, 347–408. Amsterdam: Elsevier Science. Ch. 7.10.1016/S1574-0064(00)80166-3Search in Google Scholar
Ingwersen, N., E. Frankenberg, and D. Thomas. 2023. “Evolution of Risk Aversion over Five Years after a Major Natural Disaster.” Journal of Development Economics 163: 103095. https://doi.org/10.1016/j.jdeveco.2023.103095.Search in Google Scholar
Kuroishi, Y., and Y. Sawada. 2024. “On the Stability of Preferences: Experimental Evidence from Two Disasters.” European Economic Review 161: 104632. https://doi.org/10.1016/j.euroecorev.2023.104632.Search in Google Scholar
Mackay, R., A. Mavisakalyan, and Y. Tarverdi. 2024. “Trust a Few: Natural Disasters and the Disruption of Trust in Africa.” Journal of Behavioral and Experimental Economics 113: 102288, https://doi.org/10.1016/j.socec.2024.102288.Search in Google Scholar
Pancotto, F., F. Giardini, and S. Righi. 2024. “Understanding Post Disaster Prosociality: Comparing Post Earthquake Cooperation and Fairness in Two Italian Regions.” International Journal of Disaster Risk Reduction 106: 104165. https://doi.org/10.1016/j.ijdrr.2023.104165.Search in Google Scholar
Reynaud, A., and C. Aubert. 2020. “Does Flood Experience Modify Risk Preferences? Evidence from an Artefactual Field Experiment in Vietnam.” The Geneva Risk and Insurance Review 45: 36–74. https://doi.org/10.1057/s10713-019-00044-w.Search in Google Scholar
Said, F., U. Afzal, and G. Turner. 2015. “Risk Taking and Risk Learning after a Rare Event: Evidence from a Field Experiment in Pakistan.” Journal of Economic Behavior & Organization 118: 167–83. https://doi.org/10.1016/j.jebo.2015.03.001.Search in Google Scholar
Shabnam, N. 2014. “Natural Disasters and Economic Growth: A Review.” International Journal of Disaster Risk Science 5 (2014): 157–63. https://doi.org/10.1007/s13753-014-0022-5.Search in Google Scholar
Skidmore, M., and H. Toya. 2002. “Do Natural Disasters Promote Long‐run Growth?” Economic Inquiry 40 (4): 664–87. https://doi.org/10.1093/ei/40.4.664.Search in Google Scholar
Urminsky, O., and G. Zauberman. 2014. “The Psychology of Intertemporal Preferences.” In Handbook of Judgment and Decision Making, edited by G. Keren, and G. Wu, 141–81. Wiley-Blackwell.10.1002/9781118468333.ch5Search in Google Scholar
Supplementary Material
This article contains supplementary material (https://doi.org/10.1515/bejeap-2024-0180).
© 2024 the author(s), published by De Gruyter, Berlin/Boston
This work is licensed under the Creative Commons Attribution 4.0 International License.
Articles in the same Issue
- Frontmatter
- Research Articles
- Selection Efficiency in Multiple-Prize Tournaments with Sabotage
- Priced Out: Do Adolescents from Low-Income Families Respond More to Cost-Sharing in Primary Care?
- International Commodity-Tax Competition and Asymmetric Producer Prices
- Letters
- Absolute versus Relative Poverty and Wealth: Cooperation in the Presence of Between-Group Inequality
- Cross Ownership Under Strategic Tax Policy
- Central Bank Digital Currencies: Experimental Evidence of Deposit Conversion
- Earthquakes and Intertemporal Preferences: A Field Study in Italy