Job Loss and Migration: Do Family Connections Matter?
-
Terhi Maczulskij


Abstract
This paper utilizes administrative employer–employee data to analyze the effect of job loss on interregional migration and to study how family connections, related to childhood family members and birth region preferences, shape these location choices. The results reveal that job loss due to establishment closures increases the probability of interregional migration by nearly 80 %. While local family member connections and birth region preferences pose substantial obstacles to moving, they do not necessarily lead to relocation in response to job loss. Instead, displaced workers tend to migrate to non-birth regions where they have no observed family member connections, although higher economic gains in these regions may partly offset the loss of utility resulting from these factors.
Funding source: Strategic Research Council
Award Identifier / Grant number: 293120
Funding source: Palkansaajasäätiö
Acknowledgments
The author wishes to thank Hannu Karhunen for his helpful comments. Financial support from the Academy of Finland Strategic Research Council project “Work, Inequality and Public Policy” (number 293120) and Palkansaajasäätiö are gratefully acknowledged.
(Table A1)
Population and unemployment rates in travel-to-work areas in 2019.
| Code | Name | Population | Unemployment rate, % |
|---|---|---|---|
| 01 | Helsinki | 1,672,162 | 8.29 |
| 04 | Lahti | 197,845 | 13.07 |
| 05 | Kouvola | 89,942 | 12.58 |
| 06 | Kotka | 83,446 | 13.93 |
| 08 | Turku | 364,589 | 9.33 |
| 09 | Loimaa | 19,753 | 8.65 |
| 10 | Rauma | 50,842 | 8.25 |
| 11 | Pori | 123,822 | 11.93 |
| 12 | Kankaanpää | 14,946 | 10.75 |
| 13 | Parkano | 8,377 | 9.00 |
| 14 | Tampere | 477,904 | 9.34 |
| 15 | Lappeenranta | 123,913 | 12.00 |
| 16 | Mikkeli | 70,316 | 10.64 |
| 17 | Savonlinna | 45,902 | 13.47 |
| 19 | Varkaus | 25,639 | 13.83 |
| 20 | Kuopio | 169,085 | 10.22 |
| 21 | Iisalmi | 46,885 | 12.15 |
| 22 | Joensuu | 126,290 | 13.51 |
| 23 | Nurmes | 9,783 | 14.65 |
| 24 | Närpes | 10,733 | 4.21 |
| 25 | Vaasa | 113,865 | 7.21 |
| 26 | Seinäjoki | 114,424 | 8,03 |
| 27 | Alajärvi | 14,686 | 9.58 |
| 29 | Jämsä | 22,845 | 13.62 |
| 30 | Jyväskylä | 212,150 | 12.38 |
| 33 | Kokkola | 67,106 | 7.41 |
| 34 | Raahe | 34,310 | 9.48 |
| 35 | Oulu | 262,977 | 11.21 |
| 36 | Kajaani | 54,273 | 10.68 |
| 37 | Kemi | 54,088 | 12.75 |
| 39 | Mariehamn | 29,789 | 3.53 |
| 43 | Uusikaupunki | 24,347 | 5.85 |
| 45 | Haapajärvi | 9,890 | 7.83 |
-
Numbers are based on data from Statistics Finland and own calculations. The unemployment rate is measured as the share of unemployed from the total workforce within 15–65-year-old individuals in a region.
Covariate balance for the variables for the non-matched and matched samples.
| Non-matched data | Matched data | |||||
|---|---|---|---|---|---|---|
| Treatment group (displaced workers) (1) | Control group (non-displaced workers) (2) | t-test | Treatment group (displaced workers) (3) | Control group (non-displaced workers) (4) | t-test | |
| Individual characteristics | ||||||
| Primary education | 0.17 | 0.16 | 1.34 | 0.17 | 0.17 | 0.49 |
| Secondary education | 0.61 | 0.63 | −3.11 | 0.61 | 0.61 | −0.20 |
| Higher education | 0.22 | 0.21 | 1.34 | 0.22 | 0.22 | −0.18 |
| Age | 39.1 | 40.0 | −9.64 | 39.1 | 39.1 | −0.16 |
| Female | 0.37 | 0.34 | 4.16 | 0.37 | 0.37 | −0.32 |
| Married or cohabiting | 0.50 | 0.53 | −10.79 | 0.50 | 0.50 | −0.60 |
| Children <7 years old | 0.45 | 0.43 | 7.64 | 0.45 | 0.45 | 0.17 |
| Home ownership | 0.69 | 0.75 | −14.63 | 0.69 | 0.69 | −0.14 |
| Have migrated before | 0.13 | 0.11 | 2.64 | 0.13 | 0.13 | 0.12 |
| Family member in region | 0.56 | 0.57 | −0.94 | 0.56 | 0.56 | −0.02 |
| Birth region | 0.56 | 0.58 | −3.61 | 0.56 | 0.56 | −0.06 |
| Annual wages (in euros) | 42,404 | 42,851 | −1.34 | 42,404 | 42,295 | 0.91 |
| Moved to another region by b + 2 | 0.032 | 0.017 | 0.032 | 0.019 | ||
| Number of observations | 51,259 | 4,699,103 | 51,259 | 150,583 | ||
-
Migration status is measured in b + 2 and other variables in b − 1. t-test statistics are for equal sample means between the treatment (displaced) and control (non-displaced) groups.
Covariate balance for the variables for the matched sample: two groups based on residing in or outside their birth region.
| Residing outside birth region | Residing in birth region | |||||
|---|---|---|---|---|---|---|
| Treatment group (displaced workers) (1) | Control group (non-displaced workers) (2) | t-test | Treatment group (displaced workers) (3) | Control group (non-displaced workers) (4) | t-test | |
| Individual characteristics | ||||||
| Primary education | 0.16 | 0.16 | −0.79 | 0.18 | 0.17 | 1.28 |
| Secondary education | 0.56 | 0.55 | 1.80 | 0.65 | 0.66 | −1.94 |
| Higher education | 0.28 | 0.29 | −1.07 | 0.17 | 0.17 | 0.73 |
| Age | 39.8 | 39.8 | 0.08 | 38.6 | 38.6 | −0.24 |
| Female | 0.39 | 0.39 | −1.57 | 0.35 | 0.35 | 0.40 |
| Married or cohabiting | 0.52 | 0.53 | −0.36 | 0.47 | 0.47 | −0.40 |
| Children <7 years old | 0.45 | 0.45 | 1.08 | 0.45 | 0.45 | −0.47 |
| Home ownership | 0.65 | 0.65 | 0.41 | 0.71 | 0.71 | −0.49 |
| Have migrated before | 0.22 | 0.23 | −0.43 | 0.05 | 0.05 | 0.78 |
| Family member in region | 0.30 | 0.30 | −0.01 | 0.78 | 0.78 | 0.03 |
| Annual wages (in euros) | 44,614 | 44,373 | 0.49 | 40,638 | 40,395 | 0.72 |
| Moved to another region by b + 2 | 0.049 | 0.030 | 0.018 | 0.010 | ||
| Number of observations | 22,768 | 66,816 | 28,491 | 83,767 | ||
-
Migration status is measured in b + 2 and other variables in b − 1. t-test statistics are for equal sample means between the treatment (displaced) and control (non-displaced) groups.
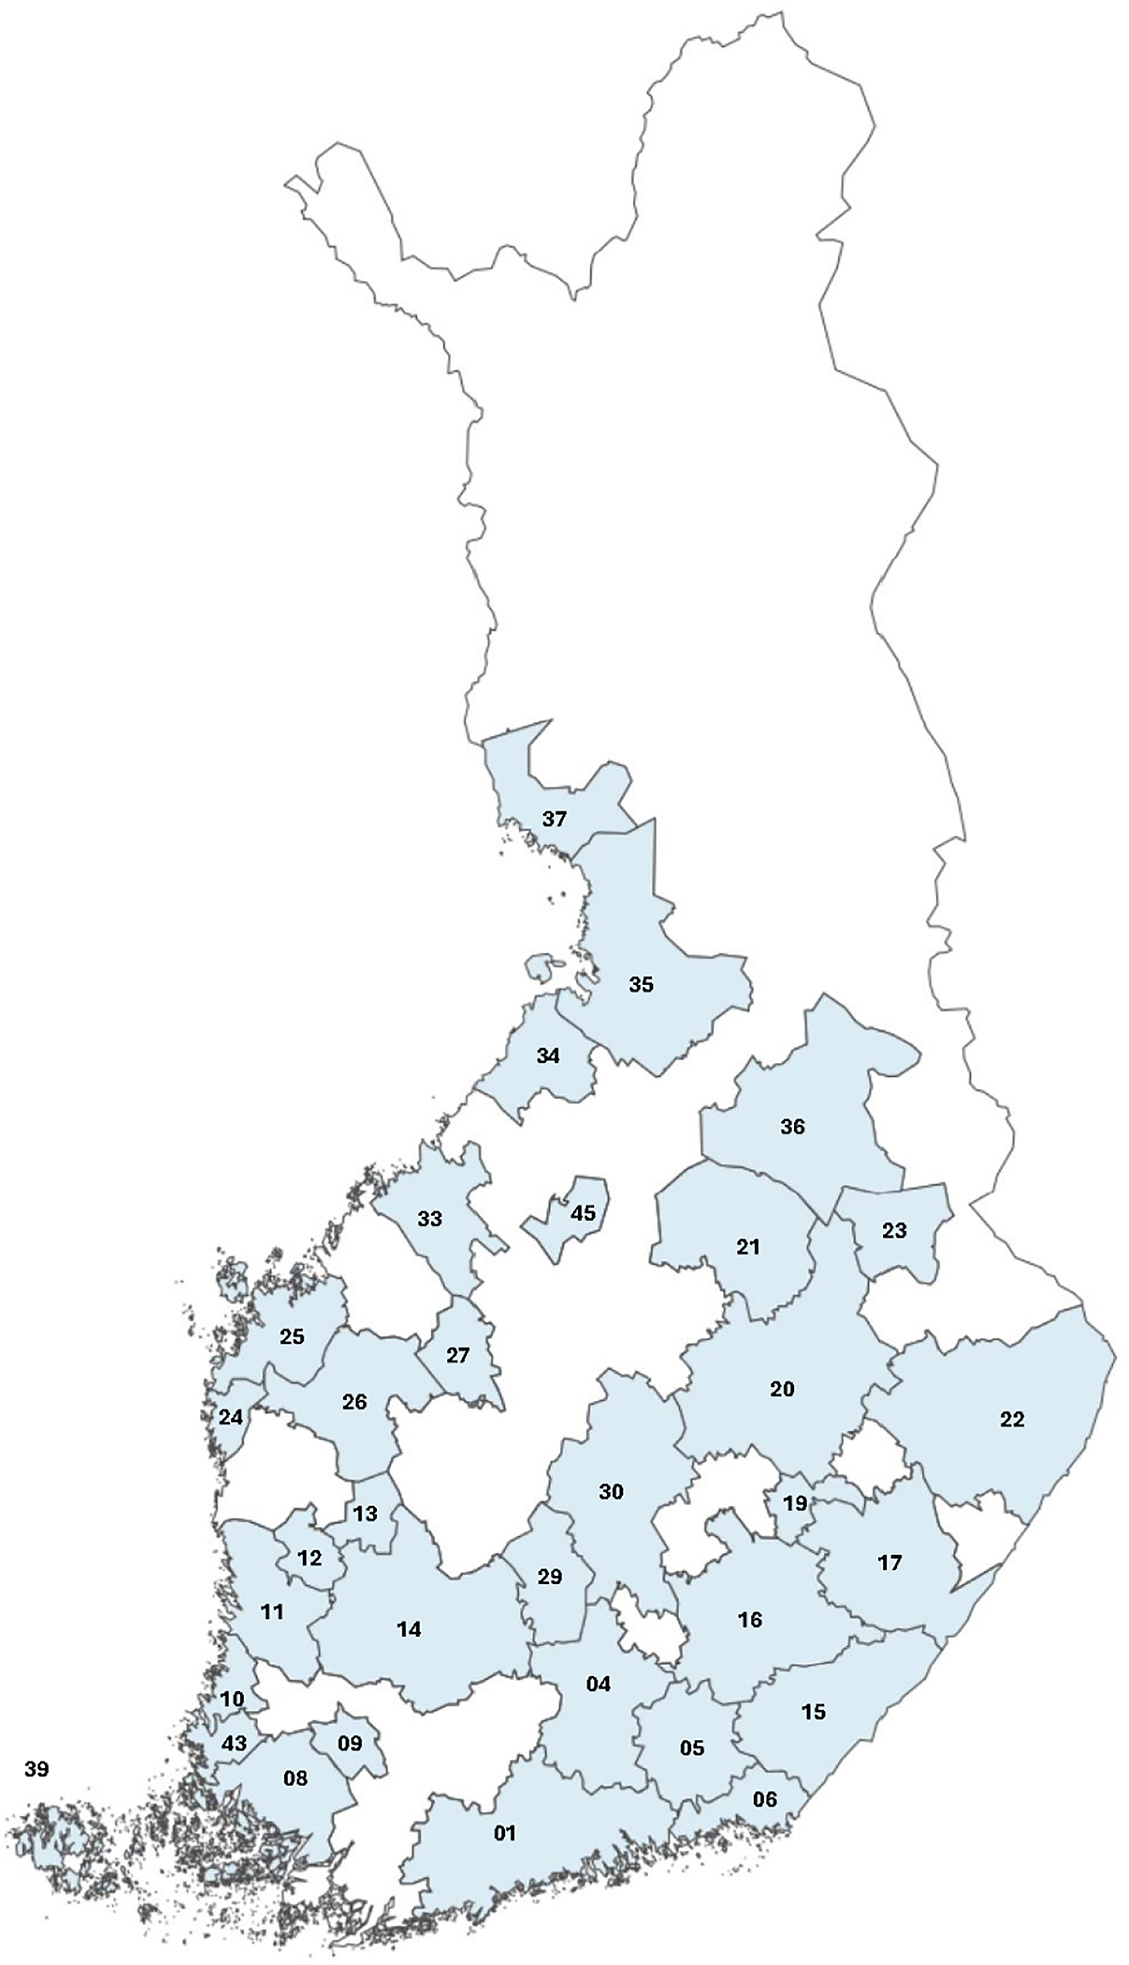
Travel-to-work areas, based on the 2019 classification.
References
Ai, C., and E. Norton. 2003. “Interaction Terms in Logit and Probit Models.” Economics Letters 80: 123–9. https://doi.org/10.1016/S0165-1765(03)00032-6.Search in Google Scholar
Anderson, L. F., T. Danley, R. Eriksson, and M. Henning. 2020. “Workers’ Participation in Regional Economic Change Following Establishment Closure.” Small Business Economics 54: 589–604. https://doi.org/10.1007/s11187-018-0036-2.Search in Google Scholar
Bratsberg, B., O. Raaum, and K. Røed. 2018. “Job Loss and Immigrant Labor Market Performance.” Economica 85: 124–51. https://doi.org/10.1111/ecca.12244.Search in Google Scholar
Crescenzi, R., N. Holman, and E. Orru. 2017. “Why Do They Return? Beyond the Economic Drivers of Graduate Return Migration.” The Annals of Regional Science 59: 603–27. https://doi.org/10.1007/s00168-016-0762-9.Search in Google Scholar
Dahl, M., and O. Sorenson. 2010a. “The Migration of Technical Workers.” Journal of Urban Economics 67: 33–45. https://doi.org/10.1016/j.jue.2009.09.009.Search in Google Scholar
Dahl, M., and O. Sorenson. 2010b. “The Social Attachment to Place.” Social Forces 89: 633–58. https://doi.org/10.1353/sof.2010.0078.Search in Google Scholar
de Haas, H. 2021. “A Theory of Migration: The Aspirations-Capabilities Framework.” Migration Studies 9: 1–35. https://doi.org/10.1186/s40878-020-00210-4.Search in Google Scholar
De la Roca, J. 2017. “Selection in Initial and Return Migration: Evidence from Moves across Spanish Cities.” Journal of Urban Economics 100: 33–53. https://doi.org/10.1016/j.jue.2017.04.004.Search in Google Scholar
Eriksson, R. H., E. Hane-Weijman, and M. Henning. 2018. “Sectoral and Geographical Mobility of Workers after Large Establishment Cutbacks or Closures.” Environment and Planning A: Economy and Space 50 (5): 1071–91. https://doi.org/10.1177/0308518X18772581.Search in Google Scholar
Eurostat. 2024. Job Vacancy and Unemployment Rates - Beveridge Curve. Kirchberg: Eurostat.Search in Google Scholar
Fackler, D., and L. Rippe. 2016. “Losing Work, Moving Away? Regional Mobility after Job Loss.” Labour 31: 457–79. https://doi.org/10.1111/labr.12106.Search in Google Scholar
Faggian, A., and B. Biagi. 2011. “Editorial: Special Issue on Interregional Migration.” Spatial Economic Analysis 6 (1): 1–3. https://doi.org/10.1080/17421772.2011.542614.Search in Google Scholar
Harris, J., and M. Todaro. 1970. “Migration, Unemployment and Development: A Two-Sector Analysis.” The American Economic Review 60: 126–42.Search in Google Scholar
Huttunen, K., J. Møen, and K. Salvanes. 2018. “Job Loss and Regional Mobility.” Journal of Labor Economics 36: 479–509. https://doi.org/10.1086/694587.Search in Google Scholar
Ilyés, V., I. Boza, L. Lörincz, and R. Eriksson. 2023. “How to Enter High-Opportunity Places? The Role of Social Contracts for Residential Mobility.” Journal of Economic Geography 23: 371–95. https://doi.org/10.1093/jeg/lbac019.Search in Google Scholar
Jewell, S., and A. Faggian. 2014. “Interregional Migration ‘Wage Premia’: The Case of Creative and Science and Technology Graduates in the UK.” In Applied Regional Growth and Innovation Models. Advances in Spatial Science, edited by K. Kourtit, P. Nijkamp, and R. Stimson. Berlin, Heidelberg: Springer.10.1007/978-3-642-37819-5_9Search in Google Scholar
Lundholm, E., J. Garvill, G. Malmberg, and K. Westin. 2004. “Forced or Free Movers? The Motives, Voluntariness and Selectivity of Interregional Migration in the Nordic Countries.” Population, Space and Place 10: 59–72. https://doi.org/10.1002/psp.315.Search in Google Scholar
Maczulskij, T., and P. Böckerman. 2023. “Losing a Job and (Dis)incentives to Move: Interregional Migration in Finland.” European Urban and Regional Studies 30: 430–45. https://doi.org/10.1177/09697764231186746.Search in Google Scholar
Meekes, J., and W. Hassink. 2019. “The Role of the Housing Market in Workers’ Resilience to Job Displacement after Firm Bankruptcy.” Journal of Urban Economics 109: 41–65. https://doi.org/10.1016/j.jue.2018.11.005.Search in Google Scholar
Mulder, C., and G. Malmberg. 2014. “Local Ties and Family Migration.” Environment and Planning A 46: 2195–211. https://doi.org/10.1068/a130160p.Search in Google Scholar
Mulder, C., E. Lundholm, and G. Malmberg. 2020. “Young Adults’ Migration to Cities in Sweden: Do Siblings Pave the Way?” Demography 57: 2221–44. https://doi.org/10.1007/s13524-020-00934-z.Search in Google Scholar
Neffke, F., A. Otto, and C. Hidalgo. 2018. “The Mobility of Displaced Workers: How the Local Industry Mix Affects Job Search.” Journal of Urban Economics 108: 124–40. https://doi.org/10.1016/j.jue.2018.09.006.Search in Google Scholar
Pekkala, S. 2003. “Migration Flows in Finland: Regional Differences in Migration Determinants and Migrant Types.” International Regional Science Review 26 (4): 446–82. https://doi.org/10.1177/0160017603259861.Search in Google Scholar
© 2024 Walter de Gruyter GmbH, Berlin/Boston
Articles in the same Issue
- Frontmatter
- Research Articles
- Asymmetric Performance Evaluation Under Quantity and Price Competition with Managerial Delegation
- Incentive-Induced Social Tie and Subsequent Altruism and Cooperation
- University Admission: Is Achievement a Sufficient Criterion?
- Taxing Firearms Like Alcohol or Tobacco
- The Growing Importance of Social Skills for Labor Market Outcomes Across Education Groups
- The Impact of the Affordable Care Act in Puerto Rico
- Strategic Individual Behaviors and the Efficient Vaccination Subsidy
- Is Family-Priority Rule the Right Path? An Experimental Study of the Chinese Organ Allocation System
- Letters
- Real-effort in the Multilevel Public Goods Game
- Initial Payment and Refunding Scheme for Climate Change Mitigation and Technological Development Among Heterogeneous Countries
- Edutainment and Dwelling-Related Assets in Poor Rural Areas of Peru
- Biased Voluntary Nutri-Score Labeling
- Decompositions of Inequality and Poverty by Income Source
- Job Loss and Migration: Do Family Connections Matter?