The Growing Importance of Social Skills for Labor Market Outcomes Across Education Groups
-
Sun Hyung Kim


Abstract
Using the 1979 and 1997 waves of the National Longitudinal Survey of Youth, this paper shows that the growing return to social skills documented by Deming (2017. “The Growing Importance of Social Skills in the Labor Market.” Quarterly Journal of Economics 132 (4): 1593–640) has been largely concentrated on college-educated workers, rather than on high school-educated workers. These findings are corroborated by the pronounced occupational sorting of college-educated workers into occupations requiring high levels of social skills. Moreover, the wage premium for college-educated workers employed in these occupations has increased markedly. Our empirical evidence provides one possible source of rising wage inequality within and between education levels.
1 Introduction
A large literature documents that an individual worker’s social skills, such as communication, leadership, and interpersonal skills, have become highly important for labor market outcomes (Borghans, ter Weel, and Weinberg 2014; Deming 2017; Kuhn and Weinberger 2005; Weinberger 2014). The growing returns to social skills in the labor market are closely associated with empirical evidence of increasing payoff and employment in occupations requiring interpersonal social skills, as shown by Autor, Levy, and Murnane (2003) and Deming (2017). In particular, with the rising importance of teamwork skills in the workplace, social skills have become one of the most critical attributes of new hires, and high-paying jobs broadly tend to demand higher level of social skills (Deming and Kahn 2018; Weidmann and Deming 2021).
Although many papers have established the increasing wage returns to social skills, there is little research that has examined how they vary across different education groups. Based on the influential work by Deming (2017), this paper shows that the social skill premium has been largely concentrated on college-educated workers, rather than on high school-educated workers. Moreover, college-educated workers with higher social skills have more strongly sorted into high-paying occupations requiring higher levels of social skill tasks in recent periods. These findings have important implications for understanding the significant rise in wage inequality within and between education levels.
Using data from the 1979 and 1997 National Longitudinal Surveys of Youth (NLSY79 and NLSY97), we estimate the effects of cognitive and social skills on the wages of 23–33-year-old men between education groups and examine how this relationship has changed across the two survey waves. We show that there has been a great reversal in the demand for cognitive and social skills, which is broadly in line with the results of Deming (2017). Specifically, the returns to cognitive skills have declined markedly, while the returns to social skills have increased substantially. More importantly, we find that the diminishing role of cognitive skills for labor market outcomes has occurred for all education levels. However, the growing wage premium of social skills has been mostly concentrated among college-educated workers.
To examine the link between an individual worker’s skills and occupational outcomes, we estimate the effects of pre-market skills on job task contents of a worker’s occupation by education levels using the data from the Occupational Information Network (O*NET). Overall, consistent with Weinberger (2014) and Speer (2017), we find an important role of skills for occupation choices of workers. In particular, we show that college-educated workers with high social skills have been more likely to sort into social skill-intensive jobs over time. More importantly, we show that the wage gain of college-educated workers from switching into social skill-intensive occupations has significantly increased in recent years. Hence, the labor market has increasingly favored college-educated workers with strong endowments of social skills so that college education becomes an important pathway toward acquiring the growing premium of social skills.
This paper contributes to the literature that examines the changing roles of an individual worker’s skills for labor market outcomes. Many previous studies have established that the US economy has experienced a remarkable change in the demand for cognitive and social skills since 2000. More precisely, Castex and Dechter (2014) and Beaudry, Green, and Sand (2016) document that the return to cognitive skills in the labor market has markedly declined due to technological slowdown, whereas Deming (2017) shows the growing importance of social skills with the significant growth in occupations requiring interpersonal skills that cannot be substituted away by automation. In particular, Weinberger (2014) argues that complementarity between cognitive and social skills has been increasingly important in the labor market. However, there has been little attempt to investigate how the returns to cognitive and social skills have changed across educational levels and how the changes in the skill premium have been closely associated with changes in an individual worker’s occupational sorting and wage growth. This paper fills this crucial gap in the literature.
Our study is also connected to a literature linking workers’ pre-labor market skills to occupational sorting. Weinberger (2014) shows that workers with stronger skill endowments as high school seniors are inclined to sort into occupations requiring higher levels of skill. Using the NLSY and O*NET data, Speer (2017) also finds a strong role for pre-market skills in predicting the task content of the workers’ initial occupations and career trajectories. Similarly, Deming (2017), merging the NLSY with O*NET data, estimates the effects of pre-market skills on the task content of occupations and shows that individuals with high cognitive skills but low social skills tend to select into routine jobs, whereas those with higher social skills tend to sort into nonroutine and social skill-intensive jobs. We add to this literature by estimating the changes in the effects of skills on occupational sorting across education levels and analyzing how the wage returns of the sorting have changed over time.
Furthermore, our work is intimately related to numerous papers that have documented the significant rise in wage inequality (Acemoglu and Autor 2011; Autor, Katz, and Kearney 2008; Guvenen and Kuruscu 2010; Katz and Murphy 1992; Krusell et al. 2000). Many potential explanations have been suggested, such as skill-biased technological change, falling federal and state minimum wages, and rising exposure to international trade. This paper adds to the literature by providing empirical evidence on the importance of changes in occupational demand strongly favoring college-educated workers with high levels of social skills, which helps explain widening wage inequality within and between education levels. Recently, Autor (2019) similarly emphasizes the role of occupational change in accounting for the increased wage inequality between education groups, but the paper focuses on the deterioration of the labor market opportunities for less-educated workers with the changing structure of work and wages across geographic regions, silent on the changing role of workers’ pre-market skills for wage returns and occupational outcomes.
The remainder of the paper proceeds as follows. Section 2 describes the data sets used in this study. Sections 3 and 4 report changes in labor market returns to cognitive and social skills and occupational outcomes across education levels. Section 5 concludes.
2 Data
2.1 NLSY
The main data source is from the NLSY79 and NLSY97, respectively. The NLSY79 is a nationally representative sample of 12,686 youth ages 14–22 in 1979. The NLSY97 which follows a nearly identical structure to the NLSY79 is also a nationally representative panel survey of 8984 youth ages 12–16 in 1997. The NLSY79 was conducted annually from 1979 to 1993 and biannually from 1994 thereafter, and the NLSY97 is available annually from 1997 to 2011 and biannually from 2011. The data contains detailed measures of pre-market ability, education, parental and personal characteristics, employment, and wages. Most variables across the NLSY79 and NLSY97 are compatible, but some variables which are not comparable are adjusted to facilitate comparison.
In this study, respondents under the age of 23 and over the age of 33 are excluded from the analysis since the oldest individual in the NLSY97 turned 33 in 2013. By restricting the sample to ages 23–33, we can exploit the overlap in ages across surveys. This suggests that we can compare workers during the 1982–1998 period to youth during the recent 2003–2013 period. The sample is further restricted to male not only because their labor supply decisions are least affected by external factors, but also because the large shifts in female labor force participation occurred during this period. Individuals who are enrolled in school and who are missing information on key variables are excluded from the analysis.[1] Consistent with Altonji, Bharadwaj, and Lange (2012), real hourly wages are bottom- and top-coded to be between $3 and $200 per hour.
Armed Forces Qualifying Test (AFQT) has been widely used as a proxy for cognitive skills. Many other studies, such as Neal and Johnson (1996), Altonji, Bharadwaj, and Lange (2012), and Castex and Dechter (2014), use AFQT scores in the literature as a measure of cognitive achievement. AFQT scores are adjusted following the procedure proposed by Altonji, Bharadwaj, and Lange (2012). Specifically, they achieve comparability across survey waves by considering differences in test format, age-at-test, and other idiosyncrasies. We take the raw scores from Altonji, Bharadwaj, and Lange (2012) and normalize them to have a mean of 0 and a standard deviation of 1.
Since the NLSY data do not include psychometrically valid and field-tested measures of social skills, Deming (2017) constructs a pre-market measure of social skills that captures behavioral extraversion and prosocial orientation from the Big 5 personality traits (e.g. Barrick and Mount 1991; Goldberg 1993; Judge et al. 1999). Following Deming (2017), we construct a measure of social skills using the following two variables in the NLSY79: (i) self-reported sociability in 1981 (extremely shy, somewhat shy, somewhat outgoing, extremely outgoing) and (ii) self-reported sociability in 1981 at age 6 (retrospective). Similarly, a measure of social skills in the NLSY97 is constructed using the following two variables: (i) self-reported personality scale: extraverted or enthusiastic (disagree strongly, disagree moderately, disagree a little, neither agree nor disagree, agree a little, agree moderately, agree strongly) (ii) self-reported personality scale: reserved or quiet. We normalize each variable to have zero mean and unit standard deviation and take the average across all variables. We also re-standardize in a way that cognitive and social skills have the same distribution.
One concern is that our measure of social skills may not be a comparable measure of social skills across the two panel surveys. In this respect, we further explore whether our main results are robust to using the alternative measure of social skills in Section 3. Specifically, the NLSY79 includes the personality measure in the 2014 round. This allows us to use the same questions across survey waves to construct a new measure of social skills, minimizing concerns about comparability. Following the same procedure, we normalize the two questions to capture the extroversion factor, take the average, and then renormalize them.
Another concern is that workers with higher cognitive skills are likely to be associated with high education levels, and this pattern could change over time. To address this issue, we check the correlation between cognitive skills and years of schooling. It turns out that the correlation is considerably stable; 0.57 in the NLSY79 and 0.53 in the NLSY97. Furthermore, we control for education in some specifications in regression analysis to purely estimate labor market returns to skills by eliminating the effects coming from education choice.
Lastly, one might be concerned the relationship between social intelligence and cognitive skills; the measure of social skills in our sample may capture unmeasured cognitive skills. We find that the correlations between cognitive and social skills are about 0.1 in the analysis sample of NLSY79 and 0.07 in that of NLSY97, which show very weak positive correlations. Similarly, there is a possibility that a measure of skills is a poor proxy for the underlying abilities so each skill measure may not contain independent information about ability. To account for this bias, we construct a measure of noncognitive skills using the normalized average of the Rotter Locus of Control and the Rosenberg Self-Esteem Scale in the NLSY79 and employing two variables that measure the Big 5 personality factor conscientiousness in the NLSY97, consistent with many other papers including Heckman, Stixrud, and Urzua (2006) and Deming (2017).
In Table 1, we report the key variables for workers between the ages of 23 and 33, excluding respondents who are enrolled in school. Average hourly wages in our data are about $17.96 in the NLSY79 and about $19.04 in the NLSY97 in 2013 dollars. Cognitive skills display modest increases over time, whereas declines in social skills are documented across the NLSY waves.[2] However, the differences in skills across cohorts are not statistically significant.[3] Table 1 also documents an increase in the schooling level; the average of years of schooling is 13.16 in the NLSY79 sample but 13.71 in the NLSY97 sample. Thus, we control for educational attainment using indicators of schooling levels in some specifications, even though results are similar when we use completed years of education. The average potential experience is lower for the NLSY97 cohort because of a higher concentration of young workers and an increase in the schooling level in the NLSY97.[4]
Summary statistics.
| NLSY79 | NLSY97 | |||
|---|---|---|---|---|
| Mean | SD | Mean | SD | |
| Wage | 19.12 | 14.13 | 19.42 | 18.72 |
| Full-time employment | 0.79 | 0.41 | 0.70 | 0.46 |
| Prestige score (standardized) | 0.11 | 1.01 | 0.17 | 1.04 |
| Cognitive skills (standardized) | 0.23 | 1.00 | 0.32 | 0.98 |
| Social skills (standardized) | 0.05 | 0.93 | −0.04 | 0.99 |
| Years of education | 13.53 | 2.59 | 13.94 | 2.83 |
| High school dropout | 0.12 | 0.32 | 0.07 | 0.25 |
| High school | 0.57 | 0.49 | 0.61 | 0.49 |
| Associate’s | 0.05 | 0.22 | 0.07 | 0.25 |
| Bachelor’s | 0.18 | 0.39 | 0.22 | 0.42 |
| Master’s | 0.04 | 0.19 | 0.04 | 0.19 |
| Race | 2.75 | 0.56 | 2.61 | 0.69 |
| Sex | 1.00 | 0.00 | 1.00 | 0.00 |
| Age | 27.66 | 3.07 | 26.69 | 2.63 |
| Potential experience | 9.61 | 3.67 | 6.77 | 3.49 |
| Year | 1988.84 | 3.69 | 2008.49 | 2.62 |
-
Notes: The data are pooled sample of two cohorts: the national longitudinal survey of youth 1979 (NLSY79) and 1997 (NLSY97). The sample includes unenrolled male workers with valid outcome variables. We restrict the age range to 23–33, which allows for a comparison of respondents of the same ages across NLSY waves. We restrict the sample to those wages at least $3 and top code at $200. Wages are inflation-adjusted to 2013 dollars. Full-time employment indicates workers who work at least 35 h per week. Occupation prestige score, taken from Duncan socioeconomic index, exploits survey questions on the prestige of occupations. Prestige score is normalized to have a mean of 0 and a standard deviation of 1. Cognitive skills are measured by the armed forces qualifying test (AFQT). We use the AFQT score crosswalk developed by Altonji, Bharadwaj, and Lange (2012) to adjust for differences across surveys. Social skills are a standardized composite of two questions that measure extroversion in both the NLSY79 (sociability in childhood and sociability in adulthood) and the NLSY97 (two items from the Big 5 personality inventory, which measures extroversion). Both skills are normalized to have a mean of 0 and a standard deviation of 1. Education variables: high school = 1 for high school graduates and 0 otherwise, associate’s = 1 for respondents with an associate degree, bachelor’s = 1 for bachelor’s degree holders, and master’s = 1 for individuals with a master’s degree or higher. Potential experience is defined as age minus schooling minus 6.
2.2 O*NET and DOT
We study the link between skills and workplace tasks over time using key indicators of task content from the O*NET and DOT, following Deming (2017). The O*NET and DOT are extensive surveys, which ask many questions about the requirements and qualifications, the work task involved in working in an occupation, as well as work activities/tasks required in an occupation. These two sources of data are often used for quantifying the task content of occupations. Overall, as described in Appendix Figure A.1, both the O*NET and the DOT produce similar results for analogous task measures. We mainly use the O*NET because it is a more recent survey that contains more diversified task measures than the DOT. However, we also carry out our analysis using the DOT. This enables us to examine the robustness of alternative measures of task measures, thereby increasing confidence in the results.
Occupations are matched with job task measures as reported in the DOT 1977, which is the predecessor of O*NET. Autor, Levy, and Murnane (2003) reduce the DOT variables to a relevant subset using the DOT texture definitions to identify variables that best approximate task content. Specifically, they employ two variables to measure non-routine cognitive tasks. The variable DCP codes the extent to which occupations involve Direction, Control, and Planning of activities; the variable math codes the quantitative skills ranging from arithmetic to advanced mathematics that is required in occupations. We refer to DOT-DCP and DOT-math in this study.
Similarly, Deming (2017) creates the task content of work using the question from the 1998 O*NET. Each question is re-scaled to fall between 0 and 10 and averaged to create the composites by occupation.[5] Each occupation is matched with two indicators of task content, math and social skills. Note that these measures are analogous to DOT-math and DOT-DCP, respectively. First, math task intensity is defined as the average of three variables to capture mathematical competence: (i) mathematical reasoning ability, (ii) mathematics knowledge, and (iii) mathematics skill. Second, the O*NET variables to measure an occupation’s social skill intensity are (i) coordination; (ii) negotiation; (iii) persuasion; and (iv) social perceptiveness.[6]
These task measures are job-specific indications of the standard skills required for competence in each occupation and are useful to understand the task content of each occupation. For instance, sales workers have relatively high values of social skill task intensity but not math task intensity, while computer programmers have relatively high values of math task intensity but not social skill task intensity. These results are in line with expectations that sales workers are often involved in significant interpersonal interaction and that tasks of programming and coding for programmers require building logic around numbers. We follow an approach similar to that of Weinberger (2014), arbitrarily choosing the cut point math task intensity
3 Empirical Analysis
3.1 Labor Market Returns to Skills
To estimate the changes in the returns to cognitive and social skills using the NLSY79 and the NLSY97, we regress labor market outcomes on each skill measure and its interaction with an indicator for being in the NLSY97 sample. Specifically, similar to Deming (2017), the empirical specification for the baseline model is formally given by
In Equation (1), Y
ijt
is the labor market outcome measured at time t for an individual i in the specific region j. To study differential effects of each skill, we allow Y
ijt
to be the log real hourly wage (conditional on employment) or an indicator for full-time employment or occupation prestige score (conditional on employment). A standard set of demographics X
ijt
includes controls for potential experience Exp
it
, a quadratic in potential experience
The results are reported in Table 2. We find that consistent with the previous studies, there has been a remarkable reversal in the returns to cognitive and social skills. Columns (1)–(2) display the results for log hourly wages. As shown in column (1), the wage return to cognitive skills has declined across survey waves. A one standard deviation increase in cognitive skills increases wages by 15.4 % in the NLSY79, but evidenced by the interaction between cognitive skill and the NLSY97 sample that is negative and statistically significant, it increases only by 8.6 % in the NLSY97. In line with the findings by Castex and Dechter (2014) and Beaudry, Green, and Sand (2016), this result can be related to the slowdown in technological progress arising during the 2000s, which declines the demand for cognitive skill tasks. In contrast, the returns to social skills have grown significantly over time. A one standard deviation increase in social skills yields a wage gain of 1.8 % in the NLSY79 but 4.4 % in the NLSY97.[7] That is, social skills have become an important factor for labor market outcomes for youth in the 2000–10s, compared to the 1980–90s. This is largely consistent with by Deming (2017) providing evidence of the growing demand for social skills using the NLSY79 and NLSY97 samples.
Labor market returns to skills.
| Log wage | Full-time employment | Prestige score | ||||
|---|---|---|---|---|---|---|
| (1) | (2) | (3) | (4) | (5) | (6) | |
| Cognitive | 0.154*** | 0.120*** | 0.045*** | 0.034*** | 0.285*** | 0.219*** |
| [0.007] | [0.007] | [0.003] | [0.003] | [0.010] | [0.010] | |
| Cognitive × NLSY97 | −0.068*** | −0.056*** | −0.028*** | −0.023*** | −0.056*** | −0.045*** |
| [0.010] | [0.010] | [0.006] | [0.006] | [0.017] | [0.016] | |
| Social | 0.018*** | 0.020*** | −0.004 | −0.003 | 0.01 | 0.016* |
| [0.006] | [0.006] | [0.003] | [0.003] | [0.009] | [0.009] | |
| Social × NLSY97 | 0.026** | 0.022** | 0.020*** | 0.017*** | 0.050*** | 0.047*** |
| [0.011] | [0.011] | [0.006] | [0.006] | [0.017] | [0.017] | |
| Cognitive × social | – | – | – | |||
| Education dummy | – | – | – | |||
| Demographics and year FE | – | – | – | – | – | – |
| Observations | 52,142 | 52,142 | 51,994 | 51,994 | 46,186 | 46,186 |
| R-squared | 0.28 | 0.296 | 0.033 | 0.038 | 0.223 | 0.278 |
-
Notes: Each column reports results from an estimate of Equation (1), with real log hourly wages, the probability of being employed full-time, and occupational prestige score as outcome variables. The data are a pooled sample of two cohorts of youth: the national longitudinal survey of youth 1979 (NLSY79) and 1997 (NLSY97). We restrict the attention to unenrolled male workers aged between 23 and 33, which allows for a comparison of NLSY respondents at similar ages. Cognitive skills are measured by the armed forces qualifying test (AFQT). We use the AFQT score crosswalk developed by Altonji, Bharadwaj, and Lange (2012) that adjusts for differences across survey waves. The measure of social skills is a standardized composite of two variables that measure extroversion in both the NLSY79 (sociability in childhood and sociability in adulthood) and the NLSY97 (two items from the Big 5 personality inventory that measure extroversion). Both skill measures are normalized to have a mean of 0 and a standard deviation of 1. The regression includes a quadratic in potential experience, race, year, census region, and urbanicity fixed effects, plus additional controls as indicated. Standard errors are in brackets and are clustered at the individual level. *** p
Column (2) adds controls for a vector of education dummy variables and further tests for complementarity by controlling for the interaction between cognitive skills and social skills, following the recent evidence from Weinberger (2014). Controlling for education and skill interaction broadly reduces the effect of cognitive skills, but has almost no effect on the change in returns to cognitive skills over time. The returns to cognitive skills have declined by 47 % across the two waves, which is very similar in magnitude with Deming (2017)’s results. In contrast, the coefficients on social skills have not changed very much across survey waves; a one standard deviation increase in social skills is associated with a wage gain of 2.0 % in the NLSY79 but 4.2 % in the NLSY97. The estimated change in returns to social skills is also largely consistent in magnitude with Deming (2017)’s analysis.
For robustness checks, we additionally controls for noncognitive skills and family background because they are known as important factors for the occupational attainment of workers (Bowles, Gintis, and Osborne 2001; Cobb-Clark and Tan 2011; Lam and Schoeni 1993; Lindqvist and Vestman 2011). Appendix Table A.2 describes the results. Column (1) presents a baseline specification without new controls, and columns (2)–(4) introduce different controls to verify the robustness of the results found above. Column (2) shows that noncognitive skills are highly predictive of wages in the NLSY79 (0.044, p
Columns (3)–(4) in Table 2 present changes in the impact of skills on full-time employment (conditional on employment). Column (3) shows that a one standard deviation increase in cognitive skills increases the probability of being employed full-time by 4.5 % points. However, the interaction between cognitive skills and an indicator for being in the NLSY97 sample is negative and statistically significant, suggesting that the role of cognitive skills for full-time employment has declined in recent years. In contrast, the importance of social skills for full-time employment has significantly increased over time. The effect of social skills is positive and large in the NLSY97, increasing the probability of full-time employment by 2 percentage points, whereas the association between social skills and the probability of full-time work is not statistically significant in the NLSY79. In other words, workers with higher social skills are more likely to be in full-time employment in the 2000s and 2010s. Column (4) adds controls for education and skill complementarity, which slightly reduces the effect of cognitive skills but has almost no impact on that of social skills, supporting the growing importance of social skills for full-time employment.
Columns (5)–(6) study changes in the impacts of skills on occupation prestige score. Occupation prestige score, taken from the Duncan Socioeconomic index, measures the average income, occupation prestige, as well as education requirements.[9] The results are broadly in line with those of the other labor market outcomes. The estimates in column (5) imply that a one standard deviation increase in cognitive skills increases a prestige score of occupation by 28.5 % in the NLSY79, but only by 22.9 % in the NLSY97, indicating the diminished role of cognitive skills for job quality. Conversely, the impacts of social skills on occupation prestige score have markedly increased over time. The coefficient on the interaction between social skills and an indicator for being the NLSY97 is positive and statistically significant, implying the growing importance of social skills for job quality. Column (6) adds controls for education and skill complementarity, which yields similar results in column (5). In sum, social skills have become a more important predictor of career success for young male adults since the 2000s.
3.2 Returns to Skills Between Education Groups
In this subsection, we ask whether the mean impact of skills estimated above masks important variations across labor force groups. Specifically, we present results broken down into two education groups: college graduates, which includes all individuals who hold at least a bachelor’s degree, and high school graduates whose highest educational attainment is a high school diploma or a General Educational Development (GED).
To understand differential impacts of skills across education levels, we classify the population into either high- or low-skilled groups. As a preview of our main message, Figure 1 plots mean real hourly wages computed for two subsets of each education group, according to cognitive and social skills, between 1990 and 2010.[10] This visual presentation clearly shows that individuals with high social skills above the median enjoy relatively greater wage growth across NLSY waves. More importantly, the wage growth for college graduates with high social skills is largest. They experienced wage growth of 10.9 % over the 1990–2010 period, compared to 9.2 % wage growth for high school graduates with high social skills. Conversely, we find that slower wage growth for those with high cognitive skills has occurred for both education groups. Wages grew by only about 7.5 % for college-educated workers with high cognitive skills and 7.2 % for high school-educated workers with high cognitive skills over the period.
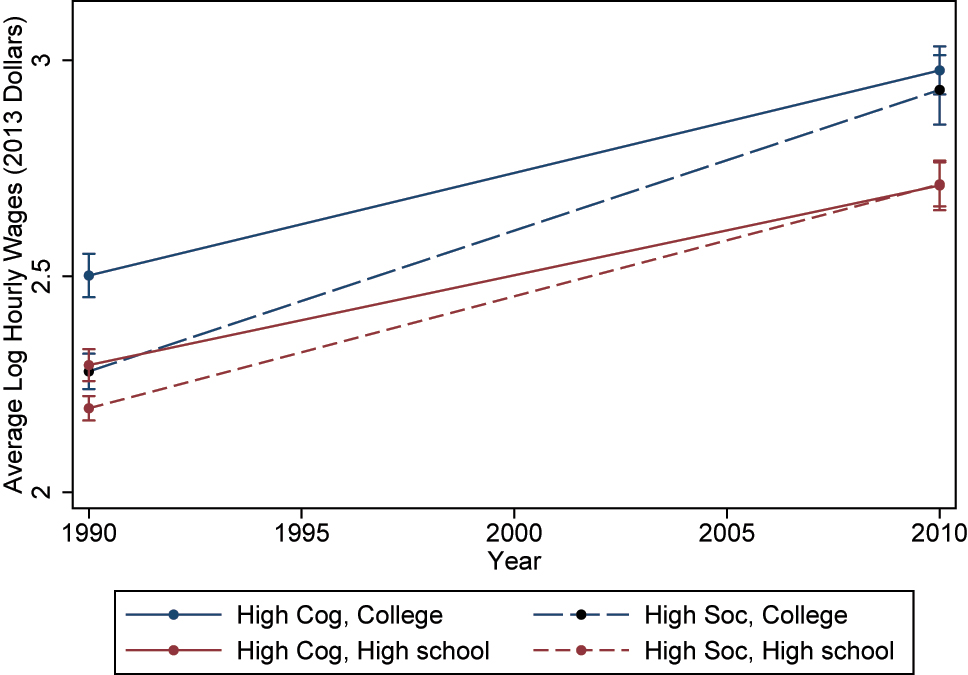
Mean hourly wages between 1990 and 2010, by cognitive and social skills. Notes: Each line in this figure plots the mean hourly wages between 1990 and 2010. Both skills are categorized into two groups: high, and low. The breakdowns are chosen so that each group contains roughly half of the sample. Bars at point estimates indicate a 90 % confidence interval. The data are a pooled sample of two cohorts of youth: the national longitudinal survey of youth 1979 (NLSY79) and 1997 (NLSY97). We restrict the attention to unenrolled male workers aged between 23 and 33. The sample is sorted into two education categories: high school graduates and college graduates. Cognitive skills are measured by the armed forces qualifying test (AFQT). We use the AFQT score crosswalk developed by Altonji, Bharadwaj, and Lange (2012) that adjusts for differences across survey waves. The measure of social skills is a standardized composite of two variables that measure extroversion in both the NLSY79 (sociability in childhood and sociability in adulthood) and in the NLSY97 (two items from the Big 5 personality inventory that measures extroversion).
Next, Table 3 describes returns to skills by education levels. Columns (1)–(2) show that the decrease in wage returns to cognitive skills has occurred across survey waves for all education levels. For high school graduates, a one standard deviation increase in cognitive skills yields a wage gain by 10.8 % in the NLSY79 but only 4.8 % in the NLSY97. Similarly, college graduates with one standard deviation higher cognitive skills are associated with 20.4 % higher wages in the NLSY79, compared to 13.8 % in the NLSY97. In contrast, the returns to social skills have grown significantly across NLSY waves only for college graduates. The estimates on social skills for high school graduates are positive and statistically significant in the NLSY79, but the interaction between social skills and an indicator for being in the NLSY97 sample is not statistically significant. For college graduates, however, the coefficient on social skills is positive and statistically significant only in the NLSY97 sample but not in the NLSY79 sample. The estimates imply that a one standard deviation increase in social skills is associated with a wage gain of 1.2 % in the NLSY79 sample, compared to 7.5 % in the NLSY97 sample. Columns (3)–(4) add control for complementarity between cognitive and social skills, which has little impact on the estimates.[11]
Labor market returns to skills by education.
| Log real hourly wage | ||||
|---|---|---|---|---|
| High school | College | High school | College | |
| (1) | (2) | (3) | (4) | |
| Cognitive | 0.108*** | 0.204*** | 0.108*** | 0.204*** |
| [0.009] | [0.010] | [0.009] | [0.010] | |
| Cognitive × NLSY97 | −0.060*** | −0.066*** | −0.060*** | −0.066*** |
| [0.013] | [0.016] | [0.013] | [0.016] | |
| Social | 0.024*** | 0.01 | 0.026*** | 0.012 |
| [0.008] | [0.008] | [0.008] | [0.009] | |
| Social × NLSY97 | 0 | 0.065*** | −0.002 | 0.063*** |
| [0.014] | [0.017] | [0.014] | [0.017] | |
| Cognitive × social | – | – | ||
| Demographics and year FE | – | – | – | – |
| Observations | 30,277 | 20,689 | 30,277 | 20,689 |
| R-squared | 0.258 | 0.344 | 0.258 | 0.344 |
-
Notes: Each column reports results from an estimate of Equation (1) by education, with real log hourly wages as outcome variables. The data are a pooled sample of two cohorts of youth: the national longitudinal survey of youth 1979 (NLSY79) and 1997 (NLSY97). We restrict the attention to unenrolled male workers aged between 23 and 33, which allows for a comparison of NLSY respondents at similar ages. The sample is sorted into two education categories. High school graduates include all individuals whose highest educational attainment is a high school diploma or a general educational development (GED). College graduates include all individuals who hold at least a bachelor’s degree. Cognitive skills are measured by the armed forces qualifying test (AFQT). We use the AFQT score crosswalk developed by Altonji, Bharadwaj, and Lange (2012) that adjusts for differences across survey waves. The measure of social skills is a standardized composite of two variables that measure extroversion in both the NLSY79 (sociability in childhood and sociability in adulthood) and in the NLSY97 (two items from the Big 5 personality inventory that measure extroversion). Both skill measures are normalized to have a mean of 0 and a standard deviation of 1. The regression includes a quadratic in potential experience, race, year, census region, and urbanicity fixed effects, plus additional controls as indicated. Standard errors are in brackets and are clustered at the individual level. *** p
Appendix Table A.4 demonstrates that these results are robust to using the alternative measure of social skills. To facilitate comparison, we estimate regressions like Equation (1) above but with differently measured social skills across education groups. The wage returns to cognitive skills have decreased across survey waves for all education levels, whereas the returns to social skills have grown rapidly only for college graduates.[12] We take these results as additional suggestive evidence.
Overall, wage returns to social skills for college-educated workers have significantly increased since 2000. In contrast, the effect of social skills on high school graduates remains relatively stable over the past several decades. In the following section, we argue that the differential effects of social skills between education groups are related to changes in occupational demands that have been far more beneficial for college-educated workers with higher social skills.
4 Linking Skills to Occupational Outcomes
4.1 Occupational Sorting on Skills
We first provide the link between pre-market skills and job task measures of a worker’s occupation by education levels and how the sorting patterns have changed over time. To do so, we construct the regression like Equation (1) but with the task content of occupations as the dependent variable, allowing them to vary across educational levels and survey waves. Specifically, we estimate the following regression equation:
where T ijt is the O*NET task measure of a worker’s occupation, College i is the dummy variable of college attainment, and the rest of the terms are defined as above. In particular, notice that we include three-way interactions between pre-market skills, an indicator for being a college graduate, and an indicator for being in the NLSY97 sample to test whether the occupational sorting pattern of college graduates has changed in recent periods.
Table 4 presents the results. Column (1) shows that a one standard deviation increase in cognitive skills increases the social task intensity of a worker’s occupation by 5.17 percentiles. It additionally increases the social task intensity of a college-educated worker’s job by 4.51 percentiles, and this pattern becomes stronger in recent years. Similarly, workers with high social skills tend to sort into social skill-intensive occupations; a one standard deviation increase in social skills increases the social task intensity of a worker’s occupation by 1.58 percentiles. However, since the estimated coefficient on the interaction between social skills and an indicator for being a college graduate is not statistically significant, there seems to be no significant difference in occupational sorting on social skills between educational levels. More importantly, we do find that the coefficient on the three-way interaction with social skills is statistically significant, suggesting that college-educated workers with high social skills have been more likely to select into social skill-intensive jobs in recent years.
Occupational sorting on skills.
| Social skills | Math | |||
|---|---|---|---|---|
| (1) | (2) | (3) | (4) | |
| Cognitive | 0.517*** | −0.025 | 0.638*** | 0.027** |
| [0.032] | [0.020] | [0.032] | [0.012] | |
| Cognitive × college | 0.451*** | −0.031 | 0.507*** | 0.022 |
| [0.046] | [0.032] | [0.049] | [0.016] | |
| Cognitive × college × NLSY97 | 0.226*** | −0.026 | 0.200* | 0.065* |
| [0.082] | [0.061] | [0.108] | [0.035] | |
| Social | 0.158*** | 0.054*** | 0.114*** | −0.003 |
| [0.029] | [0.017] | [0.029] | [0.010] | |
| Social × college | −0.06 | 0.029 | −0.146*** | −0.011 |
| [0.049] | [0.031] | [0.052] | [0.016] | |
| Social × college × NLSY97 | 0.235*** | 0.148** | 0.082 | 0.044 |
| [0.083] | [0.060] | [0.114] | [0.033] | |
| O*NET cognitive tasks | – | – | ||
| Experience | – | – | – | – |
| Demographics and year FE | – | – | – | – |
| Observations | 46,746 | 46,723 | 46,746 | 46,723 |
| R-squared | 0.2 | 0.704 | 0.221 | 0.911 |
-
Notes: Each column reports results from an estimate of Equation (2), with both math and social skill task intensity as the dependent variable. The task measures, weighted by labor supply to conform to the 1980 occupation distribution, are percentiles that range from 0 to 10. Additional O*NET cognitive task measures are number facility, inductive/deductive reasoning, and analysis/use of information. See the text and Deming (2017) for details on the construction of O*NET task measures. The data are a pooled sample of two cohorts of youth: the national longitudinal survey of youth 1979 (NLSY79) and 1997 (NLSY97). We restrict the attention to unenrolled male workers aged between 23 and 33, which allows for a comparison of NLSY respondents at similar ages. Cognitive skills are measured by the armed forces qualifying test (AFQT). We use the AFQT score crosswalk developed by Altonji, Bharadwaj, and Lange (2012) that adjusts for differences across survey waves. The measure of social skills is a standardized composite of two variables that measure extroversion in both the NLSY79 (sociability in childhood and sociability in adulthood) and the NLSY97 (two items from the Big 5 personality inventory that measure extroversion). Both skill measures are normalized to have a mean of 0 and a standard deviation of 1. College is an indicator for individuals with a bachelor’s degree or higher. The regression includes an indicator for whether the respondent was in the NLSY97 wave, a quadratic in potential experience and race, year, census region, and urbanicity fixed effects. Standard errors are in brackets and are clustered at the individual level. *** p
Column (2) adds controls for math task intensity and other related O*NET cognitive task measures. This causes all the coefficients on cognitive skills and their interactions to decline markedly and to become statistically insignificant. Conditional on overall cognitive task intensity, however, the positive coefficients on social skills and their three-way interaction remain highly statistically significant, even though their magnitudes become smaller. These results imply that college-educated workers with high social skills tend to sort into social skill-intensive jobs. In particular, they have sorted into social skill-intensive occupations more strongly in recent periods.
Columns (3) and (4) estimate parallel specifications but with math task intensity of a worker’s occupation as the dependent variable. As shown by in column (3), cognitive skills are an important predictor for a worker who selects into math task-intensive occupations; a one standard deviation increase in cognitive skills increases the math task intensity of a worker’s occupation by 6.38 percentiles. The coefficient on the interaction between cognitive skills and an indicator for being a college graduate is positive and statistically significant, indicating that college-educated workers with high cognitive skills tend to select into math task-intensive jobs. Moreover, the coefficient on the three-way interaction with cognitive skills is positive, implying that they have been more likely to sort into math task-intensive jobs in recent years. Social skills also cause workers to switch into math task-intensive occupations, but their magnitudes are small compared those of cognitive skills; a one standard deviation increase in social skills increases the math task intensity of a worker’s occupation by 1.14 percentiles. However, the coefficient on the interaction between social skills and an indicator for being a college graduate is negative and statistically significant, which suggests that college-educated workers with high social skills is less likely to sort into math task-intensive jobs. Especially, given that the coefficient on the three-way interaction with social skills is statistically insignificant, there has been no empirical evidence on the changes in occupational sorting on social skills for college-educated workers across survey waves. In column (4) that controls for overall cognitive tasks, all the coefficients on cognitive skills and their interactions decline significantly, and the interaction between cognitive skills and an indicator for being a college graduate becomes statistically insignificant. In addition, the coefficients on social skills and their interaction with an indicator for being a college graduate turn to be statistically insignificant, suggesting that social skills are not a crucial predictor for workers selecting into math task-intensive occupations.
To further validate the main findings in Table 4, we estimate the Equation (2) but with the task content of occupations measured using the DOT in Appendix Table A.3. As a reminder, the DOT analogs for math and social skills are DOT-math and DOT-DCP, respectively. Firstly, columns (1) and (2) include three-way interactions on cognitive skills, an indicator for being a college graduate, and an indicator for being in the NLSY97 sample. We find that three-way interactions with cognitive skills are positive and statistically significant in columns (1) and (2). That is, college-educated workers with high cognitive skills are more likely to sort into high DOT-math (column (1)) and high DOT-DCP (column (2)) occupations across survey waves. More importantly, the coefficient of three-way interactions with social skills is positive and statistically significant only in column (1). This suggests that college-educated workers with high social skills have been more likely to sort into social skill-intensive jobs over time. Conversely, college-educated workers in math-intensive occupations have lower social skills in the NLSY79, and this pattern has not changed very much across survey waves.
To sum up, the results in Appendix Table A.3 show that effects on occupational sorting are quite as consistent across data sets. Social skills are a significantly more important predictor of working in high social skill occupations for college graduates in the 2000s and early 2010s, compared to the 1980s and 1990s.
A large literature in organizational economics shows that information and communication technology (ICT) has shifted the design of work toward more flexible, less hierarchical, and self-managing teams. As should be expected, these changes require a higher level of communication skills, social skills, or the skill to work with others since they need to effectively deal with increased uncertainty. Results in Tables 4 and A.3 suggest that college-educated workers in the US have as a group benefited from this change (Caroli and Van Reenen 2001).
4.2 Returns to Occupation Task Intensity
Next, we examine whether the increasing returns to social skills for college graduates are associated with wage returns to occupational sorting on skills. We start by estimating the effect of the task content of a worker’s occupation on wages and then proceed by studying the returns from occupational sorting across education levels over time.
As a preliminary evidence regarding the extent to which occupation task content has affected wage growth over the 1980–2010 time period, Figures 2 and 3 present the cumulative changes in real hourly wages computed for four mutually exclusive subsets by separating all workers into two education groups. They show a dramatic shift in wages depending not only on education levels but also on occupational task intensity. In particular, notice that wage growth is substantially higher in occupations requiring higher levels of social skills. Moreover, wage growth for these occupations has been significantly high for college-educated workers, compared to that of high school-educated workers. That is, the figures clearly emphasize that it is social skill task inputs that principally explain changes in wage patterns over the last 20–30 years.
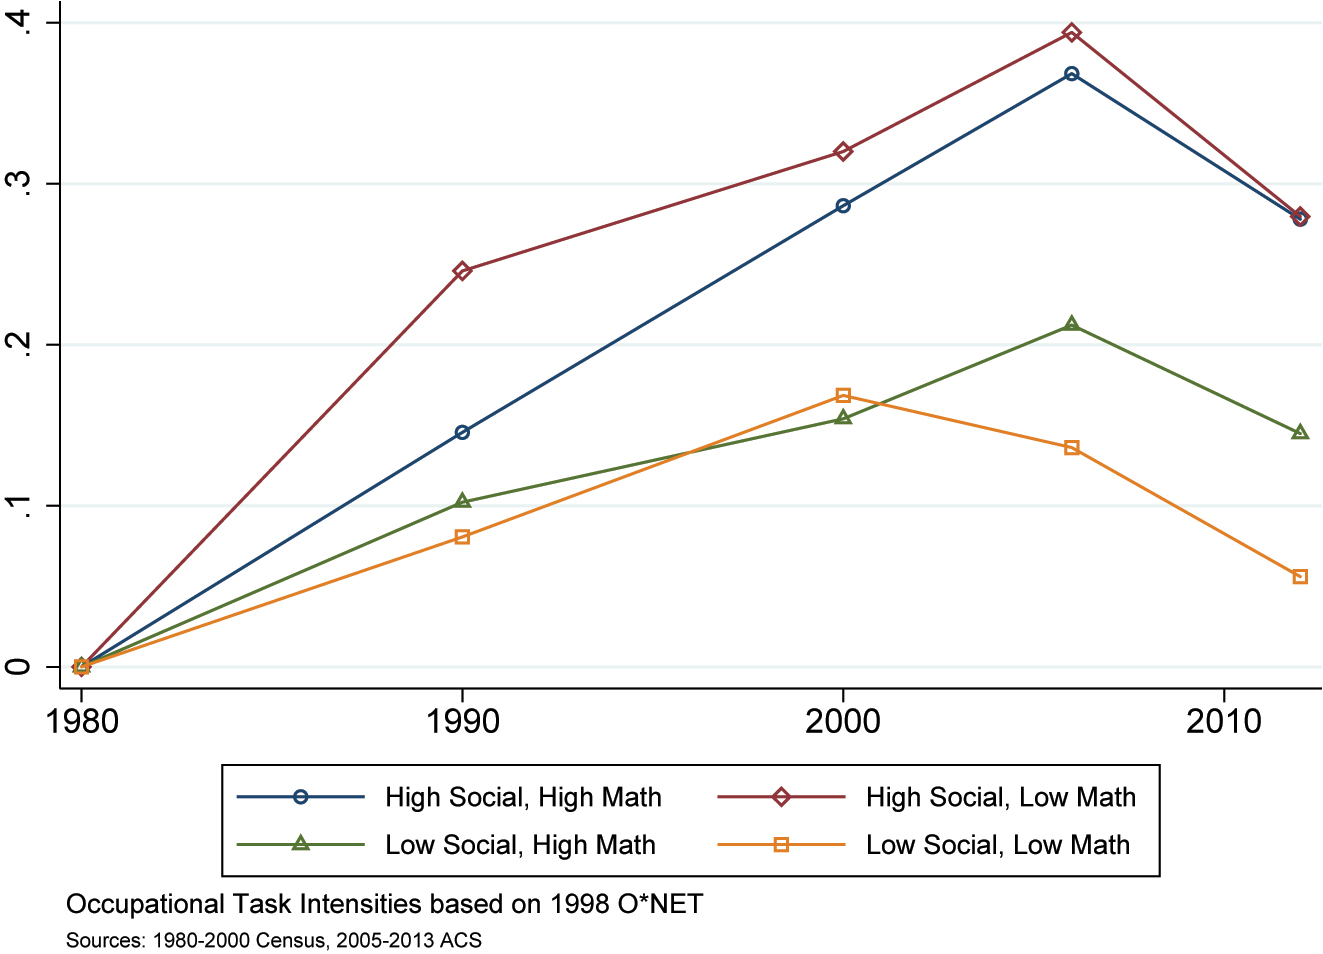
Cumulative change in real hourly wages by occupation task intensity (college graduates).
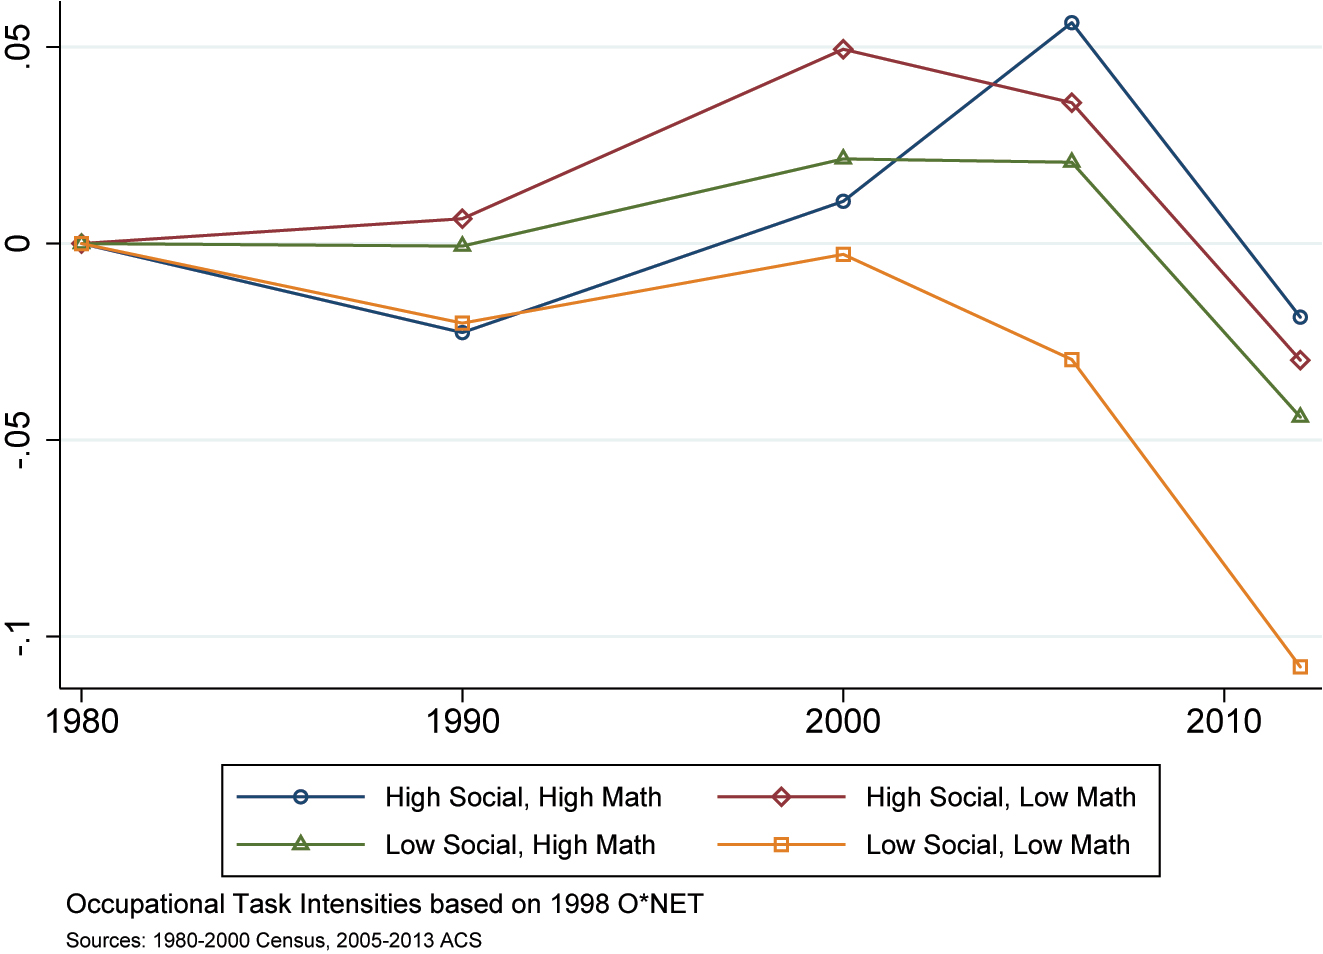
Cumulative change in real hourly wages by occupation task intensity (high school graduates). Notes: Each line in these figures plots the mean hourly wages between 1990 and 2010 for occupations that are above and/or below the 50th percentile in both math and social skill task intensity as measured by the 1998 O*NET. See the text and Deming (2017) for details on the construction of O*NET task measures. Bars at point estimates indicate a 90 % confidence interval. The data are a pooled sample of two cohorts of youth: the national longitudinal survey of youth 1979 (NLSY79) and 1997 (NLSY97). We restrict the attention to unenrolled male workers aged between 23 and 33. The sample is sorted into two education categories: high school graduates and college graduates.
To formally study whether the wage gain from occupational sorting has changed across survey waves by education levels, we estimate:
where SocialT ijt is the social task intensity measure, MathT ijt is the math task intensity measure, η j is a worker-fixed effect, and the rest of the terms are defined as above.[13]
Table 5 displays the results. Column (1) shows that workers earn significantly higher wages when they switch into social skill-intensive occupations; workers in a job that is one percentile higher in the O*NET measure of social skill intensity earn about 2.2 % higher wages. We also do find that the wage return from switching into social skill-intensive occupations is much higher for college-educated workers than high school-educated workers. More importantly, the return for college-educated workers has significantly increased in recent years. To be specific, the estimates imply a wage gain of 3.9 % for college-educated workers and 5.0 % in NLSY97. Column (2) replaces social skill with math task intensity. The wage gain is also positively associated with math task intensity of a worker’s occupation, and it is substantially higher for college-educated workers. However, the increase in the wage gain of college-educated workers sorting into math task-intensive jobs in recent years is relatively weak.
Returns from occupational sorting by education.
| Log real hourly wage | ||||
|---|---|---|---|---|
| (1) | (2) | (3) | (4) | |
| Social skill task intensity | 0.022*** | −0.005* | −0.025*** | |
| [0.002] | [0.003] | [0.003] | ||
| Social skill task intensity × college | 0.017*** | 0.001 | −0.001 | |
| [0.002] | [0.004] | [0.004] | ||
| Social skill task intensity × college × NLSY97 | 0.011*** | 0.025*** | 0.019** | |
| [0.004] | [0.009] | [0.008] | ||
| Math task intensity | 0.039*** | 0.043*** | 0.049*** | |
| [0.002] | [0.003] | [0.005] | ||
| Math task intensity × college | 0.015*** | 0.014*** | 0.013*** | |
| [0.002] | [0.004] | [0.004] | ||
| Math task intensity × college × NLSY97 | 0.005* | −0.016** | −0.011 | |
| [0.003] | [0.008] | [0.008] | ||
| O*NET cognitive tasks | – | |||
| Experience | – | – | – | – |
| Demographics and year FE | – | – | – | – |
| Observations | 46,746 | 46,746 | 46,746 | 46,746 |
| R-squared | 0.285 | 0.304 | 0.304 | 0.316 |
-
Notes: Each column reports results from an estimate of Equation (3) with real log hourly wages as the outcome variable. The task measures, weighted by labor supply to conform to the 1980 occupation distribution, are percentiles that range from 0 to 10. Additional O*NET cognitive task measures are number facility, inductive/deductive reasoning, and analysis/use of information. See the text and Deming (2017) for details on the construction of O*NET task measures. The data are a pooled sample of two cohorts of youth: the national longitudinal survey of youth 1979 (NLSY79) and 1997 (NLSY97). We restrict the attention to unenrolled male workers aged between 23 and 33, which allows for a comparison of NLSY respondents at similar ages. College is an indicator for individuals with a bachelor’s degree or higher. The regression includes a quadratic in potential experience and race, year, census region, and urbanicity fixed effects. Standard errors are in brackets and are clustered at the individual level. *** p
Column (3) includes both the social skill and math task intensity together. This leads the coefficient of social skill task intensity to fade to near 0, but that of the three-way interactions with social skill task intensity remains highly statistically significant and becomes much greater; the wage return of college-educated workers sorting into social skill-intensive jobs has increased by 2.5 % in NLSY97. Conversely, the sign on the three-way interactions with math task intensity turns to be negative and becomes more statistically significant; the wage gain for college-educated workers sorting into a more math task-intensive occupation declines from 5.7 % to 4.1 % between the 1979 and 1997 NLSY cohorts. Column (4) adds controls for O*NET cognitive task measures. The coefficient on the three-way interactions with social skill task intensity remains statistically significant, suggesting that the wage gain of college-educated workers from switching into social skill-intensive occupations has markedly increased over time. In contrast, the coefficient on the triple interactions with math task intensity becomes statistically insignificant, implying that there has been little beneficial from college-educated workers sorting into math task-intensive jobs in recent years.
4.3 Employment in Social Skill-Intensive Occupations
Table 6 presents the propensities of workers in math and social skill task measures associated with each occupation and their changes over time. Results are reported for both the 1990 and 2010 cross-sections.
Employment share by occupation task intensity: 1990–2010.
| 1990 | 2010 | Change | |
|---|---|---|---|
| A. All | |||
| High math, high social | 29.42 | 31.80 | 2.37 |
| High math, low social | 6.29 | 6.42 | 0.13 |
| Low math, high social | 8.06 | 10.78 | 2.71 |
| Low math, low social | 56.23 | 51.01 | −5.21 |
| B. College | |||
| High math, high social | 39.14 | 46.79 | 7.65 |
| High math, low social | 5.97 | 5.32 | −0.65 |
| Low math, high social | 8.18 | 11.42 | 3.24 |
| Low math, low social | 46.70 | 36.46 | −10.24 |
| C. High school | |||
| High math, high social | 21.50 | 21.63 | 0.13 |
| High math, low social | 6.55 | 7.16 | 0.61 |
| Low math, high social | 7.96 | 10.34 | 2.38 |
| Low math, low social | 63.99 | 60.87 | −3.12 |
-
Notes: The data are a pooled sample of two cohorts of youth: the national longitudinal survey of youth 1979 (NLSY79) and 1997 (NLSY97). We restrict the attention to unenrolled male workers aged between 23 and 33. The sample is sorted into two education categories: high school graduates and college graduates. Employment share is categorized by four mutually exclusive occupation categories based on whether they are above and/or below the 50th percentile in nonroutine analytical (math) and social skills task intensities as measured by the O*NET. See the text and Deming (2017) for details on the construction of O*NET task measures.
As indicated in the first column of panel A, jobs with high math and high social skill intensity grew by about 2.37 percentage points, and the probability of working in low math and high social skill jobs grew by about 2.71 percentage points between 1990 and 2010. This reflects a total increase of 5.08 percentage points in the probability of working in social skill-intensive occupations over the past 20 years. In contrast, the propensity to work in jobs with high math but low social skill intensity increases only by 0.13 percentage points for the 1990–2010 periods. Meanwhile, the share of employment in low math and low social skill occupations steeply fell by almost five percentage points, from 56.23 % in 1990 to 51.01 % in 2010. Occupational change in aggregate appears to be a case of the low-skill occupations joining the social skill-intensive occupations. These results are broadly consistent with previous studies including Beaudry, Green, and Sand (2016) and Deming (2017). Especially, Deming (2017) similarly shows the strong growth for jobs requiring high levels of both math and social skills and that this pattern has accelerated since 2000. The difference in occupational sorting by educational attainment could be expected if college is an important pathway toward the growing premium to high math and high social skill jobs.
Panels B and C of Table 6 build on results documented in panel A by separating all samples into two groups: college graduates and high school graduates. The probability of working in high math and high social skill occupations increases with education levels. The employment share of college graduates in high math and high social skill jobs is almost double that of high school graduates. Also, for college-educated workers, this probability rose substantially between 1990 and 2010. Nearly 47 % of college-educated workers worked in high math and high social skill jobs in 2010, compared to 39 % in 1990. However, the propensity of working in jobs requiring high math and high social skills for high school graduates is 21.63 % in 2010, compared to 21.5 %, increasing only by 0.13 percentage point (panel C). This suggests that there has been an essential change in occupational choice, with college graduates significantly sorting into high math and high social skill occupations relative to high school graduates.
In contrast, the employment growth for high math and low social skill occupations between 1990 and 2010 is mainly driven by high school graduates, although it did not substantially grow. The probability of working in high math and low social jobs increased by 0.61 percentage points for high school graduates and decreased by 0.65 percentage points for college graduates. The employment share of jobs with high social skills but low math for college graduates shows patterns that are similar to high school graduates, although the college-educated increasingly sort into high social skill and low math jobs relative to the high school-educated workers. Jobs with low math and high social skill intensity grew by 3.24 percentage points for college-educated workers and by 2.38 percentage points for high school graduates.
The disaggregated statistics in panels B and C include a new finding that there were large changes in different directions for two education groups. Among college-educated workers, occupational sorting has been upward, though not uniformly; the fraction of college workers in high math and high social skill jobs substantially rose, while the share in low math and low social skill jobs decreased significantly between 1990 and 2010. Employment of college workers was roughly split between high math, high social jobs and low math, high social jobs, with 70 percent in the former category, and 30 percent in the latter. Thus, the fraction of college-educated workers working in high math and high social skill jobs is much more than in Panel A, between 1990 and 2010.
Among high school-educated workers, the picture is different. Almost all occupational change reflects a movement from low math and low social skill work to jobs with low math but high social skill intensity. Between 1990 and 2010, the fraction of high school-educated workers in low math and high social skill jobs rose by 2.38 percentage points, and the share in high math and low social skills jobs increased by 0.61 percentage points. Conversely, the share in high math and high social skill jobs very slightly increased, from 21.5 % to 21.63 %.
Overall, changes in employment rates of college graduates in high math and high social skill jobs account for the employment divergence between the high school-educated workers and the university educated. Employment growth for math and social skill-intensive occupations is concentrated particularly for the university educated. Hence, given that the wage growth of college-educated workers employed in those jobs has risen significantly as illustrated in Figures 2 and 3, occupational changes have been more favorable to college-educated workers than less-educated workers.
5 Conclusions
Extending the influential study of Deming (2017), we explore whether there exists a dramatic difference in returns to cognitive and social skills across education levels. The key finding is that the return to cognitive skills has declined for both high school- and college-educated workers, while the growing premium of social skills has been mostly concentrated on college-educated workers. In particular, college-educated workers with high social skills have been more likely to sort into high-paying jobs requiring high levels of social skill tasks in recent years. That is, the labor market has increasingly favored college-educated workers with strong endowments of social skills so that college education becomes an important pathway toward acquiring the rising premium of social skills.
This paper has important policy implications for human capital accumulation. Education policy needs to focus much more on improving students’ social and interpersonal skills. In particular, while online education becomes part of the mainstream of higher education, schools need to more actively develop various educational programs such as team-based projects or learning-by-doing teamwork, which help students enhance their skills in cooperation, resolution of interpersonal conflicts, and self-control. In addition, with the growing importance of teamwork skills in recent years, the job training program at the workplace also needs to be designed to improve workers’ leadership skills or interactive skills which help them efficiently communicate and cooperate with others.
Skills by education.
| College graduates | High school graduates | |||
|---|---|---|---|---|
| Mean | SD | Mean | SD | |
| A. NLSY79 | ||||
| Cognitive skills (standardized) | 0.349 | 1.106 | 0.145 | 0.896 |
| Social skills (standardized) | 0.049 | 0.954 | 0.044 | 0.917 |
| B. NLSY97 | ||||
| Cognitive skills (standardized) | 0.604 | 0.979 | 0.140 | 0.932 |
| Social skills (standardized) | −0.052 | 1.031 | −0.025 | 0.954 |
-
Notes: The data are pooled sample of two cohorts: the national longitudinal survey of youth 1979 (NLSY79) and 1997 (NLSY97). The sample includes unenrolled male workers with valid outcome variables. We restrict the age range to 23–33, which allows for a comparison of respondents of the same ages across NLSY waves. Cognitive skills are measured by the armed forces qualifying test (AFQT). We use the AFQT score crosswalk developed by Altonji, Bharadwaj, and Lange (2012) to adjust for differences across surveys. Social skills are a standardized composite of two questions that measure extroversion in both the NLSY79 (sociability in childhood and sociability in adulthood) and the NLSY97 (two items from the Big 5 personality inventory, which measures extroversion). Both skills are normalized to have a mean of 0 and a standard deviation of 1. College graduates include all individuals who hold at least a bachelor’s degree, and high school graduates whose highest educational attainment is a high school diploma or a general educational development (GED).
Labor market returns to skills with additional controls.
| Log real hourly wage | ||||
|---|---|---|---|---|
| (1) | (2) | (3) | (4) | |
| Cognitive | 0.110*** | 0.091*** | 0.099*** | 0.088*** |
| [0.007] | [0.008] | [0.008] | [0.008] | |
| Cognitive × NLSY97 | −0.060*** | −0.041*** | −0.055*** | −0.039*** |
| [0.010] | [0.012] | [0.011] | [0.012] | |
| Social | 0.018*** | 0.008 | 0.012* | 0.01 |
| [0.006] | [0.007] | [0.007] | [0.007] | |
| Social × NLSY97 | 0.021* | 0.025** | 0.026** | 0.021* |
| [0.011] | [0.012] | [0.012] | [0.012] | |
| Noncognitive | 0.044*** | 0.043*** | ||
| [0.007] | [0.007] | |||
| Noncognitive × NLSY97 | 0 | 0.001 | ||
| [0.012] | [0.012] | |||
| Sibling | 0.001 | 0 | ||
| [0.015] | [0.015] | |||
| Parental education | 0.005** | 0.005** | ||
| [0.002] | [0.002] | |||
| Family intact | 0.045*** | 0.043*** | ||
| [0.012] | [0.012] | |||
| Noncognitive | – | – | ||
| Family background | – | – | ||
| Cognitive × social | – | – | – | – |
| Education dummy | – | – | – | – |
| Demographics and year FE | – | – | – | – |
| Observations | 52,101 | 43,468 | 43,468 | 43,468 |
| R-squared | 0.296 | 0.294 | 0.292 | 0.295 |
-
Notes: Each column reports results from an estimate of Equation (1), with real log hourly wages, the probability of being employed full-time, and occupational prestige score as outcome variables. The data are a pooled sample of two cohorts of youth: the national longitudinal survey of youth 1979 (NLSY79) and 1997 (NLSY97). We restrict the attention to unenrolled workers aged between 23 and 33, which allows for a comparison of NLSY respondents at similar ages. Cognitive skills are measured by the armed forces qualifying test (AFQT). We use the AFQT score crosswalk developed by Altonji, Bharadwaj, and Lange (2012) that adjusts for differences across survey waves. The measure of social skills is a standardized composite of two variables that measure extroversion in both the NLSY79 (sociability in childhood and sociability in adulthood) and in the NLSY97 (two items from the Big 5 personality inventory that measure extroversion). Noncognitive skill is a standardized composite of the Rotter and Rosenberg scores in the NLSY79 and two variables that measure the Big 5 personality factor conscientiousness in the NLSY97. All skill measures are normalized to have a mean of 0 and a standard deviation of 1. Parental education is the average among a respondent’s two parents. The number of a sibling is divided into three categories: no siblings, 1 sibling, and two or more siblings. The family intact indicates family composition at 13–17 years. The regression includes a quadratic in potential experience, race, year, census region, and urbanicity fixed effects, plus additional controls as indicated. Standard errors are in brackets and are clustered at the individual level. *** p
Occupational sorting on skills (DOT task measures).
| DOT-DCP | DOT-math | |
|---|---|---|
| (1) | (3) | |
| Cognitive | 0.443*** | 0.412*** |
| [0.032] | [0.022] | |
| Cognitive × college | 0.495*** | 0.389*** |
| [0.051] | [0.034] | |
| Cognitive × college × NLSY97 | 0.406*** | 0.231*** |
| [0.114] | [0.074] | |
| Social | 0.117*** | 0.081*** |
| [0.028] | [0.019] | |
| Social × college | −0.08 | −0.102*** |
| [0.053] | [0.036] | |
| Social × college × NLSY97 | 0.259** | 0.019 |
| [0.121] | [0.080] | |
| Experience | – | – |
| Demographics and year FE | – | – |
| Observations | 46,693 | 46,693 |
| R-squared | 0.147 | 0.243 |
-
Notes: Each column reports results from an estimate of Equation (2), with both DOT-DCP and DOT-math task intensity as the dependent variable. Both occupational task intensities are based on the 1977 dictionary of occupational titles (DOT). See the text and Autor, Levy, and Murnane (2003) for details on the construction of DOT task measures. For a comparison with Appendix Table A.4, we add additional O*NET cognitive task measures, which are number facility, inductive/deductive reasoning, and analysis/use of information. See the text and Deming (2017) for details on the construction of O*NET task measures. The data are a pooled sample of two cohorts of youth: the national longitudinal survey of youth 1979 (NLSY79) and 1997 (NLSY97). We restrict the attention to unenrolled male workers aged between 23 and 33, which allows for a comparison of NLSY respondents at similar ages. Cognitive skills are measured by the armed forces qualifying test (AFQT). We use the AFQT score crosswalk developed by Altonji, Bharadwaj, and Lange (2012) that adjusts for differences across survey waves. The measure of social skills is a standardized composite of two variables that measure extroversion in both the NLSY79 (sociability in childhood and sociability in adulthood) and the NLSY97 (two items from the Big 5 personality inventory that measure extroversion). Both skill measures are normalized to have a mean of 0 and a standard deviation of 1. College is an indicator for individuals with a bachelor’s degree or higher. The regression includes an indicator for whether the respondent was in the NLSY97 wave, a quadratic in potential experience and education, race, year, census region, and urbanicity fixed effects. Standard errors are in brackets and are clustered at the individual level. *** p
Robustness to alternative social skills measures.
| Log real hourly wage | ||||
|---|---|---|---|---|
| High school | College | High school | College | |
| (1) | (2) | (3) | (4) | |
| Cognitive | 0.116*** | 0.193*** | 0.115*** | 0.195*** |
| [0.010] | [0.012] | [0.010] | [0.012] | |
| Cognitive × NLSY97 | −0.069*** | −0.061*** | −0.067*** | −0.062*** |
| [0.014] | [0.017] | [0.014] | [0.017] | |
| Social | 0.029*** | 0.031*** | 0.031*** | 0.031*** |
| [0.009] | [0.011] | [0.009] | [0.011] | |
| Social × NLSY97 | −0.005 | 0.044** | −0.006 | 0.043** |
| [0.015] | [0.019] | [0.015] | [0.018] | |
| Cognitive × social | – | – | ||
| Demographics and year FE | – | – | – | – |
| Observations | 25,005 | 16,336 | 24,666 | 16,062 |
| R-squared | 0.261 | 0.34 | 0.263 | 0.34 |
-
Notes: Each column reports results from an estimate of Equation (1) by education, with real log hourly wages as outcome variables. The data are a pooled sample of two cohorts of youth: the national longitudinal survey of youth 1979 (NLSY79) and 1997 (NLSY97). We restrict the attention to unenrolled male workers aged between 23 and 33, which allows for a comparison of NLSY respondents at similar ages. The sample is sorted into two education categories: high school graduates and college graduates. Cognitive skills are measured by the armed forces qualifying test (AFQT). We use the AFQT score crosswalk developed by Altonji, Bharadwaj, and Lange (2012) that adjusts for differences across survey waves. Social skill is a standardized composite of two items from the Big 5 personality inventory that measures extroversion. Both skill measures are normalized to have a mean of 0 and a standard deviation of 1. The regression includes a quadratic in potential experience, race, year, census region, and urbanicity fixed effects, plus additional controls as indicated. Standard errors are in brackets and are clustered at the individual level. *** p
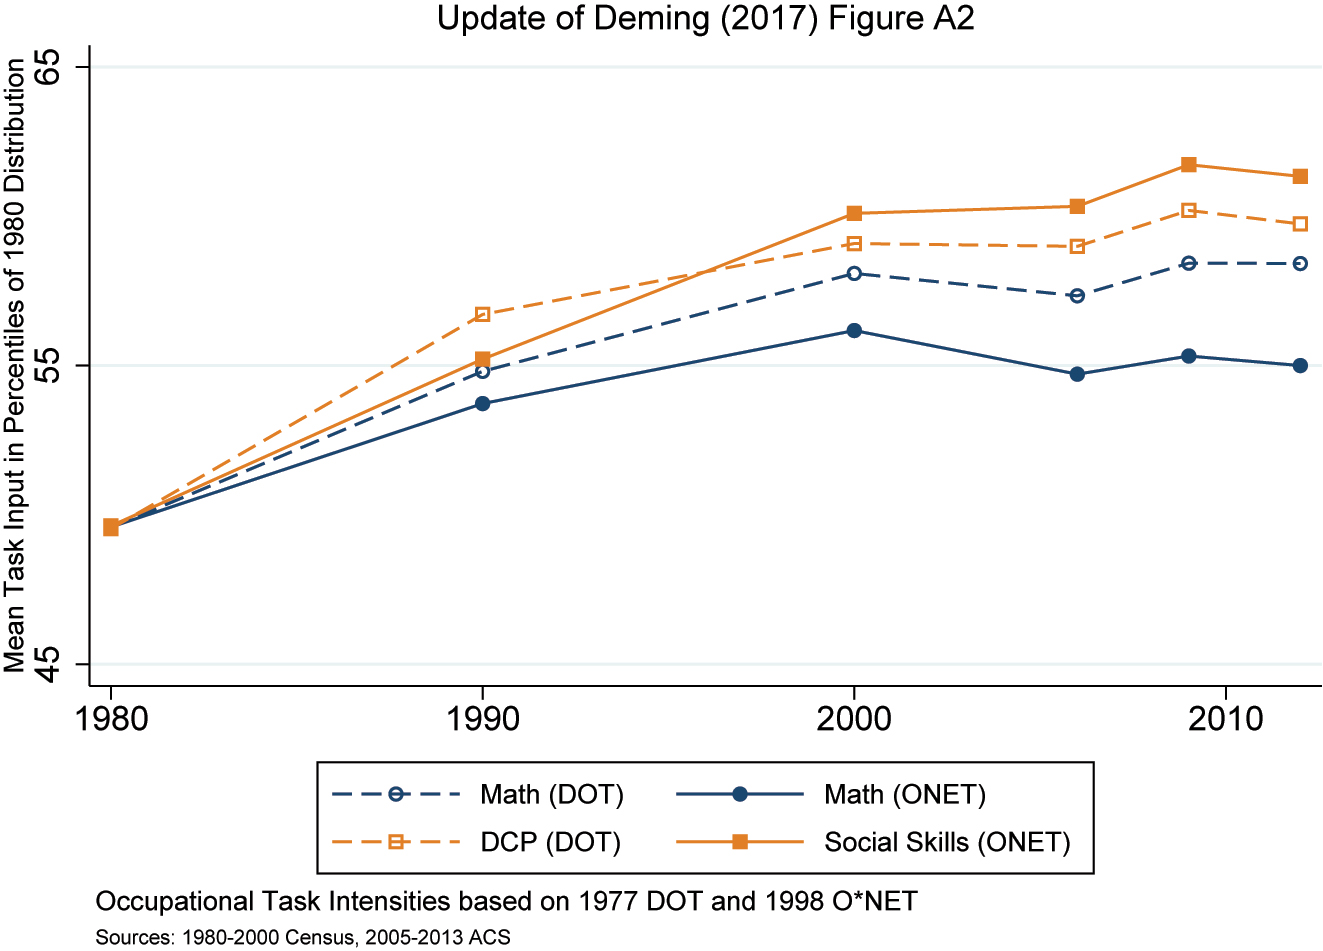
Comparison of DOT and O*NET task measures. Notes: O*NET 1998; DOT 1977 task measures by occupation are paired with data from the IPUMS 1980–2000 censuses and the 2005–2013 American community survey samples. Deming updated occupation codes from Autor and Dorn (2013) and Price and Price (2013). Data are aggregated to industry-education-sex cells by year, and each cell is assigned a value corresponding to its rank in the 1980 distribution of task input. Plotted values depict the employment-weighted mean of each assigned percentile in the indicated year. See Deming (2017) for details on the construction of O*NET task measures and examples of occupations.
References
Acemoglu, D., and D. Autor. 2011. “Skills, Tasks and Technologies: Implications for Employment and Earnings.” In Handbook of Labor Economics, Vol. 4. Amsterdam: Elsevier.10.3386/w16082Search in Google Scholar
Altonji, J. G., and C. R. Pierret. 2001. “Employer Learning and Statistical Discrimination.” Quarterly Journal of Economics 116 (1): 313–50. https://doi.org/10.1162/003355301556329.Search in Google Scholar
Altonji, J. G., P. Bharadwaj, and F. Lange. 2012. “Changes in the Characteristics of American Youth: Implications for Adult Outcomes.” Journal of Labor Economics 30 (4): 783–828. https://doi.org/10.1086/666536.Search in Google Scholar
Autor, D. H. 2019. “Work of the Past, Work of the Future.” AEA Papers and Proceedings 109: 1–32. https://doi.org/10.1257/pandp.20191110.Search in Google Scholar
Autor, D. H., and D. Dorn. 2013. “The Growth of Low-Skill Service Jobs and the Polarization of the Us Labor Market.” The American Economic Review 103 (5): 1553–97. https://doi.org/10.1257/aer.103.5.1553.Search in Google Scholar
Autor, D. H., F. Levy, and R. J. Murnane. 2003. “The Skill Content of Recent Technological Change: An Empirical Exploration.” Quarterly Journal of Economics 118 (4): 1279–333. https://doi.org/10.1162/003355303322552801.Search in Google Scholar
Autor, D. H., L. F. Katz, and M. S. Kearney. 2008. “Trends in U.S. Wage Inequality: Revising the Revisionists.” The Review of Economics and Statistics 90 (2): 300–23. https://doi.org/10.1162/rest.90.2.300.Search in Google Scholar
Barrick, M. R., and M. K. Mount. 1991. “The Big Five Personality Dimensions and Job Performance: A Meta-Analysis.” Personnel Psychology 44 (1): 1–26. https://doi.org/10.1111/j.1744-6570.1991.tb00688.x.Search in Google Scholar
Beaudry, P., D. A. Green, and B. M. Sand. 2016. “The Great Reversal in the Demand for Skill and Cognitive Tasks.” Journal of Labor Economics 34 (S1): 199–247. https://doi.org/10.1086/682347.Search in Google Scholar
Borghans, L., B. ter Weel, and B. A. Weinberg. 2014. “People Skills and the Labor-Market Outcomes of Underrepresented Groups.” Industrial and Labor Relations Review 67 (2): 287–334. https://doi.org/10.1177/001979391406700202.Search in Google Scholar
Bowles, S., H. Gintis, and M. Osborne. 2001. “The Determinants of Earnings: A Behavioral Approach.” Journal of Economic Literature 39 (4): 1137–76. https://doi.org/10.1257/jel.39.4.1137.Search in Google Scholar
Caroli, E., and J. Van Reenen. 2001. “Skill-Biased Organizational Change? Evidence from a Panel of British and French Establishments.” Quarterly Journal of Economics 116 (4): 1449–92. https://doi.org/10.1162/003355301753265624.Search in Google Scholar
Castex, G., and E. K. Dechter. 2014. “The Changing Roles of Education and Ability in Wage Determination.” Journal of Labor Economics 32 (4): 685–710. https://doi.org/10.1086/676018.Search in Google Scholar
Cobb-Clark, D. A., and M. Tan. 2011. “Noncognitive Skills, Occupational Attainment, and Relative Wages.” Labour Economics 18 (1): 1–13. https://doi.org/10.1016/j.labeco.2010.07.003.Search in Google Scholar
Deming, D. J. 2017. “The Growing Importance of Social Skills in the Labor Market.” Quarterly Journal of Economics 132 (4): 1593–640. https://doi.org/10.1093/qje/qjx022.Search in Google Scholar
Deming, D., and L. B. Kahn. 2018. “Skill Requirements across Firms and Labor Markets: Evidence from Job Postings for Professionals.” Journal of Labor Economics 36 (S1): S337–69. https://doi.org/10.1086/694106.Search in Google Scholar
Duncan, O. D., and A. J. Reiss. 1961. “A Socioeconomic Index for All Occupations.” Class: Critical Concepts 1 (1): 388–426.Search in Google Scholar
Goldberg, L. R. 1993. “The Structure of Phenotypic Personality Traits.” American Psychologist 48 (1): 26. https://doi.org/10.1037/0003-066x.48.1.26.Search in Google Scholar
Guvenen, F., and B. Kuruscu. 2010. “A Quantitative Analysis of the Evolution of the U.S. Wage Distribution, 1970–2000.” NBER Macroeconomics Annual 24 (1): 227–76. https://doi.org/10.1086/648297.Search in Google Scholar
Heckman, J. J., J. Stixrud, and S. Urzua. 2006. “The Effects of Cognitive and Noncognitive Abilities on Labor Market Outcomes and Social Behavior.” Journal of Labor Economics 24 (3): 411–82. https://doi.org/10.1086/504455.Search in Google Scholar
Judge, T. A., C. A. Higgins, C. J. Thoresen, and M. R. Barrick. 1999. “The Big Five Personality Traits, General Mental Ability, and Career Success across the Life Span.” Personnel Psychology 52 (3): 621–52. https://doi.org/10.1111/j.1744-6570.1999.tb00174.x.Search in Google Scholar
Katz, L. F., and K. M. Murphy. 1992. “Changes in Relative Wages, 1963–1987: Supply and Demand Factors.” Quarterly Journal of Economics 107 (1): 35–78. https://doi.org/10.2307/2118323.Search in Google Scholar
Krusell, Per, Lee E. Ohanian, J.-V. Rios-Rull, and G. L. Violante. 2000. “Capital-Skill Complementarity and Inequality: A Macroeconomic Analysis.” Econometrica 68 (5): 1029–53. https://doi.org/10.1111/1468-0262.00150.Search in Google Scholar
Kuhn, P., and C. Weinberger. 2005. “Leadership Skills and Wages.” Journal of Labor Economics 23 (3): 395–436. https://doi.org/10.1086/430282.Search in Google Scholar
Lam, D., and R. F. Schoeni. 1993. “Effects of Family Background on Earnings and Returns to Schooling: Evidence from brazil.” Journal of Political Economy 101 (4): 710–40. https://doi.org/10.1086/261894.Search in Google Scholar
Lindqvist, E., and R. Vestman. 2011. “The Labor Market Returns to Cognitive and Noncognitive Ability: Evidence from the Swedish Enlistment.” American Economic Journal: Applied Economics 3 (1): 101–28. https://doi.org/10.1257/app.3.1.101.Search in Google Scholar
Neal, D. A., and W. R. Johnson. 1996. “The Role of Premarket Factors in Black-White Wage Differences.” Journal of Political Economy 104 (5): 869–95. https://doi.org/10.1086/262045.Search in Google Scholar
Price, B., and B. Price. 2013. “The Changing Task Composition of the Us Labor Market: An Update of Autor, Levy, and Murnane (2003).” unpublished manuscript,.Search in Google Scholar
Speer, J. D. 2017. “Pre-Market Skills, Occupational Choice, and Career Progression.” Journal of Human Resources 52 (1): 187–246. https://doi.org/10.3368/jhr.52.1.0215-6940r.Search in Google Scholar
Weidmann, B., and D. J. Deming. 2021. “Team Players: How Social Skills Improve Team Performance.” Econometrica 89 (6): 2637–57. https://doi.org/10.3982/ecta18461.Search in Google Scholar
Weinberger, C. J. 2014. “The Increasing Complementarity Between Cognitive and Social Skills.” The Review of Economics and Statistics 96 (5): 849–61. https://doi.org/10.1162/rest_a_00449.Search in Google Scholar
© 2024 Walter de Gruyter GmbH, Berlin/Boston
Articles in the same Issue
- Frontmatter
- Research Articles
- Asymmetric Performance Evaluation Under Quantity and Price Competition with Managerial Delegation
- Incentive-Induced Social Tie and Subsequent Altruism and Cooperation
- University Admission: Is Achievement a Sufficient Criterion?
- Taxing Firearms Like Alcohol or Tobacco
- The Growing Importance of Social Skills for Labor Market Outcomes Across Education Groups
- The Impact of the Affordable Care Act in Puerto Rico
- Strategic Individual Behaviors and the Efficient Vaccination Subsidy
- Is Family-Priority Rule the Right Path? An Experimental Study of the Chinese Organ Allocation System
- Letters
- Real-effort in the Multilevel Public Goods Game
- Initial Payment and Refunding Scheme for Climate Change Mitigation and Technological Development Among Heterogeneous Countries
- Edutainment and Dwelling-Related Assets in Poor Rural Areas of Peru
- Biased Voluntary Nutri-Score Labeling
- Decompositions of Inequality and Poverty by Income Source
- Job Loss and Migration: Do Family Connections Matter?