Failing Young and Temporary Workers? The Impact of a Disruptive Crisis on a Dual Labour Market
-
Carolina Nunes
 ,
João Pereira dos Santos
,
Susana Peralta
,
João Pereira dos Santos
,
Susana Peralta
 and
José Tavares
and
José Tavares

Abstract
We study the impact of the pandemic crisis using monthly data covering the universe of individuals registered as unemployed in mainland Portuguese municipalities, complemented with electronic payments, linked employer–employee data, and furlough records. Event study designs identify a sharp increase in unemployment, driven mostly by termination of temporary contracts, and a decrease in new job placements. With triple difference-in-differences, we show that the effects are stronger in more dual municipal labour markets, i.e. with a higher share of temporary jobs, concentrated in young workers and middle educated individuals. The asymmetries are exacerbated by the duality of the municipal labour market.
1 Introduction
In most countries of the Eurozone, with the exception of Greece and Spain, employment in 2017 had mostly reached the 2006 levels. However, the composition of employment changed: the share of temporary workers has increased (Weel 2018). In Portugal, the unemployment rate in 2019 was 6.6%, and the share of temporary workers 22%, i.e. twice the OECD average. Therefore, compared with the financial and sovereign debt crisis of 2008–2012, the disruptive pandemic crisis of 2020 hit a structurally different (dual) labour market and, moreover, was met with massive public spending aimed at the protecting the so-called matching capital between workers and firms (Dias et al. 2020, Mayhew and Anand 2020). Several European countries (e.g. France, Germany, the Netherlands, Portugal, Sweden, Spain, Switzerland, and the UK) implemented furlough schemes, most of them prohibiting firms from dismissing workers while the support lasted. By May 2020, about 50 million workers were supported by such job retention schemes (OECD 2020).[1] Portugal is a Eurozone member severely affected by the pandemic crisis (GDP contraction of 8.4% in 2020), with a generous coverage of the furlough policy (a peak of 1.2 million workers, or one fourth of the workforce (Banco de Portugal 2020). As a consequence, the unemployment rate in 2020 reached 7%, barely above the 2019 level. This stability hides considerable heterogeneous effects. Indeed, job separations can only occur in firms that do not benefit from support, or through terminations of temporary contracts in the remaining ones, thus leaving the self-employed and temporary workers in a vulnerable position (Mayhew and Anand 2020). This naturally raises the question of the impact of the crisis on temporary workers.
We use difference-in-differences event studies, and triple difference regressions, to address the following research questions. First, we estimate the causal impact of the pandemic (and subsequent restrictive policies) on jobless claims and job placements. Second, we investigate the uneven impacts along the gender, age, and education level of the workers. Finally, we show how the duality in municipal labour markets amplifies both the magnitude and the asymmetry of the effects.
Our data covers all individuals formally registered as unemployed with the Portuguese Public Employment Service, aggregated at the municipal level, in all the 278 mainland municipalities, between October 2016 and August 2020.[2] We complement this with several other data sources, including the Labour Force Survey, pre-shock linked employer–employee data, electronic payments data, and Google mobility reports.
Our main findings are as follows. Firstly, the pandemic caused a rise on year-on-year growth rates of registered unemployment from 27 percentage points in April up to 38 percentage points in July, and a severe drop of 63 percentage points in new job placements in April. Secondly, we find evidence that the duality mediated the impact of the crisis on employment. Between March and May, there was a sharp increase in the number of jobless claims filed because workers were dismissed from their (permanent or temporary) job or because their temporary contract ended. Almost two thirds of job separations until September 2020 are due to termination of temporary contracts. Moreover, we find that the shock is larger in municipalities with a higher share of temporary workers: an increase of one standard deviation (8%) in the share of temporary workers increases joblessness claims by 11.6%.
Thirdly, we demonstrate that the impact on unemployment was 20.8% and 25.8% larger for workers who are less than 25 years old, and between 25 and 34 years old, respectively, when compared with the reference group used in the regressions, i.e. older than 55. We document an inverted u-shape impact of education on unemployment, with the highest impact concentrated on individuals with lower (15%) and upper secondary education (17.5%), vis-à-vis the highly educated ones. While we find no evidence of gender differences in unemployment, we document an additional drop in new job placements of women compared to men. Lastly, asymmetric effects are amplified by the duality of municipal labour markets. In particular, an increase of one standard deviation in the share of temporary contracts causes a rise of 12.6%, between 14% and 17%, and between 12% and 13% in the number of unemployed people who are female, younger than 34, and have secondary education.
The literature on the economic impacts of Covid-19 has uncovered large impacts on the labour market. Alstadsæter et al. (2020) find that 12% of the labour force filed jobless claims in the first weeks of the crisis in Norway. Cajner et al. (2020) analyse US administrative payroll data and show that aggregate employment decreased by 21% through late-April, with slight signs of recovery only by late-June. Various authors documented severe drops in job posts (Bamieh and Ziegler 2020; Hensvik et al. 2020) and a decrease in hirings on the period following lockdown (Betcherman et al. 2020). Lafuente et al. (2022) find that, in the early period of the pandemic crisis, permanent workers adjusted more the hours-per-worker (i.e. the intensive margin) than the temporary ones, while the reverse is true for the extensive margin. Using job vacancy data collected in real-time by the Burning Glass Technologies platform, Forsythe et al. (2020) find that, in the US, job postings collapsed by 44% between February and April 2020. Coibion et al. (2020) used scan data in April 2020 to show that job loss in the US was larger than new unemployment claims, with many workers moving into inactivity. For Canada, Jones et al. (2020) found new vacancies recovered in June, from 50% to around 80% of the pre-pandemic level.
A number of papers present convincing evidence of the unequal labour market impacts of the pandemic on temporary workers. Couch et al. (2020) use the Current Population Survey to show how the black-white unemployment gap increased to levels resembling those of the Great Recession. Casarico and Lattanzio (2020) uses administrative data on a sample of contracts for the first quarter of 2020 in Italy to find that temporary workers are 8 p.p. more likely to lose their job, contrary to older and highly educated workers, who are more protected against job loss. Herzog-Stein et al. (2022) also show that, in Germany, the labour adjustment used the temporary workers margin. Papers based on survey data that confirm the larger effect on temporary workers include Adams-Prassl et al. (2020a, 2020b), Kikuchi et al. (2021) and Aum et al. (2021) in the UK, USA, and Germany, Japan, and South Korea. Younger workers are shown to be the most affected in Canada by Lemieux et al. (2020), Japan by Kikuchi et al. (2021), and the US by Cho and Winters (2020), Cortes and Forsythe (2022) and Montenovo et al. (2020). Female self-employed are found to be more affected by Graeber et al. (2021), using survey data from Germany. Other papers that show a disproportionate impact on female workers include Kikuchi et al. (2021) for Japan and Cortes and Forsythe (2022) for the US. Alon et al. (2020) find that women were more struck by the crisis in the US, contrary to Hupkau and Petrongolo (2020) who find no significant job loss differences between genders in the UK. Survey data also indicates that less educated, lower income and minority workers in the US are more affected (Cho and Winters 2020). Moreover, Botha et al. (2021), using Australian data, shows that the subjective (financial) well-being is affected by the shock. Adams-Prassl et al. (2022) document strong heterogeneity of the possibility of remote working across industries and occupations in the US and the and Montenovo et al. (2020) add that workers in jobs that are more compatible with remote work fared better. Similarly, Bonacini et al. (2021) shows that remote work favours male, older, high-educated, and high-paid employees.
Two papers follow an approach closer to ours. Meekes et al. (2020) implements a triple difference-in-differences strategy with administrative data from Statistics Netherlands and document large impacts on the employment, working hours, and hourly wages of non-essential workers, particularly the female ones, and on employment and working hours of essential workers who are single parents. Kalenkoski and Wulff (2020) implement triple difference-in-differences specifications using the US Current Population Survey and find that the impact on employment and working hours was larger for coupled women than for coupled men, and smaller for single women than for single men.[3]
The paper offers four main contributions. Firstly, we show how the duality of the labour market magnifies the impact and the asymmetry of the labour market shock caused by the onset of the pandemic. Secondly, we estimate asymmetric effects along gender, education, and age, adding to the existing causal evidence on gender and marital or child rearing status (Adams-Prassl et al. 2020a, 2020b; Kalenkoski and Wulff 2020), gender and type of occupation (Meekes et al. 2020), and ethnicity (Couch et al. 2020). Thirdly, we rely on administrative data that covers the universe of newly registered unemployed workers in Portugal, while most of the papers rely on survey data, with the exception of, e.g. Casarico and Lattanzio (2020) and Meekes et al. (2020).
We also discuss possible mechanisms of adjustment, and argue that we can interpret our results as evidence that furlough schemes do not insure some segments of the labour market against the negative shock of the pandemic crisis.[4] This last contribution relates our paper to the discussion in Giupponi et al. (2022), who argue that furlough and (extended) unemployment insurance are complementary policies. Similarly, Birinci et al. (2021) claim that furlough-type policies are preferred to extended unemployment insurance in isolation, but complementary when used simultaneously, as they cater to different groups of workers. A smaller furlough coverage is sufficient to protect the matching capital of high-productivity jobs, and avoid locked-in effects after the crisis.[5]
The remainder of this paper is structured as follows. Section 2 describes the Covid-19 shock in Portugal and the main policy responses, and proceeds by discussing the data (Subsection 3.1) and the methodology used (Subsection 3.2). Section 4 discusses the aggregate effects of the shock, and Subsection 4.2 highlights the mediating effect of labour market duality. Heterogeneous effects are shown in Section 5 and Section 6 discusses possible mechanisms. Finally, Section 7 concludes.
2 An Asymmetric Shock in a Dual Labour Market
2.1 Covid-19 in Portugal and Policy Responses
The government closed schools and imposed circulation restrictions on the border with Spain shortly after the first confirmed Covid-19 case on March 2nd 2020. On March 18th, the President declared the State of Emergency, which lasted until May 3rd, when it was substituted by a less severe but still fairly constrained State of Calamity. As a consequence, all retail was shutdown, with the exception of supermarkets, pharmacies, and gas stations. Restaurants were only allowed to serve take-away. Further restrictions on circulation and mandatory homeworking for compatible jobs were also decreed.[6]
The strong impact on the Portuguese economy is documented in Carvalho et al. (2020), using data from electronic purchases. They provide causal estimates of decreases in year-on-year growth rates of 16, 37, and 28 percentage points on overall purchases in March, April and May, respectively. The authors also show that the impact was very uneven across sectors. The Hospitality sector (including restaurants, coffee shops and accommodation), Fashion and Beauty, and Transportation were among the most affected. The differential impact across sectors induced asymmetric effects of the crisis. Average wages in the Hospitality, and Fashion and Beauty sectors are smaller than the national average. The share of low educated and foreign workers in Restaurants is higher than the national average. At the same time, 2022, show that the sectorial composition of the municipal economies leads to asymmetries in the geographic effect of the crisis.[7] Importantly, as shown in Peralta et al. (2021), the incidence of non-permanent contracts in these sectors was larger than for the overall economy.
These sizeable consequences were met with policies targeting the labour market, of which we highlight three. Firstly, the Portuguese Covid-19 special furlough scheme was implemented on March 26th The scheme covered labour costs for the whole duration of compulsory shut-down, and was in place until July 2022.[8] Administrative data from Social Security shows that 1.2 million workers were supported, mostly concentrated in the Retail and Hospitality sectors.[9] Firms that benefited from the furlough policy could not dismiss workers on permanent contracts. They could, however, choose not to renew temporary contracts, stop hiring workers with no formal contract, and not replace workers who depart voluntarily.[10]
The bulk of the effects on unemployment should arise from these margins by recipient firms, or from firms that did not qualify or apply for the scheme. Importantly, furlough allows firms to suspend employment contracts or reduce employees’ working hours, with social security covering two-thirds of the wage. Therefore, keeping the workers is costly.
Secondly, remote work was made compulsory for compatible occupations. Survey data from Statistics Portugal shows that there were around 1 million remote workers in the Spring of 2020, mostly highly educated and high-income ones. Their average wage was 50% higher than that of non-remote workers, and 70% of them had a higher education degree.
Finally, access to unemployment benefits was eased as of July 25, encompassing permanent or temporary employees, and halving the minimum qualifying contract duration in the past 24 months. Since our period of analysis ends in August, this legal change is unlikely to affect the flows of unemployed individuals. Moreover, mandatory job search and training were suspended between March and May.
2.2 Labour Market in Portugal
Permanent workers in Portugal benefit from one of the highest levels of employment protection across the OECD, which, according to the European Commission, increases both the reluctance of firms to hire permanent employees (European Commission 2018) and the importance of non-permanent employment (OECD 2017).
Figure 1 shows that temporary employment, i.e. wage and salary workers whose job has a pre-determined termination date, accounts for 22% of all employees in Portugal, above the OECD average of 12%, and only exceeded by Spain (27%) and Poland (24%). This makes Portugal an interesting laboratory to study the impact of a major disruptive shock (such as the pandemic), with policies that create asymmetric incentives regarding job separations for different types of workers.
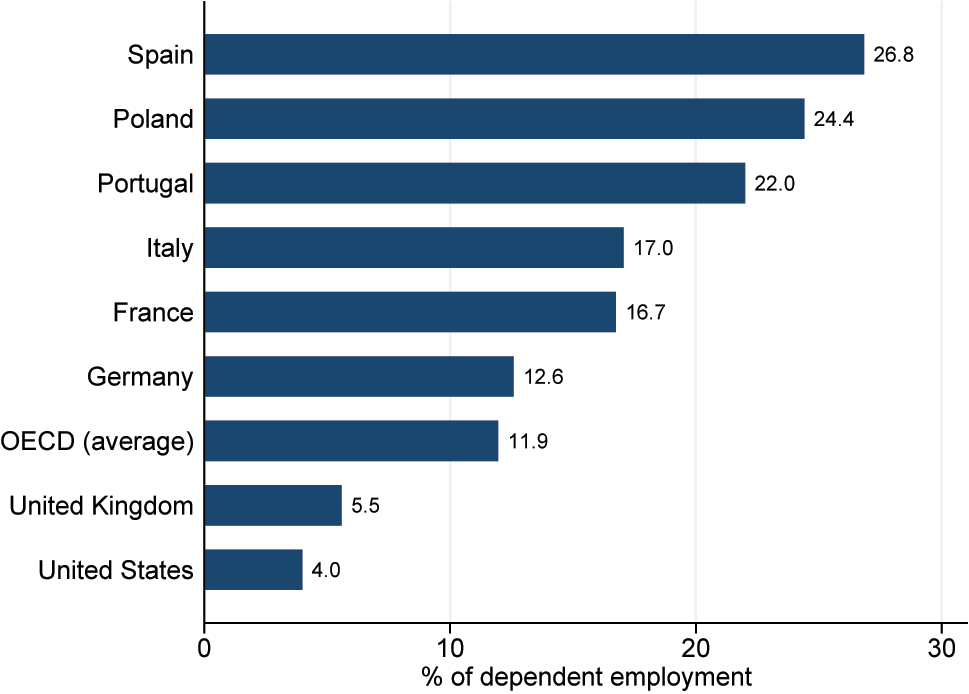
Share of temporary employment (as % of employees), 2018.
Source: OECD.
Moreover, legal restrictions on nominal wage cuts, combined with the long recent period of low inflation, leave employers with little margin to adjust real wages. As a consequence, in periods of crisis, employment (and especially temporary employment) becomes the main margin of adjustment (Carneiro et al. 2014; Martins and Portugal 2019).
This is confirmed by Figure 2, constructed with data from the Labour Force Survey. It shows that the YoY quarterly change in employment in 2020 was positive in the first quarter and only marginally negative in the second, for permanent workers, in sharp contrast with the strongly negative for temporary ones.
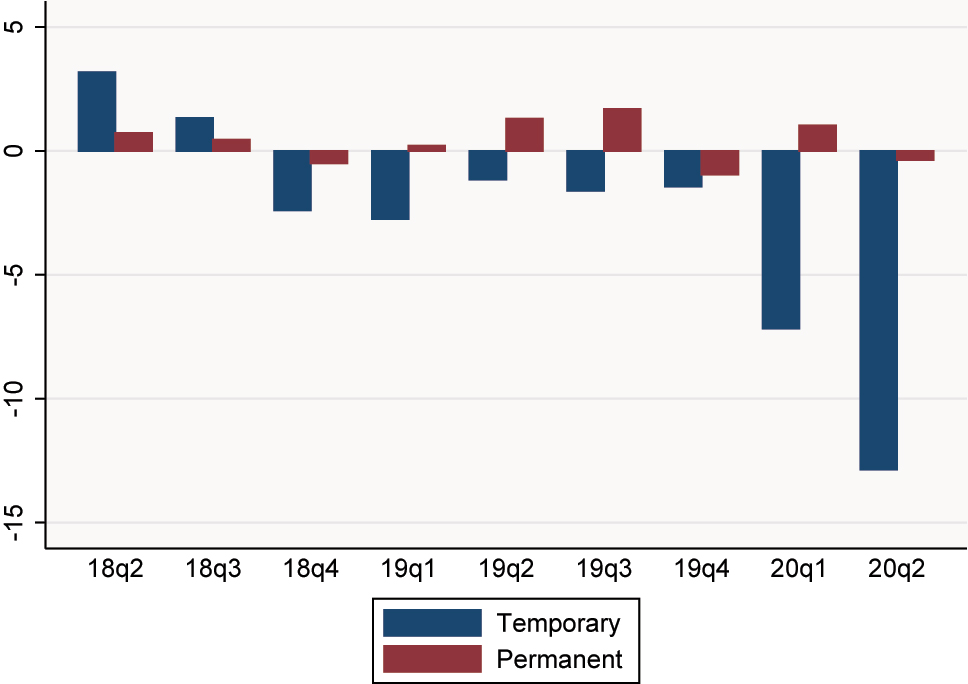
YoY change in temporary and permanent contracts. Source: Labour Force Survey (Statistics Portugal).
Importantly, temporary contracts are more prevalent in some groups of the population, as shown in Figure 3, which displays the share of temporary employment as a percentage of total employment between the first quarter of 2018 and the second quarter of 2020, split by gender, age, and education level. Given the concentration of low and medium skilled workers in this group, they face significant difficulties in finding a new job (Blanchard and Portugal 2017), and are prone to be long-term unemployed. In sum, the characteristics of the labour market place some workers in a more vulnerable position in the face of a crisis.
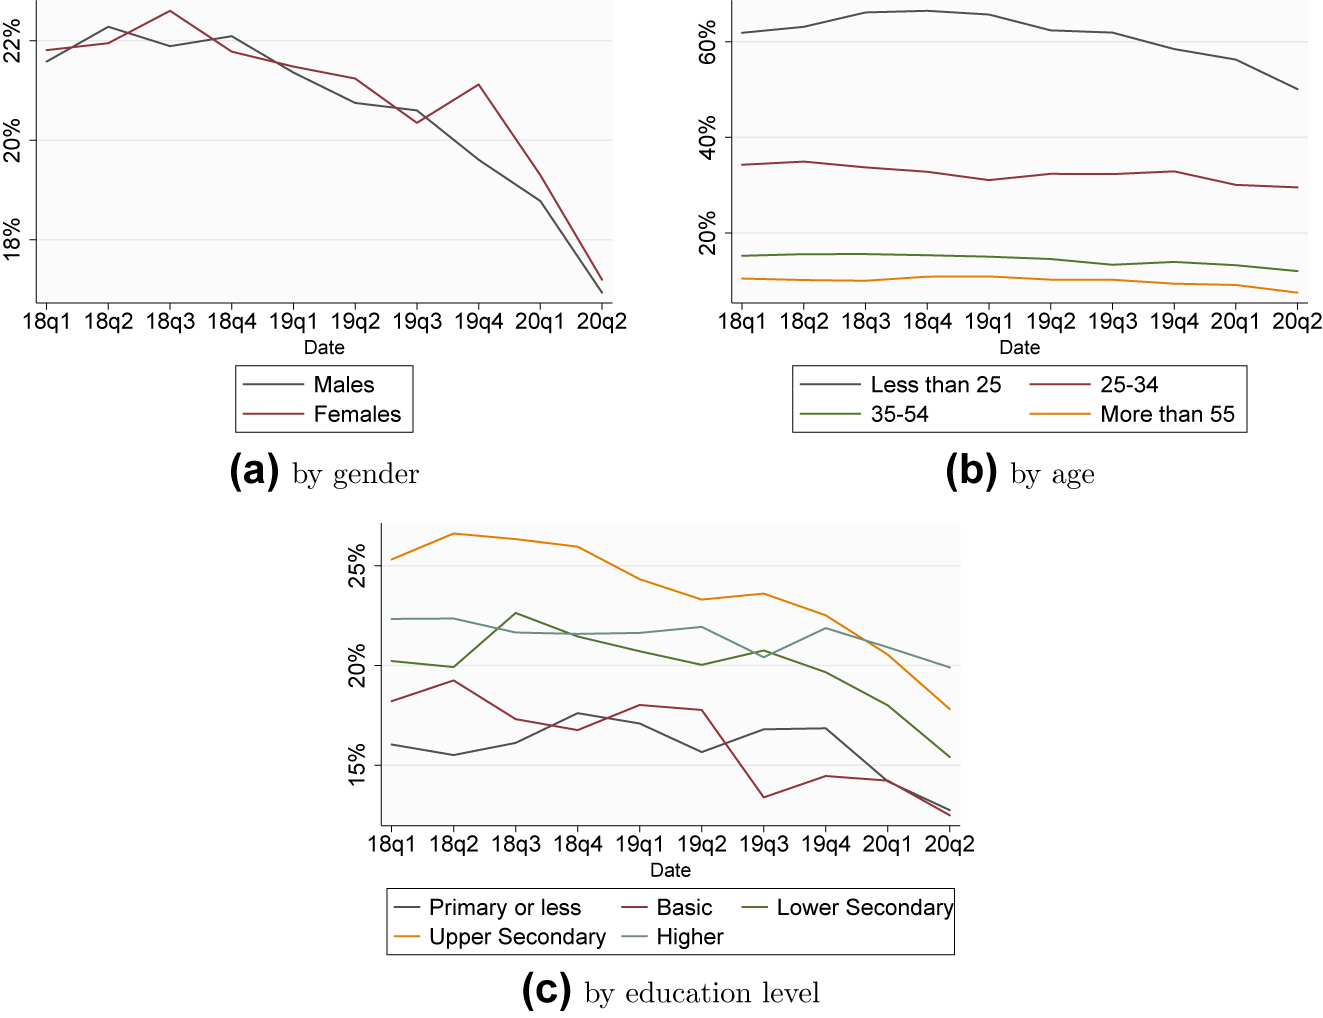
Temporary employment in Portugal. Source: Labour Force Survey (Statistics Portugal).
According to panel (a), the share of temporary contracts decreased in 2020, without any consistent difference between female and male workers. The age differences, shown in panel (b), are the most striking. The share of workers aged less than 25 years old with temporary contracts is around four times that of those older than 35. In the 25–34 age interval, the prevalence of temporary work is twice as much as that of the older individuals. Finally, from panel (c) it is clear that temporary employment is more prevalent among individuals with upper secondary education. The fact that individuals with basic, primary education, or less, represent the group with the lowest share of temporary contracts is mostly driven by age. These education levels are more common in the oldest cohorts, who also have a more stable relationship with the labour market.
Figure 2 suggests that the decrease in temporary contracts is explained by an increase in job separations that hits them disproportionally.
3 Data and Methodology
3.1 Data
We use administrative data from Instituto do Emprego e Formação Profissional (IEFP), the Portuguese Public Employment Service, provided at the municipality level.[11] As of age 16, unemployed individuals must register in Public Employment Services to receive unemployment benefits and have access to active labour market policies. In return, they must comply with a personal employment plan and actively seek employment. The Public Employment Service collects job offers and advertises them both online and through its network. When offered a suitable or socially necessary job, unemployed individuals must accept the offer, or they risk losing the benefit.[12]
Jobless individuals have two incentives to register: qualify for the active labour market policies, and receive unemployment benefits, when eligible. Between 1999 and 2019, the number of individuals registered at the Public Employment Services represented an average of 94% of the unemployed population (according to Statistics Portugal).[13]
IEFP provides monthly data on the number of unemployed individuals registered and the number of new job placements that take place for those registered at one of the job centers distributed across the country. Our sample comprises data on the 278 municipalities of the Portuguese mainland between October 2016 and August 2020.[14] We drop September in the four years, given our identification strategy, explained in Subsection 3.2.
Data on the unemployed is split into gender, age group, and education level. Data for job placements is disaggregated by gender. We also use data on the main reasons for registration at the job centers, i.e. dismissals, voluntary quits, mutual agreement dismissals, end of temporary jobs, self-employment or former inactivity.[15] It is worth noticing that while data on unemployment refers to the situation at the end of each month (stock), data on job placements and the motives for registering at IEFP refers to the movement throughout the month (flow). Summary statistics of all variables for the average municipality are provided in Table 1.
Descriptive statistics.
| Obs. | Mean | St. deviation | Min. | Max. | |
|---|---|---|---|---|---|
| Unemployment (stock) | |||||
| Total | 12,232 | 1273.6 | 2359.5 | 23 | 25,796 |
| By gender | |||||
| Male | 12,232 | 567.4 | 1091 | 12 | 13,000 |
| Female | 12,232 | 706.2 | 1274.8 | 7 | 13,895 |
| By age | |||||
| Less than 25 years old | 12,232 | 137.1 | 218.6 | 1 | 2961 |
| Between 25 and 34 years old | 12,232 | 238.2 | 442.4 | 1 | 5953 |
| Between 35 and 54 years old | 12,232 | 549.8 | 1069.5 | 8 | 12,163 |
| More than 55 years old | 12,232 | 348.5 | 650.7 | 5 | 6437 |
| By education | |||||
| Primary education (1st–4th grade) or less | 12,232 | 315.4 | 585.3 | 5 | 7341 |
| Basic education (5th–6th grade) | 12,232 | 187.6 | 356.5 | 2 | 4690 |
| Lower secondary (7th–9th grade) | 12,232 | 250.5 | 441.7 | 4 | 4928 |
| Upper secondary (10th–12th grade) | 12,232 | 342 | 635.2 | 5 | 7181 |
| Higher education | 12,232 | 178.1 | 412.1 | 0 | 6157 |
| Job placements (flow) | |||||
| Total | 12,232 | 23.9 | 35.3 | 0 | 494 |
| By gender | |||||
| Male | 12,232 | 11.1 | 17.9 | 0 | 234 |
| Female | 12,232 | 12.8 | 19.2 | 0 | 273 |
| Motive to register at IEFP (flow) | |||||
| Dismissed from previous job | 12,232 | 18.8 | 36.9 | 0 | 831 |
| Voluntarily quit previous job | 12,232 | 7.3 | 11.8 | 0 | 132 |
| Mutual agreement dismissal | 12,232 | 5.3 | 12.2 | 0 | 189 |
| End of temporary job | 12,232 | 73.2 | 135.3 | 0 | 2625 |
| Former inactive worker | 12,232 | 15 | 26 | 0 | 369 |
| Self-employed | 12,232 | 1.5 | 3.4 | 0 | 48 |
| Share of temporary contracts (2018) | 12,232 | 0.33 | 0.08 | 0.16 | 0.69 |
-
Observations are at the year-month-municipality level. Age bins reflect the availability of data.
The average number of adults registered in Public Employment Services per municipality is 1274, with a minimum of 23 and a maximum of around 26 thousand. The number is higher for females and adults between 35 and 54 years old, when compared to males and other age categories, respectively. Registrations also vary according to the level of education, with those with upper secondary education having the highest number of registrations. The average number of job placements per month and municipality is 24.
In terms of motives to register at the IEFP, end of temporary job is the most frequent (on average 73 people per municipality), followed by dismissal from previous job (19) and the registration of formerly inactive worker (15). Finally, we note that job placements are very low when compared to the flow of registrations at the Public Employment Service.
We complement the unemployment data with four further data sources.[16] Firstly, we use the last available wave of Quadros de Pessoal (2018), a linked employer–employee dataset covering the universe private-sector firms based in Portugal with at least one wage earner, aggregated to the municipal level. We retrieve the share of temporary workers per municipality and per sector and we also use it to relate temporary jobs to the working-from-home measure of Dingel and Neiman (2020). At the municipal level, the average share of temporary employment contracts is 33%, with a standard deviation of 8%.
Secondly, we use municipal-level data from SIBS (acronym for Sociedade Interbancária de Serviços, in Portuguese), which manages the integrated banking network in Portugal, comprising Automated Teller Machines (ATM), Point-of-sales (POS) terminals, and other electronic payment technologies such as mobie e-money. SIBS is the largest player in the electronic payments market and it runsthe interbank compensation system through a contract with the Portuguese Central Bank.[17] The data comprises electronic payments, i.e. payments with bank cards, including those with contactless technology, and several digital money solutions (both mobile phone and net banking based), made in Portugal, by domestic and foreign costumers.[18] This data allows us to compute a real-time measure of the crisis per sector of activity.
Thirdly, we use sectoral-level administrative data from the Ministry of Social Security and Employment on the number of workers benefiting from the furlough scheme implemented by the Portuguese government per sector of activity. Finally, we use individual data from the Labour Force Survey between the first quarter of 2018 till the second quarter of 2020 to highlight some stylized facts about the impact of the Covid-19 crisis.
3.2 Methodology
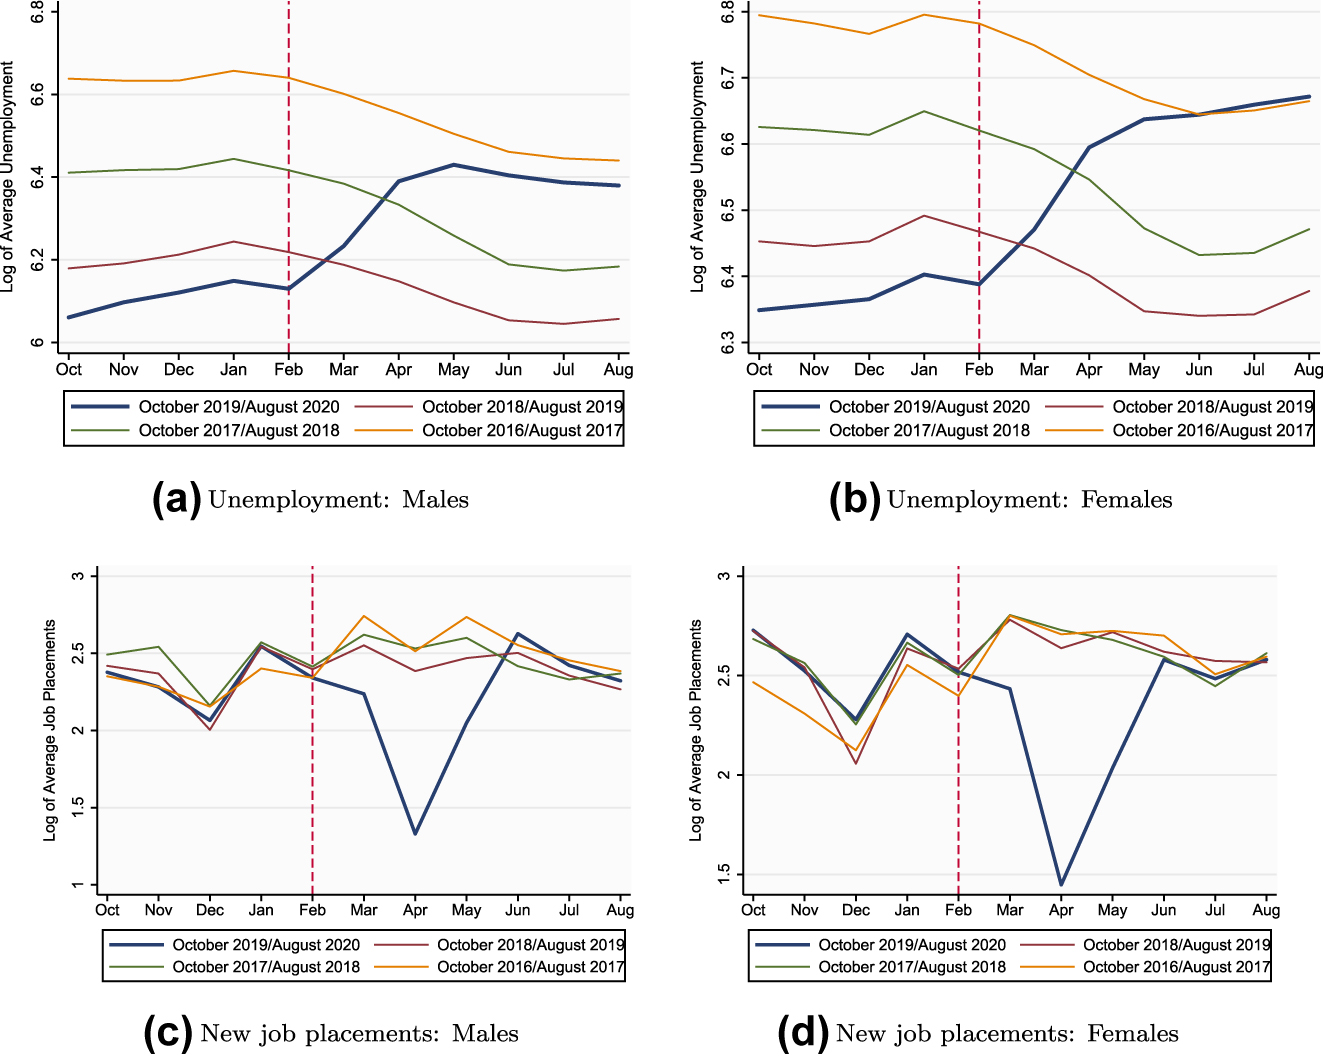
We implement a difference-in-differences (DiD) event study. In Section 5, we use triple difference-in-differences to assess the role of duality and exploit heterogeneous effects. Our identification strategy is easily explained by analysing Figure 4. The treatment and comparison groups are sets of months. The treatment group is represented by the blue lines in both panels, i.e. it comprises the months between October 2019 and August 2020. The comparison group comprises the remaining lines, i.e. the same sequence of months lagged one, two, or three years, respectively. The treatment period includes the months between March and August for all the years between 2017 and 2020.
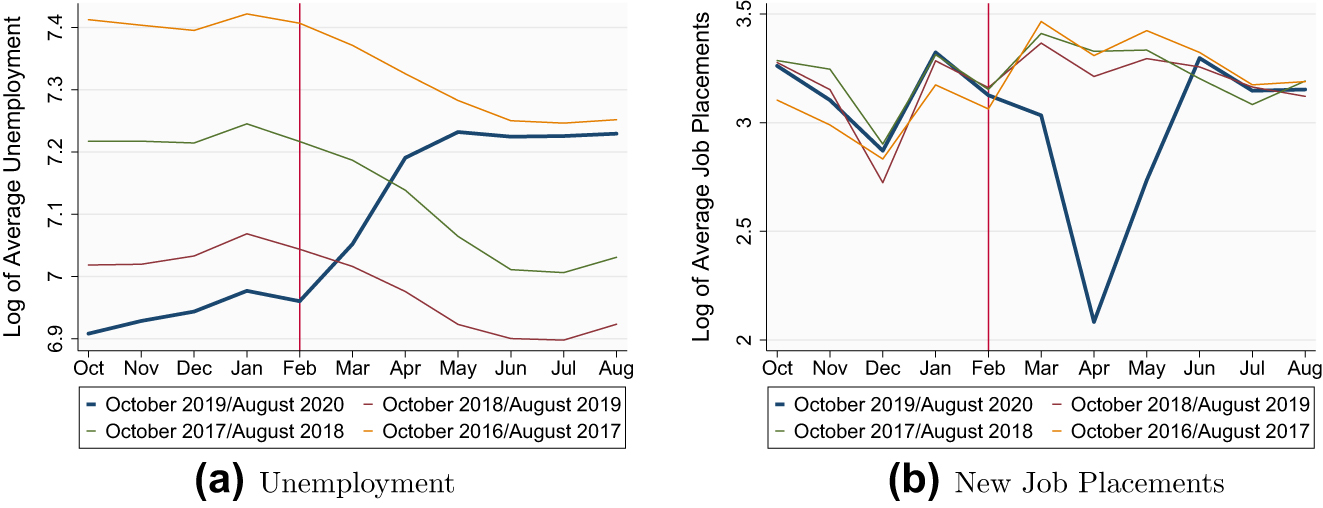
Identification strategy. Time-series of Log of average unemployment and new job placements. The blue line represents the period between October 2019 and August 2020 (the treatment group), of which October 2019 to January 2020 correspond to the pre-treatment period, and March 2020 to August 2020 correspond to the treatment period. The remaining lines represent the control group, i.e. the same series lagged one (Oct. 2018–Aug. 2019), two (Oct. 2017–Aug. 2018) and three (Oct. 2016–Aug. 2017) years.
The identifying assumption is that, absent the pandemic, and the implemented policies (detailed in Subsection 2.1) the year-on-year growth rate between the month of March (resp., April, May, June, July, and August) 2020 and the corresponding month in 2019 would be equal to a weighted geometric mean of the year-on-year growth rates for the same month, lagged between 1 and 3 years. Thus, the treatment group (Oct. 2019–Aug. 2020) can be decomposed into two parts, the pre-treatment period (Oct. 2019–Jan. 2020), used to assess parallel trends, and the treatment period (Mar. 2020–Aug. 2020), used to assess the impact of the pandemic.
The evidence in Figure 4 suggests that the outcome variables are on parallel trends prior to the shock. We provide a more formal test in Section 4 below, in which we run event studies for these outcome variables, using the same set of months for the control and treatment groups. Figures C.3–C.5 in the Appendix C show analogous evidence with the unemployed split by gender, age, and education levels.
The treatment period begins in March 2020. Recall that the first case was diagnosed on March 2nd. Carvalho et al. (2022) show that there is no evidence of changed behavior in electronic purchases before March. This is confirmed by Google mobility data shown in Figure C.2 (borrowed from Carvalho et al. 2022) that displays no evidence of changes in mobility in February or the first two weeks of March. Moreover, note that around the Carnival holiday of February 24, we observe a downward peak in workplaces and retail, accompanied by a mirror increase in parks and other open areas. This is convincing evidence that the country was living a normal life at the end of February. Hence, we rule out potential anticipatory behaviours that would threaten our identification strategy.
3.2.1 Aggregate Effects
We begin by estimating the following event study equation:
where ln(y) imt corresponds to natural log of unemployment or new job placements at the job centers of municipality i, in month m and year t ∈ {2016, 2017, 2018, 2019, 2020}. Municipal, γ i , and month, δ m , fixed effects are also included. February is the omitted month, since it is the one just before the start of the crisis.
The treatment indicator,
We show in the Appendix that
where
Please note that these impacts are best interpreted as lower bounds of the impact of the pandemic crisis and the lockdown strategies implemented as a result, since the labour-market policies enacted in the first weeks of the crisis aimed at mitigating the severity of the repercussions.[21]
3.2.2 The Role of Duality
We quantify the role of the duality of the labour market in our results in Subsection 2.2. We begin by estimating (1) for transitions into unemployment, i.e. motives for new registrations, in Subsection 4.1.
We then use the following triple difference-in-differences specification, in Subsection 4.2.
where ln(y) imt is, respectively, the log of the number of unemployed individuals in municipality i, month m, year t, or the number of unemployed individuals for each possible motives to register; temp i is the share of workers with temporary contracts in the private sector of each municipality i in 2018. This specification allows us to test if the duality of municipal labour markets, proxied by the share of temporary workers in the municipality, amplifies the impacts of the pandemic.
In this case, our coefficient of interest is α 3, and it gives us the effect of the Covid-19 pandemic on municipal unemployment when the share of temporary workers increases by 1 p.p. Since we control for municipality fixed effects and temp i is time invariant, we do not include it alone in the regression.
3.2.3 Heterogeneous Effects
In Section 5, we explore heterogeneous effects along each dimension of our data (gender, age, and education). We use a triple difference-in-differences strategy. The following equation is estimated for the gender dimension:
Where ln(y)
kimt
is the (log of) number of unemployed people of gender k ∈ {female, male}, in municipality i, month m, and year t,
Finally, we analyse whether the duality of the labour market amplifies the heterogeneous impacts. This is done by estimating (3) for sub-samples according to gender, age, and education level, in Subsection 5.2.
4 The Aggregate Shock and Labour Market Transitions
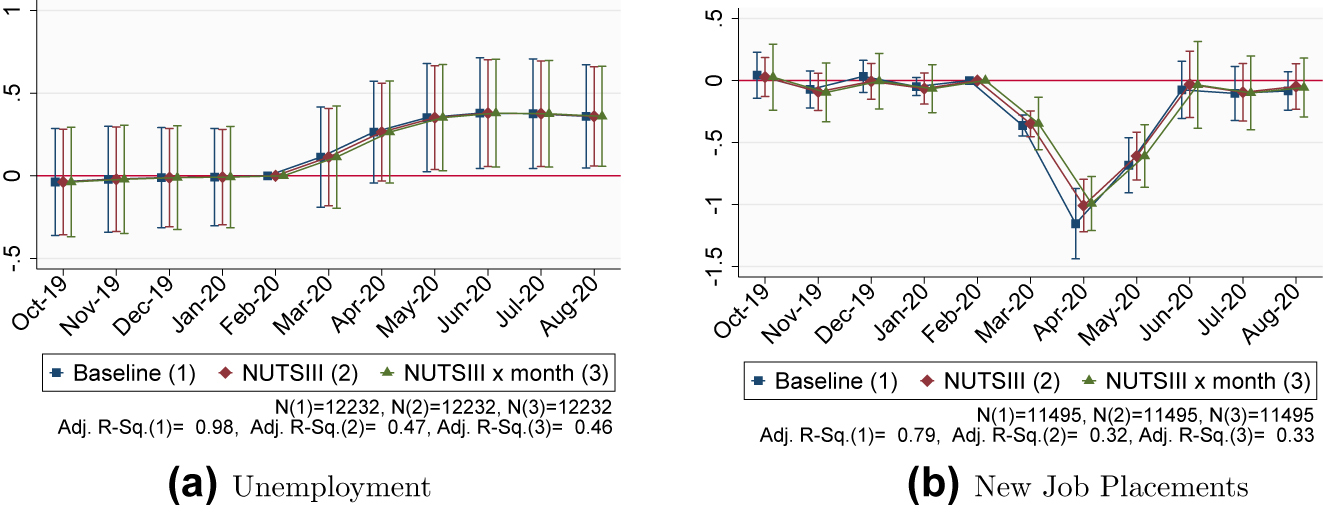
In this section, we present our results for the impact of the pandemic on the labour market. We start by using (1) to estimate the impact of the pandemic crisis on registered unemployment and new job placements. The coefficient estimates for β m are depicted in Figure 5. All our coefficient plots display the 95% confidence intervals.
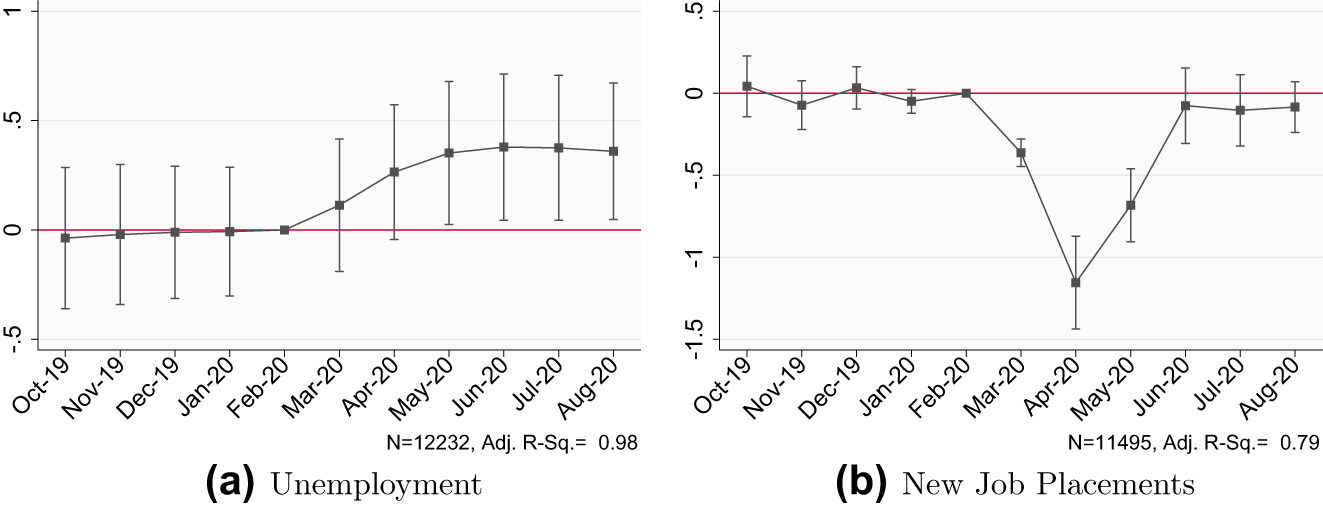
Event study aggregate effects.
The first important remark is that in both cases the estimates for β m , where m ∈ {1, 10, 11, 12}, are not statistically different from zero; in other words, the parallel trends assumption is verified, which validates our identification strategy and shows that our results reflect the causal impact of Covid-19 on the variables of interest, as explained in Subsection 3.2.
In order to better interpret Figure 5, note that it displays the point estimates (and respective confidence intervals) for the difference in the outcome variables between the months of October 2019 to August 2020 and the geometric average of the same months in the past three years, as per (1). The fact that the estimated coefficients in the pre-treatment period are not statistically different from zero confirms that the outcome variables are on parallel trends. This is a more formal confirmation of the visual evidence in Figure 4.
Panel (a) in Figure 5 shows a strong impact on unemployment following the lockdown period that began in March 2020. The increase is persistent but more pronounced until June, and stabilizes thereafter. In terms of job placements, Panel (b) presents a colossal drop of new placements, especially in April, followed by a recovery in May and June and a subsequent stabilization. Although between June and August the point estimates are not statistically different from zero, they are still negative.
Table 2 displays the net effect of the pandemic on the YoY growth rates, computed as explained in Appendix A. The YoY growth rates of unemployment increased gradually over time, from 27 p.p. in April, up to 39 p.p. and 38 p.p. in June and July, respectively. The sharp decline of new job placements shown in Panel (b) on Figure 5 corresponds to a 63 p.p. drop in April. From June onward, the impact has been attenuated but is still negative. These effects are consistent with the deep lockdown in April and the slow restart of the economic activity during the summer.
Event study aggregate effects: magnitudes.
| Dep. var.: | Log of unemployment | Log of job placements | ||||
|---|---|---|---|---|---|---|
| Point estimate | t-stat | Effect (p.p.) | Point estimate | t-stat | Effect (p.p.) | |
| (1) | (2) | (3) | (4) | (5) | (6) | |
| Mar-20 | 0.113 | 1.04 | 10.67 | −0.363 | −12 | −23.55 |
| Apr-20 | 0.265 | 2.39 | 26.92 | −1.155 | −11.31 | −62.74 |
| May-20 | 0.352 | 2.99 | 37.25 | −0.683 | −8.53 | −43.14 |
| Jun-20 | 0.379 | 3.15 | 39.06 | −0.075 | −0.91 | −3.37 |
| Jul-20 | 0.375 | 3.14 | 38.42 | −0.104 | −1.33 | −8.48 |
| Aug-20 | 0.360 | 3.2 | 35.5 | −0.084 | −1.5 | −0.23 |
-
Point estimates are the coefficients β m from (1). The effect is given by
We perform robustness tests to (i) further assert that the parallel trend assumption holds and (ii) show that the remaining coefficient estimates are stable across different specifications. The results are shown in Appendix Figure C.6. We also use (1) to analyse regional differences on unemployment across the five Portuguese mainland NUTS II regions, shown in the Appendix (Figure C.7 and Table B.2, respectively).
4.1 Transitions in a Dual Labour Market
We now analyse the evidence about the reasons that led the individuals to register with the Public Employment Service during the Covid crisis. Since these are flow variables, the results measure the impact on new unemployment each month, net of composition effects.
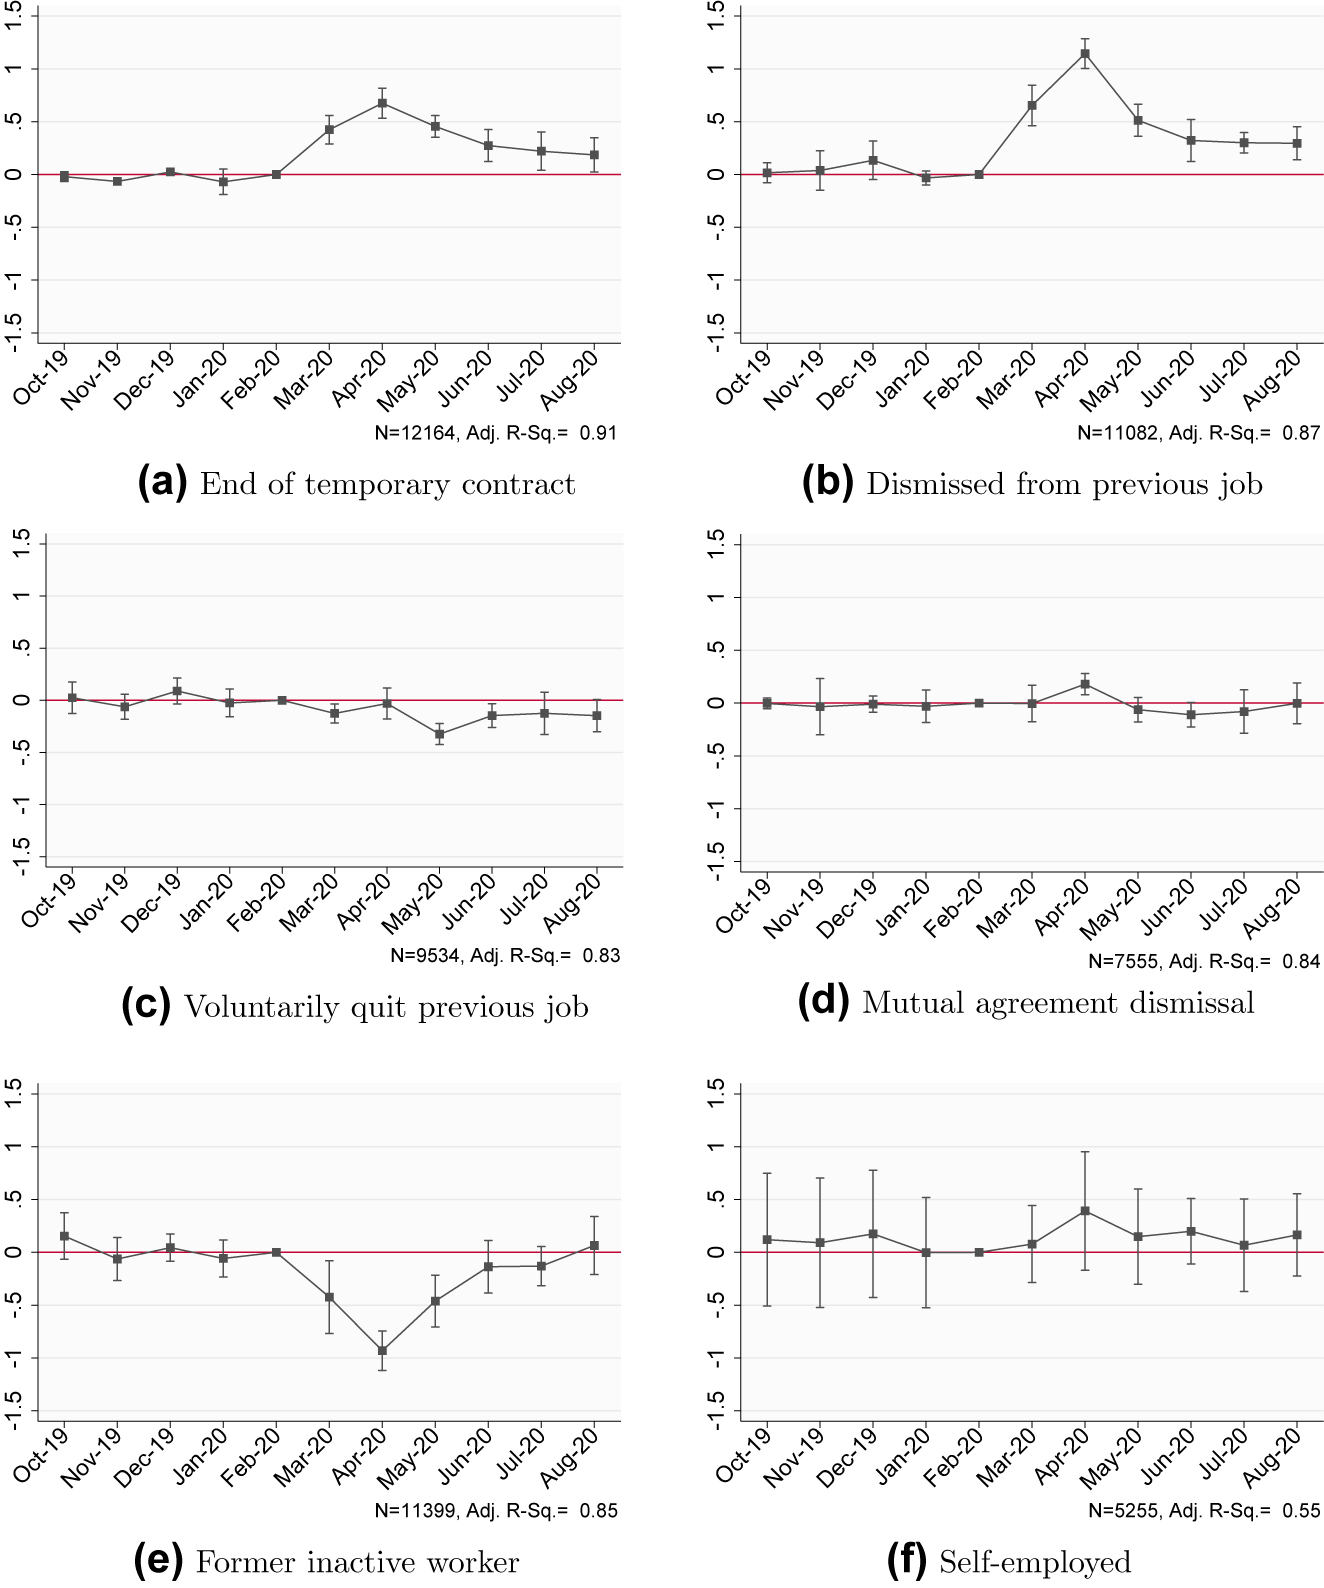
Motives to register with IEFP.
The data splits the motives into four categories that are explicit job separations (end of temporary contract, dismissal, voluntary quit, mutual agreement dismissal) and two additional categories for transition from inactivity and registration of self-employed. Figure 6 shows the event study for each motive. The evidence confirms the importance of temporary contracts for the transitions during this period. The most important ones, for the purposes of our analysis, are the first two. Note that dismissals also include temporary workers who are dismissed before the end of the contract. The pandemic had no sizeable impact on the remaining transitions, except for the drop in inactive workers that register as job-seekers, which is a natural consequence of the lockdown period.
Panels (a) and (b) exhibit very clear spikes in terminations of temporary contracts and dismissals, respectively, lasting until the end of the analysed period. The effects were particularly strong in April, with YoY growth rate increases of 87 p.p. and 216 p.p. for end of temporary contracts and dismissals, respectively. Although the effect is lower for termination of temporary contracts, the base effect is much stronger (Figure C.8 in Appendix C shows that almost two thirds of job separations in 2020 are due to the termination of temporary contracts.)[22]
4.2 Duality in Municipal Labour Markets and the Pandemic Shock
We now explore whether unemployment is driven by municipal heterogeneity in the dual nature of the labour market, i.e. we analyse the possibility that municipalities with a higher share of temporary contracts are more impacted by the crisis. We use the municipal share of temporary contracts in 2018, the last available year. As we show in Figure C.9, in Appendix C, this share is strongly correlated with that of previous years, which suggests that we capture a structural feature of the local labour markets.
Table 3 shows the estimate of α 3 in Eq. (3) for the stock of unemployed (column 1). The estimate indicates that there are more registrations at the Public Employment Services in municipalities with a higher share of temporary employment. The number of newly registered unemployed increases by 1.5% with an increase of 1 p.p. in the share of temporary workers in a municipality. Alternatively, a one standard deviation (8%) increase in the share of temporary contracts amounts to an 11.6% change in the number of registries. This effect is sizeable, particularly given that the average share of temporary workers is 33%.
Share of temporary contracts and the Covid-19 crisis.
| Log of | |||||||
|---|---|---|---|---|---|---|---|
| Motives to register as unemployed (flow) | |||||||
| Unemployment (stock) | End of temp. contract | Dismissed | Voluntary quit | Mutual ag. dismissal | Former inactive | Self-employed | |
| (1) | (2) | (3) | (4) | (5) | (6) | (7) | |
|
|
1.452* | 1.343* | 1.272 | 0.254 | 0.444 | −0.255 | 0.105 |
| (0.57) | (0.58) | (0.8) | (0.32) | (0.72) | (0.2) | (0.5) | |
| Number of obs. | 12,232 | 12,164 | 11,082 | 9534 | 7552 | 11,399 | 5253 |
| R-squared | 0.976 | 0.907 | 0.859 | 0.819 | 0.839 | 0.817 | 0.552 |
-
Standard errors (in parenthesis) are clustered at NUTS II and time period (month, year) level. Significance levels: * p
Columns 2 to 8 report similar regressions where the outcome variable is the flow of monthly registrations by motive, for all the motives shown in Figure 6. Results show that new registrations in Public Employment Offices due to the termination of temporary contracts are higher in municipalities with a higher share of temporary workers. The interaction with the share of temporary contracts is not significant for the remaining motives. This provides further evidence that temporary workers were more severely affected by job loss during the early months of the pandemic.
5 Heterogeneity along Gender, Age, and Education
In Subsection 2.2, we document the unequal distribution of temporary contracts. We now show that the pandemic shock hit these workers asymmetrically.
5.1 Heterogeneous Effects of Covid-19 on the Labour Market
In this section, we use a triple difference-in-differences strategy to explore the heterogeneous effects of the Covid-19 shock on the outcomes of interest for (i) gender, (ii) age groups, and (iii) education levels. Results are reported in Table 4. As mentioned in Subsection 3.1, data on new job placements is only disaggregated by gender, thus the heterogeneity in terms of age and education focuses exclusively on unemployment.
Triple DD on unemployment and new job placements, by gender, age and education level.
| Dep. var.: | Gender | Age | Education | |
|---|---|---|---|---|
| Log of unemployment | Log of new job placements | Log of unemployment | Log of unemployment | |
| (1) | (2) | (3) | (4) | |
|
|
0.338** | −0.241* | 0.177** | 0.239** |
| (0.08) | (0.11) | (0.05) | (0.07) | |
|
|
−0.026 | −0.175* | ||
| (0.02) | (0.08) | |||
|
|
0.208** | |||
| (0.06) | ||||
|
|
0.258* | |||
| (0.04) | ||||
|
|
0.179* | |||
| (0.03) | ||||
|
|
−0.037 | |||
| (0.03) | ||||
|
|
0.096** | |||
| (0.02) | ||||
|
|
0.150*** | |||
| (0.03) | ||||
|
|
0.175*** | |||
| (0.02) | ||||
| Number of obs. | 24,464 | 21,265 | 48,928 | 61,156 |
| R-squared | 0.968 | 0.725 | 0.953 | 0.930 |
-
Standard errors (in parenthesis) are clustered at NUTS II and time period (month, year) level. The omitted group is male, 55 and older, and higher education, respectively for columns 1 and 2, 3, and 4. Significance levels: * p
Columns 1 and 2 of Table 4 report the estimates of β 3 and β 4 from (4) for the gender heterogeneity specification, where β 4 represents the additional impact for females. In all specifications, the estimates of β 3 represent the impact for the reference group. When we estimate heterogeneous impacts other than gender, we expand the interaction of β 4 to include a full set of interactions for each category, i.e. three coefficients instead of one for the age specification (column 3 of Table 4), and four for the education one (column 4 of Table 4).
Results for gender heterogeneity indicate that Covid-19 increased male unemployment by 33.8% (column 1) and decreased new job placements by 24.1% (column 2) between March and August 2020. Taken together, our results show that women were most severely hit by the pandemic: while there is no statistically significant difference in unemployment, women suffer an additional drop of 17.5% in placements after March, when compared to men. The absence of gender differences in unemployment is in line with the findings of Casarico and Lattanzio (2020) for Italy, and Hupkau and Petrongolo (2020) for the UK. The negative effect that we identify on placements suggests that women are less likely to find a job following an unemployment episode during the pandemic; this adds to the long list of differential gender impacts due to a higher proportion of female workers in the most affected industries (ILO 2017), disproportionate take up of household chores and childcare after school closures and work from home restrictions (Del Boca et al. 2020; Farré et al. 2020).
To study the impact on different age groups, we use the unemployed aged more than 55 as the reference group. Our findings in column 3 of Table 4 show this is the least affected group. There is a very strong impact on youth unemployment after March 2020, amounting to an additional increase of 20.8% and 25.8%, for individuals younger than 25, and between 25 and 34 years old, respectively. These results are consistent with the prevalence of non-permanent contracts among younger workers in Portugal documented above. Younger workers are also less unionized than older ones (Portugal and Vilares 2013) and more vulnerable to precarious working conditions.
With regards to education levels, column 4 of Table 4 shows that individuals with higher education, the reference group, experienced an increase of 23.9% in unemployment after March 2020. The differential impact of the crisis was 17.5% higher for individuals with upper secondary education, 15% for individuals with lower secondary education, and 9.6% for individuals with basic education, than for those with higher education. Individuals with less than four years of formal education do not behave differently than the highly educated ones. This may stem from the fact that these workers are concentrated in essential jobs that kept working during the lockdown; however, the lack of statistical significance may also be explained by the relatively small number of workers with this level of education.
The inverted u-shaped relationship between education levels and the labour market impact of the pandemic can be explained by the fact that workers with secondary education are usually not employed in the subset of service sectors compatible with home working, and are thus in a more vulnerable position in this crisis. Indeed, data from Statistics Portugal shows that during the second quarter of 2020, 4.7% of the employed population with lower secondary education or less was working from home, compared with 53.8% of the population with higher education degrees (INE 2020).
5.2 Does Labour Market Duality Drive the Heterogeneous Effects?
So far, we have established that (i) the increase in unemployment was higher in more dual municipal labour markets, (ii) temporary contract terminations were more pervasive in these municipal labour markets, and (iii) the impact of the crisis falls disproportionally on females (through the hiring margin), younger workers, and those with secondary education. Since these worker groups are the ones that are over-represented in temporary contracts, this also constitutes evidence that the termination of temporary contracts plays a major role in our results. We now combine the two pieces of evidence and test whether the heterogeneous impact (along gender, age, and education) is greater in municipal labour markets with a stronger duality character.
The estimates of α 3 from (3) for each group of workers are presented in Table 5. We report the tests for the null hypothesis that the estimated coefficients are equal in Tables B.4 and B.5 in the Appendix B. As regards gender, the value of the χ 2 statistic is 4.03, i.e. the coefficients are statistically different at 5%. More specifically, a one standard deviation increase in the share of temporary contracts in a dual labour market increases the number of newly registered female workers in response to the pandemic shock by 12.6%, and that of males by 10.7%.
Share of temporary contracts and the Covid-19 crisis.
| Dep. var.: | Log of unemployment | |||||
|---|---|---|---|---|---|---|
| Dimension: | Gender | Age | ||||
| Male | Female |
|
25–34 | 35–54 |
|
|
| (1) | (2) | (3) | (4) | (5) | (6) | |
|
|
1.331** | 1.569* | 2.065* | 1.771* | 1.426* | 0.919* |
| (0.47) | (0.66) | (0.35) | (0.36) | (0.29) | (0.19) | |
| Number of obs. | 12,232 | 12,232 | 12,232 | 12,232 | 12,232 | 12,232 |
| R-squared | 0.971 | 0.976 | 0.940 | 0.961 | 0.971 | 0.983 |
| Dimension: | Education | ||||
|---|---|---|---|---|---|
| Primary or less | Basic | Lower sec. | Upper sec. | Higher | |
| (7) | (8) | (9) | (10) | (11) | |
|
|
1.156* | 1.338* | 1.712* | 1.572* | 1.219 |
| (0.47) | (0.58) | (0.62) | (0.60) | (0.58) | |
| Number of obs. | 12,232 | 12,232 | 12,232 | 12,232 | 12,232 |
| R-squared | 0.969 | 0.961 | 0.963 | 0.970 | 0.970 |
-
Standard errors (in parenthesis) are clustered at NUTS II and time period (month, year) level. Significance levels: * p
We now analyse the results with respect to age. Interestingly, the estimated coefficients are monotonic in the age of the individuals. The tests of the difference of the coefficients in Table B.4 indicate that there is no statistical difference between the two groups who are younger than 34. Conversely, the coefficients for both these groups are different from the ones of older workers. The negative impact of the pandemic shock in dual labour markets is therefore more concentrated in younger workers. More specifically, a one standard deviation increase in the share of temporary workers leads to an increase of between 14.2% and 16.5% in the number of newly registered young workers in the Employment Office. Conversely, the impact on older workers amounts to between 7.4% and 11.4%.
Regarding education, the effect follows an inverted U-shaped pattern. In municipalities with a higher share of temporary contracts, Covid-19 impacts less severely individuals with primary education or less, and individuals with higher education. The strongest impact falls on the those with lower and upper secondary education, as the results of the tests of the equality of the coefficients reported in Table B.5 confirm. A one-standard deviation increase in the share of temporary workers in the municipality increases the number of registered unemployed people with upper and lower secondary education by 12.6% and 13.7%, respectively. The impact on highly educated workers is non significant.
These results strongly suggest that the effect of the crisis in female, young and middle-educated workers is driven by the duality of the labour market. The crisis has asymmetric effects depending on the workers’ ties to the labour market, and measures like the furlough scheme do not seem to be enough to protect certain groups of the labour force.
In order to correct for possible seasonality in temporary contracts, we re-estimate the regressions excluding the municipalities in the top quartile of the distribution of tourist overnight stays, which are bound to have a peak of jobs in the Summer. The results, presented in Tables B.6 and B.7, in Appendix B, are similar to the baseline, with the exception of the gender differences, which are less precisely estimated.
6 Discussion of Possible Mechanisms
We have shown that the effects of the pandemic on unemployment are asymmetric across age, gender, and education. In addition, we show that the shock is both more pronounced and more asymmetric in municipalities with a more dual labour market, as measured by the share of temporary contracts in the overall labour force.
There are at least three possible mechanisms that may explain these results. First, it may be a mechanical effect of the furlough policy: given that supported firms are forbidden to dismiss workers, they use the margin of not renovating temporary contracts to adjust employment. Second, temporary workers may be more likely to work in the industries (such as retail and hospitality) that are heavily disrupted by the pandemic shock. Finally, it is possible that jobs performed by temporary workers are less suitable for working from home arrangements.[23]
We now provide suggestive evidence showing that the three mechanisms are present. Panel (a) of Figure 7 shows a stark positive correlation between the share of workers on furlough until August 2020, according to the records of the Ministry of Labour and Social Security, and the share of temporary workers per sector, measured in 2018 using administrative linked employer-employee data. This graph suggests that part of the impact is driven by the mechanical effect of the policy.
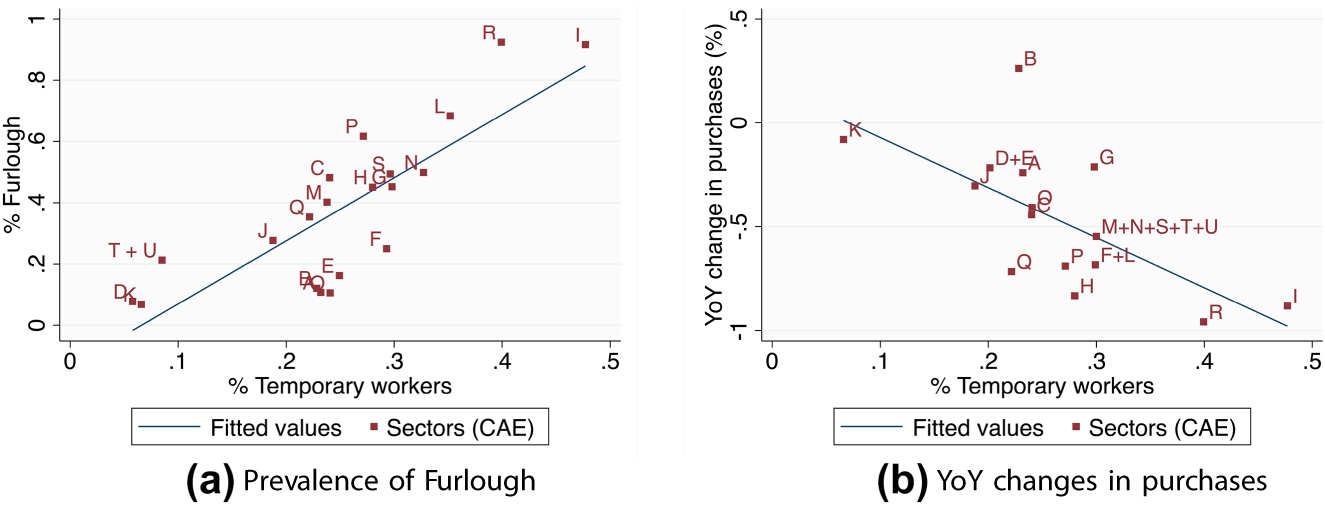
Covid-19 crisis and the share of temporary workers, by sector. Letters A to U represent sectors of activity according to the NACE classification (sector definition in Appendix Table B.8). Panel (a) plots the correlation between the share of employees with temporary contracts (horizontal axis) in each sector and the share of employees under furlough schemes (vertical axis) in the same sector. Panel (b) plots the correlation between the percentage change in the value of electronic purchases (transactions with cards), between April 2019 and 2020; and the share of temporary workers in the same sector/group of sectors. More details about the sources of data on Appendix Table B.1. To build Panel (b) we created a correspondence between the NACE sector groups and the division provided by SIBS.
Panel (b) of Figure 7 shows that the share of temporary workers is higher in the sectors that were more hit by the crisis, as measured by the year-on-year change in electronic purchases between April 2020 and April 2019. Importantly, SIBS data covers payments with both Portuguese and foreign electronic cards. We focus on this measure because this crisis was characterised by strong limitations in contact-intensive sectors such as the specialised retail and hospitality industries, that rely on business-to-customer transactions.[24] We use April 2020 because it was the month with the sharpest contraction in electronic purchases. Therefore, temporary workers are more prevalent in the sectors that suffered the most from stay-at-home orders and the collapse of tourism (Carvalho et al. 2022). This amounts to a sectorial effect hitting temporary workers.
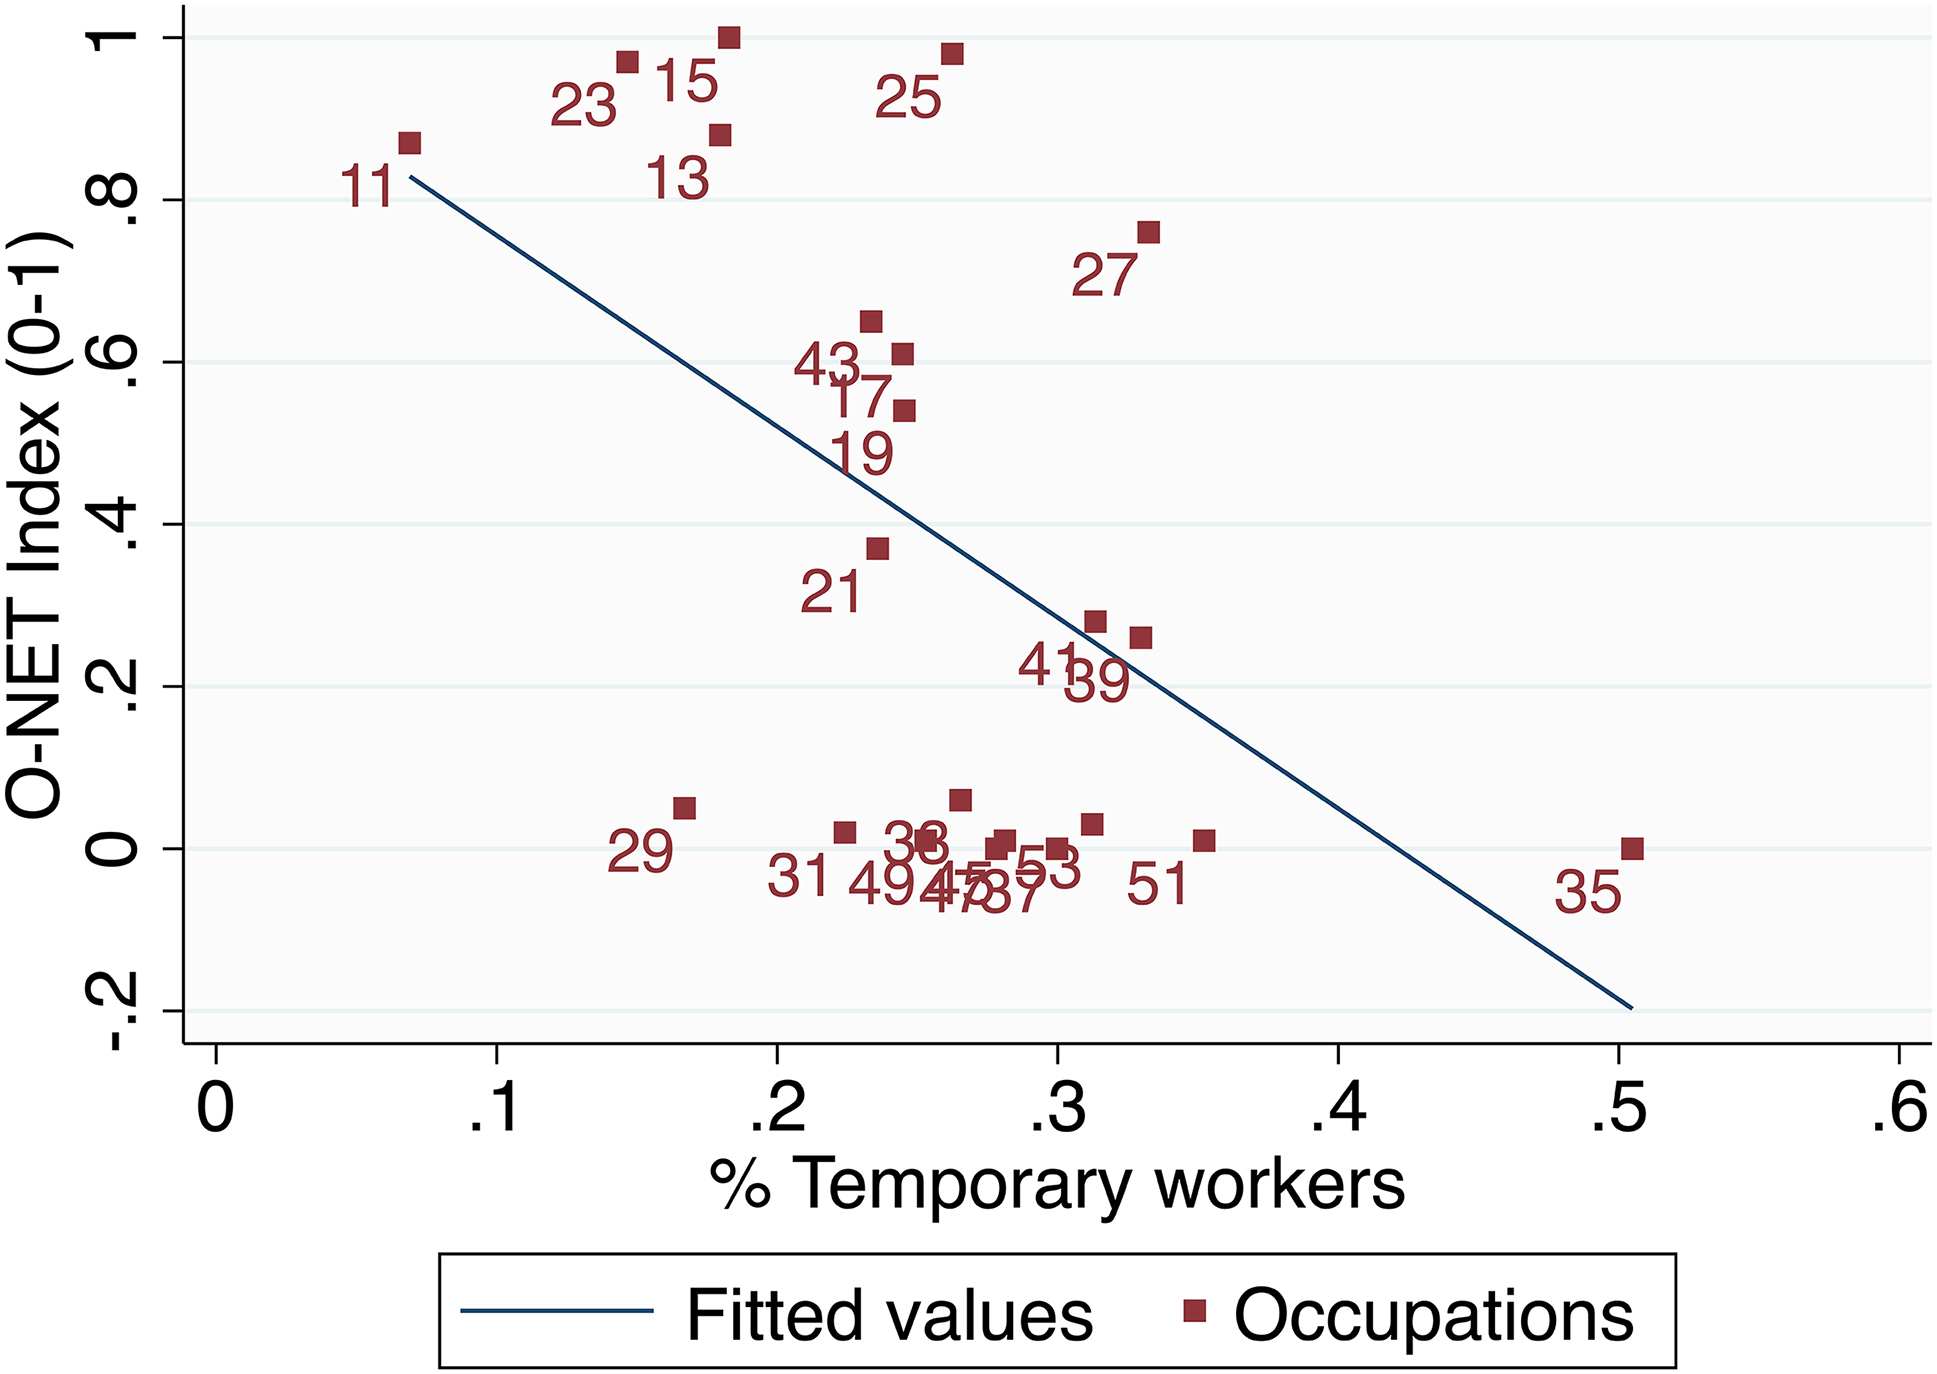
Remote working and the share of temporary workers, by occupation. Numbers 11 to 53 represent groups of occupations according to the ISCO classification (group definition in Appendix Table B.9). The figure plots the correlation between the O-NET index and the average share of temporary workers in each occupation group. The O-NET index is retrieved from Dingel and Neiman (2020) and indicates how amenable to remote working is each group of occupations. The share of temporary workers is obtained from GEP-MTSSS.
In Figure 8, we focus on 22 job occupations instead of sectors. More precisely, we rely on the analysis of jobs that can be done at home from Dingel and Neiman (2020), who computed a work-from-home measure using surveys from the Occupational Information Network (O*NET) for each possible occupation.
We combine this with the administrative linked employer-employee data, that covers the universe of private sector workers in Portugal, using the year of 2018. We then plot, for each occupation, the share of temporary contracts and the respective work-from-home measure. What we find is a striking negative correlation, showing that the jobs that are more easily prone to remote working are dominated by permanent contracts. For instance, Food Preparation and Serving is not prone to remote working, and almost half of the contracts are temporary. By contrast, Management Occupations are easy to perform in home working, and have less than 10% of temporary workers. Therefore, more-at-risk jobs were likely to be performed by temporary workers who were thus more likely to dismissed. This suggests that even in sectors that were not particularly hit by the crisis, or did not rely a lot on furlough, temporary workers may have been dismissed because of the nature of their occupations. This shows that temporary workers are also hurt by an occupation effect. This evidence is in line with Bonacini et al. (2021), who show that the possibility of remote working in Italy exacerbates pre-existing inequalities.
7 Conclusion
In the beginning of 2020, the Coronavirus pandemic hit the world economy, and rapidly turned into the biggest shock since the Second World War. Compared with the financial and sovereign debt crisis of 2008–2012, the pandemic hit a structurally different labour market, with a much higher share of temporary employment, and, moreover, was met with massive public spending aimed at the protecting the so-called matching capital between workers and firms
In this paper, we analyse the effects of the crisis on unemployment in a country characterised by a high degree of duality in the labour market, using administrative data from Instituto do Emprego e Formação Profissional, that covers the universe of unemployed individuals registered at job centers from October 2016 to August 2020. We complement it with several other data sources, including the Labour Force Survey, pre-shock linked employer-employee data, electronic payments data, and Google mobility reports. Using event study difference-in-differences, we rely on the assumption that, in the absence of the Covid-19 outbreak, the monthly year-on-year change between March/August 2020 and March/August 2019 would have been parallel to a weighted geometric mean of the year-on-year change of the previous 3 years.
We document a large causal impact of the pandemic on registered unemployment, with YoY growth rate increases from 27 percentage points in April up to 39 and 38 percentage points in June and July, respectively. New job placements were also severely affected, i.e. the YoY growth rates were below pre-crisis levels from March to August, with a negative peak of 63 percentage points in April. These impacts are lower bounds, since the labour-market policies enacted in the first weeks of the crisis aimed at mitigating the severity of the repercussions.
We argue that this effect is mediated by the duality of the labour market. On the one hand, we show the prevalence of the termination of temporary contracts in the transitions into unemployment and document the destruction of temporary contracts using data from the Labour Force Survey. We then exploit municipal heterogeneity in the share of temporary contracts as a measure of the intensity of the duality of the local markets. We show that the effect of the crisis on unemployment is amplified by the share of temporary jobs.
On the other hand, we show that the impact on unemployment is more pronounced for the demographic groups that are more likely to have temporary jobs. More precisely, we show that, when compared to individuals who are older than 54, those younger than 25 and between 25 and 34 have an additional impact of 20.8% and 25.8%, respectively. In terms of education, the bulk of the effect is concentrated in individuals with lower and upper secondary education (additional 15% and 17.5%, respectively vis-à-vis those with higher education). We find no evidence of gender differences on registered unemployed, but women are more affected in terms of new job placements, with an additional decline of 17.5%, when compared to men. Finally, we show that these asymmetries are stronger in the municipalities with a higher share of temporary contracts, i.e. the crisis is more unequal in more dual labour markets.
We combine several data sources to present suggestive evidence that these results are driven by a combination of mechanisms. The first is the mechanical effect of furlough policies that prohibit dismissals of workers, thus creating an extra layer of protection for permanent workers, exacerbating the dual nature of the labour market. Indeed, we show that the share of workers in furlough is positively correlated with the share of temporary workers at the sectorial level. The second is a sectorial effect, according to which temporary workers are more prevalent in the sectors that were the most hit by the crisis, as measured by the contraction in electronic transactions with foreign and domestic cards. The third is an occupation effect, since occupations of temporary workers are less likely to be amenable to working-from-home arrangements.
Furlough policies maintain the matching capital between firms and workers in the short run, but longer periods of support can be problematic because they lock-in production factors in zombie firms. Whether the matching capital of permanent workers is more valuable than that of temporary ones is an open policy question. Nevertheless, furlough policies have supported a total of 1.2 million workers at the peak of the crisis, whereas unemployment never surpassed 400 thousand individuals, according to Statistics Portugal. This suggests that the policy mix was sub-optimal in the short-run, as the protection of permanent workers through furlough exacerbated the duality of the market.
Funding source: Fundação para a Ciência e a Tecnologia
Award Identifier / Grant number: UID/ECO/00124/2013
Award Identifier / Grant number: UID/ECO/00124/2019
Award Identifier / Grant number: Social Sciences DataLab
Award Identifier / Grant number: LISBOA-01-0145-FEDER-022209
Award Identifier / Grant number: LISBOA-01-0145-FEDER-007722
Award Identifier / Grant number: PTDC/EGE-ECO/31213/2017
Funding source: Université Libre de Bruxelles - ECARES
Funding source: Agencia Estatal de Investigación MCIN/AEI/10.13039/501100011033
Award Identifier / Grant number: CEX2021-001181-M
Funding source: Comunidad de Madrid
Award Identifier / Grant number: Mad-Econ-Pol-CM H2019/HUM-5891
Award Identifier / Grant number: EPUC3M11 (V PRICIT)
Acknowledgement
The authors are grateful to Pedro Brinca, Pierre Cahuc, Marta Lopes, Pedro Martins, Pedro Vicente, and the participants of the 60th GEE/GPEARI Seminar, the 14th Workshop on Labour Economics (IAAEU Trier University), and the Workshop on Short-time work in economic crises (IAB) for their helpful comments. Mariana Esteves provided outstanding research assistance. All errors are our own.
-
Research funding: This work was funded by Fundação para a Ciência e a Tecnologia (UID/ECO/00124/2013, UID/ECO/00124/2019 and Social Sciences DataLab, LISBOA-01-0145-FEDER-022209), POR Lisboa (LISBOA-01-0145-FEDER-007722, LISBOA-01-0145-FEDER-022209) and POR Norte (LISBOA-01-0145-FEDER-022209) and the research project PTDC/EGE-ECO/31213/2017. Bruno P. Carvalho acknowledges the scientific and financial support of ECARES, Université Libre de Bruxelles, and the support from Agencia Estatal de Investigación del Gobierno de España (CEX2021-001181-M) and Comunidad de Madrid (Spain), grant EPUC3M11 (V PRICIT), and grant H2019/HUM-5891.
Appendix A: Derivation of the Impacts
Departing from Eq. (1), we can write the coefficients
where
with
Hence, we use the growth rates observed in the data to correct for any possible seasonal differences between the YoY growth rates of each month m and February. Finally, we estimate the net YoY growth rates by computing
Appendix B: Additional Tables
Data coverage and sources.
| Variable | Source | Period | Observation level | Calculations for the paper |
|---|---|---|---|---|
| Total registrations in unemployment centers – stock, breakdown by gender, age and education | IEFP | Monthly, Oct to Aug, 2016–2020 | Municipal level | – |
| Total job placements – flow, breakdown by gender | IEFP | Monthly, Oct to Aug, 2016–2020 | Municipal level | – |
| Reasons to register in the unemployment office, breakdown by 6 categories | IEFP | Monthly, Oct to Aug, 2016–2020 | Municipal level | – |
| Share of temporary workers in the private sector. | GEP-MTSSS (Quadros de Pessoal) | 2018 | Individual level data covering all private sector firms. | Municipal level share computed by the authors. |
| Measure of sectors most affected by the pandemic: Value of purchases with bank cards | SIBS | Apr 2019, 2020 | Municipal level monthly, by 39 sectors of activity. | YoY change in purchases aggregated at the NACE activity sector. |
| Prevalence of layoff by sector | MTSSS | 2020 | Number of firms that registered for the furlough scheme | – |
| Share of temporary workers as a % of total employment | Labour force survey – INE | Q1-2018 to Q2-2020 | Quarterly individual data | National averages, by gender, age and education level |
NUTS II: magnitudes.
| Dep. var.: | Log of unemployment | |||||||||
|---|---|---|---|---|---|---|---|---|---|---|
| Norte | Centro | Lisboa VT | Alentejo | Algarve | ||||||
| P.E. | Eff. (p.p.) | P. E. | Eff. (p.p.) | P.E. | Eff. (p.p.) | P.E. | Eff. (p.p.) | P.E. | Eff. (p.p.) | |
| (1) | (2) | (3) | (4) | (5) | (6) | (7) | (8) | (9) | (10) | |
| Mar-20 | 0.079 | 6.77 | 0.099 | 9.24 | 0.126 | 11.88 | 0.126 | 14.18 | 0.284 | 33.22 |
| (0.75) | (0.9) | (0.98) | (0.99) | (6.9) | ||||||
| Apr-20 | 0.210 | 19.15 | 0.206 | 19.39 | 0.323 | 35.03 | 0.257 | 27.88 | 0.683 | 101.17 |
| (1.99) | (1.93) | (2.51) | (1.99) | (9.46) | ||||||
| May-20 | 0.284 | 27.18 | 0.274 | 27.25 | 0.413 | 46.09 | 0.330 | 35.57 | 0.963 | 166.11 |
| (2.59) | (2.48) | (3.16) | (2.5) | (11.02) | ||||||
| Jun-20 | 0.300 | 27.03 | 0.287 | 27.01 | 0.442 | 49.01 | 0.371 | 39.22 | 1.042 | 186.71 |
| (2.7) | (2.56) | (3.43) | (2.85) | (10.97) | ||||||
| Jul-20 | 0.305 | 28.04 | 0.292 | 28.64 | 0.462 | 50.06 | 0.325 | 31.27 | 0.994 | 179.54 |
| (2.74) | (2.59) | (3.66) | (2.57) | (11.26) | ||||||
| Aug-20 | 0.296 | 26.71 | 0.280 | 25.62 | 0.448 | 46.50 | 0.322 | 30.92 | 0.889 | 146.78 |
| (2.78) | (2.64) | (3.71) | (2.72) | (12.12) | ||||||
-
t-statistics in parenthesis. Point estimates are the coefficients β m from (1). The effect is given by
Motives for registration: magnitudes.
| Dep. var.: | Log of new unemployment | |||||
|---|---|---|---|---|---|---|
| Dismissed from | Voluntarily quit | Mutual agreement | ||||
| previous job | previous job | dismissal | ||||
| P.E. | Eff. (p.p.) | P.E. | Eff. (p.p.) | P.E. | Eff. (p.p.) | |
| (1) | (2) | (3) | (4) | (5) | (6) | |
| Mar-20 | 0.654 | 112.52 | −0.126 | −6.10 | −0.004 | 3.99 |
| (9.45) | (−3.85) | (−0.07) | ||||
| Apr-20 | 1.145 | 215.70 | −0.031 | −6.37 | 0.179 | 26.08 |
| (22.62) | (-0.57) | (4.98) | ||||
| May-20 | 0.513 | 72.80 | −0.324 | −23.31 | −0.062 | −10.59 |
| (9.4) | (−8.94) | (−1.49) | ||||
| Jun-20 | 0.322 | 55.72 | −0.147 | 0.53 | −0.110 | −7.79 |
| (4.49) | (−3.57) | (−2.62) | ||||
| Jul-20 | 0.301 | 33.27 | −0.125 | −14.68 | −0.080 | −8.96 |
| (8.68) | (−1.71) | (−1.08) | ||||
| Aug-20 | 0.296 | 40.17 | −0.148 | −6.25 | −0.002 | −2.55 |
| (5.24) | (−2.66) | (−0.03) | ||||
| Dep. var.: | Log of new unemployment | |||||
| End of temporary job | Former inactive worker | Self-employed | ||||
| P.E. | Eff. (p.p.) | P.E. | Eff. (p.p.) | P.E. | Eff. (p.p.) | |
| (7) | (8) | (9) | (10) | (11) | (12) | |
| Mar-20 | 0.424 | 69.58 | −0.424 | −25.97 | 0.078 | 24.58 |
| (8.73) | (−3.41) | (0.59) | ||||
| Apr-20 | 0.675 | 87.26 | −0.932 | −53.48 | 0.392 | 50.53 |
| (13.14) | (−13.89) | (1.94) | ||||
| May-20 | 0.455 | 58.00 | −0.462 | −29.07 | 0.148 | 18.40 |
| (12.34) | (−5.22) | (0.91) | ||||
| Jun-20 | 0.274 | 36.88 | −0.136 | −2.25 | 0.199 | 37.38 |
| (5.03) | (−1.52) | (1.79) | ||||
| Jul-20 | 0.220 | 19.64 | −0.131 | −16.53 | 0.067 | 11.82 |
| (3.37) | (−1.96) | (0.42) | ||||
| Aug-20 | 0.186 | 22.94 | 0.065 | 13.40 | 0.165 | 27.36 |
| (3.19) | (0.65) | (1.17) | ||||
-
t-statistics in parenthesis. Point estimates are the coefficients β m from (1). The effect is given by
Means tests of coefficient equality, age.
| 25–34 | 35–54 |
|
|
|---|---|---|---|
|
|
4.44 | 17.28 | 33.78 |
| (0.04) | (0.00) | (0.00) | |
| 25–34 | – | 8.81 | 26.05 |
| (0.00) | (0.00) | ||
| 35–54 | – | – | 22.03 |
| (0.00) |
-
χ 2 statistics. Probability
Means tests of coefficient equality, education level.
| Basic | Lower sec. | Upper sec. | Higher | |
|---|---|---|---|---|
| Primary or less | 1.98 | 14.77 | 9.67 | 0.12 |
| (0.16) | (0.00) | (0.00) | (0.73) | |
| Basic | – | 9.38 | 3.56 | 0.39 |
| (0.00) | (0.06) | (0.53) | ||
| Lower sec. | – | – | 1.40 | 5.19 |
| (0.24) | (0.02) | |||
| Upper sec. | – | – | – | 3.53 |
| (0.06) |
-
χ 2 statistics. Probability
Share of temporary contracts and the Covid-19 crisis (sub-sample excluding the municipalities in the top quartile of the distribution of tourist overnight stays).
| Dep. var.: | Log of unemployment |
|---|---|
| (1) | |
|
|
0.962** |
| (0.29) | |
| Number of obs. | 9152 |
| R-squared | 0.980 |
-
Standard errors (in parenthesis) are clustered at NUTS II and time period (month, year) level. Significance levels: * p
Share of temporary contracts and the Covid-19 crisis (sub-sample excluding the municipalities in the top quartile of the distribution of tourist overnight stays).
| Dep. var.: | Log of unemployment | |||||
|---|---|---|---|---|---|---|
| Dimension: | Gender | Age | ||||
| Male | Female |
|
25–34 | 35–54 |
|
|
| (1) | (2) | (3) | (4) | (5) | (6) | |
|
|
1.036** | 0.906* | 1.429* | 1.107** | 0.922** | 0.608* |
| (0.26) | (0.36) | (0.56) | (0.34) | (0.25) | (0.23) | |
| Number of obs. | 9152 | 9152 | 9152 | 9152 | 9152 | 9152 |
| R-squared | 0.973 | 0.980 | 0.946 | 0.965 | 0.974 | 0.985 |
| Dimension: | Education | ||||
|---|---|---|---|---|---|
| Primary or less | Basic | Lower sec. | Upper sec. | Higher | |
| (7) | (8) | (9) | (10) | (11) | |
|
|
0.703* | 0.767** | 1.080** | 1.151** | 0.873* |
| (0.29) | (0.25) | (0.28) | (0.33) | (0.37) | |
| Number of obs. | 9152 | 9152 | 9152 | 9152 | 9152 |
| R-squared | 0.971 | 0.965 | 0.968 | 0.974 | 0.970 |
-
Standard errors (in parenthesis) are clustered at NUTS II and time period (month, year) level. Significance levels: *p
Activity sectors (NACE, sections).
| Code | Sector |
|---|---|
| A | Agriculture, forestry and fishing |
| B | Mining and quarrying |
| C | Manufacturing |
| D | Electricity, gas, steam and air-conditioning supply |
| E | Water supply, sewerage, waste management and remediation |
| F | Construction |
| G | Wholesale and retail trade, repair of motor vehicles and motorcycles |
| H | Transportation and storage |
| I | Accommodation and food service activities |
| J | Audiovisual, broadcasting and telecommunications |
| K | Financial and insurance activities |
| L | Real estate activities |
| M | Consulting, technical and scientific activities |
| N | Administrative and support service activities |
| O | Public administration and defence, compulsory social security |
| P | Education |
| Q | Healthcare, residential care and social work activities |
| R | Arts, entertainment and recreation |
| S | Other services |
| T | Activities of households as employers, undifferentiated goods- and services-producing activities of households for own use |
| U | Activities of extra-territorial organizations and bodies. |
Occupations’ classification (ISCO, Level 2).
| Code | Sector |
|---|---|
| 11 | Management occupations |
| 13 | Business and financial operations occupations |
| 15 | Computer and mathematical occupations |
| 17 | Architecture and engineering occupations |
| 19 | Life, physical, and social science occupations |
| 21 | Community and social service occupations |
| 23 | Legal occupations |
| 25 | Education, training, and library occupations |
| 27 | Arts, design, entertainment, sports, and media occupations |
| 29 | Healthcare practitioners and technical occupations |
| 31 | Healthcare support occupations |
| 33 | Protective service occupations |
| 35 | Food preparation and serving related occupations |
| 37 | Building and grounds cleaning and maintenance occupations |
| 39 | Personal care and service occupations |
| 41 | Sales and related occupations |
| 43 | Office and administrative support occupations |
| 45 | Farming, fishing, and forestry occupations |
| 47 | Construction and extraction occupations |
| 49 | Installation, maintenance, and repair occupations |
| 51 | Production occupations |
| 53 | Transportation and material moving occupations |
Appendix C: Additional Figures
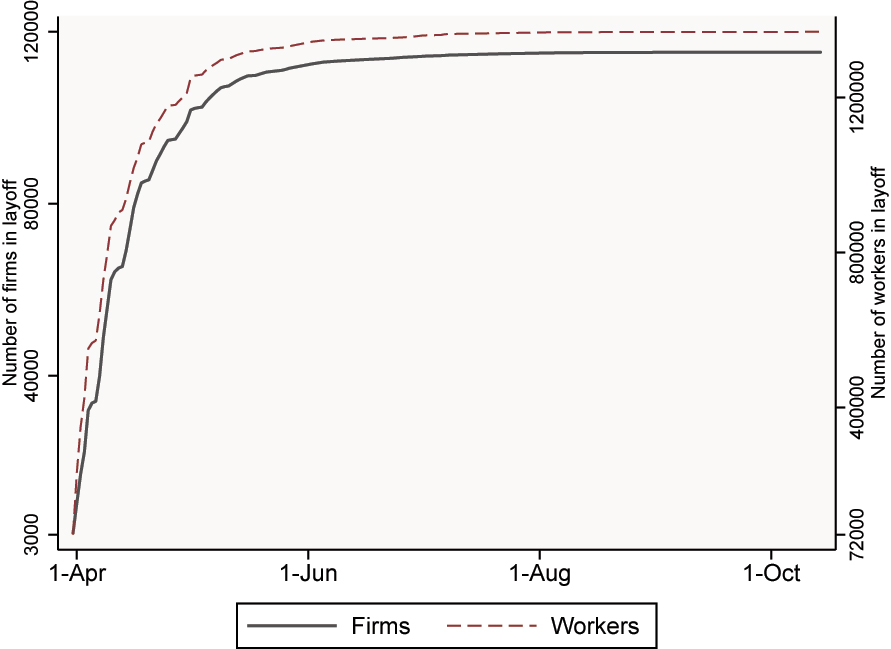
Total number of firms and workers under the furlough scheme. Source: GEP/MTSSS.
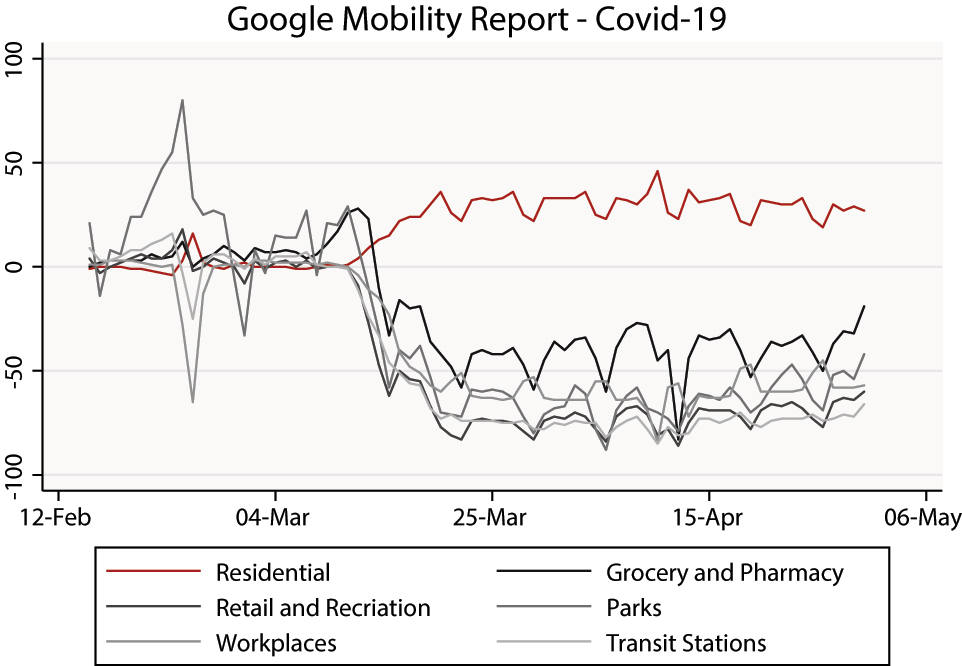
Google Mobility Index: Time Series. The figure plots the time series of the Google Mobility Index, from its mobility reports, for the six available categories. Google computes this indicator taking the median value of the mobility between January 3 and February 6, 2020, as the reference period. The figure is borrowed from Carvalho et al. (2022).
Identification strategy, unemployment and new job placements by gender. Time-series of Log of average unemployment and new job placements, by gender. The blue line represents the period between October 2019 and August 2020 (the treatment group), of which October 2019 to January 2020 correspond to the pre-treatment period, and March 2020 to August 2020 correspond to the treatment period. The remaining lines represent the control group, i.e. the same series lagged one (Oct. 2018–Aug. 2019), two (Oct. 2017–Aug. 2018) and three (Oct. 2016–Aug. 2017) years.
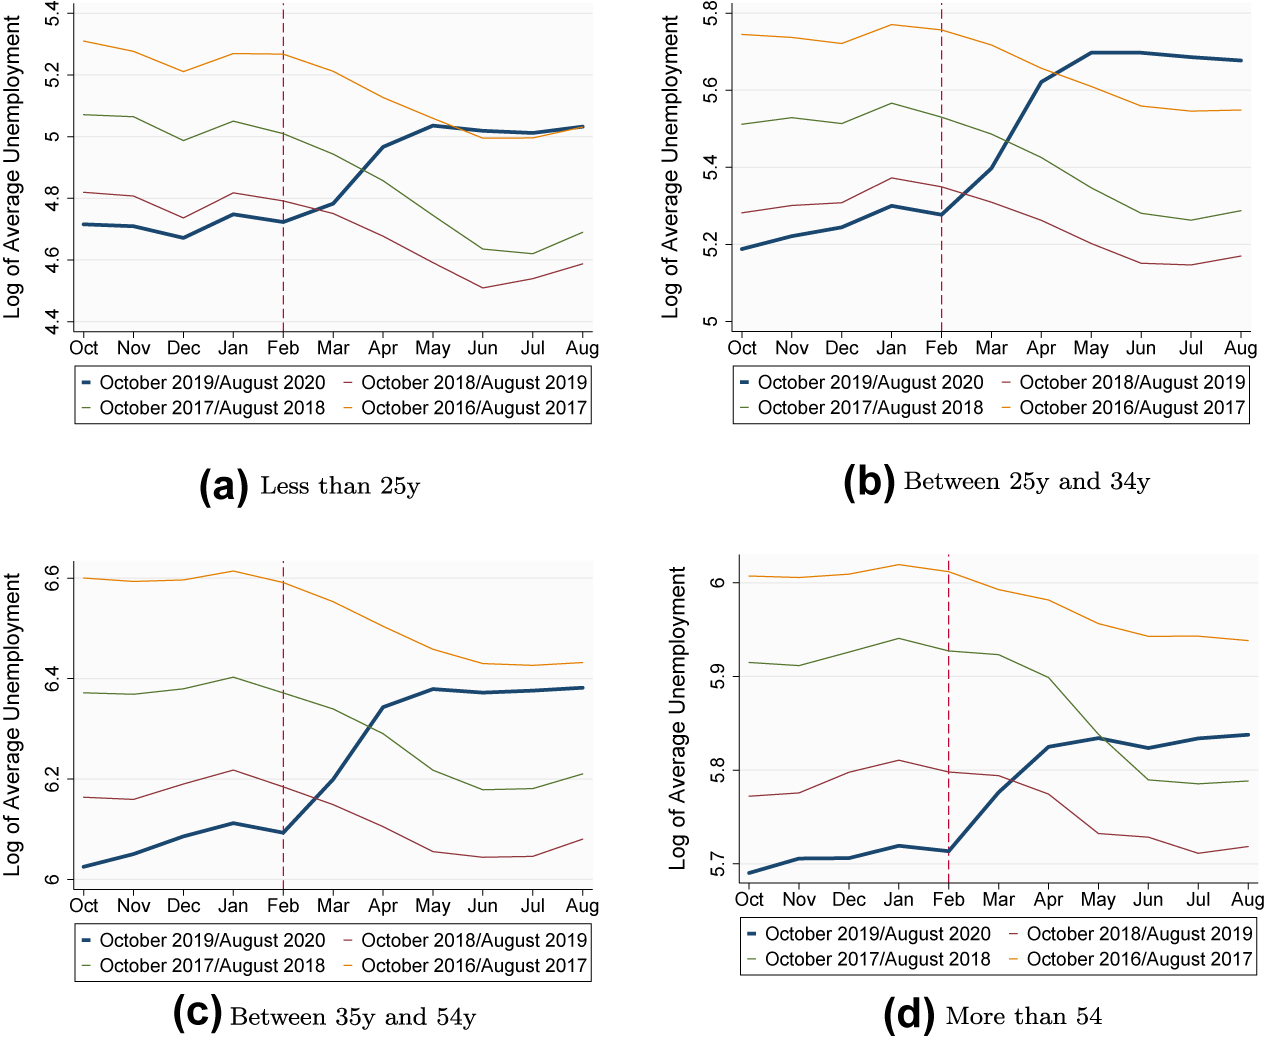
Identification strategy, unemployment by age. Time-series of Log of average unemployment, by age. The blue line represents the period between October 2019 and August 2020 (the treatment group), of which October 2019 to January 2020 correspond to the pre-treatment period, and March 2020 to August 2020 correspond to the treatment period. The remaining lines represent the control group, i.e. the same series lagged one (Oct. 2018–Aug. 2019), two (Oct. 2017–Aug. 2018) and three (Oct. 2016–Aug. 2017) years.
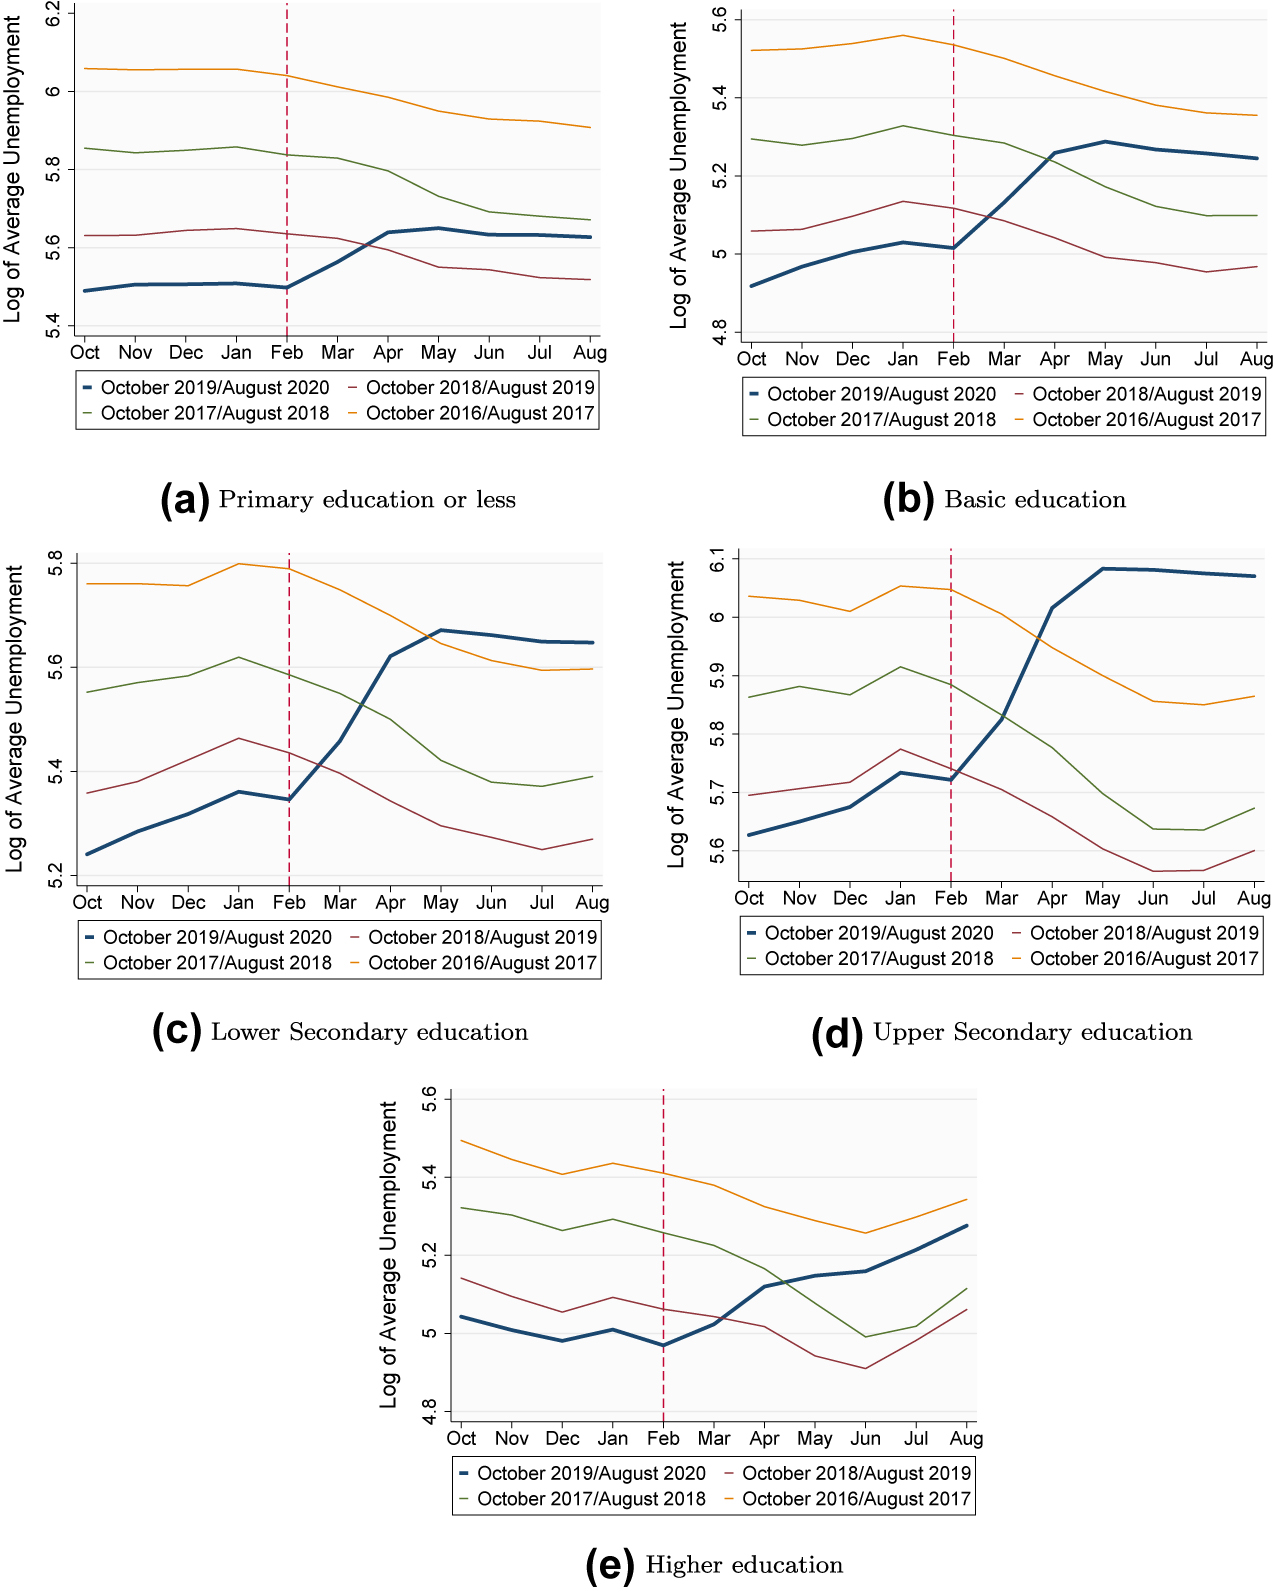
Identification strategy, unemployment by education. Time-series of Log of average unemployment, by education level. The blue line represents the period between October 2019 and August 2020 (the treatment group), of which October 2019 to January 2020 correspond to the pre-treatment period, and March 2020 to August 2020 correspond to the treatment period. The remaining lines represent the control group, i.e. the same series lagged one (Oct. 2018 Aug. 2019), two (Oct. 2017–Aug. 2018) and three (Oct. 2016–Aug. 2017) years.
Event study aggregate effects: different fixed effects.
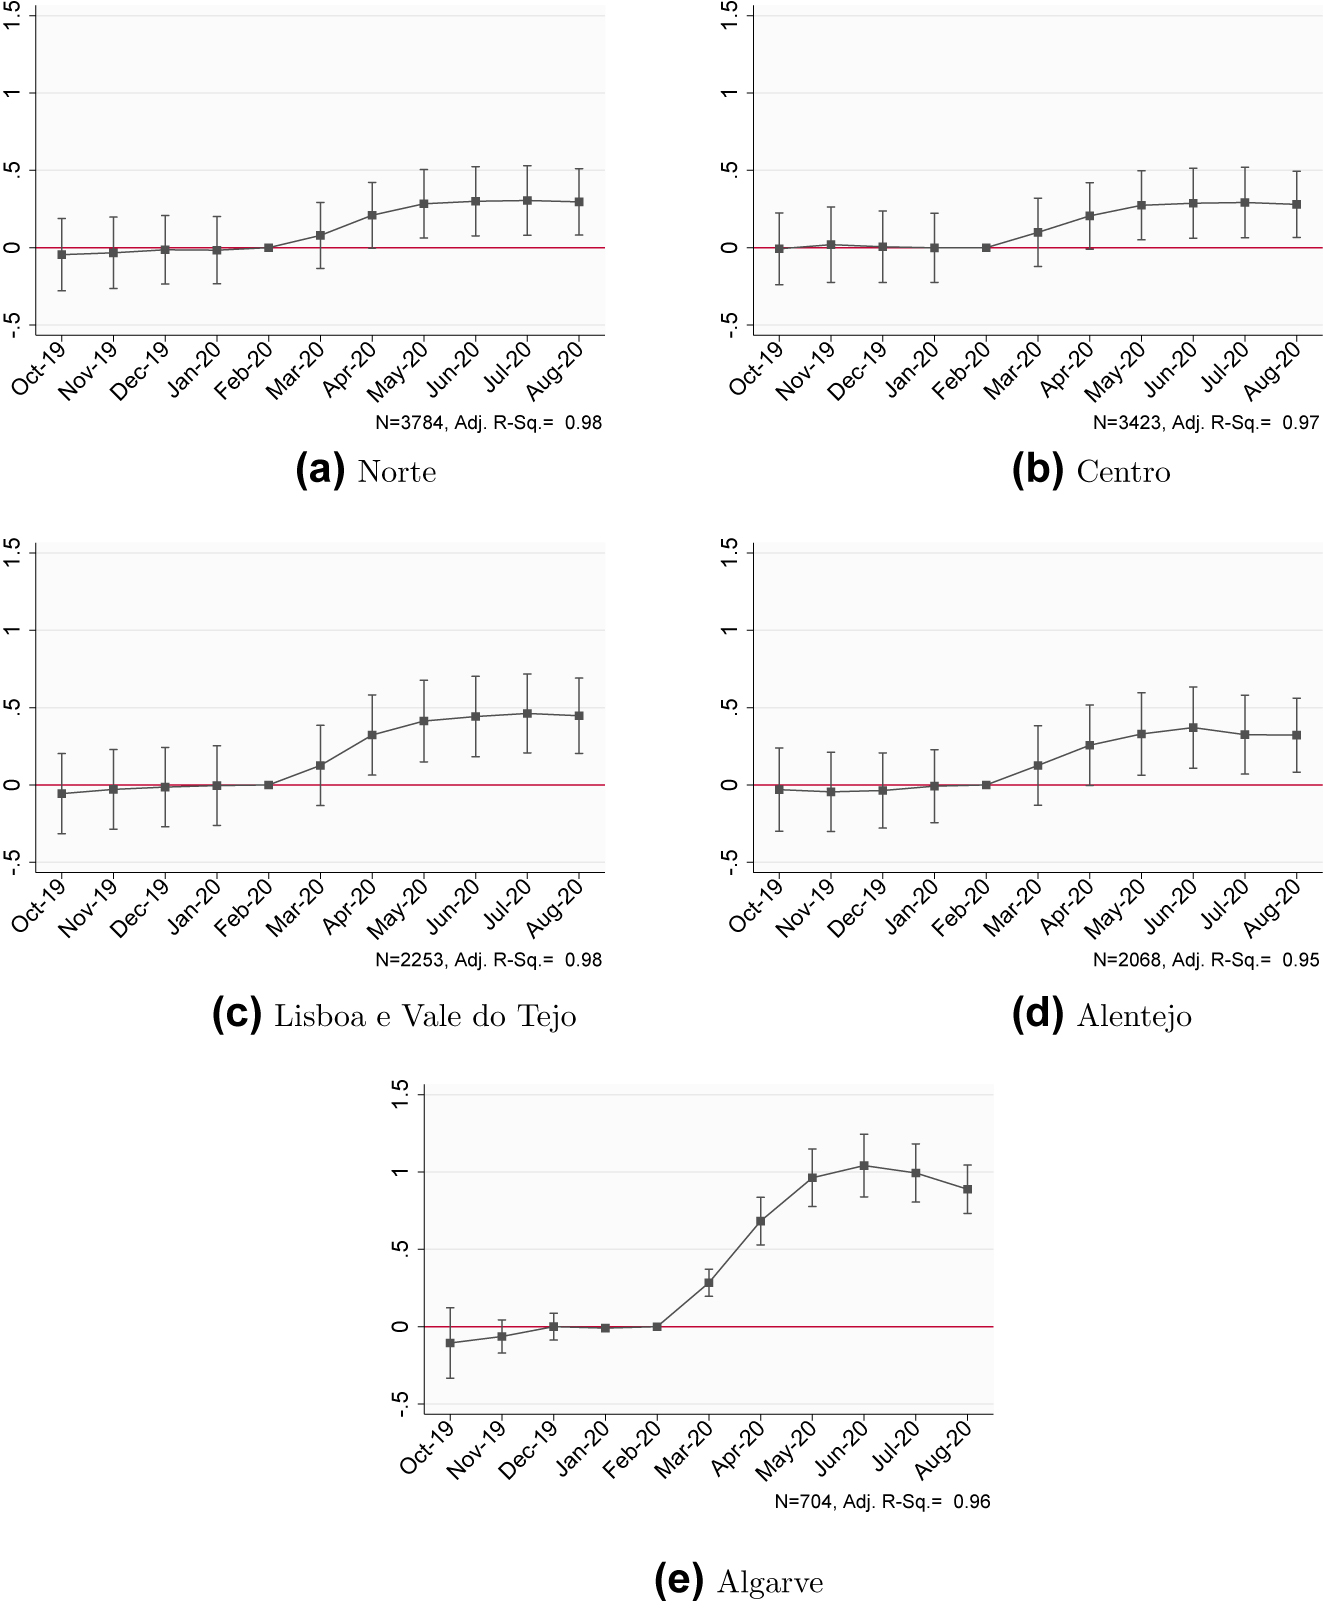
Event study aggregate effects: unemployment by NUTS II region. Standard errors are clustered at the municipality (instead of NUTS II) and time period level.
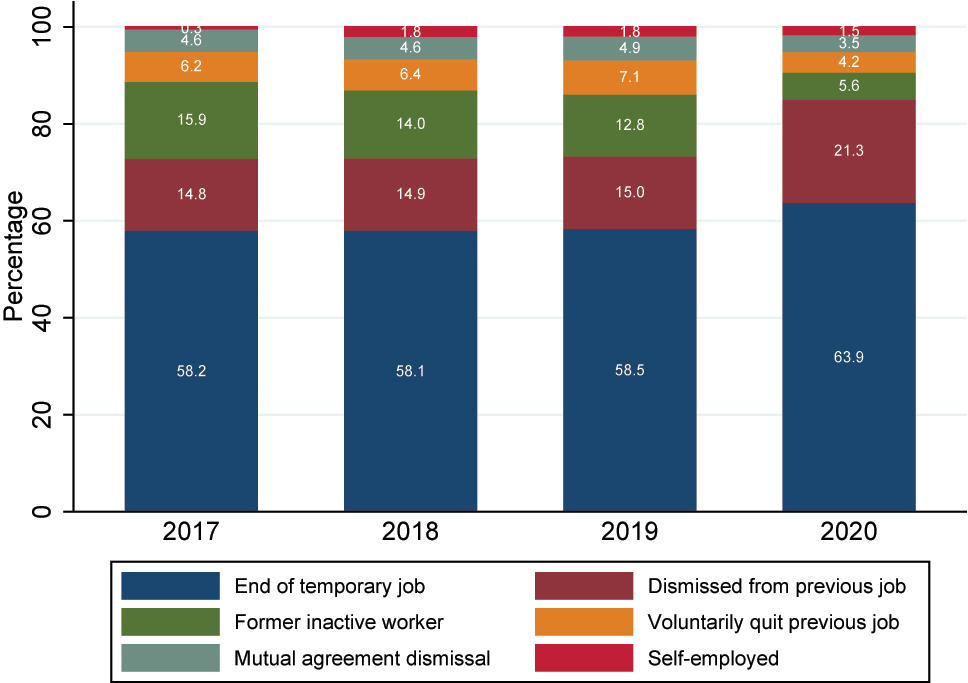
Average new unemployment between March and August (% of total new registrations) by motive of registration.
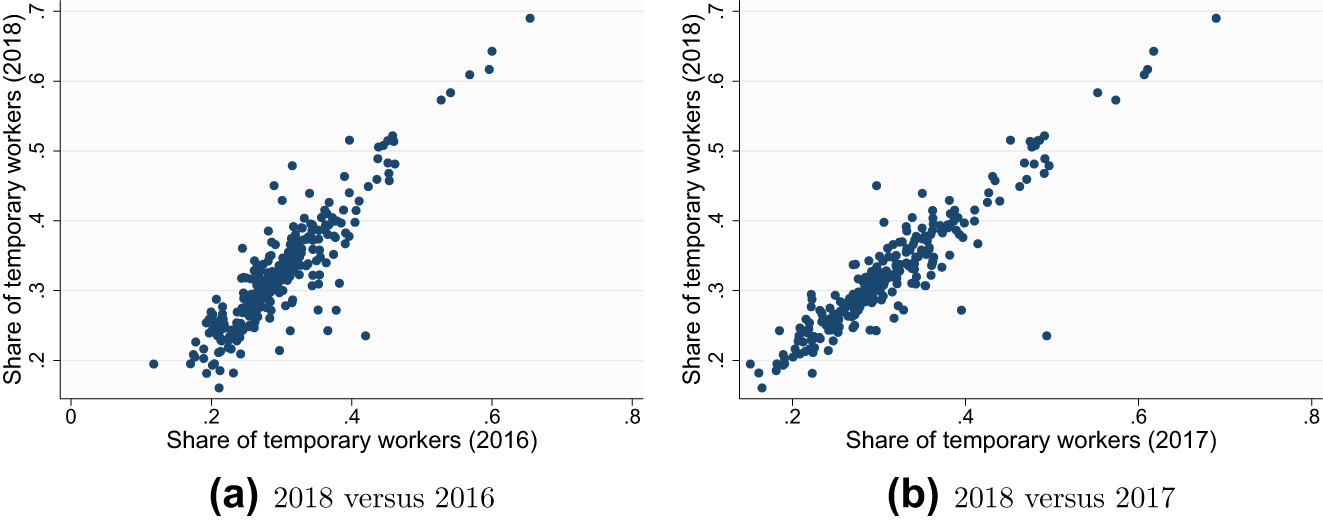
Scatterplot share of temporary workers.
References
Adams-Prassl, A., T. Boneva, M. Golin, and C. Rauh. 2020a. “Furloughing.” Fiscal Studies 41 (3): 591–622. https://doi.org/10.1111/1475-5890.12242.Search in Google Scholar
Adams-Prassl, A., T. Boneva, M. Golin, and C. Rauh. 2020b. “Inequality in the Impact of the Coronavirus Shock: Evidence from Real Time Surveys.” Journal of Public Economics 189: 104245. https://doi.org/10.1016/j.jpubeco.2020.104245.Search in Google Scholar
Adams-Prassl, A., T. Boneva, M. Golin, and C. Rauh. 2022. “Work that Can Be Done from Home: Evidence on Variation within and across Occupations and Industries.” Labour Economics 74: 102083. https://doi.org/10.1016/j.labeco.2021.102083.Search in Google Scholar
Alon, T., M. Doepke, J. Olmstead-Rumsey, and M. Tertilt. 2020. “This Time It’s Different: The Role of Women’s Employment in a Pandemic Recession.” In Working Paper Series, No. 27660. National Bureau of Economic Research.10.3386/w27660Search in Google Scholar
Alstadsæter, A., B. Bratsberg, G. Eielsen, W. Kopczuk, S. Markussen, O. Raaum, and K. Røed. 2020. “The First Weeks of the Coronavirus Crisis: Who Got Hit, when and Why? Evidence from Norway.” In Working Paper Series, No. 27131. National Bureau of Economic Research.10.3386/w27131Search in Google Scholar
Aum, S., S. Yoon (Tim) Lee, and Y. Shin. 2021. “COVID-19 Doesn’t Need Lockdowns to Destroy Jobs: The Effect of Local Outbreaks in Korea.” Labour Economics 70: 101993. https://doi.org/10.1016/j.labeco.2021.101993.Search in Google Scholar
Bamieh, O., and L. Ziegler. 2020. “How Does the Covid-19 Crisis Affect Labor Demand? an Analysis Using Job Board Data from Austria.” In IZA Discussion Papers, No. 13801. Institute of Labor Economics.10.2139/ssrn.3718181Search in Google Scholar
Banco de Portugal. 2020. Boletim Económico - Outubro 2020. Lisbon: Banco de Portugal.Search in Google Scholar
Betcherman, G., N. Giannakopoulos, I. Laliotis, I. Pantelaiou, M. Testaverde, and G. Tzimas. 2020. “Reacting Quickly and Protecting Jobs: The Short-Term Impacts of the COVID-19 Lockdown on the Greek Labor Market.” In IZA Discussion Papers, No. 13516. Institute of Labor Economics.10.1596/1813-9450-9356Search in Google Scholar
Birinci, S., F. Karahan, Y. Mercan, and S. Kurt. 2021. “Labor Market Policies during an Epidemic.” Journal of Public Economics 194: 104348. https://doi.org/10.1016/j.jpubeco.2020.104348.Search in Google Scholar
Blanchard, O., and P. Portugal. 2017. “Boom, Slump, Sudden Stops, Recovery, and Policy Options:Portugal and the Euro.” In Working Papers 2017, No. 11. Banco de Portugal.10.2139/ssrn.3008731Search in Google Scholar
Boeri, T., and H. Brücker. 2011. “Short-Time Work Benefits Revisited: Some Lessons from the Great Recession.” Economic Policy 26: 697–765. https://doi.org/10.1111/j.1468-0327.2011.271.x.Search in Google Scholar
Bonacini, L., G. Gallo, and S. Scicchitano. 2021. “Working from Home and Income Inequality: Risks of a ‘new Normal’ with COVID-19.” Journal of Population Economics 34: 303–60. https://doi.org/10.1007/s00148-020-00800-7.Search in Google Scholar
Botha, F., J. P. de New, S. C. de New, D. C. Ribar, and N. Salamanca. 2021. “Implications of COVID-19 Labour Market Shocks for Inequality in Financial Wellbeing.” Journal of Population Economics 34: 655–89. https://doi.org/10.1007/s00148-020-00821-2.Search in Google Scholar
Bourdin, S., L. Jeanne, F. Nadou, and G. Noiret. 2021. “Does Lockdown Work? A Spatial Analysis of the Spread and Concentration of Covid-19 in Italy.” Regional Studies 55 (7): 1182–93. https://doi.org/10.1080/00343404.2021.1887471.Search in Google Scholar
Cajner, T., L. D. Crane, R. A. Decker, J. Grigsby, A. Hamins-Puertolas, E. Hurst, C. Kurz, and A. Yildirmaz. 2020. “The U.S. Labor Market during the Beginning of the Pandemic Recession.” Brookings Papers on Economic Activity 2020 (2): 3–33. https://doi.org/10.1353/eca.2020.0005.Search in Google Scholar
Carneiro, A., P. Portugal, and J. Varejão. 2014. “Catastrophic Job Destruction during the Portuguese Economic Crisis.” Journal of Macroeconomics 39: 444–57. https://doi.org/10.1016/j.jmacro.2013.09.018.Search in Google Scholar
Carvalho, B., S. Peralta, and J. Pereira dos Santos. 2020. “What and How Did People Buy during the Great Lockdown? Evidence from Electronic Payments.” In Covid Economics: Vetted and Real-Time Papers. Issue 28, 119–58. Centre for Economic Policy Research.Search in Google Scholar
Carvalho, B., S. Peralta, and J. Pereira dos Santos. 2022. “Regional and Sectorial Impacts of the Covid-19 Crisis: Evidence from Electronic Payments.” Journal of Regional Science 62 (3): 757–798. https://doi.org/10.1111/jors.12575.Search in Google Scholar
Casarico, A., and S. Lattanzio. 2020. “The Heterogeneous Effects of COVID- 19 on Labor Market Ows: Evidence from Administrative Data.” In Covid Economics: Vetted and Real-Time Papers. Issue 52, 152–74. Centre for Economic Policy Research.Search in Google Scholar
Cho, S. J., J. Y. Lee, and J. V. Winters. 2021. “Employment Impacts of the COVID-19 Pandemic across Metropolitan Status and Size.” Growth and Change 52 (4). https://doi.org/10.1111/grow.12540.Search in Google Scholar
Cho, S. J., and J. V. Winters. 2020. “The Distributional Impacts of Early Employment Losses from COVID-19.” In GLO Discussion Paper Series, No. 554. Global Labor Organization.10.2139/ssrn.3602755Search in Google Scholar
Coibion, O., Y. Gorodnichenko, and M. Weber. 2020. “Labor Markets during the COVID-19 Crisis: A Preliminary View.” In Working Paper Series, No. 27017. National Bureau of Economic Research.10.3386/w27017Search in Google Scholar
Cortes, G. M., and E. Forsythe. 2022. “Heterogeneous Labor Market Impacts of the COVID-19 Pandemic.” ILR Review 76 (1): 30–55. https://doi.org/10.1177/00197939221076856.Search in Google Scholar
Couch, K. A., R. W. Fairlie, and H. Xu. 2020. “Early Evidence of the Impacts of COVID-19 on Minority Unemployment.” Journal of Public Economics 192: 104287. https://doi.org/10.1016/j.jpubeco.2020.104287.Search in Google Scholar
Del Boca, D., N. Oggero, P. Profeta, and M. C. Rossis. 2020. “Women’s Work, Housework and Childcare, before and during COVID-19.” Review of Economics of the Household 18: 1001–17. https://doi.org/10.1007/s11150-020-09502-1.Search in Google Scholar
Dias, M. C., R. Joyce, F. Postel-Vinay, and X. Xu. 2020. “The Challenges for Labour Market Policy during the COVID-19 Pandemic.” Fiscal Studies 41. https://doi.org/10.1111/1475-5890.12233.Search in Google Scholar
Dingel, J. I., and B. Neiman. 2020. “How Many Jobs Can Be Done at Home?” In Working Paper Series 26948. National Bureau of Economic Research. Also available at http://www.nber.org/papers/w26948.10.3386/w26948Search in Google Scholar
European Commission. 2018. European Semester: Country Specific Recommendation/Commission Recommendation – Portugal. Also available at https://eur-lex.europa.eu/legal-content/EN/TXT/?uri=CELEX:52018DC0421.Search in Google Scholar
Farré, L., Y. Fawaz, L. Gonzalez, and J. Graves. 2020. “How the COVID-19 Lockdown Affected Gender Inequality in Paid and UnpaidWork in Spain.” In IZA Discussion Papers, No. 13434. Institute of Labor Economics.10.2139/ssrn.3643198Search in Google Scholar
Ferreira, P., J. Cerejeira, and M. Portela. 2020. IZA COVID-19 Crisis Response Monitoring - Portugal (November 2020). Bonn: Institute of Labor Economics.Search in Google Scholar
Forsythe, E., L. B. Kahn, F. Lange, and D. G. Wiczer. 2020. “Labor Demand in the Time of COVID-19: Evidence from Vacancy Postings and UI Claims.” Journal of Public Economics 189: 104238. https://doi.org/10.1016/j.jpubeco.2020.104238.Search in Google Scholar
Gabe, T., and R. Florida. 2021. “Impacts of Jobs Requiring Close Physical Proximity and High Interaction with the Public on US Industry Employment Change during the Early Stages of the COVID-19 Pandemic.” The B.E. Journal of Economic Analysis & Policy 21 (3): 1163–72. https://doi.org/10.1515/bejeap-2021-0052.Search in Google Scholar
Giupponi, G., C. Landais, and A. Lapeyre. 2022. “Should We Insure Workers or Jobs during Recessions?” The Journal of Economic Perspectives 36 (2): 29–54. https://doi.org/10.1257/jep.36.2.29.Search in Google Scholar
Grabner, S. M., and A. Tsvetkova. 2022. “Urban Labour Market Resilience during the Covid-19 Pandemic: What Is the Promise of Teleworking?” Regional Studies 1–16. https://doi.org/10.1080/00343404.2022.2042470.Search in Google Scholar
Graeber, D., A. S. Kritikos, and J. Seebauer. 2021. “COVID-19: A Crisis of the Female Self-Employed.” Journal of Population Economics 34 (4): 1141–87. https://doi.org/10.1007/s00148-021-00849-y.Search in Google Scholar
Hensvik, L., T. Le Barbanchon, and R. Rathelot. 2020. “Job Search during the COVID-19 Crisis.” Journal of Public Economics 194: 104349. https://doi.org/10.1016/j.jpubeco.2020.104349.Search in Google Scholar
Herzog-Stein, A., P. Nüß, L. Peede, and U. Stein. 2022. “Germany and the United States in Coronavirus Distress: Internal versus External Labour Market Flexibility.” Journal for Labour Market Research 56 (11). https://doi.org/10.1186/s12651-022-00316-5.Search in Google Scholar
Hupkau, C., and B. Petrongolo. 2020. “Work, Care and Gender during the Covid-19 Crisis.” Fiscal Studies 41 (3): 623–51. https://doi.org/10.1111/1475-5890.12245.Search in Google Scholar
ILO. 2017. “The Covid-19 Response: Getting Gender Equality Right for a Better Future for Women at Work.” In ILO Brief. International Labour Organization.Search in Google Scholar
INE. 2020. Trabalho a partir de casa – Módulo ad hoc do Inquérito ao Emprego (2.°trimestre de 2020). Lisbon: Instituto Nacional de Estatística.Search in Google Scholar
Jones, S. R. G., F. Lange, W. C. Riddell, and C. Warman. 2020. “Waiting for Recovery: The Canadian Labour Market in June 2020.” Canadian Public Policy 46 (S2): S102–18. https://doi.org/10.3138/cpp.2020-078.Search in Google Scholar
Kalenkoski, C. M., and P. S. Wulff. 2020. “Initial Impact of the COVID-19 Pandemic on the Employment and Hours of Self- Employed Coupled and Single Workers by Gender and Parental Status.” In IZA Discussion Papers, No. 13443. Institute of Labor Economics.10.2139/ssrn.3643207Search in Google Scholar
Kikuchi, S., S. Kitao, and M. Mikoshiba. 2021. “Who Suffers from the COVID-19 Shocks? Labor Market Heterogeneity and Welfare Consequences in Japan.” Journal of the Japanese and International Economies 59: 101117. https://doi.org/10.1016/j.jjie.2020.101117.Search in Google Scholar
Lafuente, C., R. Santaeulália-Llopis, and L. Visschers. 2022. “Temping Fates in Spain: Hours and Employment in a Dual Labor Market during the Great Recession and COVID-19.” SERIEs 13: 101–45. https://doi.org/10.1007/s13209-021-00257-1.Search in Google Scholar
Lemieux, T., K. Milligan, T. Schirle, and M. Skuterud. 2020. “Initial Impacts of the COVID-19 Pandemic on the Canadian Labour Market.” Canadian Public Policy 46 (S1): S55–65. https://doi.org/10.3138/cpp.2020-049.Search in Google Scholar
Martins, F., and P. Portugal. 2019. “De que forma a rigidez á baixa dos salários afetou o desemprego durante a crise económica?” In O Crescimento Económico Português: uma visão sobre questões estruturais, bloqueios e reformas, vol. 97–106. Banco de Portugal.Search in Google Scholar
Mayhew, K., and P. Anand. 2020. “COVID-19 and the UK Labour Market.” Oxford Review of Economic Policy 36 (Supplement1): S215–24. https://doi.org/10.1093/oxrep/graa017.Search in Google Scholar
Meekes, J., W. Hassink, and G. Kalb. 2020. “Essential Work and Emergency Childcare: Identifying Gender Differences in COVID-19 Effects on Labour Demand and Supply.” In IZA Discussion Papers, No. 13843. Institute of Labor Economics.10.2139/ssrn.3727684Search in Google Scholar
Midões, C. 2020. Social Distancing: Did Individuals Act before Governments? Also available at https://www.bruegel.org/2020/04/social-distancing-did-individuals-act-before-governments/ (Accessed December 29, 2020).Search in Google Scholar
Mitman, K., and S. Rabinovich. 2021. “Whether, When and How to Extend Unemployment Benefits: Theory and Application to COVID-19.” Journal of Public Economics, 200: 104447. 10.1016/j.jpubeco.2021.104447Search in Google Scholar
Montenovo, L., X. Jiang, F. L. Rojas, I. M. Schmutte, K. I. Simon, B. A. Weinberg, and C. Wing. 2020. “Determinants of Disparities in Covid- 19 Job Losses.” In Working Paper Series, No. 27132. National Bureau of Economic Research.10.3386/w27132Search in Google Scholar
OECD. 2017. Labour Market Reforms in Portugal 2011–15: A Preliminary Assessment. OECD Publishing.Search in Google Scholar
OECD. 2020. “Job Retention Schemes during the COVID-19 Lockdown and beyond.” In OECD Policy Responses to Coronavirus (COVID-19).Search in Google Scholar
Peralta, S., B. P. Carvalho, and M. Esteves. 2021. “Portugal, Balanço Social 2020: Um retrato Do país e dos efeitos da pandemia.” In Social Equity Initiative. Lisbon: Nova School of Business and Economics.Search in Google Scholar
Portugal, P., and H. Vilares. 2013. “Labor Unions, Union Density and the Union Wage Premium.” In Economic Bulletin, 61–71. Lisbon: Banco de Portugal.Search in Google Scholar
Weel, B. 2018. “The Rise of Temporary Work in Europe.” De Economist 166. https://doi.org/10.1007/s10645-018-9329-8.Search in Google Scholar
© 2023 Walter de Gruyter GmbH, Berlin/Boston
Articles in the same Issue
- Frontmatter
- Research Articles
- Overconfidence and Public Intoxication Arrest: Evidence from a University Town Police Log
- The Changing Determinants of Juvenile Crime
- Failing Young and Temporary Workers? The Impact of a Disruptive Crisis on a Dual Labour Market
- Productivity, Innovation Spillovers, and Mergers: Evidence from a Panel of U.S. Firms
- Trade Policies and FDI with an Endogenous Market Structure
- Is There a Business Cycle Effect on the Incidence of Dual Job Holding?
- The Impact of Environmental Taxation on Wage Inequality in the Presence of Subsidizing Renewable Energy
- The Competitive Foundations of Price Cap Regulation
- Letters
- Exploring the Existence of a Short-Run Kuznets Curve: Does the Fourth Industrial Revolution Affect Income distribution?
- MRS Functions and the Pareto Interval in Public Good Provision
- Optimal Imprisonment with General Enforcement of Law
- Immigration and Perceived Social Position. Insights from an Unintended Survey Experiment