The Effects of a Parenting Program on Maternal Well-Being: Evidence from a Randomized Controlled Trial
-
Georg F. Camehl
 and
Kurt Hahlweg
and
Kurt Hahlweg

Abstract
This paper evaluates how a light-touch parenting program for parents of children below school entry age affects maternal family well-being. We analyze data from a randomized controlled trial focusing on non-disadvantaged parents. Overall, results show no short-term effects but a relatively large positive effect of the intervention on maternal family well-being in the medium term. With a 20- to 30-percent standard deviation, the effects appearing three years after treatment are relatively large. Mechanisms such as improvements in child behavior are further explored.
1 Introduction
Economists extensively evaluate programs focusing directly on fostering cognitive skills or the socio-emotional behavior of children. In addition to pure day care programs, these are programs combining center care with home visiting components. The programs combine a focus on children with components directly addressing parenting skills (e.g., Barnett 2011 or Heckman et al. 2010). Besides these programs, there are other early childhood intervention programs that solely address parents, with the goal of improving child development via changing interactions between parents and children. These are mainly home visitation programs or training programs for parents (for a summary of these studies, see e.g., Heckman and Mosso 2014). Although these programs address parents, in particular mothers, it is remarkable that there is little evidence in the economic literature regarding how these programs affect parental, specifically maternal, well-being. This is very different in other social sciences, which have evaluated such programs more intensively (see Section 2). The focus on parental, specifically maternal, well-being is important for several reasons. First, the well-being of mothers is interesting as a well-being measure per se. Second, the well-being of mothers improves child development (e.g., Berger and Spiess 2011; Dahlen 2016). Moreover, maternal well-being influences other important maternal outcomes, such as maternal labor supply and fertility (e.g., Sandner 2019).
The question of how an early childhood intervention program, namely a universal light-touch parent-training intervention, affects maternal family well-being is the focus of this paper. We use data from a randomized controlled trial (RCT) that provided the intervention to a group of non-disadvantaged parents. The parents had children from 2.6 to 6 years old, and the program was free of charge to participants. All families received the intervention voluntarily. More specifically, we evaluate how one particular parenting program – the Triple P (Positive Parenting Program) – affects maternal family well-being. Triple P is a multilevel parenting and family support strategy designed to reduce the prevalence of behavioral and emotional problems in children. From an economic perspective, it aims at increasing parental investments that might be associated with parental well-being. Potential mechanisms for an increase in parental well-being due to parenting training programs might be at least threefold (see also 5.2): One direct channel could be that parenting training changes parental abilities and skills, which leads to changes in parental behavior and parenting quality. This might result in an increasing sense of well-being as parents realize that their parenting quality has improved. An indirect channel could be that the training changes child behavior due to changes in parental skills, subsequently increasing parental well-being as parents’ utility increases due to improvements in child behavior. These mechanisms are covered, for instance, in an early model by Belsky (1984). A third channel might be the increasing social support mothers receive through the program, resulting in a more or less immediate increase in well-being. While the first and third mechanisms might result in short-term effects, the second might need some time to develop as changes in child behavior do not occur immediately and the transmission to maternal family well-being might take some time. Independent of the mechanisms, we argue that potential improvements in maternal family well-being could be an additional benefit, improving the cost-efficiency of the program, even though the program’s ultimate goal is to improve child outcomes.
One contribution of our paper is the analysis of a parent-training intervention based on a sample of non-disadvantaged mothers, whose well-being in terms of family life is already relatively high. Many other studies, especially in the economic literature, focus on more disadvantaged families (e.g., Heckman and Mosso 2014). The focus on a relatively advantaged group allows for analyzing the effectiveness of such programs on a group that is easy to address. Moreover, if it is a political goal to use a universal approach, which addresses more and less disadvantaged families to avoid stigmatization (see also Doyle et al. 2017), this analysis gives further evidence of whether such an approach is effective. We focus on the causal identification of such a program for subjective satisfaction as a measure for well-being. This is an approach widely used in the economic literature (e.g., Stutzer and Frey 2010).[1] We are able to address both potential short- and medium-term effects. Further, we are able to measure the effect of the provision of the program and the actual treatment, a rarely used approach for this type of intervention study (for an exception, see e.g., Kim et al. 2018). Our results show that the parenting training program has no short-term effects but has medium-term effects on the well-being of non-disadvantaged mothers. Existing studies primarily show effects for disadvantaged mothers.
Our results are robust to applying other specifications. Moreover, our analyses of mechanisms indicate that changes in child behavior or parental skills might be the underlying mechanism. We show this for mothers in Germany, a country without a long tradition of parental programs. Germany provides a considerably different context than other countries where parenting programs exist and are analyzed more frequently, such as the US (see Sanders et al. 2014 for an overview) or low- and middle-income countries (see, e.g., Nahar et al. 2015).
2 Previous Research
The literature covering studies on the effects of home visitation programs and exclusive parenting programs on parental well-being is not large. The literature on home visiting programs focuses mainly on maternal depression as a specific and extreme measure of well-being. In these studies, the effects are modest, as summarized in the review by Ammerman et al. (2010).[2] Only a small number of studies investigate the effects of parenting programs on maternal family well-being as a more general measure. Notable examples of such studies analyze the Infant Health and Development Program (IHDP; Brooks-Gunn et al. 1994; Klebanov, Brooks-Gunn, and McCormick, 2001) and the Nurse-Family Partnership Program (NFP; Olds 2006). Klebanov et al. (2001), for instance, analyze a randomized controlled trial of the IHDP with respect to maternal well-being. They provide an overall measure for well-being that includes aspects of mental health as well as general life satisfaction. Using US data, they find that, overall, the program improved maternal well-being, especially for mothers without a high school degree. The evaluation of the NFP program by Olds (2006), using a randomized controlled trial, finds improvements for mothers through reduced dependence on public assistance. However, he does not analyze well-being measures explicitly. Doyle et al. (2017) evaluate the “Preparing for Life” early childhood intervention program in Ireland. The treatment group was also invited to participate in an additional parenting course, namely the Triple P program, when their children were between two and three years old. They focus on disadvantaged families. Their findings show improvements in experienced positive well-being, but not in subjective well-being.
The three closest studies to ours are Lindsay, Strand, and Davis (2011), Sandner et al. (2018), and Sandner (2019). The study by Lindsay et al. (2011) is similar in that it evaluates parenting programs (Incredible Years, Triple P, and “Strengthening families, strengthening communities”) specifically for a European country (the United Kingdom), but it differs in that it looks at overall well-being. Although, in their measure for well-being, they include maternal life satisfaction, they do not separately report the effects of the program on this measure. Furthermore, their study is not a randomized controlled trial; rather, it describes differences between parenting programs. Their analyses show large improvements in well-being from before to after participation in both Triple P and Incredible Years, but without comparisons to a control group. Moreover, they focus only on short-term outcomes. Sandner’s (2019) study is similar to our study in that it looks at Germany and uses an RCT. However, he evaluates a broader home visitation program, namely the “Pro-Kind program.” He analyses only a sample of disadvantaged parents, as the program is explicitly targeted toward this group of mothers. He finds evidence of improved maternal well-being. He uses various satisfaction measures to analyze well-being as a mediator of fertility changes induced by the analyzed intervention.[3] In an earlier study, Sandner et al. (2018) analyze the effect of the same home visitation program on maternal mental health. They find positive effects on some maternal mental health outcomes, such as reduced depression reported in their survey data by 11 percentage points and reduced prescriptions of psycholeptics recorded in administrative data by seven percentage points.
The parental program we analyze, the Triple P program, focuses on providing information that improves parenting skills with respect to handling child behavior and reducing parental stress. In this sense, it directly aims at improving parental well-being. Existing psychological studies analyze the effects of Triple P: meta-analyses by Nowak and Heinrich (2000), Sanders et al. (2014), and Wilson et al. (2012) report positive effects of Triple P on outcomes such as parenting style, parenting efficacy, and parental adjustment and relationships. Although these are related to parental well-being, the outcomes they address could be results and drivers of it (e.g., Belsky 1984). None of these studies explicitly focuses on maternal family well-being, which is our approach. There are more recent Triple P studies not covered in the aforementioned summaries, including Heinrichs, Kliem, and Hahlweg (2014), Kim et al. (2018), and Hahlweg and Schulz (2019). However, these all focus on child outcomes. Further, almost all studies – with the exception of the most recent ones – do not analyze outcomes beyond one year after the intervention and, thus, cannot measure medium-term effects. We focus on parental well-being measures up to three years after the intervention, which allows us to observe potential fade-out effects or sleeper effects that might occur due to changes in child behavior that might take some time to develop.
Next, we describe the program we analyze, present the data, and give some descriptive evidence. As the program is evaluated in an RCT setting, we look at the effect of an intervention on maternal family well-being.
3 Intervention, Data, and Descriptive Evidence
3.1 Intervention
Aimed at teaching parents how to engage with their children, the Triple P program can be administered at five different intensities, referred to as levels (Sanders 1999, 2012). The first two levels consist of broadly spreading information through videos and leaflets. Level three includes group training, but with only a narrow focus on parenting skills, whereas level four broadens the focus to include general improvements to the home environment. Level five is an intensive family intervention resembling, and going beyond, the aforementioned home visitation programs.
The intervention we analyze covers level four of the Triple P program. It lasted four weeks and comprised four weekly training sessions, each lasting 2 h. Thus, the program took a total of 8 h, plus the time for telephone follow-ups. The parent training took place in group settings with an average of six parents and with four telephone follow-ups during the program. It included video lectures as well as role-playing to learn how to handle difficult situations, under the supervision of a trainer. Our treatment was conducted in the rooms of the day care centers that the child of the participating parents attended.
3.2 Data
For our analysis, we use data from a unique intervention study (the so-called Projekt Zukunft Familie 1- ZF1,[4]Heinrichs, Krüger, and Guse 2006b) of Triple P in Germany. In this study, a randomized control trial (RCT) was carried out in one German city in 2001.[5] The participants were recruited from day care centers in a middle-class neighborhood. Due to resource constraints, 17 of 23 day care centers showing interest in the study were selected randomly to participate. In these centers, all parents were eligible to participate in the program, as the program is intended to be a universal prevention measure. Of 915 eligible families in the 17 selected day care centers, 282 agreed to participate in the study.[6] As shown by Heinrichs et al. (2005), participation was related to the socioeconomic status (SES) of the family: low SES families were less likely to participate. After two families moved away, the parents were told to which group they had been allocated, either the treatment group or the control group. Randomization in the treatment and control groups took place at the day care center level, with a 66 percent chance of a center being in the treatment group.[7] For a more detailed description of the recruitment and randomization procedures, see Appendix A. After this random allocation to treatment and control groups, 42 families from the treatment group decided to skip the intervention but agreed to participate in all follow-up surveys. Overall, the data includes 280 families of children between 2.6 and 6 years of age. All the children attended day care centers at the beginning of the study, and all parents spoke German. The field experiment was conducted with 186 families in the treatment group and 94 families in the control group. In most cases, only the mother attended the program (only 6 percent of fathers in two-parent households participated directly in the program). Almost 90 percent of the intervention group parents (those remaining in the treatment group) participated in at least three out of the four Triple P sessions. Single parents are excluded from our analyses, as differential effects of parenting programs are expected for them (Heinrichs et al. 2009). For instance, the stability of their “status” is much lower (e.g., they find new partners, and separate again). The status stability of partnered women was much higher. Thus, a separate analysis would be needed for them, but the sample size of single parents is too small for this (the sample of 280 includes 61 single mothers).
Although the entire sample was relatively large compared to other intervention studies, the interpretation of the results must keep in mind that the later analysis lacks statistical power due to the clustering of standard errors on the center level. Nevertheless, clustering on the center level allows us to take into account that the randomization took place at the day care center level.
Panel attrition of the remaining sample was low: Of the 219 coupled mothers who participated in the study, 206 still answered the questionnaire three years later: an attrition rate of 6 percent. All subsequent analyses use the sample of mothers for whom information is available for the whole period.[8]
3.3 Outcomes and Descriptives
3.3.1 Main Outcome
We use the satisfaction of the mother with her family life as our measure for maternal family well-being. The mothers were asked to rate their satisfaction with family life on a Likert-scale going from 1 (unsatisfied) to 5 (very satisfied).[9] More specifically, we analyze the differences between pre-treatment satisfaction with family life and measurements of it at four different points in time following the treatment. We use this satisfaction variable for three reasons: First, Triple P aims at improving parent-child interactions and, thus, changes in family life satisfaction are reasonable due to various mechanisms, among them improvements in child behavior (see the discussion on mechanisms). Second, this is the only maternal satisfaction variable available to us. Furthermore, Schober and Stahl (2016), for instance, show that satisfaction with family life is a well-being measure that is more affected by early childhood programs than another, often-used measure, overall life satisfaction. Nevertheless, family well-being is a subjective satisfaction measure that correlates highly with other well-being measures. We show this for a sample similar to that of our study: a subsample of a representative German panel data set, namely, the German Socio-Economic Panel (SOEP) Study (Goebel et al. 2019) (Table B-1), which covers various well-being measures. As shown in Appendix B, family well-being is highly positively correlated with the satisfaction of having friends, life overall, housing, and even household income[10] (Table B-2). There is a clear positive relationship for each of the different satisfaction measures. Plots in Figure B-1 show that having a low or high score on satisfaction with family life generally means a low or high score on all other satisfaction measures and satisfaction with life overall.
On average, satisfaction with family life, the well-being measure in this study, is relatively high in our sample from the very beginning (4.26, see Table 1, last row, column 2). We follow the practice in the well-being literature and assume the satisfaction variable is on a cardinal scale.[11] We use standardized measures of the well-being measure: Differences of well-being are Z-standardized for each point in time such that coefficients of regression models correspond to differences in terms of standard deviations.
Descriptive statistics of different samples (pre-treatment).
| Full sample (1) | Estimation sample (2) | |
|---|---|---|
| Child age (in years) | 4.06 | 4.00 |
| (1.02) | (0.98) | |
| Child female (%) | 48.57 | 47.09 |
| (50.07) | (50.04) | |
| Number of siblings | 1.09 | 1.09 |
| (0.94) | (0.82) | |
| Mother cohabiting (%) | 10.50 | 9.71 |
| (30.73) | (29.68) | |
| HH income above 1,500€ (%) | 65.00 | 79.61 |
| (47.78) | (40.39) | |
| Mother’s age (in years) | 35.23 | 35.60 |
| (4.95) | (4.26) | |
| Mother German (%) | 96.43 | 97.57 |
| (18.59) | (15.43) | |
| Mother low school degree (%) | 11.07 | 6.31 |
| (31.43) | (24.37) | |
| Mother medium school degree (%) | 34.64 | 33.98 |
| (47.67) | (47.48) | |
| Mother high school degree (%) | 54.29 | 59.71 |
| (49.91) | (49.17) | |
| Mother no tertiary degree (%) | 12.86 | 7.28 |
| (33.53) | (26.05) | |
| Mother vocational training (%) | 53.57 | 54.37 |
| (49.96) | (49.93) | |
| Mother college degree (%) | 33.57 | 38.35 |
| (47.31) | (48.74) | |
| Mother working (%) | 76.79 | 77.18 |
| (42.30) | (42.07) | |
| Pre-treatment satisfaction with family life (5-point scale) | 4.21 | 4.26 |
| (0.81) | (0.75) | |
| N | 280 | 206 |
Notes: Means and Standard deviations in parentheses.
Source: Projekt Zukunft Familie 1 – ZF1.
3.3.2 Other Outcomes
In order to obtain a more comprehensive view of the mechanisms of the influence of Triple P on maternal family well-being, we analyze two additional outcome measures: First, we consider a variable that measures parenting skills (see Arnold et al. 1993). The study measures parenting skills as strategies and actions concerning the upbringing of children.[12] Second, we consider a child-related outcome measure, the Child Behavior Checklist (CBCL, Achenbach and Rescorla 2000; Döpfner et al. 2014). The CBCL is a widely used and validated scale that measures child behavior. Parents answer items on noticeable behavioral and emotional problems, indicating how frequently these occur. The CBCL can be grouped into two subscales, one on internalizing behavior (for example, displayed through depressive symptoms) and one on externalizing behavior (for example, aggressive behavior toward others). We use this scale as another outcome measure to learn more about the potential indirect channel through which maternal family well-being is improved via child behavior. Sandner and Jungmann (2016) show that mothers’ rating of child behavior is a valid measure in general. However, the concordance of maternal ratings and test results decreased in mothers with multiple risk burdens. As we use a sample of non-disadvantaged mothers, this is of less relevance for our estimations.[13]
3.3.3 Covariates
Our estimations control for various covariates, such as child-, household-, and (mainly) mother-related characteristics, such as education and employment status. Table 1 reports the descriptive statistics of all covariates, which are measured pre-treatment. Children are an average of four years old, the gender ratio is roughly balanced, and children have an average of one sibling. About 65 percent of the mothers live in households with a monthly net income above 1,500 Euro,[14] which can be considered as higher-income households. Additionally, more participants in our study have earned a university entry degree (Abitur in German) than the average population. Overall, the sample covers non-disadvantaged families with a higher socioeconomic status (see also Kim et al. 2018).[15] We show the descriptives for the full sample of 280 mothers and our estimation sample of 206 mothers, excluding single mothers and those with missing variables in some covariates. This table also shows that the full sample and the estimation sample do not differ substantially.
4 Empirical Strategy
Since our data comes from an RCT study, the identification of causal effects is straightforward. The randomized assignment of individuals to either a treatment or control group provides exogenous variation that makes it possible to interpret mean differences as causal. However, we know from the implementation of the RCT that some mothers chose not to take part in the treatment even though they were assigned to the treatment group. Thus, the usual estimations will deliver the intention-to-treat effect (ITT). However, as we are also interested in the treatment effect on compliers only, we further estimate a Local Average Treatment Effect (LATE) using a two-stage least squares estimation. One might also use the term average treatment effect on the treated (ATT) to describe this effect. In the two-stage least squares estimations, the random assignment to the treatment group is used as an instrumental variable (IV). The assignment to the treatment group constitutes a valid instrument as it is uncorrelated with unobserved characteristics of the mothers via the randomization. Therefore, the exogeneity assumption holds for this instrument. At the same time, it is highly correlated with taking up the treatment and, thus, also a relevant instrument (see Angrist 2014; Bloom 1984). Thus, we correct the ITT effects for dilution by non-compliers. In summary, we first measure the effect of providing the intervention and then the effect of participating.
To learn more about control and treatment group differences and the differences between actually treated (compliers) and those not treated (non-compliers), we analyze whether covariates are balanced between the groups. Naturally, this only works for observable characteristics. Table 2 shows the mean differences of observable characteristics between groups after randomization and between those who subsequently took up the treatment and the remaining control group. The table shows that there are two variables for which the randomization did not seem to result in similar means for the treatment and control group: Mothers in the treatment group are statistically significantly more likely to have a college degree and less likely to only have a vocational degree. This is another reason to control for these differences (for the first reason, see above). Furthermore, if we consider the actually treated and the untreated, mothers in the complier group are still less likely to have vocational training but also more likely to have a college degree and more likely to not have a tertiary degree. This indicates that there was likely no significant selection into actual treatment participation based on observable characteristics apart from a slightly higher likelihood of mothers without a tertiary degree opting out of the treatment. Moreover, we use all other covariates in our estimations to further increase the precision of our estimates (see also below).
Observable characteristics for treatment and control group as assigned through randomization (columns one to three) and for participants who were eventually treated or not treated (columns four to six).
| Control group (1) | Treatment group (2) | Difference (1)–(2) (3) | Not treated (4) | Treated (5) | Difference (4)–(5) (6) | |
|---|---|---|---|---|---|---|
| Child age (in years) | 4.07 (0.99) | 3.97 (0.98) | 0.10 | 3.98 (1.06) | 4.01 (0.93) | −0.03 |
| Child female (%) | 42.86 (49.94) | 48.67 (50.15) | −5.81 | 45.68 (50.12) | 48.00 (50.16) | −2.32 |
| Number of siblings | 1.14 (0.94) | 1.07 (0.77) | 0.08 | 1.09 (0.91) | 1.09 (0.75) | 0.00 |
| HH income above 1,500€ (%) | 78.57 (41.40) | 80.00 (40.13) | −1.43 | 81.48 (39.09) | 78.40 (41.32) | 3.08 |
| Mother’s age (in years) | 35.75 (4.01) | 35.54 (4.36) | 0.21 | 35.40 (4.61) | 35.73 (4.02) | −0.33 |
| Mother German (%) | 100.00 (0.00) | 96.67 (18.01) | 3.33 | 98.77 (11.11) | 96.80 (17.67) | 1.97 |
| Mother low school degree (%) | 5.36 (22.72) | 6.67 (25.03) | −1.31 | 4.94 (21.80) | 7.20 (25.95) | −2.26 |
| Mother medium school degree (%) | 28.57 (45.58) | 36.00 (48.16) | −7.43 | 30.86 (46.48) | 36.00 (48.19) | −5.14 |
| Mother high school degree (%) | 66.07 (47.78) | 57.33 (49.62) | 8.74 | 64.20 (48.24) | 56.80 (49.73) | 7.40 |
| Mother no tertiary degree (%) | 8.93 (28.77) | 6.67 (25.03) | 2.26 | 11.11 (31.62) | 4.80 (21.46) | 6.31* |
| Mother vocational training (%) | 41.07 (49.64) | 59.33 (49.29) | −18.26** | 43.21 (49.85) | 61.60 (48.83) | −18.39*** |
| Mother college degree (%) | 50.00 (50.45) | 34.00 (47.53) | 16.00** | 45.68 (50.12) | 33.60 (47.42) | 12.08* |
| Mother working (%) | 80.36 (40.09) | 76.00 (42.85) | 4.36 | 75.31 (43.39) | 78.40 (41.32) | −3.09 |
| Pre-treatment satisfaction with family life (5-point scale) | 4.27 (0.67) | 4.25 (0.78) | 0.01 | 4.28 (0.73) | 4.24 (0.77) | 0.04 |
| N | 206 | 206 |
Notes: The table can be read as follows: Column one shows means of characteristics for mothers who were assigned to the control group, column two those who were assigned to the treatment group. Column three shows differences between means. Column four shows means of characteristics of mothers who did not receive the treatment (regardless of the outcome of the randomization), column five those of mothers who were treated. Column six again shows differences in means between the last two groups.
Significance levels: *p ≤ 0.1, **p ≤ 0.05, ***p ≤ 0.01 of a t-test between groups.
Source: Projekt Zukunft Familie 1 – ZF1.
In addition to looking at the effects of Triple P on maternal family well-being at different points in time, we follow the procedure laid out by Anderson (2008): We also consider a summation index of the outcome over all four points in time when the well-being was measured. This can be considered as a robustness check. The summation index is a weighted average generated by predictions from a generalized least squares (GLS) model including only a constant. In this way, the weights are set according to the covariance of the outcomes per individual in order to maximize the amount of information. The summation index has an advantage for interpretation as it gives an indication of the overall effectiveness of the parenting program. This procedure reduces the number of tests concerning the overall effectiveness of the treatment to one, making the analyses additionally more robust to multiple testing.
As we cluster our standard errors (see above) and have only a small number of clusters (11 clusters in the treatment group and six in the control group), conventional parametric tests based on an asymptotic distribution to calculate the standard errors would be inappropriate. Thus, we apply a bootstrap t -test using the wild-cluster bootstrap procedure (Cameron and Miller 2015), which allows precise estimation of p-values, even with a small number of clusters. We use the wild-cluster bootstrap method with 999 replications, which maintains the cluster structure in each bootstrap sample (see Cameron and Miller 2015; Davidson and MacKinnon 2010). As we are not aware of evidence suggesting that the Triple P has negative effects on parents (see also chapter 2), we conduct a one-tailed test (see also Kim et al. 2018). However, significance levels are very similar using a two-tailed test.
5 Results
Table 3 shows the treatment effect of Triple P participation on maternal family well-being. In principle, there are four different outcomes, each given by the difference between the well-being measurement at a given point in time and the pre-treatment measurement. First, we present the ITT effects. We regress on the pre-post difference in the well-being, including only the pre-treatment value of well-being (column 1), to control for potential level effects. In a second step, we add all covariates (column 2).
Effects of Triple P on difference in maternal well-being from pre-treatment to later measurements of well-being – sample of more advantaged families.
| Difference in well-being between pre-treatment and measurement… | ITT | ITT | LATE+ |
|---|---|---|---|
| (1) | (2) | (3) | |
| …directly after the treatment | 0.14 | 0.12 | 0.14 |
| (0.27) | (0.25) | (0.25) | |
| …after 1 year | 0.10 | 0.04 | 0.05 |
| (0.53) | (0.38) | (0.39) | |
| …after 2 years | 0.23 | 0.16 | 0.19 |
| (0.16) | (0.19) | (0.18) | |
| …after 3 years | 0.25* | 0.23** | 0.28* |
| (0.10) | (0.05) | (0.06) | |
| Summation index | 0.22 | 0.16 | 0.20 |
| (0.21) | (0.16) | (0.18) | |
| Covariates | No | Yes | Yes |
| N | 206 | 206 | 206 |
Notes: Each cell shows effect sizes from one model including covariates as described in the data section above. + The LATE is estimated using two-stage least squares. The F-Statistic for the first stage is 5562. P-values from single-tailed tests clustered on the center level using 999 bootstrap replications in parentheses.
Significance levels: *p ≤ 0.1, **p ≤ 0.05, ***p ≤ 0.01.
Source: Projekt Zukunft Familie 1 – ZF1.
These estimations show medium-sized positive effects (Cohen 1988), which are only statistically significant for the third year following treatment (columns 1 and 2). If no covariates are included, the effect is only marginally significant at the 10 percent significance level. The effect of the treatment on the summation index is also positive, but, as expected, statistically insignificant. As explained above, these effects have to be interpreted as the effects of Triple P provision. Our two-stage least squares estimations (using the instrumental variable approach with control variables) are presented in column 3 of Table 3. These are the LATE effects for the compliers. Again, we observe an effect only three years after the treatment. Thus, the positive effect of the treatment seems to become most apparent after a few years instead of directly after the treatment.
Overall, the increases in well-being of between 20 and 30 percent of a standard deviation are quite sizeable when compared to results in the literature. For example, Yamauchi (2010) finds an increase in satisfaction with free time by 16 percent of a standard deviation when day care is available but no increase in satisfaction with family life. Schmitz (2020) finds an increase in maternal general life satisfaction of 30 percent of a standard deviation if the child attends day care. However, day care is comparatively more costly than the Triple P intervention. Sandner (2019) finds a 15 percent increase in maternal general life satisfaction after participating in the program analyzed by them, which is a slightly lower effect.[16]
5.1 Robustness
In the main specifications, we use changes in the well-being measures as outcomes in a linear model. Since the original measures come from a five-point ordinal scale, it is a priori unclear if this is a valid approach. Thus, we also estimate ordered probit models as a robustness check for the upper satisfaction levels (Table 4).[17] Doing this, we can show that the effects are mainly driven by an increase to the highest satisfaction level. Much smaller negative effects occur if the satisfaction level of four is used as the outcome measure. Apart from this, the estimations for the highest satisfaction level also show a marginally significant effect after just two years. Moreover, the summation index is significant; it is again verified that the treatment effects come from an increase to the highest satisfaction level, which is partly driven by a decrease in the second-highest satisfaction level.
Estimating well-being using ordinal probit models (predicted probabilities).
| Measure of well-being | Ordered probit | |
|---|---|---|
| Satisfaction scale | ||
| =4 | =5 | |
| …directly after the treatment | −0.02 | 0.06 |
| (0.19) | (0.24) | |
| …after 1 year | −0.01 | 0.03 |
| (0.33) | (0.35) | |
| …after 2 years | −0.04 | 0.10* |
| (0.12) | (0.10) | |
| …after 3 years | −0.05** | 0.13** |
| (0.03) | (0.03) | |
| Summation index | −0.02* | 0.11* |
| (0.06) | (0.06) | |
| N | 206 | 206 |
Notes: Each cell shows effect sizes from one model including covariates as described in the data section above. P-values from two-tailed tests clustered on the center level using 999 bootstrap replications in parentheses.
Significance levels: *p ≤ 0.1, **p ≤ 0.05, ***p ≤ 0.01.
Source: Projekt Zukunft Familie 1 – ZF1.
5.2 Mechanisms
As described above, we further analyze several mechanisms for the change in maternal family well-being. Table 5 gives the results of the two-stage least squares estimations to discuss potential mechanisms, such as changes in parenting skills and changes in child behavior. These are the same estimations as the ones from column 3 of Table 3, but with different outcome variables than maternal well-being. Skills and behavior are recoded so that higher values correspond to better parenting skills and less problematic behavior by the child. Column 1 shows a strong effect of the treatment on parenting skills. This change in the home environment induced by changing parental skills seems to be permanent; even the summation index of this variable is highly significant. Positive effects on child behavior directly after the treatment are smaller and driven by the CBCL internalizing behavior subscale (column 3). These are most pronounced and statistically significant in the three-year follow-up. For the other points in time, effects on the internalizing subscale are also relatively high,[18] but smaller. Thus, our results show that both improved parenting skills and less problematic internalizing behavior of the child could be channels through which the intervention improves maternal family well-being.[19] However, the effect increases over time. This might be one explanation for the medium-term effects on maternal family well-being. Furthermore, it might take some time until the improvements in parenting skills and child behavior materialize and family well-being increases. This might be the explanation for why the effects on well-being become statistically significant only three years after the intervention.
Potential mechanisms of Triple P on Well-being: Parenting skills and Child behavior.
| Difference in well-being between pre-treatment and measurement… | Parenting skills | Child behavior (CBCL) | Internalizing behavior (CBCL) | Externalizing behavior (CBCL) |
|---|---|---|---|---|
| (1) | (2) | (3) | (4) | |
| … directly after the treatment | 0.84*** | 0.16 | 0.26** | 0.11 |
| (0.00) | (0.14) | (0.04) | (0.30) | |
| … after 1 year | 0.73*** | 0.19 | 0.31** | 0.08 |
| (0.00) | (0.15) | (0.02) | (0.35) | |
| … after 2 years | 0.75*** | 0.08† | 0.09† | −0.01† |
| (0.00) | (0.35) | (0.23) | (0.52) | |
| … after 3 years | 0.68*** | 0.19 | 0.37** | 0.10 |
| (0.01) | (0.21) | (0.04) | (0.35) | |
| Summation index | 0.82*** | 0.18 | 0.31** | 0.09 |
| (0.00) | (0.19) | (0.02) | (0.35) | |
| N | 206 | 206 | 206 | 206 |
Notes: Each cell shows LATE effect sizes from one two-stage least squares model including covariates as described in the data section above. P-values from single-tailed tests clustered on the center level using 999 bootstrap replications in parentheses. †: The values in these cells are calculated using a reduced sample size of 200 because of item non-response of six participants on the CBCL items in this wave. Significance levels: *p ≤ 0.1, **p ≤ 0.05, ***p ≤ 0.01.
Source: Projekt Zukunft Familie 1 – ZF1.
To see whether there is more evidence for the assumption that child behavior and parental skills act as mediators, we further calculate the correlation of these variables with maternal family well-being. Table 6 shows that our parenting skill and child behavior measures are indeed highly correlated with our maternal family well-being measure. This underlines that they act as mediators. The size of the correlation shows that the correlation between parenting skills and maternal family well-being becomes larger over time, at least if control variables are included.[20] This again gives further evidence for the results that the significance of the treatment effects appears in the medium-run only and that there are no short-term effects.
Relationship between maternal well-being and child behavior at different points in time.
| Well-being… | Parenting skills | Parenting skills | Child behavior (CBCL) | Child behavior (CBCL) |
|---|---|---|---|---|
| (1) | (2) | (3) | (4) | |
| … before the treatment | −0.22*** | −0.22*** | −0.29*** | −0.31*** |
| (0.00) | (0.00) | (0.00) | (0.00) | |
| … directly after the treatment | −0.31*** | −0.32*** | −0.35*** | −0.40*** |
| (0.00) | (0.00) | (0.00) | (0.00) | |
| … after 1 year | −0.31*** | −0.30*** | −0.33*** | −0.35*** |
| (0.00) | (0.00) | (0.00) | (0.00) | |
| … after 2 years | −0.34*** | −0.37*** | −0.37*** | −0.38*** |
| (0.00) | (0.00) | (0.00) | (0.00) | |
| … after 3 years | −0.37*** | −0.39*** | −0.31*** | −0.32*** |
| (0.00) | (0.00) | (0.00) | (0.00) | |
| Covariates | No | Yes | No | Yes |
| N | 206 | 206 |
Notes: Each cell shows the effect size of one regression with maternal well-being as the dependent and child behavior/parenting skills as the independent variable. P-values from single-tailed tests clustered on the center level using 999 bootstrap replications in parentheses.
Significance levels: *p ≤ 0.1, **p ≤ 0.05, ***p ≤ 0.01.
Source: Projekt Zukunft Familie 1 – ZF1.
Positive short term effects is what we would have expected if our third mechanism applied – direct social support mothers could get from other participants of the training sessions, given either during the training sessions or right after when parents have further interactions with each other. However, we have no data to test this mechanism directly; we would need information to indicate whether participants were actually supported by each other. Given the lack of this data and no short-term effects, we no longer consider the third channel as a viable candidate.
6 Conclusion
In general, there is relatively little literature on the effects of interventions aimed at improving child outcomes on parental well-being. The literature on the evaluation of parenting programs focuses mainly on child outcomes or extreme maternal outcomes such as maternal depression. The majority of the existing literature either finds no effects or it finds limited effects for select groups. Klebanov et al. (2001), for instance, find effects only for less-educated mothers. However, this literature focuses mainly on short-term effects and is typically based on samples of disadvantaged families.
To our knowledge, our study is the first evaluating the Triple P program with respect to maternal family well-being in the medium term, using an RCT to identify the causal effect of this program on those actually treated.[21] Moreover, this is one of the few studies focusing on non-disadvantaged mothers with higher SES. Our results are based on a sample with relatively high satisfaction with family life even before the intervention. We find that the program has no short-term effect on maternal family well-being. However, we find positive medium-term effects on maternal family well-being, mainly an increase to the highest satisfaction level. Our medium-term effect sizes are relatively large. A potential mechanism for this is the improvement in parenting skills and child outcomes, which take time to materialize. As no other maternal well-being measures are available to us, we did an additional analysis using a comparable data set covering other well-being measures. These give us suggestive evidence that Triple P might also have effects on the overall life-satisfaction and other satisfaction measures of more advantaged mothers.
Moreover, unlike many other studies, we measure not only the effects of program provision but also the actual treatment, using an instrumental variable approach and, thus, focus on program compliers. Unlike most parenting program evaluations, this paper uses data from a context, namely Germany, with a universal day care system and an underdeveloped infrastructure of parenting programs. Thus, our results might be transferable to similar environments. However, we are cautious in claiming external validity of the RCT results to the entire population because the intervention excluded non-German-speaking parents and our estimation excludes single parents.
Overall, we find the improvements in maternal family well-being noteworthy, as Triple P is a low-cost intervention yielding comparatively large effects on maternal family well-being. These effects are comparable to the effects of much more costly early childhood interventions, such as universal day care expansion programs (e.g., Schmitz 2020). Moreover, our analysis shows that evaluations of parenting programs that take only child outcomes into account (e.g., Kim et al. 2018) may underestimate the benefits of the program. Improved maternal family well-being has positive consequences for mothers, the children, the family, and society. It might further increase the positive effect on children in future periods, as maternal well-being is shown to improve child outcomes. An increase in maternal family well-being is beneficial for not just the mother but also other family members. Moreover, as mentioned in the introduction, increases in maternal well-being might result in higher maternal employment and higher fertility, two aspects that might be beneficial for aging societies, including most Western industrialized countries.
Thus, an increase in well-being is not just a result of changes in child behavior but also a driver of further improvements in child behavioral outcomes. For policymakers who are interested in increasing the well-being of mothers with young children, this study shows that early childhood interventions addressing parents might be an effective tool.
Acknowledgments
The authors thank Wolfgang Schulz, Marie LeMouel, Jan Marcus, Sophia Schmitz, Sevrin Waights, two anonymous referees, and the editor for their valuable comments on previous versions of this paper. Moreover, we thank participants of the third LEER workshop on Education Economics in Leuven, Belgium, and the 2017 ESPE conference in Glasgow for helpful comments. We also thank Adam Lederer and Celia Speirs for helpful editorial assistance.
Research funding: No additional third party funding.
Availability of data and material: To get more information on data availability, please contact corresponding author.
Code availability: None.
Competing interests: Not applicable
Appendix A: Recruitment procedure of the day care centers and families
The recruitment procedure of our study is described in Heinrichs et al. (2005). First, all potentially eligible day care centers in the city of Braunschweig (N = 33) were contacted. Project staff members were present at day care teacher meetings and explained the project to the preschool staff. Twenty-three day care centers (70 percent) expressed interest in participating in the project. Interested and non-interested centers did not significantly differ in OKS [χ2 (2) = 0.95, p > 0.62, V (Cramer’s statistic) = 0.17]. 17 of these interested day care centers were then randomly selected to participate in the project (due to lack of project manpower) and assigned to one of the two conditions. Families were assigned to the experimental or control group based on day care center affiliation. Centers were randomized (by coin toss) to the two conditions after being matched according to the social structure of their respective neighborhoods. Social structure was determined by an objective day care social structure index (OKS), derived in collaboration with the Census Bureau, that consists of four indices: rate of unemployment, number of families on welfare, number of immigrants, and quality of housing in the particular neighborhood (Bäse 1995).
Appendix B: The relationship between family well-being and other well-being measures
We show the relationship between satisfaction with family life and satisfaction with other areas of life by presenting simple correlations as well as scatter plots based on another data set. Since the Triple P data does not have any other satisfaction measures, we do this using data from the SOEP from 2006, the closest wave to our Triple P data set from 2001. To make the SOEP sample similar to our Triple P sample, we restrict it to mothers with at least one child aged between 2.5 and 6 years and attending day care. We made the further restrictions that the mother is not a single mother and that she is a German citizen. The latter is the most similar restriction we could make to the SOEP data reflecting the German-language proficiency restriction made for the Triple P sample. Table B-1 presents descriptive statistics for comparison to the Triple P sample. We include single mothers and non-Germans for the descriptive table only.
The correlation coefficients in Table B-2 show that satisfaction with family life is correlated with satisfaction in other areas of life. The coefficient of 0.5 shows it is highly correlated with overall life satisfaction. Figure B-1 plots mean values, the interquartile range, which is the range between the 25th and 75th percentile on the satisfaction measure, and a linear trend for different satisfaction measures by score on satisfaction with family life. There is a clear positive relationship for each of the different satisfaction measures. The plots show that having a low or high score on satisfaction with family life generally means a low or high score on other satisfaction measures and satisfaction with life overall.
Descriptive Statistics of SOEP 2006 sample.
| Variable | N | Mean | Std.Dev. | Min | Max |
|---|---|---|---|---|---|
| Child age (in years) | 1016 | 4.80 | 1.11 | 2.5 | 6.92 |
| Child female (%) | 1016 | 47.5 | 49.9 | 0 | 100 |
| Number of siblings | 1016 | 0.992 | 0.832 | 0 | 6 |
| HH net income above 1,500 EUR (%) | 960 | 85 | 35.7 | 0 | 100 |
| Mother’s age (in years) | 1000 | 34.6 | 5.3 | 20 | 52 |
| Mother German (%) | 1016 | 95.2 | 21.2 | 0 | 100 |
| Mother low school degree (%) | 1016 | 18.6 | 38.9 | 0 | 100 |
| Mother medium school degree (%) | 1016 | 45.4 | 49.8 | 0 | 100 |
| Mother high school degree (%) | 1016 | 29.3 | 45. | 0 | 100 |
| Mother vocational training (%) | 1016 | 70.3 | 45.6 | 0 | 100 |
| Mother college degree (%) | 1016 | 22.6 | 41.8 | 0 | 100 |
| Mother working (%) | 1016 | 55.5 | 49.7 | 0 | 100 |
Notes: Descriptive statistics for SOEP 2006 sample used for comparing different satisfaction measures. Restricted to mothers of at least one child aged between 2.5 and 6 years and attending day care, where mother is not a single mother and is a German citizen. Source: SOEP, sample 2006.
Correlation between satisfaction with family life and other satisfaction measures.
| Satisfaction with: | Family life |
|---|---|
| (1) Family life | 1.000 |
| (2) Life overall | 0.499 |
| (3) Health | 0.346 |
| (4) Work | 0.292 |
| (5) Housework | 0.369 |
| (6) Household income | 0.408 |
| (7) Personal income | 0.326 |
| (8) Housing | 0.428 |
| (9) Leisure | 0.356 |
| (10) Childcare | 0.296 |
| (11) Friends | 0.620 |
Notes: Table reports simple correlations coefficients between reported satisfaction with family life and reported satisfaction with other areas of life.
Source: SOEP, sample 2006.
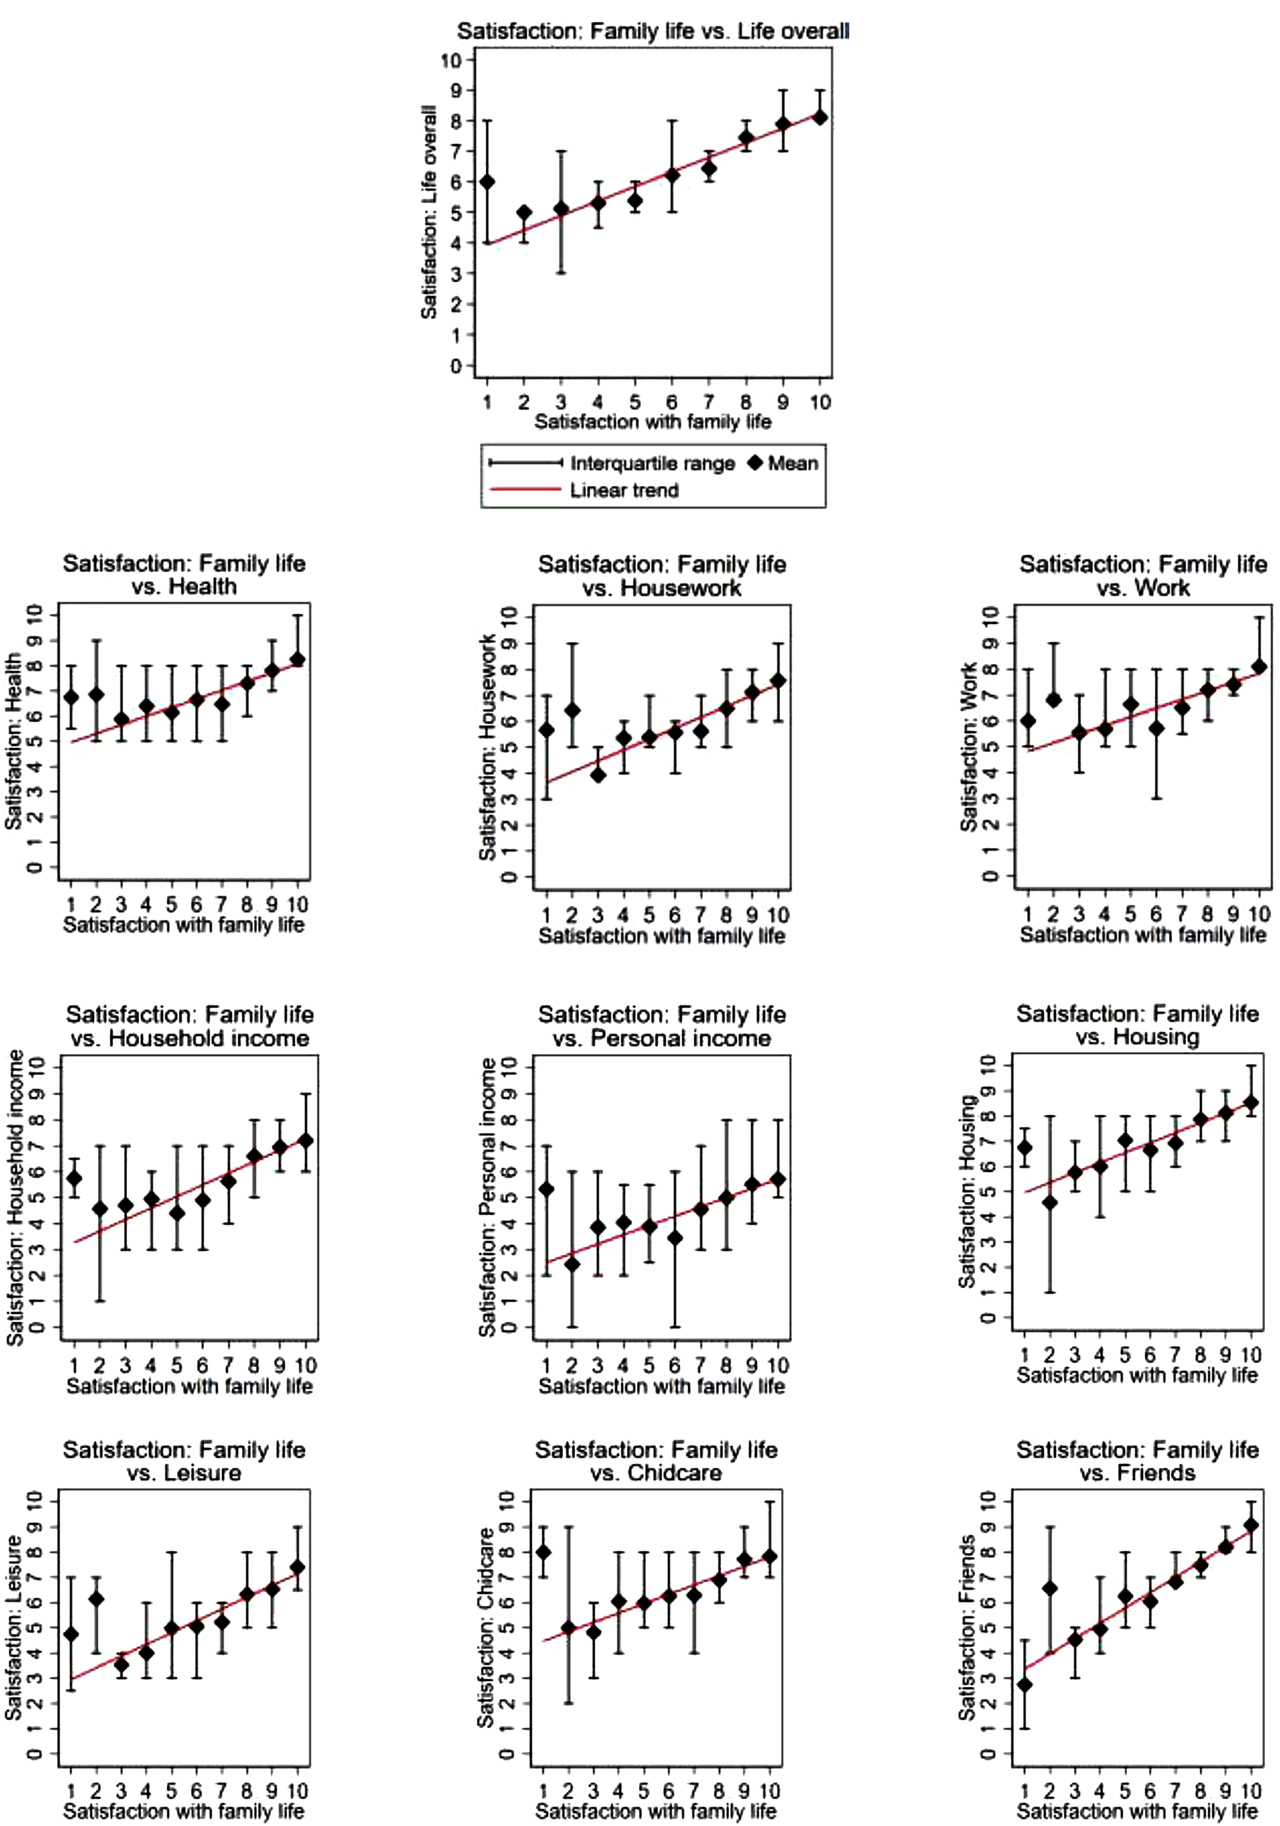
Satisfaction with family life plotted against satisfaction with life overall and other areas of satisfaction.
Notes: Figures plot mean values for other satisfaction measures by score on satisfaction with family life and interquartile range, which is the range between the 25th and 75th percentile on the satisfaction measure, and linear trends (red line).
Source: SOEP, sample 2006.
References
Achenbach, T. M., and L. A. Rescorla. 2000. Manual for the ASEBA Preschool Forms & Profiles: An Integrated System of Multi-Informant Assessment; Child Behavior Checklist for Ages 1 1/2-5; Language Development Survey; Caregiver-Teacher Report Form. University of Vermont.Search in Google Scholar
Ammerman, R. T., F. W. Putnam, N. R. Bosse, A. R. Teeters, and J. B. van Ginkel. 2010. “Maternal Depression in Home Visitation: A Systematic Review.” Aggression and Violent Behavior 15 (3): 191–200, https://doi.org/10.1016/j.avb.2009.12.002.Search in Google Scholar
Anderson, M. L. 2008. “Multiple Inference and Gender Differences in the Effects of Early Intervention: A Reevaluation of the Abecedarian, Perry Preschool, and Early Training Projects.” Journal of the American Statistical Association 103 (484): 1481–95, https://doi.org/10.1198/016214508000000841.Search in Google Scholar
Angrist, J. 2014. Instrumental Variables (Take 2): Causal Effects in a Heterogeneous World. https://ocw.mit.edu/courses/economics/14-387-applied-econometrics-mostly-harmless-big-data-fall-2014/lecture-and-recitation-notes/MIT14_387F14_Causaleffects.pdf (Download May 2019).Search in Google Scholar
Arnold, D. S., S. G. O’Leary, L. S. Wolff, and M. M. Acker. 1993. “The Parenting Scale: A Measure of Dysfunctional Parenting in Discipline Situations.” Psychological Assessment 5 (2): 131–44, https://doi.org/10.1037/1040-3590.5.2.137.Search in Google Scholar
Barnett, W. S. 2011. “Effectiveness of Early Educational Intervention.” Science 333 (6045): 975–8, https://doi.org/10.1126/science.1204534.Search in Google Scholar
Bäse, B. 1995. Die sozial-räumliche Gliederung der Stadt Braunschweig. Methodik und Durchführung sozial-geographischer Analyse im städtischen Wohnumfeld auf der Grundlage des Zensus 1987. Technische Universität Braunschweig.Search in Google Scholar
Belsky, J. 1984. “The Determinants of Parenting: A Process Model.” Child Development 55: 83–96, https://doi.org/10.2307/1129836.Search in Google Scholar
Berger, E. M., and C. K. Spiess. 2011. “Maternal Life Satisfaction and Child Outcomes: Are They Related?.” Journal of Economic Psychology 32 (1): 142–58, https://doi.org/10.1016/j.joep.2010.10.001.Search in Google Scholar
Bloom, H. S. 1984. “Estimating the Effect of Job-Training Programs, Using Longitudinal Data: Ashenfelters Findings Reconsidered.” Journal of Human Resources 19: 544–56, https://doi.org/10.2307/145947.Search in Google Scholar
Brooks-Gunn, J., M. C. McCormick, S. Shapiro, A. A. Benasich, and G. W. Black. 1994. “The Effects of Early Education Intervention on Maternal Employment, Public Assistance, and Health Insurance: The Infant Health and Development Program.” American Journal of Public Health 84 (6): 924–31, https://doi.org/10.2105/ajph.84.6.924.Search in Google Scholar
Cameron, A. C., and D. L. Miller. 2015. “A Practitioner’s Guide to Cluster-Robust Inference.” Journal of Human Resources 50 (2): 317–72, https://doi.org/10.3368/jhr.50.2.484.Search in Google Scholar
Cohen, J. 1988. Statistical Power Analysis for the Behavioral Sciences, 2nd ed. Hillsdale: Lawrence Earlbaum Associates.Search in Google Scholar
Conti, G., J. J. Heckman, and R. Pinto. 2016. “The Effects of Two Influential Early Childhood Interventions on Health and Healthy Behaviour.” The Economic Journal 126 (596): F28–65, https://doi.org/10.1111/ecoj.12420.Search in Google Scholar
Cortes, K. E., H. Fricke, S. Loeb, and D. S. Song. 2018. Too Little or Too Much? Actionable Advice in an Early-Childhood Text Messaging Experiment. IZA Discussion Paper No. 1166.10.3386/w24827Search in Google Scholar
Dahlen, H. M. 2016. “The Impact of Maternal Depression on Child Academic and Socioemotional Outcomes.” Economics of Education Review 52: 77–90, https://doi.org/10.1016/j.econedurev.2016.01.006.Search in Google Scholar
Davidson, R., and J. G. MacKinnon. 2010. “Wild Bootstrap Tests for IV Regression.” Journal of Business & Economic Statistics 28 (1): 128–44, https://doi.org/10.1198/jbes.2009.07221.Search in Google Scholar
Diener, E., R. E. Lucas, and S. Oishi. 2002. “Subjective Well-Being: The Science of Happiness and Life Satisfaction.” In Handbook of Positive Psychology, edited by S. J. Lopez, and C. R. Snyder. Oxford University Press.10.1093/oso/9780195135336.003.0005Search in Google Scholar
Döpfner, M., J. Plück, and C. Kinnen, and Arbeitsgruppe Deutsche Child Behavior Checklist. 2014. CBCL/6-18R, TRF/6-18R, YSR/11-18R. Deutsche Schulalter-Formen der Child Behavior Checklist von Thomas M. Achenbach. Elternfragebogen über das Verhalten von Kindern und Jugendlichen (CBCL/6-18R), Lehrerfragebogen über das Verhalten von Kindern und Jugendlichen (TRF/6-18R), Fragebogen für Jugendliche (YSR/11-18R). Göttingen: Hogrefe.Search in Google Scholar
Doyle, O., L. Delaney, C. O’Farrelly, N. Fitzpatrick, and M. Daly. 2017. “Can Early Intervention Improve Maternal Well-Being? Evidence from a Randomized Controlled Trial.” PLoS One 12 (1), https://doi.org/10.1371/journal.pone.0169829.Search in Google Scholar
Erdfelder, E., F. Faul, and A. Bucher. 1996. “GPOWER: A General Power Analysis Program.” Behavior Research Methods, Instruments, & Computers 28: 1–11, https://doi.org/10.3758/bf03203630.Search in Google Scholar
Goebel, J., M. M. Grabka, S. Liebig, M. Kroh, D. Richter, C. Schröder, and J. Schupp. 2019. “The German Socio-Economic Panel Study (SOEP).” Jahrbücher für Nationalökonomie und Statistik/Journal of Economics and Statistics 239 (2): 345–60, https://doi.org/10.1515/jbnst-2018-0022.Search in Google Scholar
Hahlweg, K., N. Heinrichs, S. Naumann, A. Kuschel, and H. Bertram. 2010. “Two-year Outcome of Universal Prevention through a Positive Parenting Program: Is it Worth the Effort?” Child and Adolescent Psychiatry and Mental Health 4: 14–27, https://doi.org/10.1186/1753-2000-4-14.Search in Google Scholar
Hahlweg, K., and W. Schulz. 2019. Universal Prevention of Child Behavior Disorders by the TRIPLE P-Parent Training: 10-Year Effectiveness from Mothers’, Fathers’ and Adolescents’ Perspectives. Braunschweig: Universitätsbibliothek Braunschweig. https://doi.org/10.24355/dbbs.084-201901071038-0.Search in Google Scholar
Heckman, J. J., and S. Mosso. 2014. “The Economics of Human Development and Social Mobility.” Annual Review of Economics 6: 689–733, https://doi.org/10.1146/annurev-economics-080213-040753.Search in Google Scholar
Heckman, J. J., S. H. Moon, R. Pinto, P. A. Savelyev, and A. Yavitz. 2010. “The Rate of Return to the HighScope Perry Preschool Program.” Journal of Public Economics 94: 128, https://doi.org/10.1016/j.jpubeco.2009.11.001.Search in Google Scholar
Heinrichs, N., H. Bertram, A. Kuschel, and K. Hahlweg. 2005. “Parent Recruitment and Retention in a Universal Prevention Program for Child Behavior and Emotional Problems: Barriers to Research and Program Participation.” Prevention Science 6: 275–86, https://doi.org/10.1007/s11121-005-0006-1.Search in Google Scholar
Heinrichs, N., K. Hahlweg, H. Bertram, A. Kuschel, S. Naumann, and S. Harstick. 2006a. “Die langfristige Wirksamkeit eines Elterntrainings zur universellen Prävention kindlicher Verhaltensstörungen.” Zeitschrift für Klinische Psychologie und Psychotherapie 35 (2): 82–96, https://doi.org/10.1026/1616-3443.35.2.82.Search in Google Scholar
Heinrichs, N., S. Kliem, and K. Hahlweg. 2014. “Four-year Follow-Up of a Randomized Controlled Trial of Triple P Group for Parent and Child Outcomes.” Prevention Science 15 (2): 233–45, https://doi.org/10.1007/s11121-012-0358-2.Search in Google Scholar
Heinrichs, N., S. Krüger, and U. Guse. 2006b. “Eine experimentelle Studie zum Einfluss von Anreizen auf die Rekrutierung und Effektivität eines präventiven Elterntrainings.” Zeitschrift für Klinische Psychologie und Psychotherapie 35: 72–86, https://doi.org/10.1026/1616-3443.35.2.97.Search in Google Scholar
Henrich, G., and P. Herschbach. 2000. “Fragen zur Lebenszufriedenheit (FLZ-M).” In Lebensqualität und Gesundheitsökonomie in der Medizin. Konzepte, Methoden, Anwendung, edited by U. Ravens-Sieberer, A. Cieza, M. Bullinger, N. von Steinbuechel, and E. Poeppel. Landsberg: ecomed.Search in Google Scholar
Johnson, Z., B. Molloy, E. Scallan, P. Fitzpatrick, B. Rooney, T. Keegan, and P. Byrne. 2000. “Community Mothers Programme—Seven Year Follow-Up of a Randomized Controlled Trial of Non-professional Intervention in Parenting.” Journal of Public Health 22 (3): 337–42, https://doi.org/10.1093/pubmed/22.3.337.Search in Google Scholar
Kassenboehmer, S. C., and J. P. Haisken-De New. 2009. “You’re Fired! the Negative Effect of Entry Unemployment on Life Satisfaction.” The Economic Journal 119 (546): 448–62, https://doi.org/10.1111/j.1468-0297.2008.02246.x.Search in Google Scholar
Kim, J. H., W. Schulz, T. Zimmermann, and K. Hahlweg. 2018. “Parent-child Interactions and Child Outcomes: Evidence from Randomized Intervention.” Labour Economics 54: 152–71, https://doi.org/10.1016/j.labeco.2018.08.003.Search in Google Scholar
Klebanov, P. K., J. Brooks-Gunn, and M. C. McCormick. 2001. “Maternal Coping Strategies and Emotional Distress: Results of an Early Intervention Program for Low Birth Weight Young Children.” Developmental Psychology 37 (5): 654, https://doi.org/10.1037/0012-1649.37.5.654.Search in Google Scholar
Lindsay, G., S. Strand, and H. Davis. 2011. “A Comparison of the Effectiveness of Three Parenting Programmes in Improving Parenting Skills, Parent Mental-Well Being and Children’s Behavior when Implemented on a Large Scale in Community Settings in 18 English Local Authorities: The Parenting Early Intervention Pathfinder (PEIP).” BMC Public Health 11 (1): 962–75, https://doi.org/10.1186/1471-2458-11-962.Search in Google Scholar
Nahar, B., I. Hossain, J. Hamadani, T. Ahmed, S. Grantham-McGregor, and L. Persson. 2015. “Effect of a Food Supplementation and Psychosocial Stimulation Trial for Severely Malnourished Children on the Level of Maternal Depressive Symptoms in Bangladesh.” Child: Care, Health and Development 41 (3): 483–93, https://doi.org/10.1111/cch.12176.Search in Google Scholar
Naumann, S., H. Bertram, A. Kuschel, N. Heinrichs, K. Hahlweg, and M. Döpfner. 2010. “Der Erziehungsfragebogen (EFB). Ein Fragebogen zur Erfassung elterlicher Verhaltenstendenzen in schwierigen Erziehungssituationen.” Diagnostica 56 (3): 144–57, https://doi.org/10.1026/0012-1924/a000018.Search in Google Scholar
Nowak, C., and N. Heinrichs. 2008. “A Comprehensive Meta-Analysis of Triple P-Positive Parenting Program Using Hierarchical Linear Modeling: Effectiveness and Moderating Variables.” Clinical Child and Family Psychology Review 11 (3): 114, https://doi.org/10.1007/s10567-008-0033-0.Search in Google Scholar
Olds, D. L. 2006. “The Nurse-Family Partnership: An Evidence-Based Preventive Intervention.” Infant Mental Health Journal 27 (1): 5–25, https://doi.org/10.1002/imhj.20077.Search in Google Scholar
Sanders, M. R. 1999. “Triple P-Positive Parenting Program: Towards an Empirically Validated Multilevel Parenting and Family Support Strategy for the Prevention of Behavior and Emotional Problems in Children.” Clinical Child and Family Psychology Review 2 (2): 71–90, https://doi.org/10.1023/a:1021843613840.10.1023/A:1021843613840Search in Google Scholar
Sanders, M. R. 2012. “Development, Evaluation, and Multinational Dissemination of the Triple P-Positive Parenting Program.” Annual Review of Clinical Psychology 8: 1–35, https://doi.org/10.1146/annurev-clinpsy-032511-143104.Search in Google Scholar
Sandner, M. 2019. “Effects of Early Childhood Intervention on Fertility and Maternal Employment: Evidence from a Randomized Controlled Trial.” Journal of Health Economics 63: 159–18, https://doi.org/10.1016/j.jhealeco.2018.11.003.Search in Google Scholar
Sandner, M., T. Cornelissen, T. Jungmann, and P. Herrmann. 2018. “Evaluating the Effects of a Home Visiting Programme for At-Risk Mothers during Pregnancy on Mother and Child Health Outcomes.” Journal of Health Economics 58: 269–83, https://doi.org/10.1016/j.jhealeco.2018.02.008.Search in Google Scholar
Sandner, M., and T. Jungmann. 2016. “How Much Can We Trust Maternal Ratings of Early Child Development in Disadvantaged Samples?.” Economics Letters 141: 73–6, https://doi.org/10.1016/j.econlet.2016.01.021.Search in Google Scholar
Sanders, M. R., J. N. Kirby, C. L. Tellegen, and J. J. Day. 2014. “The Triple P-Positive Parenting Program: A Systematic Review and Meta-Analysis of a Multi-Level System of Parenting Support.” Clinical Psychology Review 34 (4): 337–57, https://doi.org/10.1016/j.cpr.2014.04.003.Search in Google Scholar
Schmitz, S. 2020. “The Impact of Publicly Funded Child Care on Parental Well-Being: Evidence from Cut-Off Rules.” European Journal of Population 36: 171–96, https://doi.org/10.1007/s10680-019-09526-z.Search in Google Scholar
Schnitzlein, D. D., and C. Wunder. 2016. “Are We Architects of Our Own Happiness? The Importance of Family Background for Well-Being.” The B.E. Journal of Economic Analysis & Policy 16 (1): 125–49, https://doi.org/10.1515/bejeap-2015-0037.Search in Google Scholar
Schober, P., and J. Stahl. 2016. “Expansion of Full-Day Childcare and Subjective Well-Being of Mothers: Interdependencies with Culture and Resources.” European Sociological Review 32 (5): 593–606, https://doi.org/10.1093/esr/jcw006.Search in Google Scholar
Schroeder, C., and S. Yitzhaki. 2017. “Revisiting the Evidence for Cardinal Treatment of Ordinal Variables.” European Economic Review 92: 337–58, https://doi.org/10.1016/j.euroecorev.2016.12.011.Search in Google Scholar
Stutzer, A., and B. S. Frey. 2010. “Recent Advances in the Economics of Individual Subjective Well-Being.” Social Research: International Quarterly 77 (2): 679–714, https://doi.org/10.2307/40972234.Search in Google Scholar
Wilson, P., R. Rush, S. Hussey, C. Puckering, F. Sim, C. S. Allely, P. Doku, A. Mc-Connachie, and C. Gillberg. 2012. “How Evidence-Based is an ‘Evidence-Based Parenting Program’? A PRISMA Systematic Review and Meta-Analysis of Triple P.” BMC Medicine 10 (1): 130, https://doi.org/10.1186/1741-7015-10-130.Search in Google Scholar
Yamauchi, C. 2010. “The Availability of Child Care Centers, Perceived Search Costs and Parental Life Satisfaction.” Review of Economics of the Household 8 (2): 231–53, https://doi.org/10.1007/s11150-009-9071-8.Search in Google Scholar
© 2020 Georg F. Camehl et al., published by De Gruyter, Berlin/Boston
This work is licensed under the Creative Commons Attribution 4.0 International License.
Articles in the same Issue
- Research Articles
- Erasmus Exchange Program – A Matter of (Relatively) Older Students
- Co-Production in Local Public Service Delivery: The Case of Waste Management
- The Effects of a Parenting Program on Maternal Well-Being: Evidence from a Randomized Controlled Trial
- Letters
- The Impact of Marital Status on Job Finding: A Field Experiment in the Chinese Labor Market
- A Note on the Efficiency Gains from a Refusal to Deal in a Bertrand-Nash Framework
- The Panzar–Rosse H Statistic and Monopoly. Issues on its Use as a Market Power Measure