The Effect of the Second Child on the Anthropometric Outcomes and Nutrition Intake of the First Child: Evidence from the Relaxation of the One-Child Policy in Rural China
-
Cheng Chen
 ,
Shin-Yi Chou
,
Shin-Yi Chou

Abstract
This paper attempts to isolate the actual effect of the second child on the anthropometric outcomes and nutrition intake of the first child in rural China, using an exogenous increase in child quantity due to the relaxation of the One-Child Policy (OCP). We utilize both temporal and geographic variation in the OCP, as families are less likely to have the second child if the OCP in their community is strictly enforced after the birth of their first child. Based on a sample of children aged 6–17 from the 1991–2009 China Health and Nutrition Survey, we find that an increase in the number of children significantly decreases the weight and height of first-born girls, but not first-born boys. The worse anthropometric outcomes could be due to the change in the dietary pattern—compared with the only children, first-born girls in two-child families tend to intake less high-fat and high-protein food (e. g. meats, poultry, and milk).
Acknowledgements
This research uses data from the China Health and Nutrition Survey (CHNS). We thank the National Institute of Nutrition and Food Safety, China Center for Disease Control and Prevention; the Carolina Population Center, University of North Carolina at Chapel Hill; the National Institutes of Health (NIH; R01-HD30880, DK056350, and R01-HD38700); and the Fogarty International Center, NIH, for financial support for the CHNS data collection and analysis files since 1989. We thank those parties, the China-Japan Friendship Hospital, and the Ministry of Health for support for CHNS 2009. We thank two anonymous reviewers, the editor, Mariapia Mendola, and participants at the Lehigh University Economics Department seminar for their helpful comments and suggestions. All errors are our own.
References
Angrist, J. D., Lavy, V., & Schlosser, A. (2010). “Multiple experiments for the causal link between the quantity and quality of children.” Journal of Labor Economics, 28(4), 773–824.10.1086/653830Search in Google Scholar
Becker, G. S. (1960). “An economic analysis of fertility, demographic and economic change in developed countries.” Princeton, NJ: Princeton University Press.Search in Google Scholar
Becker, G. S., & Lewis, H. G. (1973). “On the interaction between quantity and quality of children.” Journal of Political Economy, 81(2), 279–288.10.1086/260166Search in Google Scholar
Becker, G. S., & Tomes, N. (1976). “Children endowments and the quantity and quality of children.” Journal of Political Economy, 84(4), 143–162.10.3386/w0123Search in Google Scholar
Black, S. E., Devereux, P. J., & Salvanes, K. G. (2005). “The more the merrier? The effect of family size and birth order in children’s education.” Quarterly Journal of Economics, 120(2), 669–700.10.1162/0033553053970179Search in Google Scholar
Blake, J. (1981). “Family size and the quality of children.” Demography, 18(4), 421–442.10.2307/2060941Search in Google Scholar
Cole, T. J., J. V. Freeman, and M. A. Preece. (1998). “British 1990 growth reference centiles for weight, height, body mass index and head circumference fitted by maximum penalized likelihood.” Statistics in Medicine, 17(4), 407–429.10.1002/(SICI)1097-0258(19980228)17:4<407::AID-SIM742>3.0.CO;2-LSearch in Google Scholar
Cui, Z., and M. J. Dibley. (2012). “Trends in dietary energy, fat, carbohydrate, and protein intake in Chinese children and adolescents from 1991 to 2009.” British Journal of Nutrition, 108(7), 1292–1299.10.1017/S0007114511006891Search in Google Scholar
Easterlin, R. A. (1969). “Towards a socio-economic theory of fertility: A survey of recent research on economic factors in American fertility.” In S. J. Behrman, L. Corsa, Jr., & R. Freedman (Eds.), Fertility and family planning: A world view (pp. 127–156). Ann Arbor: University of Michigan Press.Search in Google Scholar
Ebenstein, A. (2009). “When is the local average treatment close to the average? Evidence from fertility and labor supply.” Journal of Human Resources, 44(4), 955–975.10.1353/jhr.2009.0005Search in Google Scholar
Ebenstein, A. (2010). “The missing girls of China and the unintended consequences of the One-Child Policy.” Journal of Human Resources, 45(1), 87–115.10.1353/jhr.2010.0003Search in Google Scholar
Ebenstein, A. (2011). “Estimating a dynamic model of sex selection in China.” Demography, 48(2), 783–811.10.1007/s13524-011-0030-7Search in Google Scholar
Gao, Y., Li, L. P., Kim, J. H., Congdon, N., Lau, J., & Griffiths, S. (2010). “The impact of parental migration on health status and health behaviours among left behind adolescent school children in China.” BMC Public Health, 10, 56–65.10.1186/1471-2458-10-56Search in Google Scholar
Gilbert, D. (2002). “The American class structure in an age of growing inequality.” Belmont: Wadsworth Publishing.Search in Google Scholar
Gomes, M. (1984). “Family size and educational attainment in Kenya.” Population and Development Review, 10(4), 647.10.2307/1973285Search in Google Scholar
Goux, D., and E. Maurin. (2005). “The effect of overcrowded housing on children’s performance at school.” Journal of Public Economics, 89(5–6), 797–819.10.1016/j.jpubeco.2004.06.005Search in Google Scholar
Gu, B., Wang, F., Guo, Z., & Zhang, E. (2007). “China’s local and national fertility policies at the end of the twentieth century.” Population and Development Review, 33(1), 129–147.10.1111/j.1728-4457.2007.00161.xSearch in Google Scholar
Hanushek, E. A. (1992). “The trade-off between child quantity and quality.” Journal of Political Economy, 100(1), 84–117.10.1086/261808Search in Google Scholar
Johansson, S., & Nygren, O. (1991). “The missing girls of China: A new demographic account.” Population and Development Review, 17(1), 35–51.10.2307/1972351Search in Google Scholar
Jones-Smith, J., & Popkin, B. M. (2010). “Understanding community context and adult health changes in China: Development of an urbanicity scale.” Social Science & Medicine, 71(8), 1436–1446.10.1016/j.socscimed.2010.07.027Search in Google Scholar
Lee, J. (2008). “Sibling size and investment in children’s education: An Asian instrument.” Journal of Population Economics, 21(4), 855–875.10.1007/s00148-006-0124-5Search in Google Scholar
Li, H., Zhang, J., & Zhu, Y. (2008). “The quantity-quality trade-off of children in a developing country: Identification using Chinese twins.” Demography, 45(1), 223–243.10.1353/dem.2008.0006Search in Google Scholar
Liang, Y., & Gibson, J. (2018). “Do siblings take your food away? Using China’s One-Child Policy to test for child quantity-quality trade-offs.” China Economic Review, 48, 14–26.10.1016/j.chieco.2017.10.006Search in Google Scholar
Liu, H. (2014). “The quality-quantity trade-off: Evidence from the relaxation of China’s One-Child Policy.” Journal of Population Economics, 27(2), 565–602.10.1007/s00148-013-0478-4Search in Google Scholar
Lloyd, C. B. (1994). “Investing in the next generation: The implications of high fertility at the level of the family.” In R. Cassen (Ed.) Population and Development: Old Debates and New Conclusions (pp. 181–202). New Brunswick, NJ: Transaction Publishers.Search in Google Scholar
Meng, X., & Yamauchi, C. (2017). “Children of migrants: The cumulative impact of parental migration on children’s education and health outcomes in China.” Demography, 54(5), 1677–1714.10.1007/s13524-017-0613-zSearch in Google Scholar
Popkin, B. M., G. Keyou, F. Zhai, X. Guo, H. Ma, and N. Zohoori. (1993). “The nutrition transition in China: A cross-sectional analysis.” European Journal of Clinical Nutrition, 47(5), 333–346.Search in Google Scholar
Qian, N. (2013). “Quantity-Quality and the One-Child Policy: The only-child disadvantage in school enrollment in rural China (NBER Working Paper No. 14973).” Cambridge, MA: National Bureau of Economic Research.Search in Google Scholar
Rosenzweig, M. R., & Wolpin, K. I. (1980). “Testing the quantity-quality fertility model: The use of twins as a natural experiment.” Econometrica, 48(1), 227–240.10.2307/1912026Search in Google Scholar
Rosenzweig, M. R., & Zhang, J. (2009). “Do population control policies induce more human capital investment? Twins, birth weight and China’s One-Child Policy.” Review of Economic Studies, 76(3), 1149–1174.10.1111/j.1467-937X.2009.00563.xSearch in Google Scholar
Savage, T., Derraik, J. G. B., Miles, H. L., Mouat, F., Hofman, P. L., & Cutfield, W. S. (2013). “Increasing maternal age is associated with taller stature and reduced abdominal fat in their children.” PLoS One, 8(3), e58869.10.1371/journal.pone.0058869Search in Google Scholar
Short, S. E., & Zhai, F. (1998). “Looking locally at China’s One-Child Policy.” Studies in Family Planning, 29(4), 373–387.10.2307/172250Search in Google Scholar
Thomas, D. (1991). “How does mother’s education affect child height?” Journal of Human Resources, 26(2), 183–211.10.2307/145920Search in Google Scholar
Thomas, D. (1994). “Like father, like son; like mother, like daughter: Parental resources and child height.” Journal of Human Resources, 29(4), 950–988.10.2307/146131Search in Google Scholar
Zhang, J., Xu, P., & Liu, F. (2016). “One-Child Policy and childhood obesity.” China Economic Review. https://doi.org/10.1016/j.chieco.2016.05.003.Search in Google Scholar
A Appendix
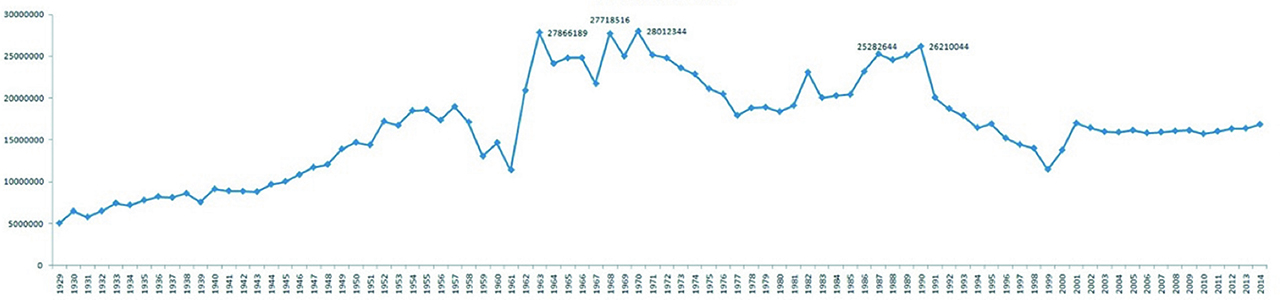
The number of newborns from 1929 to 2014 in China.
Source. National Bureau of Statistics of China.
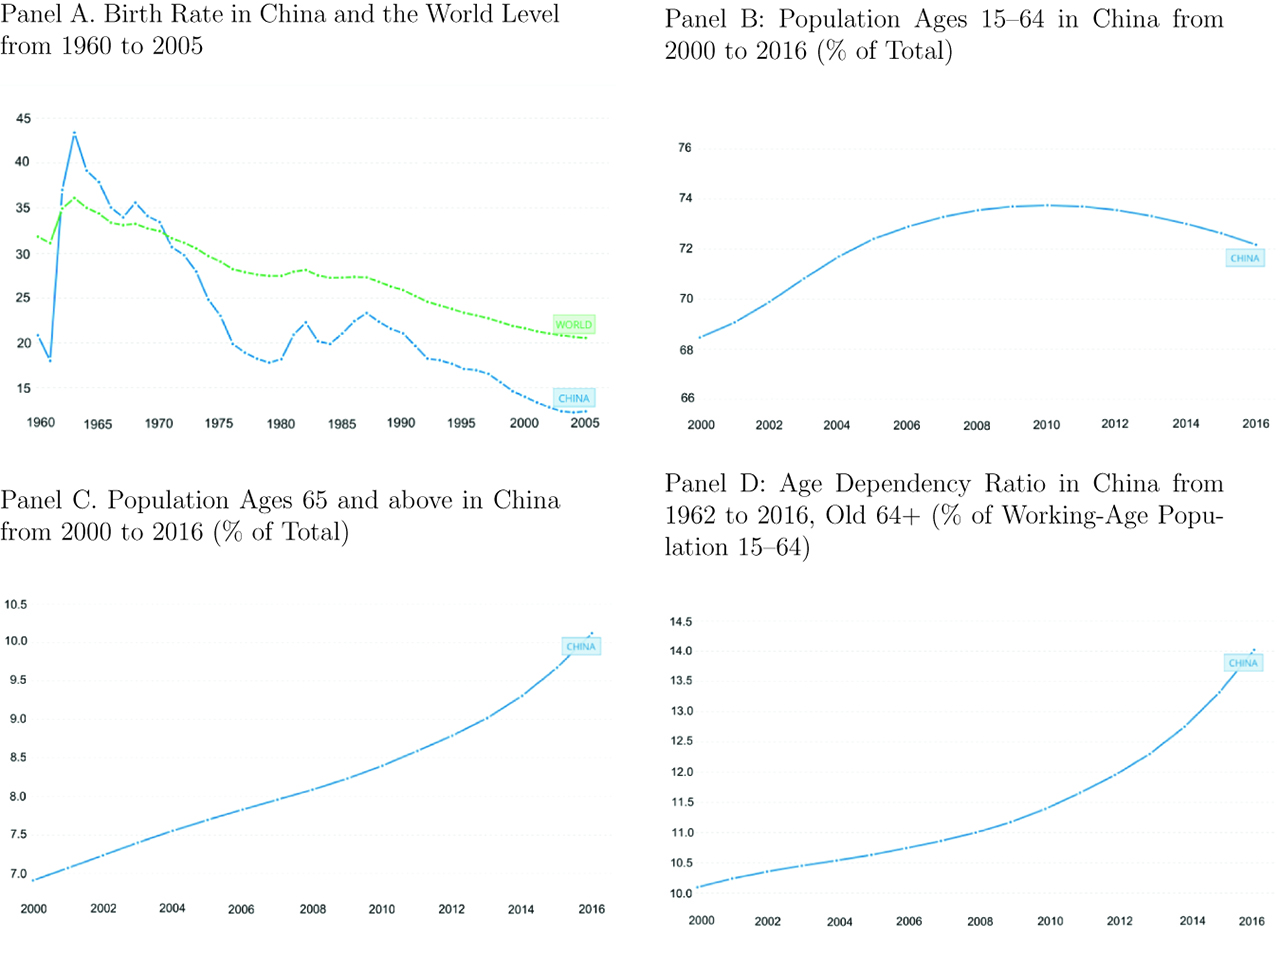
The changes in China’s demography over time.
Source. The World Bank (www.worldbank.org).
Different versions of food composition table.
| Our classification | 1981 Version | 1991 Version | 2002 Version | |
|---|---|---|---|---|
| (1) | Cereal | Cereal | Cereal | Cereal |
| (2) | Dried bean | Dried bean | Dried bean | Dried bean |
| (3) | Vegetables | Fresh bean | Fresh bean | Potato and starch |
| Roots | Roots | Vegetables | ||
| Stem, leaves, and flowers | Stem, leaves, and flowers | |||
| Melons | Melons | |||
| Solanaceous vegetables | Solanaceous vegetables | |||
| Starch | ||||
| (4) | Bacteria and algae | Bacteria and algae | Bacteria and algae | Bacteria and algae |
| (5) | Fruit, nuts, and seeds | Fruit and dried fruit | Fruit and dried fruit | Fruit |
| Nuts | Nuts | Nuts and seeds | ||
| (6) | Meats | Meats | Meats | Meats |
| (7) | Poultry | Poultry | Poultry | Poultry |
| (8) | Milk | Milk | Milk | Milk |
| Milk substitute | ||||
| (9) | Eggs | Eggs | Eggs | Eggs |
| (10) | Fish and seafood | Fish | Fish | Fish, shrimps, crabs, and mollusks |
| Mollusks | Mollusks | |||
| Shrimps and crabs | Shrimps and crabs | |||
| (11) | Others | Pickles | Pickles | Food for infants |
| Condiment and others | Food for infants | Savory snack foods and biscuits | ||
| Grease | Fast food | |||
| Savory snack foods and biscuits | Drinks | |||
| Tea and drinks | Alcoholic drinks | |||
| Alcoholic drinks | candies | |||
| Candies | Grease | |||
| Condiment | Condiment | |||
| Medicinal food | Medicinal food | |||
| Others |
First-stage results for the main specification.
| Dependent variable: sibling | ||
|---|---|---|
| Girl | Boy | |
| Policy | 0.233*** | 0.084** |
| (0.038) | (0.043) | |
| Child’s age | 0.090** | 0.102*** |
| (0.041) | (0.037) | |
| Child’s age squared | –0.002 | –0.003** |
| (0.002) | (0.002) | |
| Log of household income | –0.006 | 0.005 |
| (0.019) | (0.015) | |
| Mother’s age at first birth | –0.016*** | 0.003 |
| (0.005) | (0.005) | |
| Mother’s BMI | 0.002 | –0.001 |
| (0.005) | (0.005) | |
| Mother’s year of schooling | –0.010** | –0.011*** |
| (0.005) | (0.004) | |
| Province fixed effect | Yes | Yes |
| Wave fixed effect | Yes | Yes |
| Community characteristics | Yes | Yes |
| Observations | 764 | 857 |
Note. Standard errors, reported in parentheses, are adjusted for clustering by 9 province cells. ***p < 0.01; **p < 0.05; *p < 0.1.
The effects of community characteristics on the relaxtion of the OCP.
| Dependent variable: the relaxation of the OCP | ||||||||||||
|---|---|---|---|---|---|---|---|---|---|---|---|---|
| (1) | (2) | (3) | (4) | (5) | (6) | (7) | (8) | (9) | (10) | (11) | (12) | |
| Population density | –0.03 | – | – | – | – | – | – | – | – | – | – | – |
| (0.02) | ||||||||||||
| Economic activity | – | –0.03 | – | – | – | – | – | – | – | – | – | – |
| (0.02) | ||||||||||||
| Traditional markets | – | – | 0.01 | – | – | – | – | – | – | – | – | – |
| (0.02) | ||||||||||||
| Modern markets | – | – | – | 0.00 | – | – | – | – | – | – | – | – |
| (0.01) | ||||||||||||
| Transportation infrastructure | – | – | – | – | –0.02 | – | – | – | – | – | – | – |
| (0.01) | ||||||||||||
| Sanitation | – | – | – | – | – | –0.03 | – | – | – | – | – | – |
| (0.02) | ||||||||||||
| Communications | – | – | – | – | – | – | –0.02 | – | – | – | – | – |
| (0.03) | ||||||||||||
| Housing | – | – | – | – | – | – | – | –0.03 | – | – | – | – |
| (0.02) | ||||||||||||
| Education | – | – | – | – | – | – | – | – | –0.09 | – | – | – |
| (0.04) | ||||||||||||
| Diversity | – | – | – | – | – | – | – | – | – | –0.07* | – | – |
| (0.03) | ||||||||||||
| Health infrastructure | – | – | – | – | – | – | – | – | – | – | –0.02 | – |
| (-0.01) | ||||||||||||
| Social services | – | – | – | – | – | – | – | – | – | – | – | –0.05* |
| (0.02) | ||||||||||||
| Observations | 149 | 149 | 149 | 149 | 149 | 149 | 149 | 149 | 149 | 149 | 149 | 149 |
Note. Data are aggregated into the community level. Standard errors, reported in parentheses, are adjusted for clustering by 9 provinces. All regressions include province fixed effects and wave fixed effects. ***p < 0.01; **p < 0.05; *p < 0.1.
Summary statistics of first-born girls in two-child families.
| Entire sample | Above-quota births | Middle class and above | With mother finishing high school | With a younger brother | With a younger sister | Migration family | |
|---|---|---|---|---|---|---|---|
| (1) | (2) | (3) | (4) | (5) | (6) | (7) | |
| Panel A: Weight and height | |||||||
| Standardized weight | –0.723 | –0.828 | –0.562 | –0.681 | –0.690 | –0.668 | –0.547 |
| Standardized height | –0.539 | –0.725 | –0.352 | –0.459 | –0.554 | –0.482 | –0.585 |
| Panel B: Percentage of nutrition intake (%) | |||||||
| Fat | 14.067 | 14.195 | 15.355 | 15.321 | 14.248 | 13.463 | 15.648 |
| Protein | 13.808 | 14.316 | 14.293 | 14.647 | 13.812 | 13.740 | 12.534 |
| Carbohydrate | 72.125 | 71.489 | 70.352 | 70.032 | 71.940 | 72.797 | 71.818 |
| Panel C: Percentage of food intake (%) | |||||||
| Cereal | 44.107 | 42.277 | 42.362 | 41.652 | 44.457 | 43.154 | 43.465 |
| Dried bean | 4.564 | 4.788 | 4.720 | 5.223 | 4.496 | 4.748 | 3.078 |
| Vegetables | 35.059 | 35.112 | 33.913 | 32.670 | 35.131 | 34.864 | 42.106 |
| Bacteria and algae | 0.304 | 0.322 | 0.299 | 0.414 | 0.289 | 0.344 | 0.152 |
| Fruit, nuts, and seeds | 2.797 | 2.387 | 3.338 | 3.300 | 2.343 | 4.031 | 0.729 |
| Meats | 5.376 | 7.054 | 5.904 | 6.878 | 5.409 | 5.286 | 3.753 |
| Poultry | 0.722 | 1.034 | 0.849 | 0.841 | 0.670 | 0.809 | 0.691 |
| Milk | 0.215 | 0.193 | 0.283 | 0.463 | 0.163 | 0.357 | 0.000 |
| Eggs | 2.481 | 2.306 | 3.379 | 2.956 | 2.430 | 2.621 | 2.268 |
| Fish and seafood | 1.888 | 1.997 | 1.967 | 2.480 | 1.973 | 1.657 | 2.483 |
| Others | 2.487 | 2.523 | 2.986 | 3.124 | 2.618 | 2.128 | 1.273 |
| Observations | 374 | 116 | 176 | 182 | 283 | 102 | 16 |
© 2019 Walter de Gruyter GmbH, Berlin/Boston
Articles in the same Issue
- Research-articles
- Minimum Wages and Nascent Entrepreneurship in the US
- Social Status Perception and Individual Social Capital: Evidence from the US
- Endogenous Equity Shares in Cournot Competition: Welfare Analysis and Policy
- Personal or Partisan Incumbency Advantage? Evidence from an Electoral Reform at the Local Level in Italy
- Knowledge Obsolescence and Women’s Occupational Sorting: New Evidence from Citation Data
- The Effect of the Second Child on the Anthropometric Outcomes and Nutrition Intake of the First Child: Evidence from the Relaxation of the One-Child Policy in Rural China
- The Challenge of Organizing Elderly Care Programmes: Optimal Policy Design under Complete and Asymmetric Information
- Too Much Stick for the Carrot? Job Search Requirements and Search Behaviour of Unemployment Benefit Claimants
- Assessing Higher Education Policy in Brazil: A Mixed Oligopoly Approach
- Inheritance Taxation in a Model with Intergenerational Time Transfers
- Habits Do Not Die Easily: The Economics of Table Soccer
- Effects of Alcohol Taxation on Prices: A Systematic Review and Meta-Analysis of Pass-Through Rates
- Letter
- The Role of Optimism and Pessimism in the Substitution Between Primary and Secondary Health Prevention Efforts
- Executive Compensation and Labor Expenses
- A Note on Productive and Dynamic Inefficiencies of Intermediate Regulatory Sanctions