Noise or News? Learning about the Content of Test-Based School Achievement Measures
-
Mohsen Javdani


Abstract
Test-based measures of school performance are increasingly used to inform both education policy and families’ school choice decisions. There are, however, concerns about the reliability of these measures. This paper assesses the extent to which cross-sectional differences in schools’ average achievement on standardized tests reflect transitory factors, using data from a 1999–2006 panel of public and private schools in British Columbia, Canada. Sampling variation and one-time mean reverting shocks are shown to be significant sources of cross-sectional variation in schools’ mean test scores. The results therefore suggest that public dissemination of information about schools’ average achievement on standardized tests could potentially mislead or confuse parents. These results should also encourage caution in the design of policies that attach monetary or nonmonetary rewards or sanctions to schools on the basis of test-based achievement and suggest a need for more sophisticated measures of school performance.
1 Introduction
Proponents of school choice argue that the structure of the public educational system – where education is mainly provided by government with substantial monopoly power and largely no competition – leaves parents with limited choice among schools. They suggest that this may result in a disconnect between school quality and parents’ preferences. A growing literature in economics suggests that education reforms that expand school choice for students (e.g. open enrollment systems, magnet and charter schools, private school vouchers, and expanded public school choice for students in poorly performing schools) could improve educational outcomes such as test scores, educational attainment, expenditures, efficiency, etc. They argue that expanding school choice will improve access to higher quality schools, especially for relatively disadvantaged children. Moreover, expanding options for students will induce competition in education market that will put pressure on poorly performing schools to either improve their performance or to shrink as families “vote with their feet” (Friedman 1955; Borland and Howsen 1992; Becker 1995; Dee 1998; Hoxby 2003; Belfield and Levin 2003, Misra, Grimes, and Rogers 2012).[1]
One suggested approach to make these policies more effective is to increase parents’ access to information about school quality and performance so they can benefit from the opportunity to attend sought-after schools (e.g. Lai, Sadoulet, and de Janvry 2009, Allen and Burgess 2013).[2] A growing body of evidence suggests that test-based information about school performance affects parents’ school choice decisions and could consequently have real impacts on students’ educational outcomes (e.g. Hastings, Van Weelden, and Weinstein 2007; Hastings and Weinstein 2008; and others). A more recent study by Friesen et al. (2012) examines the effect of the public release of information about school achievement on parental choice behavior. Using data that is very similar to this study, they find that the public release of test-based information about school achievement substantially affects the mobility decisions of students in the Lower Mainland of British Columbia, Canada.[3] Their results suggest that some parents respond to information soon after it is publicly disseminated, and continue to respond to subsequent releases in the following years. However, it remains an open question and a concern whether test-based measures of school achievement, that are one of the main factors that affect student mobility, actually provide parents with meaningful information about school quality and performance, or whether they are too imprecise to do so. This is especially important in jurisdictions, such as the one studied by Friesen et al. (2012) and this paper, where publicly disseminated test-based information about schools gets updated annually and is found to be one of the important factors that affects parents’ school choice decisions and education policy.
The imprecision in test-based school achievement measures also has important implications for jurisdictions with school accountability systems. As Kane and Staiger (2001, 2002b) also point out, to the extent these test-based school achievement measures are used in school accountability systems to evaluate schools’ performance, high degree of imprecision in these measures can wreak havoc in school accountability systems and subject schools to sanctions or rewards based on factors that are beyond their control.[4] Moreover, to the extent these measures are used to identify best strategies of school reform, the imprecision in these measures could mislead policy makers and educational authorities in their evaluation of the merits of different education practices.
Kane and Staiger (2001, 2002a) suggest two potential sources of transitory variation in school average test scores. The first is sampling variation, which is a purely statistical phenomenon. Different cohorts of students attending a school in different years can be considered as random samples drawn from a local supplying population. Therefore, there will be year-to-year variation in a school’s test score solely arising from random year-to-year variation in the composition of its student body (i.e. sampling variation). The magnitude of sampling variation depends on school size: it is decreasing in the number of students who write the test. Since the enrollment is usually quite small in an average elementary school (41 in grade 4 and 50 in grade 7 in our sample) the variation induced by sampling variation could be quite serious. The second source of transitory variation is idiosyncratic factors that generate non-persistent differences in schools’ mean test scores; for example, a school-wide illness at the time of the exam, the presence of a few troublemaking students in a class, teacher absenteeism due to personal issues, etc. Following Kane and Staiger (2001, 2002a), we refer to this second source of transitory variance as “other transitory factors” to distinguish it from sampling variation.
There is evidence that suggests mobility decisions could be costly for students and their parents and might not contribute much to students’ academic performance. Cullen, Jacob, and Levitt (2005) find little or no evidence that students systematically achieve higher school quality (measured by value-added of schools to student outcomes) by choosing a non-neighborhood school. Their results also suggest that the main effect of Chicago’s open-enrollment program has been to induce segregation. Kane and Staiger (2001) find little evidence that schools with significant improvement in their test scores over time improved on any measures of student engagement. Hanushek, Kain, and Rivkin (2004) find that mobility generates negative externalities for students that entail a substantial cost for movers and non-movers alike. Cullen, Jacob, and Levitt (2006) exploit randomized lotteries that determine high-school admission and find little evidence that lottery winners (who attend what appear to be substantially better high schools; e.g. schools with higher achievement levels (and gains), higher graduation rates, and lower poverty rates) receive any benefits across a wide variety of traditional academic measures (e.g. standardized test scores, graduation, attendance rates, course-taking patterns, and credit accumulation). They also find some disadvantages associated with winning a lottery and therefore attending schools with higher achieving peers, such as lower class ranks throughout high school and higher chances of dropping out.
Wolf et al. (2007) study the federally sponsored voucher program in Washington, DC, and find that using a voucher to attend a private school had no impact on average reading or math scores. Mayer et al. (2002) also find similar results using experimental voucher evidence from New York City. Using data from 150 municipalities in Chile, Hsieh and Urquiola (2006) find that communities where private schools grew by more after the introduction of a comprehensive school voucher program did not experience a faster increase in their average test score, and in fact had worse average repetition and grade-for-average measures. Consistent with the findings of Cullen, Jacob, and Levitt (2005) and Fiske and Ladd’s (2001), they also find evidence that similar voucher programs led to increased segregation. Booker et al. (2007) study the impact of charter school attendance in Texas and find that students attending a charter school experience a poor test score growth in their initial year and it takes about 3 years for them to recover from this initial disruption. Bifulco and Ladd (2006) examine the performance of charter schools in North Carolina and find that students in charter schools make considerably smaller achievement gains than they would have in public schools. Their results attribute 30% of the negative effect of charter schools to high student turnover rates.[5] A related literature examines the effect of information about school-average achievement on real estate prices (Black 1999; Gibbons and Machin 2003; Kane et al. 2003, Figlio and Lucas 2004; Kane and Staiger 2006, Fiva and Kirkebøen 2010; Ries and Somerville 2010; and others). These studies generally find a positive relationship between information about school performance and housing prices.
We investigate the content of publicly disseminated information about schools’ average test scores to determine whether they provide parents with meaningful information about persistent inter-school differences in achievement and school quality. Since there is evidence that suggests test-based school achievement measures are one of the factors that shape parents’ mobility decisions, and since the studies reviewed above suggest that these decisions could be costly with negative, weak, or no academic benefits to students, it is important to investigate the degree of imprecision in these test-based measures that could contribute to parents’ mobility decisions. If these decisions are heavily based on noisy measures of school achievement, they could impose a substantial cost on parents and make them and their child considerably worse off. Moreover, making costly location decisions to obtain access to (currently) high-achieving schools could generate a lot of costly churning in the real estate market, and again making families worse off.
This is particularly important since Friesen et al. (2012) find that “parents in low income neighborhoods are most likely to alter their school choice decisions in response to new information [that is based on test-based school achievement measures that we are also examining in this study].” These are potentially families that are less likely to obtain information about school quality through other sources (for example due to their more limited access to well-informed networks) and are therefore more likely to put a large weight on these test-based measures to inform their school choice decisions. Moreover, given their socioeconomic background, mobility decisions are potentially more costly for these families and will more negatively affect them if they are heavily shaped by highly transitory information about school-average achievement.
Finally, if test-based measures of school achievement are strongly influenced by transitory factors, to the extent they are consulted to identify best practices in education, they will only confuse or mislead policy makers and educational authorities, which could be also quite costly. It should be emphasized that the use of test-based accountability systems is also one of the important motivations behind examining the degree of imprecision in test-based school achievement measures. However, since in British Columbia (BC), and in Canada in general, there are currently no test-based school accountability systems, our main motivation for this study is the effect of test-based information on parents’ school choice decisions. This is particularly important in the jurisdiction under study, British Columbia, where school choice has been one of the priorities of the provincial government and the commitment to it is mentioned as part of the BC education plan.[6]
We extend the work of Kane and Staiger (2002a) by laying out a more rigorous statistical model that shows more clearly the underlying model and the assumptions under which one can separately measure the effect of sampling variation and other transitory factors on the cross-sectional variance of school mean test scores. We find that sampling variation and other transitory factors are a significant source of observed variation in schools’ average test scores even among substantially large schools, and pooling student test scores across grades and years to dampen the volatility does not resolve this issue.
2 Previous Literature
Not much is known about the statistical properties of school-level measures of test-based achievement. Kane and Staiger (2001) find that test-based elementary school rankings in North Carolina resemble a lottery and argue that small within-school sample size that exacerbates the sampling variation is the main cause. Using methods developed by McClellan and Staiger (1999) for the analysis of hospital performance measures, they estimate that for an elementary school of average size in North Carolina, 28% and 10% of the variance in grade 5 reading scores is due to sampling variation and other transitory factors, respectively. They also decompose the variance of school-level test scores and find that gain scores tend to have “less signal variation and more variation due to non-persistent factors” than test score levels. Therefore, they caution against the use of gain scores in evaluating schools’ or teachers’ performance.
Using data from North Carolina, Kane and Staiger (2002a) examine the effect of sampling variation and other transitory factors on between-school variance in the average test scores, gain scores, and changes in the average test scores between 2 consecutive years. They estimate that for an average school in their sample, sampling variation is responsible for 14–15% of the variation in fourth-grade mean math and reading test scores. They also find that the effect of sampling variation on between-school variance in average gain scores (i.e. changes in student’s test scores between two consecutive grades in a given school) is twice as large as that of average test score levels. For schools of different size, they find that transitory factors explain 10–20% of the between-school variance in combined reading and math scores in grade 4, 28–58% of the variance in gains between third- and fourth-grade scores, and 73–80% of the variance in annual change in fourth-grade scores.
Mizala, Romoguera, and Urquiola (2007) find evidence that test-based rankings mostly reflect socioeconomic status. They also argue that the more highly correlated are test-based achievement and socioeconomic status, the lower is the year-to-year volatility in rankings based on test-based school achievement measures. Finally, using evidence from Chile’s P-900 program, Chay, McEwan, and Urquiola (2005) show that noise and mean-reverting shocks in schools’ test scores complicate evaluation of policies to improve school’s quality. They find that for a median-sized school, 33% and 21% of the variance in language and math scores, respectively, are due to transitory factors. They argue that such noise in mean test scores might limit the ability to identify “good” schools from “bad” schools.
3 A Simple Model
It is often costly to determine school quality, which makes school choice decisions difficult for parents. Although a parent seeking information about a school’s quality might choose to meet the principal, speak with neighbors, and visit the facilities, idiosyncrasies in the fit between child and school make true quality difficult to observe. In the absence of perfect information, parents must therefore form beliefs about school quality and base their school choice decisions on those beliefs. Recent studies suggest that signals received by parents in form of school-level test-based achievement measures play an important role in shaping these decisions.
We present a simplified model of school choice that accounts for uncertainty about school quality and focuses attention on the effects of noisy information based on school average test scores.[7] Assume parent i’s utility (Uis) depends on the quality (qs) of their child’s school s,
where qs represents an index of school characteristics that determines parents’ utility, such as teacher quality, peer quality, school’s state of technology, and class size.
If observed school characteristics are the only source of information about school quality for parents, a parent chooses school s if
where cis measures the direct (e.g. tuition) and indirect (e.g. commuting distance) costs of attending school s. Given the assumptions made before, this implies that the average parent chooses school s if
Now suppose that parents also receive a noisy signal Ss regarding school’s quality,
where
Parents are assumed to assimilate new information via Bayesian learning.[8] After observing the test-based signal, parents update their expectations about each school’s quality using Bayes’ rule. Since the true signal precision,
Equation [5] suggests that parents’ revised expectation of school quality is a precision-weighted average of the signal and their prior expectation; the more optimistic a parent’s perception of precision of test scores as a signal of school quality relative to prior information, the greater the weight that parent would place on test scores. Prior information regarding school quality,
Defining
We can define
Since parents cannot distinguish between schools in terms of precision of their average test scores as a signal of school quality, the weight they assign to test scores,
where
4 Institutional Background and Data
4.1 Testing and Information
Since the 1999/2000 school year, all public and provincially funded private schools in the province of BC have been required to administer standardized Foundation Skills Assessment (FSA) exams to students in Grades 4, 7, and 10 in May of each year. Students are examined in reading comprehension, writing, and numeracy.[10] The Ministry of Education first provided individual and provincial-, district-, and school-level FSA exam results to schools in fall 2000 and instructed them to share the information with parents upon request (B.C. Ministry of Education 2000). The results of the 1999/2000 and 2000/2001 FSA exams were first posted on the Ministry’s website in October 2001 (B.C. Ministry of Education 2001) and were found to have a substantial impact on mobility decisions (Friesen et al. 2012).[11] Each subsequent set of FSA results has been posted the following fall.
The Fraser Institute, an independent Canadian public policy research and educational organization (Fraser Institute 2015), started publishing annual “report cards” on BC’s elementary schools in June 2003 (Cowley and Easton 2003). These include school scores constructed by the Fraser Institute from FSA exam results, and rankings based on these scores.[12] From the outset, the Fraser Institute’s school report cards have received extensive media coverage.
As it was mentioned before, Friesen et al. (2012) examine the effect of this public release of information about school performance, by the Ministry of Education and the Fraser Institute, on school choice decisions (i.e. probability of separation from current school). They find that “English-speaking parents in low-income neighborhoods respond to the first release of information [by the ministry of education] and continue to respond to subsequent releases in later years [by the ministry of education and the Fraser Institute].” These ongoing responses by parents could raise serious concerns if these test-based school achievement measures that are publicly released to parents are strongly influenced by transitory factors.[13].
4.2 Data
The student-level data used in this study are derived from two administrative files maintained by the BC Ministry of Education: an enrollment database and an FSA exam database. The two databases are linked by a unique student identifier. Records in the enrollment database are based on an annual enrollment form collected on September 30 of each year for all students in the public and private school system between 1999 and 2006. It includes personal characteristics including gender, aboriginal status, home language, English as a second language (ESL) status, special education status, and postal code.[14] We use the postal code information to augment the raw data with selected characteristics of each student’s neighborhood as measured in 2001 and 2006 Canadian Census of Population at the Dissemination Area (DA) level.[15] These proxy for parental income, education, and demographic information not measured in the administrative data.
All students who were registered in grade 4 or grade 7 in a BC public or private school between the 1999/2000 and 2006/2007 school years are included in the FSA exam database. This database includes the grade 4 and grade 7 reading and numeracy exam results in each year for students who wrote the test. For those who did not write, it includes an indicator of whether or not the student was excused from the test or was merely absent.
Our final sample includes all public and private schools that have valid average FSA reading and numeracy scores in all 8 years (1999–2006) and have more than five students in enrollment with non-missing FSA scores.[16] Individual test scores in each year are normalized using overall mean and standard deviation for 1999–2006. Table 1 provides summary statistics for some variables of interest. There are 1,067 grade 4 schools and 798 grade 7 schools in our sample. Among schools that offer grade 4 and meet our sample restriction, 87% are public and 13% are private. For grade 7, the numbers are 84% and 16%, respectively. Average grade-level enrollment among schools offering grade 4 is 41, and 50 for grade 7. The proportion of aboriginal students in our final sample is 8.5% in both grade 4 and grade 7. The proportion of students who report a language other than English as their home language is 21% in grade 4 and 22.4% in grade 7. Other socioeconomic characteristics obtained from the census such as neighborhood-level average family income, incidence of low income and education seem to be very similar between grade 4 and grade 7 students.
Sample characteristics: grade 4 and grade 7 schools with valid FSA test scores between 1999 and 2006.
| Variable | Grade 4 | Grade 7 |
| Sample % | Sample . | |
| Number of schools in each year | 1,067 | 798 |
| % Public schools | 87% | 84% |
| % Private schools | 13% | 16% |
| Average enrollment | 41 | 50 |
| School-level average proportion of students: | ||
| Excused from reading test | 4.4% | 4.1% |
| Excused from numeracy test | 4.3% | 4.2% |
| Excused from both | 3.9% | 3.6% |
| Not excused and test written but no reading score | 3.0% | 2.3% |
| Not excused and test written but no numeracy score | 2.6% | 2.9% |
| % of aboriginal students | 8.5% | 8.5% |
| % of special need students | 6.6% | 8.0% |
| % of gifted students | 1.4% | 2.4% |
| % of students in French Immersion programs | 5.5% | 6.1% |
| % of students reporting non-English home language | 21% | 22.4% |
| % Chinese home language | 6.7% | 8.2% |
| % Punjabi home language | 4.5% | 3.6% |
| % other home language | 9.7% | 10.6% |
| % English as a second language (ESL) | 15% | 7.0% |
| Average family income (in 2000 C$) | C$66034 | C$67015 |
| Average percentage of incidence of low income | 15.1% | 15.2 % |
| Average proportion of parents with education: | ||
| Without high school | 14% | 14% |
| With high school | 14% | 14.3% |
| With bachelor or higher | 12.6% | 13.2% |
5 Volatility in School Mean Test Scores
We begin with a descriptive analysis of variability in school-average test scores. Then, using a simple statistical model built on the work of Kane and Staiger (2002a), we decompose the variation in school-average test scores into two different components: the variation that is due to sampling variation and the variation that is due to other nonpersistent factors.
Figures 1 and 2 portray the distribution of regression-adjusted average grade 4 and grade 7 reading and numeracy test scores by grade enrollment between 1999 and 2006.[17] It is immediately apparent that there is more variation in average test scores among small schools than big schools, while there does not seem to be a significant difference in average performance by school size. Moreover, Figures 3 and 4 suggest that small schools also experience more year-to-year fluctuation in their grade 4 and grade 7 average test scores compared to big schools.[18] The most likely cause is sampling variation, since its magnitude is a decreasing function of school size. We return to this hypothesis below.
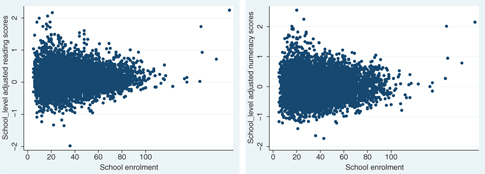
Grade 4 Adjusted Reading and Numeracy Average Test Scores by enrollment level (1999–2006).
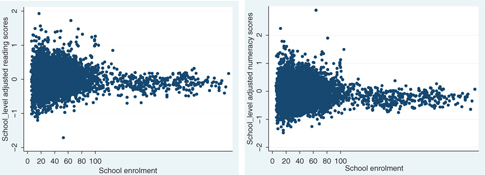
Grade 7 Adjusted Reading and Numeracy Average Test Scores by enrollment level (1999–2006).
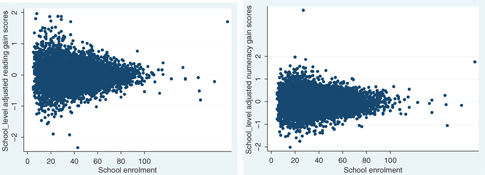
Grade 4 Adjusted Reading and Numeracy Gains by enrollment level (1999–2006).
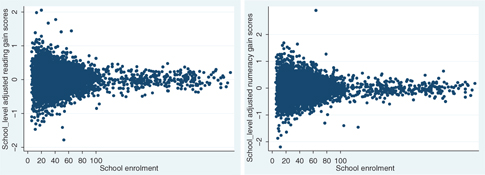
Grade 7 Adjusted Reading and Numeracy Gains by enrollment level (1999–2006).
Tables 2 and 3 further illustrate transitory year-to-year variation in grade 4 and grade 7 average test scores. If mean test scores are strongly influenced by transitory factors, a ranking based on these scores will be similar to a ranking based on a pure lottery. The upper panel of each table uses FSA reading scores and the lower panel uses FSA numeracy scores to compare school rankings under different scenarios.
Proportion of schools ranked in the top 20% of the distribution of grade 4 school-level average test scores (1999–2006).
| Number of years in top 20% | Certainty | Lottery | Actual average scores | Actual Adjusted average scores | Lottery | Gain scores | ||
| All schools | Enrollment < 30 (N = 328) | Enrollment < 20 (N = 116) | ||||||
| (1) | (2) | (3) | (4) | (5) | (6) | (7) | (8) | |
| School ranking based on average reading scores | ||||||||
| Never | 80.0 | 16.7 | 45.8 | 37.6 | 27.1 | 24.1 | 20.9 | 16.4 |
| 1 year | 0.0 | 33.5 | 19.1 | 22.6 | 23.4 | 20.6 | 36.7 | 40.9 |
| 2 years | 0.0 | 29.3 | 9.5 | 15.7 | 21.0 | 21.5 | 27.5 | 30.9 |
| 3 years | 0.0 | 14.6 | 7.9 | 9.4 | 11.2 | 14.6 | 11.4 | 9.9 |
| 4 years | 0.0 | 2.6 | 5.6 | 4.5 | 5.1 | 5.1 | 2.8 | 1.7 |
| 5 years | 0.0 | 0.9 | 3.8 | 4.0 | 4.8 | 7.7 | 0.4 | 0.0 |
| 6 years | 0.0 | 0.1 | 2.8 | 3.0 | 4.5 | 5.1 | 0.0 | 0.0 |
| 7 years | 0.0 | 0.0 | 3.0 | 1.6 | 1.8 | 0.0 | 0.0 | 0.0 |
| 8 years | 20.0 | 0.0 | 2.2 | 1.0 | 0.6 | 0.8 | NA | NA |
| School ranking based on average numeracy scores | ||||||||
| Never | 80.0 | 16.7 | 44.3 | 38.8 | 30.4 | 25.0 | 20.9 | 16.6 |
| 1 year | 0.0 | 33.5 | 19.9 | 23.1 | 22.5 | 22.4 | 36.7 | 40.5 |
| 2 years | 0.0 | 29.3 | 10.5 | 13.6 | 17.3 | 19.8 | 27.5 | 31.3 |
| 3 years | 0.0 | 14.6 | 8.3 | 9.1 | 13.4 | 13.7 | 11.4 | 9.1 |
| 4 years | 0.0 | 2.6 | 4.8 | 5.0 | 4.8 | 6.9 | 2.8 | 2.2 |
| 5 years | 0.0 | 0.9 | 4.4 | 4.1 | 3.9 | 6.9 | 0.4 | 0.0 |
| 6 years | 0.0 | 0.1 | 2.7 | 2.6 | 3.6 | 2.5 | 0.0 | 0.0 |
| 7 years | 0.0 | 0.0 | 2.5 | 1.9 | 2.7 | 1.7 | 0.0 | 0.0 |
| 8 years | 20.0 | 0.0 | 2.2 | 1.4 | 0.9 | 0.8 | NA | NA |
Proportion of schools ranked in the top 20% of the distribution of grade 7 school-level average test scores (1999–2006).
| Number of years in top 20 | Certainty | Lottery | Actual average scores | Actual Adjusted average scores | Lottery | Gain scores | ||
| All schools | Enrollment < 30 (N = 241) | Enrollment < 20 (N = 86) | ||||||
| (1) | (2) | (3) | (4) | (5) | (6) | (7) | (8) | |
| School ranking based on average reading scores | ||||||||
| Never | 80.0 | 16.7 | 38.85 | 33.21 | 23.24 | 20.93 | 20.9 | 7.27 |
| 1 year | 0.0 | 33.5 | 17.17 | 18.30 | 19.5 | 22.09 | 36.7 | 27.69 |
| 2 years | 0.0 | 29.3 | 11.78 | 14.16 | 16.18 | 16.28 | 27.5 | 40.10 |
| 3 years | 0.0 | 14.6 | 7.52 | 9.90 | 15.35 | 20.93 | 11.4 | 20.93 |
| 4 years | 0.0 | 2.6 | 4.64 | 7.02 | 6.64 | 1.16 | 2.8 | 3.88 |
| 5 years | 0.0 | 0.9 | 4.64 | 5.51 | 5.39 | 6.98 | 0.4 | 0.13 |
| 6 years | 0.0 | 0.1 | 5.26 | 5.14 | 5.81 | 3.49 | 0.0 | 0.0 |
| 7 years | 0.0 | 0.0 | 4.26 | 3.38 | 2.49 | 3.49 | 0.0 | 0.0 |
| 8 years | 20.0 | 0.0 | 5.89 | 3.38 | 5.39 | 4.65 | NA | NA |
| School ranking based on average numeracy scores | ||||||||
| Never | 80.0 | 16.7 | 38.22 | 32.46 | 21.58 | 19.77 | 20.9 | 7.52 |
| 1 year | 0.0 | 33.5 | 15.66 | 18.92 | 22.41 | 20.93 | 36.7 | 26.82 |
| 2 years | 0.0 | 29.3 | 11.9 | 13.53 | 16.60 | 18.60 | 27.5 | 40.98 |
| 3 years | 0.0 | 14.6 | 8.65 | 10.28 | 10.79 | 16.28 | 11.4 | 20.80 |
| 4 years | 0.0 | 2.6 | 7.02 | 8.02 | 13.28 | 9.30 | 2.8 | 3.76 |
| 5 years | 0.0 | 0.9 | 4.76 | 6.02 | 5.39 | 6.98 | 0.4 | 0.13 |
| 6 years | 0.0 | 0.1 | 4.39 | 4.26 | 2.07 | 1.16 | 0.0 | 0.0 |
| 7 years | 0.0 | 0.0 | 5.26 | 3.13 | 2.90 | 2.33 | 0.0 | 0.0 |
| 8 years | 20.0 | 0.0 | 4.14 | 3.38 | 4.98 | 4.65 | NA | NA |
Column 1 illustrates the case where school-average test scores are completely stable over time. Under this scenario, 20% of schools will always appear in the top 20% of the distribution of school-average test scores, and 80% of schools will never appear in the top 20%.[19] In contrast, column 2 illustrates the case where schools are assigned to different percentiles based on a pure lottery: all schools have an independent 20% probability of appearing in the top 20% of the distribution of school-average test scores in each year. Under this scenario, we expect nearly 17% of schools to never appear in the top 20%, only 0.1% appear in the top 20% 6 times out of 8, and none to appear in the top 20% in all 8 years.
Column 3 ranks schools based on their actual school-average FSA scores. The data lie somewhere between the two extremes of complete stability and a lottery. Looking at grade 4 results, 46% of schools never appear in the top 20% of average FSA reading scores and 2.2% appear in the top 20% for all 8 years; these numbers are 39% and 6% for grade 7, respectively. The results are almost identical for numeracy scores. However, one should bear in mind that part of the stability in ranking based on simple FSA levels may reflect the unchanging characteristics of the student populations feeding the schools and not necessarily due to persistent educational practices in the schools. Controlling for students’ observable characteristics, columns 4 results more closely resemble a lottery. Columns 5 and 6 also control for students’ observable characteristics, but restrict the sample to schools with enrollment less than 30 and 20 students, respectively. The results suggest that among smaller schools, the volatility in schools-average test scores is even more similar to a lottery. The most likely cause is sampling variation, whose magnitude decreases with sample size.
Finally, as column 8 illustrates, school gain scores (the change in school-average test score from 1 year to the next) are even more volatile than score levels, and consequently rankings based on gain scores are even more similar to a lottery.[20] This is potentially partly due to the fact that gain scores are based on differences in test scores over 2 consecutive years, which magnifies the effect of nonpersistent factors on variation in schools’ test scores and removes any permanent components.
5.1 Sampling Variation
We can think of successive cohorts of students entering a school over time as random samples drawn from a local population feeding that school. Therefore, even if the feeding population does not change, school-average test scores will vary from year to year due to random variation in the sample of students, or sampling variation. Given the relatively small number of students in an average school (41 in grade 4 and 50 in grade 7 in our data), and given the fact that only 10–15% of the variation in students’ test scores in our data is between schools, sampling variation can substantially change the position of a school in the distribution of school average test scores.
There are two factors that determine the magnitude of sampling variation: the number of students who write the test in the school, and the heterogeneity of individual test scores in the feeding population. Conditional on all other factors that could influence a school’s average test score over time, smaller schools will experience more volatility in their mean test scores due to sampling variation than bigger schools.
In what follows, we use a simple model and apply basic sampling theory to estimate the expected amount of variance in a school’s average test score due to sampling variation.[21] Consider a simple model of test score determination:
Here,
Assumption 1: Transitory shocks are idiosyncratic:
Assumption 2: Different cohorts of students entering a school in a given year are random samples drawn from a population feeding that school, so that
Given eq. [9], the average test score for a given school j in year t has the form
where
Defining
An unbiased estimator of the within-school variance of individual test scores at a given school is
As eq. [13] suggests, the source of variation in student test scores within a given school is either due to differences in students’ time-invariant characteristics (test-taking ability, socioeconomic background, etc.),
Applying sampling theory, the expected variance in school-average test scores due to sampling variation is
Given Assumptions 1 and 2,
Averaging eq. [14] over all schools gives the expected variance in mean test scores due to sampling variation for an average school:
Note this is an unbiased estimator of the last component in eq. [11].
The average within-school variance of FSA reading and numeracy scores is 0.88 and 0.83, respectively, for both grade 4 and grade 7. Since the overall variance of individual FSA reading and numeracy scores is normalized to one for each grade, this implies that within the average school, heterogeneity in students’ test scores is nearly as large as in the overall population. In other words, on average, the test scores of two students drawn randomly from a given school are likely to differ nearly as much as two students drawn from the population of BC students at large.[24]
The estimated expected variance in mean FSA reading and numeracy scores for an average school due to sampling variation, from eq. [15], is 0.028 (reading) and 0.025 (numeracy) for grade 4, and 0.026 (reading) and 0.024 (numeracy) for grade 7.[25] If we focus on schools of average size by looking only at the two middle quartiles of enrollment by grade, the overall cross-sectional variance of school-average FSA reading and numeracy scores is 0.13 and 0.17, respectively, for grade 4; and 0.13 and 0.19, respectively, for grade 7. It follows that for these average-sized schools, 21.5% and 14.7% of the total variation in fourth-grade mean FSA reading and numeracy scores, respectively, is due to sampling variation. For grade 7, the figures are 20% and 12.6%, respectively.[26]
In order to gain a better understanding of the importance of sampling variation, we calculate the 95% confidence interval for an average school’s mean test score using the estimated expected variance due to sampling variation:
where
A more conservative measure is based on the 50% confidence interval for an average school’s mean test score given sampling variation, which measures the degree of variability induced by sampling variation with the probability of a coin toss. This confidence interval extends from the 36th to 63rd percentile of the distribution of school-average reading scores for both grade 4 and grade 7. This remains a very wide interval.
5.2 Other Transitory Factors
Sampling variation is only one of the transitory factors that can affect school-average test scores. There are other transitory shocks that generate nonpersistent changes in schools’ mean test scores in addition to sampling variation. Specifically, the school-level time-varying component of student test scores (i.e.
Following Kane and Staiger (2002a) and given the framework developed in Section 4.1, we apply an indirect method to estimate the nonpersistent variation in test scores attributed to these other transitory factors.[27] First, we estimate the total variation in mean test scores due to all transitory factors by measuring the degree of persistence in change in test scores between two consecutive years. Then we back out the portion due to sampling variation. The remaining component is attributable to other transitory factors.
We first decompose the school-level time-varying effect on student scores in eq. [9] into two components:
where
Assumption 3:
The average test score for a given school j in year t will therefore have the form
The correlation between test score gains this year and last year can be written as
The numerator is the negative of the total variance of all transitory factors and the denominator is the total variance of gain scores (
Tables 4 and 5 summarize the results for different quartiles of grade 4 and grade 7 enrollment for both FSA reading and numeracy scores. The analysis is done separately for different years, while the bottom panel of each table presents the results of the variance decomposition for all years combined. As expected, the estimated sampling variance is bigger for small schools than bigger schools and the magnitudes are stable over time. The estimated variance of other transitory factors however varies over time, which is due to the random nature of the events that generate them.
Decomposition of variance in schools’ mean FSA scores – grade 4.
| School enrollment quartile | Average size | Total variance | Sampling variance | Other nonpersistent variance | Total proportion nonpersistent | Total variance | Sampling variance | Other nonpersistent variance | Total proportion nonpersistent |
| Grade 4 FSA Reading Scores | Grade 4 FSA Numeracy Scores | ||||||||
| Year = 2000 | |||||||||
| Bottom quartile | 21 | 0.156 | 0.051 | 0.042 | 0.600 | 0.175 | 0.045 | 0.054 | 0.571 |
| Two middle quartiles | 41 | 0.100 | 0.022 | 0.020 | 0.435 | 0.126 | 0.022 | 0.026 | 0.380 |
| Top quartile | 66 | 0.081 | 0.013 | 0.014 | 0.343 | 0.105 | 0.013 | 0.010 | 0.225 |
| Year = 2001 | |||||||||
| Bottom quartile | 20 | 0.202 | 0.049 | 0.036 | 0.424 | 0.267 | 0.045 | 0.048 | 0.349 |
| Two middle quartiles | 40 | 0.151 | 0.022 | 0.026 | 0.326 | 0.187 | 0.021 | 0.037 | 0.317 |
| Top quartile | 68 | 0.109 | 0.013 | 0.012 | 0.234 | 0.137 | 0.012 | 0.014 | 0.197 |
| Year = 2002 | |||||||||
| Bottom quartile | 20 | 0.221 | 0.049 | 0.033 | 0.374 | 0.276 | 0.043 | 0.043 | 0.313 |
| Two middle quartiles | 39 | 0.137 | 0.023 | 0.020 | 0.318 | 0.166 | 0.022 | 0.026 | 0.295 |
| Top quartile | 65 | 0.104 | 0.014 | 0.004 | 0.182 | 0.129 | 0.013 | 0.004 | 0.140 |
| Year = 2003 | |||||||||
| Bottom quartile | 20 | 0.178 | 0.051 | 0.037 | 0.499 | 0.234 | 0.042 | 0.051 | 0.402 |
| Two middle quartiles | 40 | 0.131 | 0.023 | 0.020 | 0.333 | 0.167 | 0.022 | 0.021 | 0.261 |
| Top quartile | 67 | 0.115 | 0.013 | 0.016 | 0.259 | 0.156 | 0.013 | 0.017 | 0.199 |
| Year = 2004 | |||||||||
| Bottom quartile | 19 | 0.226 | 0.052 | 0.069 | 0.540 | 0.336 | 0.043 | 0.123 | 0.495 |
| Two middle quartiles | 39 | 0.144 | 0.023 | 0.024 | 0.332 | 0.209 | 0.021 | 0.035 | 0.271 |
| Top quartile | 67 | 0.115 | 0.013 | 0.008 | 0.191 | 0.146 | 0.013 | 0.021 | 0.239 |
| Year = 2005 | |||||||||
| Bottom quartile | 19 | 0.235 | 0.052 | 0.051 | 0.440 | 0.244 | 0.043 | 0.040 | 0.345 |
| Two middle quartiles | 39 | 0.140 | 0.023 | 0.025 | 0.344 | 0.175 | 0.022 | 0.030 | 0.300 |
| Top quartile | 66 | 0.099 | 0.013 | 0.005 | 0.193 | 0.133 | 0.013 | 0.019 | 0.246 |
| All years (2000–2005) | |||||||||
| Bottom quartile | 20 | 0.203 | 0.050 | 0.046 | 0.475 | 0.253 | 0.044 | 0.058 | 0.406 |
| Two middle quartiles | 40 | 0.132 | 0.023 | 0.022 | 0.339 | 0.171 | 0.021 | 0.029 | 0.299 |
| Top quartile | 66 | 0.104 | 0.013 | 0.010 | 0.230 | 0.134 | 0.013 | 0.015 | 0.213 |
Decomposition of variance in schools’ mean FSA scores – grade 7.
| School enrollment quartile | Average size | Total variance | Sampling variance | Other nonpersistent variance | Total proportion nonpersistent | Total variance | Sampling variance | Other nonpersistent variance | Total proportion nonpersistent |
| Grade 7 FSA Reading Scores | Grade 7 FSA Numeracy Scores | ||||||||
| Year = 2000 | |||||||||
| Bottom quartile | 20 | 0.142 | 0.050 | 0.010 | 0.418 | 0.183 | 0.047 | 0.027 | 0.401 |
| Two middle quartiles | 42 | 0.109 | 0.022 | 0.028 | 0.456 | 0.130 | 0.021 | 0.013 | 0.267 |
| Top quartile | 97 | 0.064 | 0.010 | 0.014 | 0.371 | 0.108 | 0.011 | 0.009 | 0.184 |
| Year = 2001 | |||||||||
| Bottom quartile | 20 | 0.182 | 0.051 | 0.016 | 0.368 | 0.252 | 0.042 | 0.042 | 0.335 |
| Two middle quartiles | 42 | 0.125 | 0.022 | 0.003 | 0.206 | 0.186 | 0.022 | 0.021 | 0.232 |
| Top quartile | 97 | 0.119 | 0.011 | 0.012 | 0.194 | 0.179 | 0.011 | 0.014 | 0.141 |
| Year = 2002 | |||||||||
| Bottom quartile | 20 | 0.188 | 0.048 | 0.004 | 0.276 | 0.250 | 0.042 | 0.032 | 0.295 |
| Two middle quartiles | 44 | 0.137 | 0.021 | 0.015 | 0.268 | 0.189 | 0.021 | 0.030 | 0.266 |
| Top quartile | 98 | 0.114 | 0.011 | 0.010 | 0.179 | 0.170 | 0.011 | 0.006 | 0.098 |
| Year = 2003 | |||||||||
| Bottom quartile | 20 | 0.235 | 0.047 | 0.053 | 0.425 | 0.270 | 0.044 | 0.054 | 0.363 |
| Two middle quartiles | 43 | 0.150 | 0.022 | 0.011 | 0.219 | 0.198 | 0.020 | 0.021 | 0.206 |
| Top quartile | 99 | 0.116 | 0.011 | 0.016 | 0.232 | 0.214 | 0.010 | 0.035 | 0.212 |
| Year = 2004 | |||||||||
| Bottom quartile | 20 | 0.270 | 0.048 | 0.058 | 0.393 | 0.327 | 0.043 | 0.048 | 0.280 |
| Two middle quartiles | 43 | 0.141 | 0.021 | 0.021 | 0.298 | 0.218 | 0.020 | 0.029 | 0.225 |
| Top quartile | 99 | 0.119 | 0.011 | 0.015 | 0.217 | 0.194 | 0.010 | 0.025 | 0.182 |
| Year = 2005 | |||||||||
| Bottom quartile | 19 | 0.232 | 0.052 | 0.047 | 0.427 | 0.278 | 0.048 | 0.065 | 0.405 |
| Two middle quartiles | 43 | 0.144 | 0.022 | 0.023 | 0.309 | 0.214 | 0.020 | 0.018 | 0.177 |
| Top quartile | 98 | 0.104 | 0.011 | 0.014 | 0.246 | 0.169 | 0.011 | 0.013 | 0.142 |
| All years (2000–2005) | |||||||||
| Bottom quartile | 20 | 0.210 | 0.050 | 0.031 | 0.385 | 0.262 | 0.045 | 0.044 | 0.341 |
| Two middle quartiles | 42 | 0.135 | 0.022 | 0.017 | 0.289 | 0.190 | 0.021 | 0.022 | 0.226 |
| Top quartile | 97 | 0.105 | 0.011 | 0.014 | 0.232 | 0.169 | 0.011 | 0.018 | 0.167 |
Overall, the results suggest that school-average FSA reading and numeracy scores are not very reliable measures of persistent differences in school-average achievement, particularly among small schools. Looking at the bottom panel of each table, nearly 47% of the variance of school-average grade 4 FSA reading scores and 40% of FSA numeracy scores among schools in the smallest quartile of enrollment size is due to sampling variation and other nonpersistent factors. For grade 7 the estimates are 38% and 34%, respectively. As expected, transitory factors account for a smaller share of the cross-sectional variance among larger schools. For the two middle quartiles, 33% and 29% of the cross-sectional variance in grade 4 and grade 7 average FSA reading scores is due to nonpersistent factors respectively. The corresponding numbers are 30% and 23% for numeracy scores. For schools in the largest quartile, 23% of the variance across schools in grade 4 and grade 7 average FSA reading scores is due to transient factors, while for numeracy scores these numbers are 21% and 17% for grade 4 and grade 7, respectively. It also worth mentioning that almost across the board, the amount of imprecision in average FSA numeracy scores due to nonpersistent factors is smaller than average FSA reading scores.[29]
One interesting question that could arise from these results is whether schools could become large enough so their test scores provide reasonable information about their performance? We cannot extrapolate outside our data range to predict the school size at which test-based school achievement measures will provide a reliable signal of school quality. This is because as schools become larger, the cross-sectional variance across schools will also change. For instance, as our Tables 4 and 5 suggest, total variance in test scores across schools becomes smaller across the board as we move to higher enrollment quartiles. This highlights the fact raised by Kane and Staiger (2001) that “it is not the absolute amount of imprecision that matters, but the amount of imprecision relative to the underlying signal that dictates the reliability of any particular measure.”[30] In addition, it is not obvious how the variation induced by other non-persistent factors is going to change, given their random nature, as schools become larger.
However, despite the aforementioned limitations, we can examine the effect of transitory factors for larger schools by pooling student-level observations across years for each school. We can also pool these observations across grades to create even larger schools. Doing so will also provide some insights into the extent to which pooling test scores across grades and years will reduce the imprecision in these measures. In order to be able to implement the variance decomposition results similar to those reported in Tables 4 and 5, we need at least 3 years of observation for each school. This is because in order to calculate the contribution of other non-persistent factors we need to estimate the correlation between the changes in test scores in two consecutive years (as described in eq. [19]).Therefore, given that we have 8 years of data for each school, we use the most recent 6 years and pool observations for each school grade over three 2-year time periods: 2001–2002, 2003–2004, and 2005–2006. Additionally, we also pool observations for each school both across grades and across these 2-year time periods. This results in even larger school sizes.
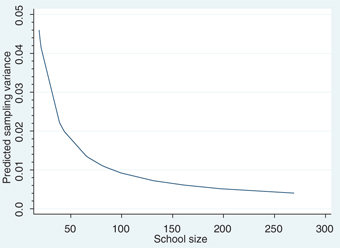
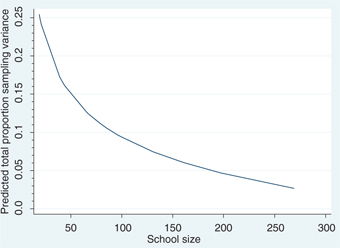
The results of variance decomposition for these larger schools are reported in Table 6. First of all, pooling observations across grades and years gives us substantially larger schools. The four largest quartiles have average school sizes of 131, 161, 197, and 269. Consistent with results reported in Tables 4 and 5, the contribution of sampling variation becomes smaller as we move to higher quartiles. However, more careful inspection of the relationship between school size and sampling variance suggests that sampling variance decreases at a decreasing rate as school size increases. Figures 5 and 6 illustrate the relationship between school size and the magnitude of sampling variance for reading and numeracy scores, respectively, using all the estimates reported in Tables 4–6. While the sampling variance drops quickly for smaller schools as the school size increases, it does not change significantly at higher levels of school size. Figures 7 and 8 suggest a similar relationship between school size and the proportion of total cross-sectional variance across schools due to sampling variation. As expected, the magnitude of other transitory factors does not follow the same pattern given their random nature. For example, looking at the bottom panel of Table 6, it decreases as we move from the bottom to the two-middle quartiles, but then increases as we move to the top quartile.
Decomposition of variance for larger schools.
| Pooling across years – grade 4 | |||||||||
| School enrollment quartile | Average size | Total variance | Sampling variance | Other nonpersistent variance | Total proportion nonpersistent | Total variance | Sampling variance | Other nonpersistent variance | Total proportion nonpersistent |
| FSA Reading Scores | FSA Numeracy Scores | ||||||||
| Bottom quartile | 39 | 0.136 | 0.025 | 0.034 | 0.439 | 0.202 | 0.021 | 0.036 | 0.288 |
| Two middle quartiles | 78 | 0.109 | 0.011 | 0.014 | 0.241 | 0.155 | 0.011 | 0.016 | 0.175 |
| Top quartile | 131 | 0.104 | 0.006 | 0.015 | 0.218 | 0.138 | 0.006 | 0.022 | 0.210 |
| pooling across years – grade 7 | |||||||||
| School enrollment quartile | Average size | Total variance | Sampling variance | Other nonpersistent variance | Total proportion nonpersistent | Total variance | Sampling variance | Other nonpersistent variance | Total proportion nonpersistent |
| FSA Reading Scores | FSA Numeracy Scores | ||||||||
| Bottom quartile | 40 | 0.196 | 0.023 | 0.021 | 0.227 | 0.231 | 0.021 | 0.023 | 0.194 |
| Two middle quartiles | 85 | 0.124 | 0.010 | 0.005 | 0.132 | 0.188 | 0.010 | 0.013 | 0.126 |
| Top quartile | 197 | 0.102 | 0.005 | 0.005 | 0.103 | 0.174 | 0.005 | 0.013 | 0.106 |
| Pooling across grades and years | |||||||||
| School enrollment quartile | Average size | Total variance | Sampling variance | Other nonpersistent variance | Total proportion nonpersistent | Total variance | Sampling variance | Other nonpersistent variance | Total proportion nonpersistent |
| FSA Reading Scores | FSA Numeracy Scores | ||||||||
| Bottom quartile | 81 | 0.125 | 0.011 | 0.019 | 0.247 | 0.168 | 0.010 | 0.020 | 0.186 |
| Two middle quartiles | 161 | 0.098 | 0.005 | 0.002 | 0.086 | 0.136 | 0.005 | 0.004 | 0.072 |
| Top quartile | 269 | 0.107 | 0.003 | 0.009 | 0.121 | 0.150 | 0.003 | 0.012 | 0.107 |
Nearly 22 (21)% of variance in school-average FSA reading (numeracy) scores among schools in the fourth largest quartile in terms of average school size (with an average school size of 131) is due to sampling variation and other transitory factors. For the third largest quartile (with an average school size of 161), these estimates are 8.6% and 7.2%. However, as we move to the second largest quartile (with an average school size of 197), the contribution of non-persistent factors becomes larger, 10.3% and 10.6% for reading and numeracy scores, respectively. Finally, as we move to the largest quartile (with an average school size of 269), while the contribution of non-persistent factors does not changes for numeracy scores, it becomes even larger for reading scores at 12.1%. We observe the same patterns across other quartiles in the table.
These results highlight two important issues. First, due to the decreasing effect of larger school size on reduction in sampling variation (illustrated in Figures 5–8), changes in cross-sectional variance across school as we move across quartiles, and random changes in the contribution of other transitory factors that are not a monotonic function of changes in school size, it is not obvious whether the effect of total transitory factors becomes smaller as the schools become substantially larger. Second, total transitory factors can still have a considerable impact on test-based school achievement measures for substantially large schools. For instance, comparing our results in the bottom panel of Table 5 with our results in bottom panel of Table 6, while the average school size has increased by 1,245% (from 20% to 269%), the contribution of transitory factors only drops by 68% (from 38% to 12%). The 12% variation in test scores among the largest schools in our sample, driven by total transitory factors, is still considerably large. To put it into perspective, if we create a 95% confidence interval for the average school in this quartile using the estimated total expected variance induced by transitory factors, it will extend from 25th to 75th percentile of the average test score distribution.[31]
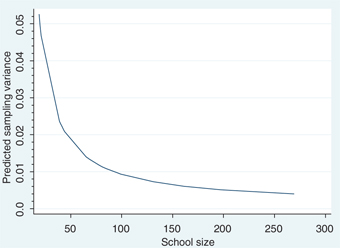
Relationship between school size and sampling variance (reading scores), Fractional polynomial fitted plot.
Relationship between school size and proportion of total cross-sectional variance due to sampling variance (reading scores), Fractional polynomial fitted plot.
Relationship between school size and sampling variance (numeracy scores), Fractional polynomial fitted plot.
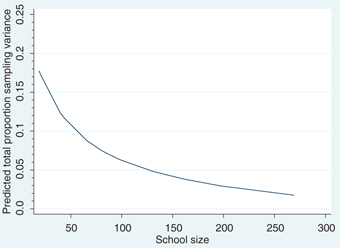
Relationship between school size and proportion of total cross-sectional variance due to sampling variance (numeracy scores), Fractional polynomial fitted plot.
As it was mentioned before, we also measure the proportion of cross-sectional variance in the Fraser Institute school-level scores that is due to all transitory factors (sampling variation and other transitory factors). Friesen et al. (2012) find that public release of these scores has a substantial impact on parents’ school choice decisions. Moreover, since the Fraser Institute scores are constructed combining 10 different indicators (see footnote 12), it would be interesting to investigate the extent to which these more sophisticated measures of school performance are influenced by transitory factors. Results are summarized in Table 7and suggest that these scores are also strongly influenced by transitory factors. Between 18% and 22.4% of the cross-sectional variance in the Fraser Institute scores are due to transitory factors.
The Fraser Institute annual scores variance decomposition.
| Year | Total variance | Total variation due to nonpersistent factors | Total proportion nonpersistent |
| 2001 | 3.010 | 0.676 | 0.224 |
| 2002 | 2.987 | 0.665 | 0.222 |
| 2003 | 3.182 | 0.750 | 0.235 |
| 2004 | 3.244 | 0.587 | 0.181 |
6 Conclusion
Sampling variation and one-time mean-reverting shocks are a significant source of observed variation in schools’ average test scores. This is of critical importance because there is growing evidence that suggests providing information about school-level achievement has real effects on parents’ school choice decisions. More importantly, the results of Friesen et al. (2012), which exploits a very similar sample of schools and students, suggest that some parents’ school choice decisions respond to publicly disseminated information about school average test scores soon after it becomes available, and continue to respond to subsequent releases in the following years. This raises even more concerns regarding the noisiness of test-based school achievement measures that are publicly disseminated to parents and are perceived by some as a signal of school performance.
Since school choice decisions are inherently costly, and since there is considerable amount of evidence that suggests these mobility decisions do not necessarily provide academic benefits to students, to the extent they are shaped by imprecise or noisy measures of school performance, they could potentially impose a net cost on parents and students and make them significantly worse off. Moreover, if it becomes apparent to parents that these measures are very noisy and fluctuate significantly from 1 year to the next, they might stop paying attention to new information about school-level achievement, undermining the effectiveness of school choice policies that partly hinges upon the ability to distinguish high-achieving schools from low-achieving schools. In addition, to the extent these noisy test-based school achievement measures are used as one of the factors to identify best educational practices, they could generate a lot of confusion over advantages and disadvantages of different strategies of school reform, and could mislead policy makers and educational authorities into decisions that are costly. Finally, to the extent noisy and imprecise test-based school achievement measures are used in jurisdictions with school accountability systems to evaluate schools’ performance, policy makers and educational authorities could be misled into assigning rewards or sanctions to schools based on factors that are outside their control and therefore undermine the effectiveness of these accountability systems. Chay, McEwan, and Urquiola (2005) provide strong evidence that suggests policy evaluations based on such noisy measures of school effectiveness have the potential to be misleading.
Nonpersistent factors are found to induce greater year-to-year variation in average test scores of small schools than bigger schools. However, even bigger schools still experience a significant volatility in their average test scores due to transitory factors. This suggests that combining test scores from more than one grade, or from more than 1 year, to increase the sample size and dampen the transitory volatility, will not resolve the concerns regarding the reliability of these test-based school achievement measures.[32] Our results suggest that due to the decreasing effect of larger school size on reduction in sampling variation, and changes in between-school variance and the effect of other transitory factors, total transitory factors still have a considerable impact on test-based school achievement measures even after pooling test scores across grades and years, and could therefore move a school significantly in the distribution of scores. Therefore, it is not clear whether consulting several years of results, for example, as suggested by the Fraser Institute, will provide meaningful information to parents. As the previous discussion of results in Tables 2 and 3 suggests, the changes in the position of schools, particularly small schools, in the distribution of test scores over several years, is not far from a lottery process.[33] To the extent these test-based measures are used by parents to inform their school choice decisions, this is likely to only add more confusion to parents’ decision-making regarding school choice, and might mislead them in this process into making costly decisions with no academic benefits for their children.
Our results also suggest that significant changes in average test scores of larger schools should be treated as a stronger signal about persistent changes in performance compared to small schools. This is something that is not directly reflected in the constructed scores by the Fraser Institute, and again could mislead or confuse some parents. This also highlights the importance of communicating the statistical properties of these measures, especially when they are publicly disseminated. To the extent these measures are used to identify best practices in education, failure to do so might send confusing signals to parents and schools and could make it difficult to identify the areas of academic performance in which improvement can be made. These results should also warn educational authorities against naïve policies or interventions that attach monetary/nonmonetary rewards or sanctions to schools based on noisy measures of school performance. As a growing literature attests, designing meaningful measures of school effectiveness continues to be a challenge (Ladd and Walsh 2002; Hægeland et al. 2004; Mizala, Romoguera, and Urquiola 2007).[34]
Reference
Allen, R., and S. Burgess. 2013. “Evaluating the Provision of School Performance Information for School Choice.” Economics of Education Review 34: 175–90.10.1016/j.econedurev.2013.02.001Suche in Google Scholar
Altonji, J. G., and C. R. Pierret 2001. Employer Learning and Statistical Discrimination, The Quarterly Journal of Economics, 116 (1): 313–50.10.3386/w6279Suche in Google Scholar
B.C. Ministry of Education. 2001. “Interpreting and communicating Foundation Skills Assessment Results 2001,” Available at: http://www.bced.gov.bc.ca/assessment/fsa/pdfs/01interpret.pdfSuche in Google Scholar
Becker, G. S. 1995. “Human capital and poverty alleviation,” World Bank Human Resource and Operation Policy Working Paper Number 52. Washington, DC.Suche in Google Scholar
Belfield, C. R., and H. M. Levin. 2003. “The Effects of Competition on Educational Outcomes: A Review of US Evidence.” Review of Educational Research 72 (2): 279–341.10.3102/00346543072002279Suche in Google Scholar
Bifulco, R., and H. F. Ladd. 2006. “The Impacts of Charter Schools on Student Achievement: Evidence from North Carolina.” Journal of Education Finance and Policy 1 (1): 778–820.10.1162/edfp.2006.1.1.50Suche in Google Scholar
Black, S. E. 1999. “Do Better Schools Matter? Parental Valuation of Elementary Education.” Quarterly Journal of Economics 114 (2): 577–99.10.1162/003355399556070Suche in Google Scholar
Booker, K., S. M. Gilpatric, T. Gronberg, and D. Jansen. 2007. “The Impact of Charter School Attendance on Student Performance.” Journal of Public Economics 91 (5): 849–76.10.1016/j.jpubeco.2006.09.011Suche in Google Scholar
Borland, M. V., and R. M. Howsen. 1992. “Student Academic Achievement and the Degree of Market Concentration in Education.” Economics of Education Review 11 (1): 31–9.10.1016/0272-7757(92)90019-YSuche in Google Scholar
Chay, K. Y., P. J. McEwan, and M. Urquiola. 2005. “The Central Role of Noise in Evaluating Interventions That Use Test Scores to Rank Schools.” American Economic Review 95 (4): 1237–58.10.3386/w10118Suche in Google Scholar
Chernew, M., G. Gowrisankaran, and D. P. Scanlon. 2008. Learning and the Value of Information: Evidence from Health Plan Report Cards, Journal of Econometrics, 144 (1): 156–74.10.3386/w8589Suche in Google Scholar
Cowley, P., and S. T. Easton. 2008. Report Card on British Columbia’s Elementary Schools: 2003 Edition. Vancouver, BC: Fraser Institute.Suche in Google Scholar
Cullen, J. B., B. Jacob, and S. Levitt. 2005. “The Impact of School Choice on Student Outcomes: An Analysis of the Chicago Public Schools.” Journal of Public Economics 89 (5–6): 729–60.10.3386/w7888Suche in Google Scholar
Cullen, J. B., B. Jacob, and S. Levitt. 2006. “The Effect of School Choice on Participants: Evidence from Randomized Lotteries.” Econometrica 74 (5): 1191–230.10.1111/j.1468-0262.2006.00702.xSuche in Google Scholar
Dee, T. S. 1998. “Competition and the Quality of Public Schools.” Economics of Education Review 17 (4): 419–27.10.1016/S0272-7757(97)00040-XSuche in Google Scholar
Erdem, T., and M. P. Keane. 1996. Decision-Making Under Uncertainty: Capturing Dynamic Brand Choice Processes in Turbulent Consumer Goods Markets. Marketing science, 15 (1): 1–20.10.1287/mksc.15.1.1Suche in Google Scholar
Feldt, L. S., and R. L. Brennan. 1989. Reliability in Educational Measurement, 3rd edn. New York, NY: American Council on Education.Suche in Google Scholar
Figlio, D., and M. E. Lucas. 2004. “What’s in a Grade? School Report Cards and the Housing Market.” American Economic Review 94 (3): 591–604.10.1257/0002828041464489Suche in Google Scholar
Fiske, E. B., and H. F. Ladd. 2001. When Schools Compete: A Cautionary Tale. Washington, DC: Brookings Institution Press.Suche in Google Scholar
Fiva, J. F., and L. J. Kirkebøen. 2010. “Information Shocks and the Dynamics of the Housing Market.” American Economic Review 113 (3): 525–52.10.1111/j.1467-9442.2011.01651.xSuche in Google Scholar
Fraser Institute. 2015. Who We Are. Available at: http://www.fraserinstitute.org/aboutus/whowe-are/overview.aspxSuche in Google Scholar
Friedman, M. 1955. “The Role of Government in Education.” In Economics and the Public Interest, edited by R. A. Solo, Piscataway, NJ: Rutgers University Press.Suche in Google Scholar
Friesen, J., B. C. Harris, and S. Woodcock (2013) “Open Enrolment and Student Achievement.” Working Paper No. 126. Vancouver BC: Canadian Labour Market and Skills Researcher Network.10.2139/ssrn.2334561Suche in Google Scholar
Friesen, J., M. Javdani, J. Smith, and S. Woodcock. 2012. “How Do School ‘Report Cards’ Affect School Choice Decisions?” Canadian Journal of Economics 45 (2): 784–807.10.1111/j.1540-5982.2012.01709.xSuche in Google Scholar
Gibbons, S. and S. Machin. 2003. Valuing English Primary Schools, Journal of Urban Economics 53: 197–219.10.1016/S0094-1190(02)00516-8Suche in Google Scholar
Hægeland, T., L. J. Kirkebøen, O. Raaum, and K. G. Salvanes. 2004. “Marks across lower secondary schools in Norway: What can be explained by the composition of pupils and school resources?” Report 2004/11. Oslo-Kongsvinger: Statistics Norway.Suche in Google Scholar
Hanushek, E. A., J. F. Kain, and S. G. Rivkin. 2004. “Disruption Versus Tiebout Improvement: The Costs and Benefits of Switching Schools.” Journal of Public Economics 88 (9–10): 1721–46.10.3386/w8479Suche in Google Scholar
Hastings, J., R. Van Weelden, and J. Weinstein. 2007. “Preferences, information and parental choice behavior in public school choice.” NBER Working Paper No.12995. National Bureau of Economic Research.10.3386/w12995Suche in Google Scholar
Hastings, J., and J. Weinstein. 2008. “Information, School Choice and Academic Achievement: Evidence from Two Experiments.” Quarterly Journal of Economics 123 (4): 1373–414.10.3386/w13623Suche in Google Scholar
Hoxby, C. M. 2003. “School Choice and School Productivity (or Could School Choice Be Atide That Lifts All Boats?” In The Economics of School Choice, edited by C. Hoxby, Chicago, IL: The University of Chicago Press.10.7208/chicago/9780226355344.001.0001Suche in Google Scholar
Hoxby, C. M., and S. Murarka. 2007. “Charter schools in New York City: Who enrolls and how they affect their students’ achievement.” No. w14852. National Bureau of Economic Research.Suche in Google Scholar
Hoxby, C. M., and J. E. Rockoff. 2005. The Impact of Charter Schools on Student Achievement. Cambridge, MA: Department of Economics, Harvard University.Suche in Google Scholar
Hsieh, C.-T., and M. Urquiola. 2006. “The Effects of Generalized School Choice on Achievement and Stratification: Evidence from Chile’s Voucher Program.” Journal of Public Economics 90 (8): 1477–503.10.1016/j.jpubeco.2005.11.002Suche in Google Scholar
Ichino, A., and E. Moretti. 2009. Biological Gender Differences, Absenteeism, and the Earnings Gap, American Economic Journal: Applied Economics 1 (1): 183–218.10.3386/w12369Suche in Google Scholar
Kane, T. J., and D. O. Staiger. 2001. “Improving School Accountability Measures.” National Bureau of Economic Research Working Paper No. 8156.10.3386/w8156Suche in Google Scholar
Kane, T. J., and D. O. Staiger. 2002a. “Volatility in School Test Scores: Implications for Test-Based Accountability Systems.” Brookings Papers on Education Policy 5: 235–83.10.1353/pep.2002.0010Suche in Google Scholar
Kane, T. J., and D. O. Staiger. 2002b. “The Promises and Pitfalls of Using Imprecise School Accountability Measures.” Journal of Economic Perspectives 16 (4): 91–114.10.1257/089533002320950993Suche in Google Scholar
Kane Thomas, J., D. O. Staiger, and S. K. Reigg. 2006. “School Quality, Neighborhood and Housing Prices: The Impacts of School Desegregation.” American Law and Economics Review 8 (2): 183–212.10.1093/aler/ahl007Suche in Google Scholar
Kane Thomas, J., D. O. Staiger, and G. Samms. 2003. “School accountability ratings and housing values,” Brookings-Wharton Papers on Urban Affairs: 83–137.10.1353/urb.2003.0011Suche in Google Scholar
Ladd, H. F., and R. P. Walsh. 2002. “Implementing Value-Added Measures of School Effectiveness: Getting the Incentives Right.” Economics of Education Review 21 (1): 1–17.10.1016/S0272-7757(00)00039-XSuche in Google Scholar
Lai, F., E. Sadoulet, and A. de Janvry. 2009. “The Adverse Effects of Parents’ School Selection Errors on Academic Achievement: Evidence from the Beijing Open Enrollment Program.” Economics of Education Review 28 (4): 485–96.10.1016/j.econedurev.2008.10.002Suche in Google Scholar
Lange, F. 2007. The Speed of Employer Learning, The Journal of Labor Economics, 25 (1): 1–34.10.1086/508730Suche in Google Scholar
Manski, C. F. 1992. “Educational Choice (Vouchers) and Social Mobility.” Economics of Education Review 11 (4): 351–69.10.1016/0272-7757(92)90042-2Suche in Google Scholar
Mayer, D. P., P. E. Peterson, D. E. Myers, C. C. Tuttle, and W. G. Howell. 2002. “School Choice in New York City after Three Years: An Evaluation of the School Choice Scholarships Program.” Washington, DC: Mathematica Policy Research, Inc., Final Report, February 19.Suche in Google Scholar
McClellan, M., and D. Staiger. 1999. “The Quality of Health Care Providers,” National Bureau of Economic Research Working Paper No. 7327.10.3386/w7327Suche in Google Scholar
Misra, K., P. W. Grimes, and K. E. Rogers. 2012. “Does Competition Improve Public School Efficiency? A Spatial Analysis.” Economics of Education Review 31 (6): 1177–90.10.1016/j.econedurev.2012.08.001Suche in Google Scholar
Mizala, A., P. Romoguera, and M. Urquiola. 2007. “Socioeconomic Status or Noise? Tradeoffs in the Generation of School Quality Information.” Journal of Development Economics 84 (1): 61–75.10.1016/j.jdeveco.2006.09.003Suche in Google Scholar
Moretti, E. 2011. Social Learning and Peer Effects in Consumption: Evidence from Movie Sales. The Review of Economic Studies, 78 (1): 356–93.10.3386/w13832Suche in Google Scholar
Ries, J., and T. Somerville. 2010. “School Quality and Residential Property Values: Evidence from Vancouver Rezoning.” The Review of Economics and Statistics 92 (4): 928–44.10.1162/REST_a_00038Suche in Google Scholar
Sass, T. R. 2006. “Charter Schools and Student Achievement in Florida.” Education Finance and Policy 1 (1): 91–122.10.1162/edfp.2006.1.1.91Suche in Google Scholar
Witte, J., D. Weimer, A. Shober, and P. Schlomer. 2007. “The Performance of Charter Schools in Wisconsin.” Journal of Policy Analysis and Management 26 (3): 557–73.10.1002/pam.20265Suche in Google Scholar
Woodcock, S. D. 2010. Heterogeneity and Learning in Labor Markets, The B.E. Journal of Economic Analysis & Policy (Advances) 10 (1): Article 85.10.2202/1935-1682.2010Suche in Google Scholar
Wolf, P., B. Gutmann, M. Puma, L. Rizzo, N. Eissa, and M. Silverberg. 2007. “Evaluation of the DC Opportunity Scholarship Program: Impacts after One Year.” U.S. Department of Education, Institute of Education Sciences. Washington, DC: U.S. Government Printing Office.Suche in Google Scholar
©2015 by De Gruyter
Artikel in diesem Heft
- Frontmatter
- Advances
- Insulation or Patronage: Political Institutions and Bureaucratic Efficiency
- Rural Property Rights, Migration, and Welfare in Developing Countries
- The Impact of Voluntary Youth Service on Future Outcomes: Evidence from Teach For America
- Contributions
- Human Capital Formation and International Trade
- Racial Discrimination in the Labor Market for Recent College Graduates: Evidence from a Field Experiment
- Life Insurance and Suicide: Asymmetric Information Revisited
- The Impact of Immigration on Native Wages and Employment
- The Effect of Pharmacies’ Right to Negotiate Discounts on the Market Share of Parallel Imported Pharmaceuticals
- Vertical or Horizontal: Endogenous Merger Waves in Vertically Related Industries
- Violence in Illicit Markets: Unintended Consequences and the Search for Paradoxical Effects of Enforcement
- Topics
- The Effect of Alcohol Consumption on Labor Market Outcomes of Young Adults: Evidence from Minimum Legal Drinking Age Laws
- Impacts of FTA Utilization on Firm Performance
- Is There a Motherhood Wage Penalty for Highly Skilled Women?
- Developers’ Incentives and Open-Source Software Licensing: GPL vs BSD
- Noise or News? Learning about the Content of Test-Based School Achievement Measures
- Entrepreneurial Risk Choice and Credit Market Equilibria
- How Responsive Are EU Coal-Burning Plants to Changes in Energy Prices?