
Do You Receive a Lighter Prison Sentence Because You Are a Woman or a White? An Economic Analysis of the Federal Criminal Sentencing Guidelines
-
Todd Andrew Sorensen
 ,
Surpriya Sarnikar
,
Surpriya Sarnikar

Abstract
Using data obtained from the United States Sentencing Commission’s records, we examine the extent to which the Federal Criminal Sentencing Guidelines curbed judicial sentencing preferences based on gender, race, and ethnicity. Our structural utility maximization model of judicial sentencing and a new generalized nonlinear decomposition methodology allow us to conduct a counterfactual exercise examining the impact of the guidelines on sentences during our period of study. Our results indicate that under the guidelines, and after controlling for circumstances such as the severity of the offense and past criminal history, judicial preferences strongly favor women while also disadvantaging Black men. In most of our estimates, we find that in the absence of the guidelines, judicial preferences would have increased the unexplained gap. Our findings stand up to a wide variety of robustness checks.
Appendices
Appendix A: robustness checks and additional tables
Expected sentence in months by group and regime
| With own weights | With pooled weights | ||||
| Y Hat | P Hat | Y Hat | P Hat | ||
| *White M | Regime 1 | 0.00 | 0.22 | 0.00 | 0.23 |
| Regime 2 | 23.54 | 0.14 | 23.36 | 0.15 | |
| Regime 3 | 36.05 | 0.32 | 36.05 | 0.32 | |
| Regime 4 | 40.25 | 0.07 | 40.22 | 0.07 | |
| Regime 5 | 46.92 | 0.15 | 46.92 | 0.14 | |
| Regime 6 | 66.07 | 0.10 | 66.07 | 0.10 | |
| Total | 34.94 | 34.54 | |||
| *White F | Regime 1 | 0.00 | 0.35 | 0.00 | 0.34 |
| Regime 2 | 10.61 | 0.21 | 10.32 | 0.11 | |
| Regime 3 | 17.93 | 0.23 | 17.93 | 0.31 | |
| Regime 4 | 21.01 | 0.07 | 21.38 | 0.04 | |
| Regime 5 | 25.17 | 0.10 | 25.17 | 0.12 | |
| Regime 6 | 33.91 | 0.04 | 44.81 | 0.08 | |
| Total | 13.81 | 16.45 | |||
| *Black M | Regime 1 | 0.00 | 0.14 | 0.00 | 0.15 |
| Regime 2 | 33.11 | 0.13 | 34.37 | 0.16 | |
| Regime 3 | 49.77 | 0.34 | 49.77 | 0.32 | |
| Regime 4 | 54.93 | 0.08 | 54.78 | 0.09 | |
| Regime 5 | 63.70 | 0.16 | 63.70 | 0.16 | |
| Regime 6 | 90.11 | 0.15 | 83.24 | 0.12 | |
| Total | 52.15 | 49.99 | |||
| *Black F | Regime 1 | 0.00 | 0.36 | 0.00 | 0.31 |
| Regime 2 | 12.02 | 0.18 | 11.77 | 0.10 | |
| Regime 3 | 19.36 | 0.24 | 19.36 | 0.32 | |
| Regime 4 | 22.75 | 0.06 | 22.99 | 0.05 | |
| Regime 5 | 27.40 | 0.11 | 27.40 | 0.13 | |
| Regime 6 | 36.82 | 0.05 | 47.01 | 0.09 | |
| Total | 15.69 | 18.70 | |||
| *Hisp M | Regime 1 | 0.00 | 0.16 | 0.00 | 0.22 |
| Regime 2 | 22.91 | 0.22 | 21.57 | 0.16 | |
| Regime 3 | 34.60 | 0.34 | 34.60 | 0.32 | |
| Regime 4 | 37.63 | 0.08 | 37.97 | 0.06 | |
| Regime 5 | 45.62 | 0.11 | 45.62 | 0.14 | |
| Regime 6 | 54.65 | 0.08 | 62.98 | 0.10 | |
| Total | 30.27 | 31.47 | |||
| *Hisp F | Regime 1 | 0.00 | 0.29 | 0.00 | 0.31 |
| Regime 2 | 12.17 | 0.30 | 12.20 | 0.13 | |
| Regime 3 | 21.71 | 0.26 | 21.71 | 0.32 | |
| Regime 4 | 23.92 | 0.06 | 24.63 | 0.05 | |
| Regime 5 | 29.33 | 0.07 | 29.33 | 0.12 | |
| Regime 6 | 34.14 | 0.02 | 48.00 | 0.07 | |
| Total | 14.66 | 18.57 | |||
Full estimation results (coop and drugs included)
| Pooled | White M | White F | Black M | Black F | Hisp M | Hisp F | |
| High school degree indicator | 0.982 | –1.505 | 1.406 | 2.563 | 0.702 | 2.568 | 3.041 |
| (0.90) | (1.54) | (2.30) | (1.75) | (2.64) | (1.97) | (3.34) | |
| GED indicator | 2.520 | 1.935 | 2.533 | 5.564 | –2.668 | 1.338 | 3.326 |
| (1.00) | (1.67) | (2.52) | (2.01) | (3.24) | (2.28) | (3.80) | |
| Some college indicator | –1.540 | –3.806 | 1.471 | 0.576 | –1.490 | –3.010 | 0.815 |
| (0.96) | (1.61) | (2.37) | (1.95) | (2.77) | (2.21) | (3.61) | |
| College grad indicator | –1.127 | –3.210 | –0.062 | –2.155 | 4.208 | –10.638 | –1.328 |
| (1.18) | (1.77) | (2.88) | (3.03) | (3.74) | (3.40) | (5.30) | |
| Married indicator | –2.744 | –4.269 | 0.531 | –5.461 | –0.789 | –2.064 | 3.704 |
| (0.51) | (0.82) | (1.15) | (1.15) | (1.73) | (1.09) | (1.57) | |
| Number of dependents | –0.575 | –1.161 | –0.385 | –0.856 | –0.450 | –0.224 | –1.179 |
| (0.13) | (0.23) | (0.35) | (0.25) | (0.40) | (0.28) | (0.43) | |
| Private defense indicator | –5.217 | –9.318 | –0.942 | –3.460 | 1.239 | –2.674 | –2.672 |
| (0.45) | (0.68) | (0.99) | (1.08) | (1.59) | (1.04) | (1.64) | |
| Criminal history cat 2 indicator | 14.719 | 10.620 | 10.537 | 14.172 | 14.446 | 14.942 | 11.379 |
| (0.61) | (0.93) | (1.39) | (1.44) | (1.89) | (1.33) | (2.12) | |
| Criminal history cat 3 indicator | 25.776 | 20.854 | 18.101 | 25.848 | 26.433 | 22.718 | 19.263 |
| (0.56) | (0.90) | (1.39) | (1.25) | (1.84) | (1.18) | (2.31) | |
| Criminal history cat 4 indicator | 39.827 | 34.639 | 25.044 | 39.327 | 37.973 | 33.121 | 32.096 |
| (0.71) | (1.15) | (2.22) | (1.43) | (2.75) | (1.61) | (4.06) | |
| Criminal history cat 5 indicator | 48.550 | 42.560 | 39.505 | 47.702 | 50.864 | 39.231 | 35.253 |
| (0.88) | (1.43) | (2.89) | (1.67) | (3.74) | (2.14) | (5.76) | |
| Criminal history cat 6 indicator | 64.715 | 59.983 | 42.513 | 65.124 | 54.963 | 50.345 | 28.078 |
| (0.67) | (1.07) | (2.35) | (1.35) | (2.61) | (1.74) | (5.24) | |
| Criminal severity score | 10.636 | 10.872 | 13.930 | 9.518 | 15.633 | 6.897 | 11.308 |
| (0.37) | (0.59) | (0.97) | (0.75) | (1.22) | (0.89) | (1.72) | |
| Criminal severity score squared | –0.357 | –0.380 | –0.609 | –0.277 | –0.685 | –0.228 | –0.426 |
| (0.02) | (0.03) | (0.05) | (0.04) | (0.06) | (0.04) | (0.08) | |
| Criminal severity score cubed | 0.007 | 0.007 | 0.011 | 0.005 | 0.012 | 0.005 | 0.007 |
| (0.00) | (0.00) | (0.00) | (0.00) | (0.00) | (0.00) | (0.00) | |
| Age | –0.197 | 0.634 | 0.641 | –0.610 | –0.149 | 0.211 | 0.665 |
| (0.12) | (0.18) | (0.29) | (0.31) | (0.44) | (0.28) | (0.44) | |
| Age squared | 0.002 | –0.007 | –0.008 | 0.005 | 0.000 | –0.004 | –0.008 |
| (0.00) | (0.00) | (0.00) | (0.00) | (0.01) | (0.00) | (0.01) | |
| Constant | –110.138 | –129.015 | –143.885 | –118.012 | –139.697 | –71.696 | –115.541 |
| (3.47) | (5.60) | (8.66) | (8.12) | (12.10) | (8.05) | (13.92) | |
 | 50.301 | 48.621 | 30.833 | 59.342 | 35.038 | 45.637 | 30.748 |
| (0.19) | (0.29) | (0.43) | (0.40) | (0.60) | (0.41) | (0.65) | |
 | 37.266 | 34.061 | 18.948 | 45.954 | 24.267 | 40.870 | 27.497 |
| (0.30) | (0.45) | (0.64) | (0.66) | (0.94) | (0.74) | (1.19) | |
 | 24.477 | 24.994 | 17.494 | 27.358 | 19.419 | 22.231 | 16.330 |
| (0.36) | (0.56) | (1.13) | (0.72) | (1.51) | (0.85) | (2.02) | |
| N | 76,587 | 29,865 | 6,010 | 21,453 | 4,013 | 12,557 | 2,689 |
Full estimation results: nonlinear extension (coop and drugs included)
| Pooled | White M | White F | Black M | Black F | Hisp M | Hisp F | |
| High school degree indicator | 1.006 | –1.493 | 1.427 | 2.624 | 1.262 | 2.539 | 3.272 |
| (0.92) | (1.60) | (2.37) | (1.78) | (2.49) | (2.04) | (3.49) | |
| GED indicator | 2.588 | 2.039 | 2.659 | 5.681 | –2.428 | 1.285 | 3.576 |
| (1.03) | (1.72) | (2.60) | (2.05) | (3.06) | (2.36) | (3.97) | |
| Some college indicator | –1.652 | –3.956 | 1.506 | 0.538 | –0.901 | –3.339 | 0.848 |
| (0.99) | (1.66) | (2.44) | (1.98) | (2.62) | (2.29) | (3.77) | |
| College grad indicator | –1.288 | –3.373 | –0.125 | –2.312 | 4.390 | –11.444 | –1.363 |
| (1.22) | (1.83) | (2.96) | (3.08) | (3.53) | (3.52) | (5.55) | |
| Married indicator | –2.841 | –4.482 | 0.535 | –5.565 | –0.538 | –2.164 | 3.923 |
| (0.53) | (0.84) | (1.18) | (1.18) | (1.64) | (1.13) | (1.64) | |
| Number of dependents | –0.595 | –1.215 | –0.399 | –0.874 | –0.567 | –0.234 | –1.231 |
| (0.13) | (0.23) | (0.36) | (0.25) | (0.37) | (0.29) | (0.45) | |
| Private defense indicator | –5.446 | –9.763 | –0.927 | –3.537 | 1.283 | –2.801 | –2.849 |
| (0.46) | (0.70) | (1.03) | (1.10) | (1.50) | (1.08) | (1.72) | |
| Criminal history cat 2 indicator | 15.056 | 10.883 | 10.723 | 14.322 | 12.885 | 15.283 | 11.764 |
| (0.63) | (0.96) | (1.43) | (1.47) | (1.79) | (1.38) | (2.21) | |
| Criminal history cat 3 indicator | 26.299 | 21.286 | 18.380 | 26.118 | 25.848 | 23.198 | 19.651 |
| (0.58) | (0.93) | (1.43) | (1.27) | (1.74) | (1.23) | (2.41) | |
| Criminal history cat 4 indicator | 40.410 | 35.171 | 25.229 | 39.585 | 35.915 | 33.501 | 32.729 |
| (0.73) | (1.19) | (2.28) | (1.45) | (2.59) | (1.67) | (4.25) | |
| Criminal history cat 5 indicator | 49.035 | 42.968 | 39.827 | 47.875 | 48.393 | 39.425 | 35.859 |
| (0.90) | (1.48) | (2.98) | (1.70) | (3.54) | (2.22) | (6.02) | |
| Criminal history cat 6 indicator | 65.323 | 60.660 | 42.784 | 65.403 | 53.205 | 50.446 | 28.028 |
| (0.69) | (1.11) | (2.42) | (1.37) | (2.47) | (1.80) | (5.48) | |
| Criminal severity score | 10.627 | 10.874 | 13.822 | 9.577 | 14.717 | 6.757 | 11.302 |
| (0.38) | (0.61) | (1.00) | (0.76) | (1.15) | (0.92) | (1.81) | |
| Criminal severity score squared | –0.357 | –0.381 | –0.606 | –0.280 | –0.673 | –0.223 | –0.426 |
| (0.02) | (0.03) | (0.05) | (0.04) | (0.06) | (0.04) | (0.09) | |
| Criminal severity score cubed | 0.007 | 0.007 | 0.011 | 0.005 | 0.012 | 0.005 | 0.007 |
| (0.00) | (0.00) | (0.00) | (0.00) | (0.00) | (0.00) | (0.00) | |
| Age | –0.196 | 0.671 | 0.672 | –0.622 | –0.122 | 0.237 | 0.713 |
| (0.12) | (0.19) | (0.29) | (0.31) | (0.42) | (0.29) | (0.46) | |
| Age squared | 0.002 | –0.008 | –0.008 | 0.005 | 0.000 | –0.004 | –0.009 |
| (0.00) | (0.00) | (0.00) | (0.00) | (0.01) | (0.00) | (0.01) | |
| Constant | –111.075 | –131.308 | –145.267 | –119.047 | –132.306 | –71.486 | –117.667 |
| (3.57) | (5.80) | (8.83) | (8.27) | (11.42) | (8.34) | (14.57) | |
 | 51.791 | 50.332 | 31.794 | 60.406 | 33.018 | 47.319 | 32.181 |
| (0.20) | (0.31) | (0.45) | (0.41) | (0.57) | (0.44) | (0.71) | |
 | 37.999 | 34.848 | 19.359 | 46.499 | 23.808 | 41.889 | 28.472 |
| (0.30) | (0.46) | (0.66) | (0.67) | (0.91) | (0.76) | (1.25) | |
 | 25.270 | 25.946 | 18.087 | 27.888 | 37.977 | 23.158 | 17.153 |
| (0.37) | (0.58) | (1.17) | (0.73) | (2.99) | (0.89) | (2.12) | |
 | 3.297 | 3.729 | 2.193 | 2.383 | 1.846 | 3.936 | 2.840 |
| (0.09) | (0.15) | (0.21) | (0.15) | (0.25) | (0.23) | (0.34) | |
 | 0.434 | 0.607 | 0.138 | 0.414 | –118.957 | 0.219 | 0.642 |
| (0.06) | (0.11) | (0.14) | (0.10) | (5.31) | (0.11) | (0.64) | |
| N | 76,587 | 29,865 | 6,010 | 21,453 | 4,013 | 12,557 | 2,689 |
Decomposition of racial sentencing gaps in months (including substantial assistance departures and drug offences)
| Obs gap | Pred gap | Explained | Unexplained | ||
| Male vs Female (Whites) | Guidelines | 21.05 | 20.72 | 14.81 | 5.91 |
| No guidelines | 19.47 | 12.57 | 6.89 | ||
| Male vs Female (Blacks) | Guidelines | 47.26 | 46.16 | 38.08 | 8.08 |
| No guidelines | 41.31 | 32.94 | 8.37 | ||
| Male vs Female (Hispanics) | Guidelines | 24.79 | 23.93 | 17.67 | 6.25 |
| No guidelines | 22.48 | 15.83 | 6.65 | ||
| White vs Black (Males) | Guidelines | –32.08 | –31.37 | –28.83 | –2.54 |
| No guidelines | –26.81 | –25.59 | –1.22 | ||
| White vs Hispanics (Males) | Guidelines | –7.43 | –6.94 | –6.36 | –0.59 |
| No guidelines | –2.77 | –5.34 | 2.56 | ||
| White vs Black (Females) | Guidelines | –5.87 | –5.93 | –5.56 | –0.37 |
| No guidelines | –4.96 | –5.23 | 0.26 | ||
| White vs Hispanics (Females) | Guidelines | –3.68 | –3.74 | –3.50 | –0.24 |
| No guidelines | 0.24 | –2.08 | 2.32 |
Decomposition of racial sentencing gaps in months: nonlinear extension of  (including substantial assistance departures and drug offences)
| Obs gap | Pred gap | Explained | Unexplained | ||
| Male vs Female (Whites) | Guidelines | 21.05 | 20.76 | 14.84 | 5.92 |
| No guidelines | 19.27 | 12.34 | 6.93 | ||
| Male vs Female (Blacks) | Guidelines | 47.26 | 15.53 | 38.19 | –22.66 |
| No guidelines | 42.30 | 32.40 | 9.91 | ||
| Male vs Female (Hispanics) | Guidelines | 24.79 | 23.97 | 17.70 | 6.26 |
| No guidelines | 22.27 | 15.55 | 6.71 | ||
| White vs Black (Males) | Guidelines | –32.08 | –31.39 | –28.92 | –2.46 |
| No guidelines | –26.86 | –25.24 | –1.63 | ||
| White vs Hispanics (Males) | Guidelines | –7.43 | –7.04 | –6.38 | –0.66 |
| No guidelines | –2.59 | –5.20 | 2.60 | ||
| White vs Black (Females) | Guidelines | –5.87 | –36.62 | –5.57 | –31.05 |
| No guidelines | –3.83 | –5.18 | 1.35 | ||
| White vs Hispanics (Females) | Guidelines | –3.68 | –3.83 | –3.51 | –0.32 |
| No guidelines | 0.40 | –1.98 | 2.38 |
Decomposition of racial sentencing gaps in months (including substantial assistance departures and no drug offences)
| Obs Gap | Pred Gap | Explained | Unexplained | ||
| Male vs Female (Whites) | Guidelines | 19.06 | 18.44 | 14.44 | 4.00 |
| No guidelines | 18.23 | 12.75 | 5.49 | ||
| Male vs Female (Blacks) | Guidelines | 35.41 | 35.34 | 28.93 | 6.41 |
| No guidelines | 33.77 | 26.05 | 7.72 | ||
| Male vs Female (Hispanics) | Guidelines | 16.91 | 16.06 | 11.80 | 4.26 |
| No guidelines | 15.81 | 11.37 | 4.44 | ||
| White vs Black (Males) | Guidelines | –18.12 | –18.33 | –16.03 | –2.29 |
| No guidelines | –17.75 | –15.44 | –2.31 | ||
| White vs Hispanics (Males) | Guidelines | 1.39 | 2.06 | 1.30 | 0.76 |
| No guidelines | 3.89 | 0.62 | 3.28 | ||
| White vs Black (Females) | Guidelines | –1.77 | –1.42 | –1.54 | 0.12 |
| No guidelines | –2.21 | –2.14 | –0.08 | ||
| White vs Hispanics (Females) | Guidelines | –0.76 | –0.32 | –1.34 | 1.02 |
| No guidelines | 1.47 | –0.76 | 2.23 |
Decomposition of racial sentencing gaps in months: base severity scores (including substantial assistance departures and drug offences)
| Obs Gap | Pred Gap | Explained | Unexplained | ||
| Male vs Female (Whites) | Guidelines | 21.05 | 20.16 | 12.48 | 7.68 |
| No guidelines | 18.46 | 9.30 | 9.17 | ||
| Male vs Female (Blacks) | Guidelines | 47.26 | 45.96 | 33.83 | 12.13 |
| No guidelines | 39.27 | 25.60 | 13.67 | ||
| Male vs Female (Hispanics) | Guidelines | 24.79 | 23.61 | 15.13 | 8.48 |
| No guidelines | 21.05 | 11.82 | 9.23 | ||
| White vs Black (Males) | Guidelines | –32.08 | –31.92 | –27.04 | –4.88 |
| No guidelines | –25.19 | –21.60 | –3.59 | ||
| White vs Hispanics (Males) | Guidelines | –7.43 | –7.53 | –7.34 | –0.20 |
| No guidelines | –2.03 | –6.12 | 4.09 | ||
| White vs Black (Females) | Guidelines | –5.87 | –6.12 | –5.69 | –0.43 |
| No guidelines | –4.38 | –5.30 | 0.91 | ||
| White vs Hispanics (Females) | Guidelines | –3.68 | –4.09 | –4.69 | 0.61 |
| No guidelines | 0.56 | –3.60 | 4.16 |
Decomposition of racial sentencing gaps in months: no severity controls
| Obs Gap | Pred Gap | Explained | Unexplained | ||
| Male vs Female (Whites) | Guidelines | 21.69 | 20.46 | 12.65 | 7.81 |
| No guidelines | 21.29 | 7.55 | 13.74 | ||
| Male vs Female (Blacks) | Guidelines | 36.40 | 37.47 | 22.78 | 14.68 |
| No guidelines | 34.82 | 14.10 | 20.72 | ||
| Male vs Female (Hispanics) | Guidelines | 16.62 | 15.19 | 10.44 | 4.74 |
| No guidelines | 15.19 | 8.62 | 6.57 | ||
| White vs Black (Males) | Guidelines | –16.72 | –18.50 | –13.12 | –5.38 |
| No guidelines | –16.43 | –11.04 | –5.39 | ||
| White vs Hispanics (Males) | Guidelines | 4.25 | 4.12 | 2.34 | 1.79 |
| No guidelines | 8.30 | 1.83 | 6.47 | ||
| White vs Black (Females) | Guidelines | –2.01 | –1.50 | –2.99 | 1.49 |
| No guidelines | –2.90 | –4.48 | 1.58 | ||
| White vs Hispanics (Females) | Guidelines | –0.82 | –1.15 | 0.12 | –1.28 |
| No guidelines | 2.20 | 2.90 | –0.70 |
Decomposition of racial sentencing gaps in months (pre-1999)
| Obs Gap | Pred Gap | Explained | Unexplained | ||
| Male vs Female (Whites) | Guidelines | 21.53 | 21.03 | 17.73 | 3.30 |
| No guidelines | 21.53 | 16.67 | 4.86 | ||
| Male vs Female (Blacks) | Guidelines | 34.91 | 35.37 | 31.05 | 4.33 |
| No guidelines | 34.53 | 29.20 | 5.33 | ||
| Male vs Female (Hispanics) | Guidelines | 17.91 | 16.77 | 13.46 | 3.31 |
| No guidelines | 18.17 | 13.23 | 4.95 | ||
| White vs Black (Males) | Guidelines | –16.36 | –16.92 | –16.29 | –0.63 |
| No guidelines | –16.58 | –16.41 | –0.17 | ||
| White vs Hispanics (Males) | Guidelines | –0.54 | 0.50 | –0.65 | 1.16 |
| No guidelines | 3.34 | –1.14 | 4.48 | ||
| White vs Black (Females) | Guidelines | –2.98 | –2.57 | –2.97 | 0.40 |
| No guidelines | –3.57 | –3.87 | 0.30 | ||
| White vs Hispanics (Females) | Guidelines | –4.16 | –3.76 | –4.92 | 1.17 |
| No guidelines | –0.02 | –4.59 | 4.57 |
Decomposition of racial sentencing gaps in months (post-1999)
| Obs Gap | Pred Gap | Explained | Unexplained | ||
| Male vs Female (Whites) | Guidelines | 21.49 | 20.89 | 18.05 | 2.84 |
| No guidelines | 20.04 | 16.07 | 3.97 | ||
| Male vs Female (Blacks) | Guidelines | 38.19 | 37.82 | 32.11 | 5.71 |
| No guidelines | 36.52 | 29.32 | 7.19 | ||
| Male vs Female (Hispanics) | Guidelines | 16.40 | 15.49 | 12.70 | 2.78 |
| No guidelines | 14.65 | 12.05 | 2.60 | ||
| White vs Black (Males) | Guidelines | –17.59 | –17.98 | –15.20 | –2.79 |
| No guidelines | –17.12 | –14.96 | –2.16 | ||
| White vs Hispanics (Males) | Guidelines | 6.02 | 6.13 | 4.57 | 1.56 |
| No guidelines | 8.00 | 4.09 | 3.92 | ||
| White vs Black (Females) | Guidelines | –0.89 | –1.06 | –1.14 | 0.08 |
| No guidelines | –0.65 | –1.71 | 1.06 | ||
| White vs Hispanics (Females) | Guidelines | 0.93 | 0.72 | –0.77 | 1.50 |
| No guidelines | 2.61 | 0.07 | 2.54 |
Decomposition of racial sentencing gaps in months (linear time trends)
| Obs Gap | Pred Gap | Explained | Unexplained | ||
| Male vs Female (Whites) | Guidelines | 21.69 | 21.09 | 18.10 | 2.99 |
| No guidelines | 20.91 | 16.49 | 4.41 | ||
| Male vs Female (Blacks) | Guidelines | 36.40 | 36.46 | 31.31 | 5.15 |
| No guidelines | 35.52 | 29.06 | 6.46 | ||
| Male vs Female (Hispanics) | Guidelines | 16.62 | 15.61 | 12.89 | 2.72 |
| No guidelines | 15.51 | 12.40 | 3.11 | ||
| White vs Black (Males) | Guidelines | –16.72 | –17.21 | –15.46 | –1.76 |
| No guidelines | –16.94 | –15.44 | –1.50 | ||
| White vs Hispanics (Males) | Guidelines | 4.25 | 4.67 | 3.10 | 1.57 |
| No guidelines | 7.01 | 2.82 | 4.19 | ||
| White vs Black (Females) | Guidelines | –2.01 | –1.84 | –2.25 | 0.41 |
| No guidelines | –2.32 | –2.87 | 0.55 | ||
| White vs Hispanics (Females) | Guidelines | –0.82 | –0.81 | –2.12 | 1.31 |
| No guidelines | 1.61 | –1.28 | 2.89 |
Decomposition of racial sentencing gaps in months: quadratic of severity
| Obs Gap | Pred Gap | Explained | Unexplained | ||
| Male vs Female (Whites) | Guidelines | 21.69 | 21.11 | 18.12 | 2.99 |
| No guidelines | 20.94 | 16.50 | 4.44 | ||
| Male vs Female (Blacks) | Guidelines | 36.40 | 36.61 | 31.34 | 5.27 |
| No guidelines | 35.48 | 29.08 | 6.40 | ||
| Male vs Female (Hispanics) | Guidelines | 16.62 | 15.64 | 12.87 | 2.78 |
| No guidelines | 15.56 | 12.35 | 3.21 | ||
| White vs Black (Males) | Guidelines | –16.72 | –17.18 | –15.47 | –1.71 |
| No guidelines | –16.90 | –15.46 | –1.43 | ||
| White vs Hispanics (Males) | Guidelines | 4.25 | 4.65 | 3.12 | 1.53 |
| No guidelines | 7.01 | 2.89 | 4.12 | ||
| White vs Black (Females) | Guidelines | –2.01 | –1.69 | –2.26 | 0.57 |
| No guidelines | –2.35 | –2.88 | 0.53 | ||
| White vs Hispanics (Females) | Guidelines | –0.82 | –0.82 | –2.13 | 1.32 |
| No guidelines | 1.64 | –1.26 | 2.90 |
Decomposition of racial sentencing gaps (including non-citizens)
| Obs Gap | Pred Gap | Explained | Unexplained | ||
| Male vs Female (Whites) | Guidelines | 21.15 | 20.57 | 15.86 | 4.71 |
| No guidelines | 20.29 | 13.36 | 6.93 | ||
| Male vs Female (Blacks) | Guidelines | 34.25 | 34.18 | 26.10 | 8.08 |
| No guidelines | 33.44 | 22.34 | 11.10 | ||
| Male vs Female (Hispanics) | Guidelines | 13.64 | 13.57 | 11.65 | 1.92 |
| No guidelines | 7.47 | 9.38 | –1.91 | ||
| White vs Black (Males) | Guidelines | –15.25 | –15.57 | –12.86 | –2.71 |
| No guidelines | –15.04 | –12.15 | –2.89 | ||
| White vs Hispanics (Males) | Guidelines | 5.97 | 5.92 | 1.49 | 4.44 |
| No guidelines | 12.68 | 2.99 | 9.69 | ||
| White vs Black (Females) | Guidelines | –2.15 | –1.97 | –2.62 | 0.66 |
| No guidelines | –1.88 | –3.17 | 1.29 | ||
| White vs Hispanics (Females) | Guidelines | –1.54 | –1.08 | –2.72 | 1.65 |
| No guidelines | –0.14 | –0.99 | 0.85 |
Decomposition of racial sentencing gaps in months (citizenship missing included)
| Obs Gap | Pred Gap | Explained | Unexplained | ||
| Male vs Female (Whites) | Guidelines | 21.09 | 20.44 | 15.74 | 4.70 |
| No guidelines | 20.31 | 13.25 | 7.05 | ||
| Male vs Female (Blacks) | Guidelines | 33.64 | 33.55 | 25.41 | 8.14 |
| No guidelines | 33.03 | 21.78 | 11.25 | ||
| Male vs Female (Hispanics) | Guidelines | 13.24 | 12.75 | 11.22 | 1.53 |
| No guidelines | 9.59 | 9.07 | 0.52 | ||
| White vs Black (Males) | Guidelines | –14.91 | –15.21 | –12.49 | –2.71 |
| No guidelines | –14.66 | –11.78 | –2.88 | ||
| White vs Hispanics (Males) | Guidelines | 6.32 | 6.26 | 1.82 | 4.44 |
| No guidelines | 11.88 | 3.24 | 8.65 | ||
| White vs Black (Females) | Guidelines | –2.36 | –2.09 | –2.83 | 0.73 |
| No guidelines | –1.93 | –3.25 | 1.32 | ||
| White vs Hispanics (Females) | Guidelines | –1.53 | –1.42 | –2.70 | 1.27 |
| No guidelines | 1.16 | –0.95 | 2.11 |
Decomposition of racial sentencing gaps in months: including convictions reached via trial (including substantial assistance departures and drug offences)
| Obs Gap | Pred Gap | Explained | Unexplained | ||
| Male vs Female (Whites) | Guidelines | 23.23 | 22.49 | 16.14 | 6.35 |
| No guidelines | 22.13 | 14.07 | 8.06 | ||
| Male vs Female (Blacks) | Guidelines | 52.84 | 50.30 | 41.27 | 9.03 |
| No guidelines | 46.84 | 37.05 | 9.80 | ||
| Male vs Female (Hispanics) | Guidelines | 26.53 | 25.30 | 19.16 | 6.14 |
| No guidelines | 24.31 | 17.53 | 6.78 | ||
| White vs Black (Males) | Guidelines | –36.74 | –34.97 | –31.93 | –3.04 |
| No guidelines | –31.03 | –29.32 | –1.71 | ||
| White vs Hispanics (Males) | Guidelines | –7.30 | –6.82 | –6.69 | –0.13 |
| No guidelines | –2.16 | –5.65 | 3.49 | ||
| White vs Black (Females) | Guidelines | –7.12 | –7.16 | –6.80 | –0.36 |
| No guidelines | –6.31 | –6.35 | 0.03 | ||
| White vs Hispanics (Females) | Guidelines | –3.99 | –4.01 | –3.67 | –0.34 |
| No guidelines | 0.02 | –2.19 | 2.21 |
Decomposition of racial sentencing gaps in months: defense counsel information missing
| Obs Gap | Pred Gap | Explained | Unexplained | ||
| Male vs Female (Whites) | Guidelines | 20.38 | 19.97 | 17.06 | 2.91 |
| No guidelines | 20.12 | 15.57 | 4.55 | ||
| Male vs Female (Blacks) | Guidelines | 37.43 | 37.68 | 31.87 | 5.80 |
| No guidelines | 37.24 | 29.79 | 7.45 | ||
| Male vs Female (Hispanics) | Guidelines | 17.62 | 16.17 | 13.48 | 2.69 |
| No guidelines | 15.39 | 13.54 | 1.85 | ||
| White vs Black (Males) | Guidelines | –18.49 | –18.89 | –17.09 | –1.80 |
| No guidelines | –18.35 | –16.96 | –1.38 | ||
| White vs Hispanics (Males) | Guidelines | 1.97 | 2.91 | 1.42 | 1.49 |
| No guidelines | 5.44 | 0.68 | 4.77 | ||
| White vs Black (Females) | Guidelines | –1.44 | –1.18 | –2.28 | 1.10 |
| No guidelines | –1.22 | –2.74 | 1.52 | ||
| White vs Hispanics (Females) | Guidelines | –0.79 | –0.89 | –2.16 | 1.27 |
| No guidelines | 0.72 | –1.35 | .07 |
Appendix B: details on econometric model
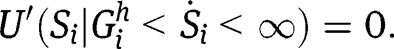
The first set of boundary constraints on  arises from a downward departure from the guidelines:
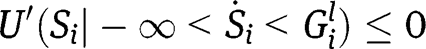
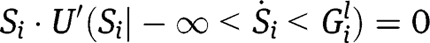
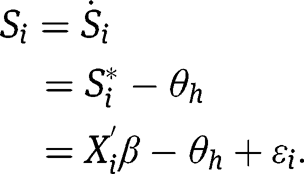
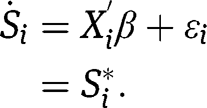
It follows that if the constrained utility maximizing value  , the actual sentence awarded is determined according to
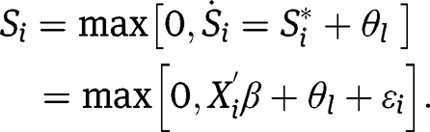
Thus, the empirical sentencing function is described by:
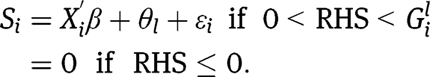
The next set of boundary constraints occur in the interior region that encompasses non-departures from the guidelines.
If the utility maximizing value 
 the empirical sentencing function is described by
Consider now the case for upward departures from the guidelines. If the utility maximizing value  it follows that
In this case the empirical sentencing function is given by
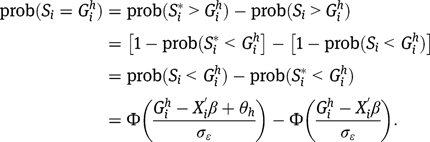
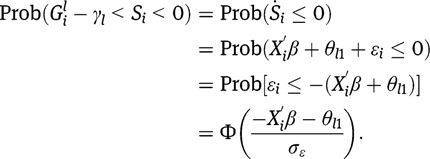
In order to accommodate mass points at  and
and  , we first need to determine the probabilities that the utility maximizing values
  yield sentences that fall in the six regions already considered. From the assumption of a normal distribution on random utilities, it is easily shown that
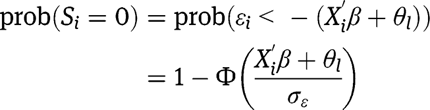
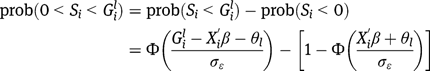
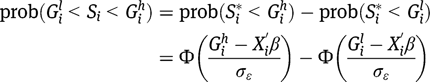
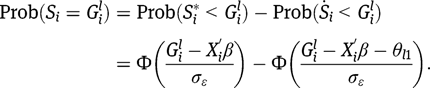
To determine the probability of a mass point at 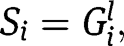 note
note
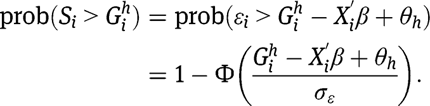
Similarly, the probability of a mass point at  is determined according to
It is readily verified that the probabilities over all regions sum to 1. We can summarize the six regions according to
| Region 1: |  |
| Region 2: |  |
| Region 3: |  |
| Region 4: |  |
| Region 5: |  |
| Region 6: | 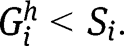 |
The corresponding log likelihood function for the sentencing model is specified by
![[3]](/document/doi/10.1515/bejeap-2012-0057/asset/graphic/bejeap-2012-0057_eq26.png)
where  the number of observations for which
 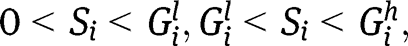 or
or  We term this model a partially uncensored ordered probit model.
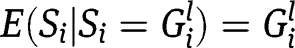
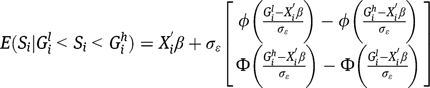
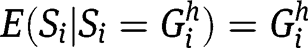
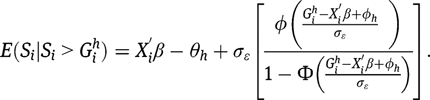
For each sentencing case, there are six conditional sentences corresponding to each possible sentencing region:
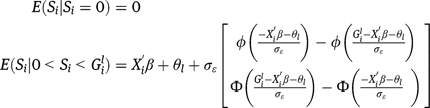
Note that the denominator will be zero above when 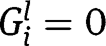 . Accordingly, we exclude these observations.
The expected sentence for the  case is calculated as
![[4]](/document/doi/10.1515/bejeap-2012-0057/asset/graphic/bejeap-2012-0057_eq33.png)
The estimated sentence for the  individual
  is calculated by evaluating eq. [4] at the estimated parameter values.
Appendix C: nonlinear marginal costs of departure extension of model
The step function approach to increasing marginal costs of sentencing departures is derived here. Define the total cost function for upward departures as

where  and
and  The marginal cost for an upward departure is given by
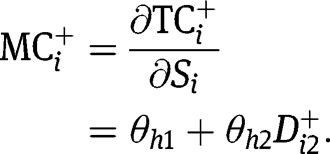
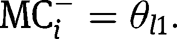
If the departure is less than or equal to  , then the incremental cost is simply
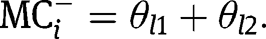
On the other hand if the departure exceeds  , the incremental cost is seen to be
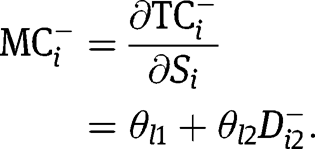
Next define the total cost function for downward departures as

where  and
and  The marginal cost for lowering a sentence by one month in a downward departure is given by
This simply means that higher sentences lower the utility cost in the downward departure regime. If the departure is less than or equal to  , then the incremental cost is
On the other hand if the downward departure exceeds  the incremental cost is given by
The utility function may now be specified:
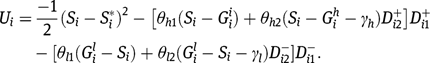
FOC yields

which implies
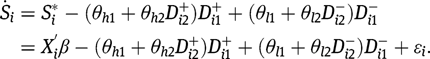
First, consider the sentencing demand function for the upward departure regime  :
:
In this case, the additional incremental cost for upward departures in excess of  is captured by the parameter
  on the dummy variable for excessive upward departure,
  .
.
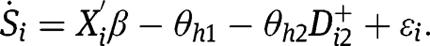
Next, consider the sentencing demand function for the downward departure regime  :
:
![[5]](/document/doi/10.1515/bejeap-2012-0057/asset/graphic/bejeap-2012-0057_eq46.png)
In this case, the additional incremental cost for downward departures in excess of  is captured by the parameter
  on the dummy variable for excessive downward departure,
  To allow for asymmetry in excessive upward and downward departures, we do not have to constrain
  When there are no departures,
  so that the sentencing demand function is given by
We now go through the probability that each observation falls into each of an expanded number of regimes and give the contribution of each regime to the likelihood function. Finally, we give the expected value in each regime.
Probabilities and expected sentences in extended model
Zero month sentences
Zero month sentences when 
Regime 1ai: 0 months sentence with large departure, 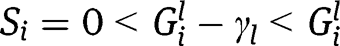
Probability of being in the regime:
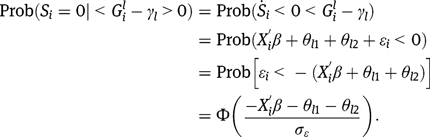
Conditional sentence
Contribution to the log likelihood function:
Zero month sentences when 
Regime 1aii: 0 months sentence with small departure, 
Probability of being in the regime:
Contribution to the log likelihood function:
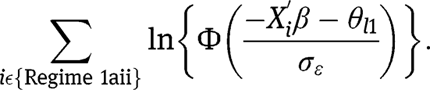
Conditional sentence
Downward departures (non-zero month sentences)
Downward departures (non-zero month sentences) when 
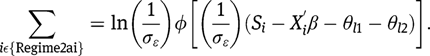
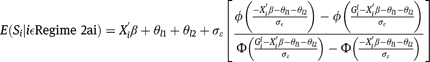
Regime 2ai: Large downward departure, sentence greater than 0, 
Probability of being in the regime:
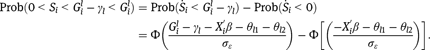
Contribution to the log likelihood function:
Conditional sentence
Regime 2bi: Medium downward departure, 
Probability of being in the regime. Note the superscript  represents a partially unconstrained counterfactual world, where
  but
but  .16
.16
Contribution to the log likelihood function:

Conditional sentence
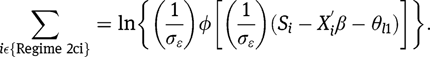
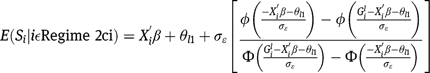
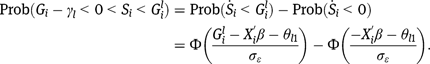
Regime 2ci: Small downward departure
Probability of being in the regime:
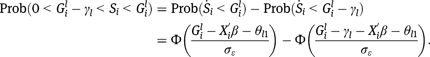
Contribution to the log likelihood function:
Conditional sentence
Downward departures (non-zero month sentences) when 
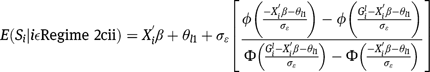
Regime 2cii: Small downward departure
Probability of being in the regime:
Contribution to the log likelihood function:
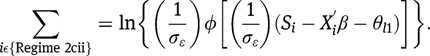
Conditional sentence
At lower limit of sentencing guidelines
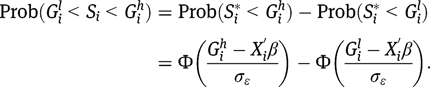
Regime 3: Lower limit of sentencing guidelines, 
Probability of being in the regime:
Contribution to the log likelihood function:
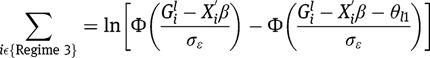
Conditional sentence
Within the limits of the sentencing guidelines
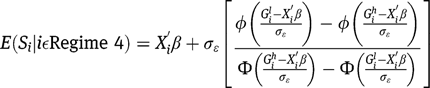
Regime 4: Within the limits of the sentencing guidelines, 
Probability of being in the regime:
Contribution to the log likelihood function:
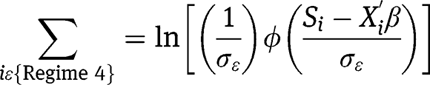
Conditional sentence
Upper limit of sentencing guidelines
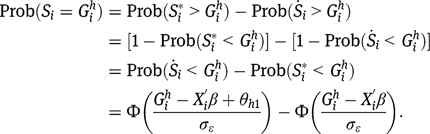
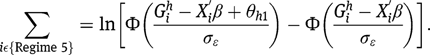
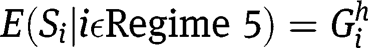
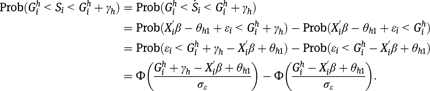
Regime 5: Upper limit of sentencing guidelines, 
Probability of being in the regime:
Contribution to the log likelihood function:
Conditional sentence
Upward departures
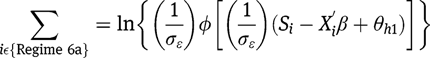
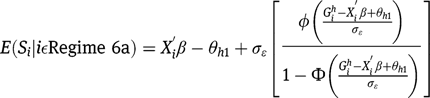
Regime 6a: Small upward departure, 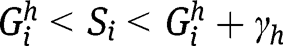
Probability of being in the regime:
Contribution to the log likelihood function:
Conditional sentence
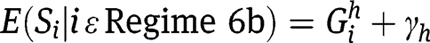
Regime 6b: Medium upward departure, 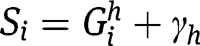
Probability of being in the regime:
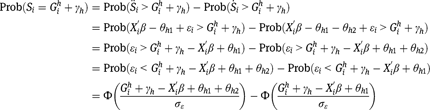
Contribution to the log likelihood function:

Conditional sentence
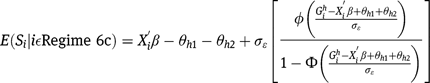
Regime 6c: Large upward departure, 
Probability of being in the regime:
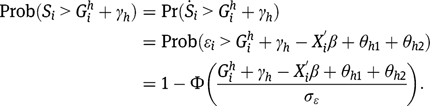
Contribution to the log likelihood function:
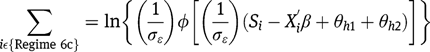
Conditional sentence
Acknowledgments
We gratefully acknowledge the helpful comments of WPEG Conference participants at the University of Kent, seminar participants at IZA, ERMES and University of Paris II, Syracuse University, University of Arizona Law College, Düsseldorf Institute for Competition Economics, University of California Riverside, University of Canterbury, Victoria University of Wellington, University of Otago, Melbourne Institute of Applied Economic and Social Research, Monash University, and Jonah Gelbach. Any remaining errors are the responsibility of the authors.
References
Abrams, D. S., B.Marianne, and M.Sendhil. 2010. “Do Judges Vary in Their Treatment of Race?” Scholarship at Penn Law Paper 364.Suche in Google Scholar
Anderson, J. M., J. R.Kling, and K.Stith. 1999. “Measuring Interjudge Sentencing Disparity: Before and After the Federal Sentencing Guidelines.” Journal of Law and Economics42(1, Part 2):271–307.Suche in Google Scholar
Bar-Gill, O., and O.Gazal Ayal. 2006. “Plea Bargains Only for the Guilty.” Journal of Law and Economics49:353–64.10.1086/501084Suche in Google Scholar
Baum, L.1980. “Responses of Federal District Judges to Court of Appeals Policies: An Exploration.” Western Political Quarterly33(2):217–24.10.1177/106591298003300205Suche in Google Scholar
Bureau of Justice Statistics, Federal Justice Statistics Program. 1997a. Defendants Sentenced Under the Guidelines during Fiscal Year 1996: SC96OUT. Washington, DC: The Urban Institute (distributor).Suche in Google Scholar
Bureau of Justice Statistics, Federal Justice Statistics Program. 1997b. Defendants Sentenced Under the Guidelines during Fiscal Year 1997: SC97OUT. Washington, DC: The Urban Institute (distributor).Suche in Google Scholar
Bureau of Justice Statistics, Federal Justice Statistics Program. 1998. “Defendants Sentenced Under the Guidelines during Fiscal Year 1998: SC98OUT.” Washington, DC: The Urban Institute (distributor).Suche in Google Scholar
Bureau of Justice Statistics, Federal Justice Statistics Program. 1999. “Defendants Sentenced Under the Guidelines during Fiscal Year 1999: SC99OUT.” Washington, DC: The Urban Institute (distributor).Suche in Google Scholar
Bureau of Justice Statistics, Federal Justice Statistics Program. 2000. “Defendants Sentenced Under the Guidelines during Fiscal Year 2000: SC00OUT.” Washington, DC: The Urban Institute (distributor).Suche in Google Scholar
Bureau of Justice Statistics, Federal Justice Statistics Program. 2001. “Defendants Sentenced Under the Guidelines during Fiscal Year 2001: SC01OUT.” Washington, DC: The Urban Institute (distributor).Suche in Google Scholar
Bureau of Justice Statistics, Federal Justice Statistics Program. 2002. “Defendants Sentenced Under the Guidelines during Fiscal Year 2002: SC02OUT.” Washington, DC: The Urban Institute (distributor).Suche in Google Scholar
Bushway, S. D., and J. B.Gelbach. 2010. “Testing for Racial Discrimination in Bail Setting Using Nonparametric Estimation of a Parametric Model,” Mimeo.10.2139/ssrn.1632632Suche in Google Scholar
Cox, J., and R. L.Oaxaca. 1982. “The Political Economy of Minimum Wage Legislation.” Economic Inquiry20(4):533–55.10.1111/j.1465-7295.1982.tb00365.xSuche in Google Scholar
King, N., and M.O’Neill. 2005. “Appeal Waivers and Future of Sentencing Policy.” Duke Law Journal55(2):209–62.Suche in Google Scholar
Lacasse, C., and A.Abigail Payne. 1999. “Federal Sentencing Guidelines and Mandatory Minimum Sentences: Do Defendants Bargain in the Shadow of the Judge?” Journal of Law and Economics42(1, Part 2):245–69.Suche in Google Scholar
Miceli, T. J.2008. “Criminal Sentencing Guidelines and Judicial Discretion.” Contemporary Economic Policy26(2):207–15.10.1111/j.1465-7287.2007.00065.xSuche in Google Scholar
Mustard, D. B.2001. “Racial, Ethnic, and Gender Disparities in Sentencing: Evidence From the U.S. Federal Courts.” Journal of Law and Economics44:285–314.10.1086/320276Suche in Google Scholar
Neumark, D.1988. “Employers’ Discriminatory Behavior and the Estimation of Wage Discrimination.” Journal of Human Resources23:279–95.10.2307/145830Suche in Google Scholar
Nutting, A.2013. “The Booker Decision and Discrimination in Federal Criminal Sentences.” Economic Inquiry51(1):637–52.10.1111/j.1465-7295.2011.00449.xSuche in Google Scholar
Oaxaca, R. L.1973. “Male-Female Wage Differentials in Urban Labor Markets.” International Economic Review14(3):693–709.10.2307/2525981Suche in Google Scholar
Oaxaca, R. L., and M. R.Ransom. 1988. “Searching for the Effect of Unionism on the Wages of Union and Nonunion Workers.” Journal of Labor Research9:139–48.10.1007/BF02685237Suche in Google Scholar
Oaxaca, R. L., and M. R.Ransom. 1994. “On Discrimination and the Decomposition of Wage Differentials.” Journal of Econometrics61(1):5–21.10.1016/0304-4076(94)90074-4Suche in Google Scholar
Posner, R.1993. “What Do Judges and Justices Maximize.” Supreme Court Economic Review3:1–41.10.1086/scer.3.1147064Suche in Google Scholar
Rehavi, M. M., and S. B.Starr (2012). “Racial Disparity in Federal Criminal Charging and Its Sentencing Consequences,” University of Michigan Law & Economics, Empirical Legal Studies Center Paper No. 12-002. Available at SSRN: http://ssrn.com/abstract=1985377 or http://dx.doi.org/10.2139/ssrn.198537710.2139/ssrn.1985377Suche in Google Scholar
Reinganum, J.1988. “Plea Bargaining and Prosecutorial Discretion.” American Economic Review78:713–28.Suche in Google Scholar
Reinganum, J.2000. “Sentencing Guidelines, Judicial Discretion, and Plea Bargaining.” RAND Journal of Economics31(1):62–81.10.2307/2601029Suche in Google Scholar
Schanzenbach, M.2005. “Racial and Sex Disparities in Prison Sentences: The Effect of District-Level Judicial Demographics.” Journal of Legal Studies34:57–92.10.1086/425597Suche in Google Scholar
Schazenbach, M., and E.Tiller. 2007. “Strategic Judging Under the United States Sentencing Guidelines: Positive Political Theory and Evidence.” Journal of Law, Economics and Organization23:24–56.10.1093/jleo/ewm002Suche in Google Scholar
Shavell, S.2005. “Optimal Discretion in the Application of Rules,” The Harvard John M. Olin Discussion Paper No. 509.10.2139/ssrn.716921Suche in Google Scholar
Sorensen, T., S.Sarnikar, and R. L.Oaxaca. 2012. “Race and Gender Differences under Federal Sentencing Guidelines.” The American Economic Review102(3):256–60.10.1257/aer.102.3.256Suche in Google Scholar
USSC. 2004. “United States Sentencing Commission: Fifteen Years of Guidelines Sentencing” (November), www.ussc.gov/15_year/15year.htmSuche in Google Scholar
Waldfogel, J.1998. “Does inter-Judge Disparity Justify Empirically Based Sentencing Guidelines?” International Review of Law and Economics18:293–304.10.1016/S0144-8188(98)00013-1Suche in Google Scholar
- 1
- 2
United States Sentencing Commission: Fifteen Years of Guidelines Sentencing (2004, 86).
- 3
Our raw dataset has around 380,000 observations. Our final dataset contains around 45,000 observations. Of the 340,000 observations that are lost in the data cleaning process, around 150,000 are a consequence of often missing data on the type of defense counsel. In the appendix, we confirm that our main results are robust to the inclusion or exclusion of these observations. Around 66,000 observations are lost on account of being non-citizens or of citizenship status being missing. We also explore the consequences of including these observations in our estimation in the appendix. Our age, gender, race, and ethnicity restrictions lose another 30,000 observations. In addition, around 19,000 observations involved substantial assistance departures and 19,000 included drug sentences with mandatory minimum sentences (and there were about 10,000 observations involving both; these observations were dropped for reasons discussed later).
- 4
The appendix also presents results confirming the robustness of our results to the inclusion of sentences handed down after a conviction by trial.
- 5
These figures were calculated using the OFFTYPE and OFFTYPE2 variables for the years 1996–1998 and 1999–2002, respectively.
- 6
Referred to by XFOLSOR and CRIMHIS, respectively.
- 7
For details on the construction of these variables, please see the following documents on the USSC’s website: http://www.ussc.gov/training/sent_ex_rob.pdf; http://www.ussc.gov/training/material.htm
- 8
This is the BASEHI variable in the raw data.
- 9
Though not a full interaction model, Mustard does offer interactions between the race, ethnicity, and gender indicators and the offense level and criminal history.
- 10
Many of these control factors, such as education and access to a private defense attorney may differ across race and gender as well. To the extent that differences in these factors result in an unequal distribution of resources across race and gender, our results represent a lower bound of unjustified differences in sentence length as a whole. However, our intention is to estimate how much of the sentence gap can be attributed to judicial bias. With the possible exception of the criminal severity score (discussed at more length elsewhere), the sentencing judge should have no influence over our control factors. Thus, they are appropriate to condition on if our intention is to estimate judicial bias in sentencing.
- 11
Full results from these linear estimates are available upon request from the authors.
- 12
We have allowed a total of 100 iterations before forcing convergence. In our main estimation, all models converged before reaching the maximum number of iterations, with the exception of the estimation for White females. In total, for the 13 robustness checks that we have run, the pooled model achieves convergence each time, as does the model for Black and White males and all but one time for Hispanic males. Convergence is achieved 9 of 13 times for Black females and for Hispanic females. We continue to have troubles achieving convergence for White females, where convergence is not achieved 10 of 13 times. However, our key finding of favoritism toward White females vis-à-vis White males is upheld in the estimations where convergence is achieved. These three cases correspond to a larger dataset (with drug minimum sentences and substantial assistance cooperators included).
- 13
In some instances, our model was not able to estimate standard errors on some coefficients for White females, one of the smallest demographic groups that we examine. However, to test our main hypothesis of whether there exists discrimination under the guidelines, inference will come from bootstrapped standard errors that do not require the calculation of standard errors on each of the individual parameters for each group.
- 14
In addition to race, sex, and national origin, the guidelines also exclude factors such as socioeconomic status, family ties and responsibilities, and (with only limited exceptions) age and education.
- 15
In Appendix Table A1, we report our expected sentences by group and parameters used. The table also shows the likelihood of being in each of six regimes (1) 0 sentence, (2) strictly positive but below lower end of guidelines, (3) at lower end of guidelines, (4) within guidelines, (5) at upper end of guidelines, (6) above upper end of guidelines, the expected value of the sentence for individuals that fell into each regime, as well as an overall expected value. Please note that the overall expected value is not necessarily equal to a weighted average of the expected values of individuals within each regime, due to non-linearities. Also note that our expected values are only able to be calculated for observations for which there is a non-zero minimum guideline, as the expected value calculation in the first regime for these observations would involve a zero in the denominator. Thus we have excluded observations that do not meet this criteria. This may limit the external validity of our study, but allows us to consistently study the gaps between groups of the set of observations that do meet this criteria in our data.
- 16
Here, the departure is exactly at the threshold below which we would consider the departure to be “large.” It is important to take note of this mass point, just as we have for the mass points at the edge of the guidelines: there is a non-differentiable change in the marginal utility of changing the sentence at this point. Thus, there will be individual sentences for which the judge might prefer a slightly lower sentence, but is not willing to pay the increased utility cost. Here, we do note that the choice of
 is somewhat arbitrary in the sense that there is not a natural threshold at which there should be a statutorily driven increase in the cost of departure. However, should
  exist, our theory tells us that there would be a mass point observed. As a first approximation we pick
  to equal 6 months for both upward and downward departures.
©2014 by Walter de Gruyter Berlin / Boston
Artikel in diesem Heft
- Frontmatter
- Contributions
- Do You Receive a Lighter Prison Sentence Because You Are a Woman or a White? An Economic Analysis of the Federal Criminal Sentencing Guidelines
- Income Distribution and the Occupational Choices of Entrepreneurs
- Determinants of Research Production at Top US Universities
- In Whom We Trust: The Role of Certification Agencies in Online Drug Markets
- The Effect of College Applications on Enrollment
- Topics
- Market-Induced Rationalization and Welfare-Enhancing Cartels
- Food Insecurity and SNAP Participation in Mexican Immigrant Families: The Impact of the Outreach Initiative
- Profit-Seeking Behavior of Medical Providers and Generic Competition in the Pharmaceutical Market: Evidence from Taiwan
- Anticipated Regret or Endowment Effect? A Reconsideration of Exchange Asymmetry in Laboratory Experiments
- New Labour? The Effects of Migration from Central and Eastern Europe on Unemployment and Wages in the UK