Impact of Voucher Design on Public School Performance: Evidence from Florida and Milwaukee Voucher Programs
-
Rajashri Chakrabarti


Abstract
This article compares two alternative voucher designs implemented in the U.S. The Milwaukee program was a “voucher shock” program that made low-income students eligible for vouchers. The Florida program was an accountability-tied voucher program that faced failing schools with “threat of vouchers” and stigma. In the context of a formal theoretical model, the study argues that the threatened schools will improve under the Florida-type program and this improvement will exceed that of the corresponding treated schools under the Milwaukee-type program. Using school-level scores from Florida and Wisconsin, and a difference-in-differences estimation strategy in trends, it then finds strong support in favor of these predictions.
Acknowledgments
I thank Robin Boadway, Steve Coate, Julie Berry Cullen, Ron Ehrenberg, Dennis Epple, David Figlio, Caroline Hoxby, Brian Jacob, Miguel Urquiola, Mike Waldman and seminar participants at Cornell University, New York University, North-western University, University of Georgia, American Economic Association meetings, Econometric Society Meetings, Southern Economic Association Meetings, American Education Finance Association Conference and Society of Labor Economists Conference for helpful discussions, and the Program on Education Policy and Governance at Harvard University for its postdoctoral support. The views expressed here are those of the author and do not necessarily reflect the position of the Federal Reserve Bank of New York or the Federal Reserve System. All errors are my own.
Appendix A: Proofs of Results
Claim 1: Equilibrium number of public school students falls with vouchers and increases with effort.
Proof. Step 1: Equilibrium peer-group quality falls with vouchers and increases with effort. Effect of an increase in e:

The denominator is positive from uniqueness. Consider
![[7]](/document/doi/10.1515/bejeap-2012-0037/asset/graphic/bejeap-2012-0037_eq7.png)
For any y,  , which is positive. Therefore, A.1
 0.
0.
It can be checked that  .
.  is inversely related to y. If for some large y,
  , then there must exist some y
 y1, y1 ∈ (0, 1) such that
  . Then,

Effect of an increase in v:

The denominator is positive from uniqueness. Since eq. [7]  0,
0,  ,
,  and
and  is inversely related to y, the numerator is negative. Therefore,
  .
.
Step 2: Equilibrium cutoff ability at each income level falls with vouchers and increases with effort.
Follows from  and
and 
 and step 1.
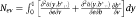
From step 2 and definition of N(b ,.), the proof follows.
Proof of Proposition 1. Under the VS program, eVS solves the first-order condition: 
Comparative statics with respect to v yields:
![[8]](/document/doi/10.1515/bejeap-2012-0037/asset/graphic/bejeap-2012-0037_eq8.png)
The denominator is negative from the strict concavity of the rent function. Also p − cN 0 and
0 and  .
.  .
.  from Claim 1. It can be seen that
  and
and  . Therefore,
  which implies that eq. [8]
  . ■
. ■
Proof of Proposition 2.
Proof of part (i):  , since vouchers decrease rent. By the strict concavity of the rent function,
  that satisfies the public school’s incentive constraint under TOV with equality

Proof of part (ii):  . The first inequality follows, because ePP is the rent maximizing effort under
  . Given strict concavity of the rent function,
  that satisfies the public school’s incentive constraint under TOV with equality. ■
Appendix B: Moral Hazard Problem – Unobservable Public School Effort
This appendix relaxes the assumption of complete observability of public school effort and examines whether under unobservable public school effort, the equilibrium effort under the TOV program still exceeds those under the PP and the VS programs. Given public school effort e ∈ [emin, emax], “effective effort” e′ is realized according to the distribution F(e′/e), where e′ ∈ [e′min, e′max]. Although e is not publicly observable, all agents have complete knowledge of the set [emin, emax] and the family of conditional distributions F(e′/e) for e ∈ [emin, emax]. The corresponding density f(e′/e) satisfies the strict monotone likelihood ratio property (MLRP). F(e′/e) satisfies the convexity of the distribution function condition (CDFC), i.e. Fee(e′/e)> 0 for all e′ ∈ [e′min, e′max] and e ∈ [emin, emax]. Public school quality (q q(e′, b)) is a composite of two factors: (i) “effective effort” e′ and (ii) peer-group quality (b) and can be thought of as being embodied in school scores. All agents observe quality q but not the actual public school effort e that generated it. The uncertainty signifies the absence of any direct one-to-one relationship between the effort of teachers and administrators, and school scores.
The simple public–private system, the Milwaukee-type VS program and the Florida-type TOV program are modeled as follows. The public–private system has two stages. In the first stage, the public school chooses effort which is not observable by the other agents of the economy. Quality q is realized and observed by all agents in the economy. In stage 2, households choose between schools. The VS program consists of three stages: In the first stage, the government announces the voucher v. In stage 2, facing v, the public school chooses effort which is not observable. Quality is realized and observed by all agents in the economy. In stage 3, households choose between schools. The Florida program is modeled in four stages: In the first stage, the government announces the program and a cutoff quality level  and voucher v. In stage 2, the public school chooses effort. Quality is realized and observed by all agents in the economy. In stage 3, government imposes vouchers if
  . No voucher is imposed if
  . In the final stage, households choose between schools.
Household behavior is basically the same as earlier, the only difference is that instead of using effort itself, they use a noisy representation of effort, effective effort e′ to make their school choices. The public school anticipates household behavior and chooses e to maximize expected rent:  where v
 0 under the public–private system. The expected rent function is strictly concave under CDFC.
Equilibrium public school effort under the VS program can be either greater or less than the PP system. (Proof available on request.) The intuition behind this is as follows. With imposition of vouchers, rent falls at each realization of e′. An increase in e increases the probability of higher e′ realizations. However, the above fall in rent can either increase or decrease in e′. This implies that vouchers may induce public schools to correspondingly decrease or increase effort in response to vouchers.
Under the Florida TOV program, the public school faces a quality cutoff  or equivalently an “effective effort” cutoff
  and chooses e to maximize its expected rent. The school’s expected rent under the TOV program is given by the following. Under CDFC, H is strictly concave in e.

Proposition 3(i) There exists ,
,  such that if the cutoff
 the effort under the “threat of voucher” program unambiguously exceeds that under the “voucher shock” program i.e. eTOV
 eVS. (ii) There exists
 ,
,  such that if the cutoff
 the effort under the “threat of voucher” program unambiguously exceeds that under the pre-program public–private equilibrium, i.e. eTOV > ePP.
The intuitive argument behind this proposition is as follows. First consider the TOV and the VS programs. Facing the TOV program, if the school chooses eVS (the equilibrium effort under the VS program), then at each realization of  , its rent is the same as in the VS program. On the other hand, for each realization of
  , its rent is higher. Therefore, the school chooses an effort strictly higher than eVS to increase its probability of falling above
  , since it follows from the MLRP that an increase in effort increases the probability of higher e′s. The intuition behind
  is similar. Choosing ePP under the TOV gives it the same rent as the PP program at each realization above
  but lower rent at each realization below
  . The school chooses an effort strictly above ePP to increase (decrease) the probability of realizations above (below)
  .32 Thus, the results here parallel those in the complete information model (Proposition 2).
Appendix C: Proof of Result in Appendix B
Proof of Proposition 3. Proof of part (i): Evaluating the first-order condition under the TOV program at eVS:

where  (e′, v)
  [r(e′, 0) − r(e′, v)[ and r(e′, V)
  pN(e′, V) − c(N(e′, V)), V
 {0, v}. MLRP implies that there exists E1,
  according as
  . Now if the cutoff
  , then
  , since
  (e′, v)
 0 so that
  . There are two cases if
  . Let
. Let 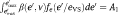 . Although
  according as
  ,
,  (e′, v) may be increasing or decreasing in e′. Therefore,
  . (Note that
  implies
  ).
).
Case 1: If A1 0 then for any
  ,
,  and eTOV
 eVS.
eVS.
Case 2: If A1 0 then
  such that
  then for any
  ,
,  and eTOV
 eVS.
eVS.
Using cases (1) and (2) define  . Then, for any
  , eTOV
 eVS. Note that
  according as
  .
.
Proof of part (ii): Evaluating the first-order condition under the TOV program at ePP:

MLRP implies that there exists E2,  according as
  . Now if the cutoff
  then
then  , so that eTOV > ePP. There are two cases if
  . Let
. Let 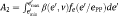 .
.
Again similarly as above  . (Note that
  implies
  ).
).
Case 1: If A2 0 then for any
  and eTOV > ePP.
Case 2: If A2 0 then
  such that
  then for any
  ,
,  and eTOV > ePP.
Using cases (1) and (2) define  . Then for any
  , eTOV > ePP. Note that
  according as
  . ■
. ■
References
Chakrabarti, Rajashri. 2008a. “Impact of Voucher Design on Public School Performance: Evidence from Florida and Milwaukee Voucher Programs.” Federal Reserve Bank of New York Staff Paper Number 315.10.2139/ssrn.1086772Search in Google Scholar
Chakrabarti, Rajashri. 2008b. “Can Increasing Private School Participation and Monetary Lossina Voucher Program Affect Public School Performance? Evidence from Milwaukee.” Journal of Public Economics 92(5–6):1371–93.10.1016/j.jpubeco.2007.06.009Search in Google Scholar
Chakrabarti, Rajashri. 2009. “Do Vouchers Lead to Sorting Even Under Random Private School Selection? Evidence from Milwaukee.” Federal Reserve Bank of New York Staff Paper Number 379.10.2139/ssrn.1432533Search in Google Scholar
Chakrabarti, Rajashri. 2013. “Vouchers, Public School Response and the Role of Incentives: Evidence from Florida.” Economic Inquiry 51(1):500–526.10.1111/j.1465-7295.2012.00455.xSearch in Google Scholar
Chiang, Hanley. 2009. “How Accountability Pressure on Failing Schools Affects Student Achievement.”Journal of Public Economics 93(9–10):1045–57.10.1016/j.jpubeco.2009.06.002Search in Google Scholar
Epple, Dennis, and Richard Romano. 1998. “Competition between Privateand Public Schools, Vouchers and Peer Group Effects.” American Economic Review 62(1):33–62.Search in Google Scholar
Epple, Dennis, and Richard Romano. 2008. “Educational Vouchers and Cream Skimming.” International Economic Review 9(4):1395–35.10.1111/j.1468-2354.2008.00516.xSearch in Google Scholar
Ferreyra, Marta M, and Pierre J. Liang. 2012. “Information Asymmetry and Equilibrium Monitoring in Education.” Journal of Public Economics 96:237–54.10.1016/j.jpubeco.2011.07.012Search in Google Scholar
Figlio, David, and Maurice Lucas. 2004. “What’s in a Grade? School Report Cards and the Housing Market.” American Economic Review 94(3):591–604.10.1257/0002828041464489Search in Google Scholar
Figlio, David, and Cecilia Rouse. 2006. “Do Accountability and Voucher Threats Improve Low-Performing Schools?” Journal of Public Economics 90(1–2):239–55.10.1016/j.jpubeco.2005.08.005Search in Google Scholar
Greene, Jay. 2001. An Evaluation of the Florida A-Plus Accountability and School Choice Program. New York: Manhattan Institute for Policy Research.Search in Google Scholar
Greene, Jay P, and Marcus A. Winters. 2003. “When Schools Compete: The Effects of Vouchers on Florida Public School Achievement.” Education Working Paper 2.Search in Google Scholar
Hoxby, Caroline. 2003a. “School Choice and School Productivity (Or, Could School Choice be the tide that lifts all boats?).” In The Economics of School Choice, edited by C. Hoxby. Chicago: University of Chicago Press.10.7208/chicago/9780226355344.001.0001Search in Google Scholar
Hoxby, Caroline. 2003b. “School Choice and School Competition: Evidence from the United States.” Swedish Economic Policy Review 10:11–67.Search in Google Scholar
Innerst, Carol. 2000. “Competing to Win: How Florida’s A+ Plan Has Triggered Public School Reform.” The Center for Education Reform.Search in Google Scholar
Kane, T. J, and D. O. Staiger. 2002b. “Volatility in Test Scores: Implications for Test-Based Accountability Systems.” In Brookings Papers on Education Policy, edited by D. Ravitch, 235–83. Washington, DC: Brookings Institution Press.10.1353/pep.2002.0010Search in Google Scholar
Manski, Charles F. 1992. “Educational Choice (Vouchers) and Social Mobility.” Economics of Education Review 11(4):351–69.10.1016/0272-7757(92)90042-2Search in Google Scholar
McMillan, Robert. 2004. “Competition, Incentives, and Public School Productivity.” Journal of Public Economics 88:1871–92.10.1016/j.jpubeco.2003.06.003Search in Google Scholar
National Commission of Excellence in Education. 1983. A Nation at Risk: The Imperative for Educational Reform. Washington, DC: U.S. Government Printing Office.Search in Google Scholar
Neal, Derek. 2009. “Designing Incentive Systems for Schools.” In Performance Incentives: Their Growing Impact on American K-12 Education, edited by M. Springer. Washington, DC: Brookings Institution Press.Search in Google Scholar
Nechyba, Thomas J. 1996. “Public School Finance in a General Equilibrium Tiebout World: Equalization Programs, Peer Effects and Private School Vouchers.” NBER Working Paper # 5642.10.3386/w5642Search in Google Scholar
Nechyba, Thomas J. 1999. “School Finance Induced Migration Patterns: The case of Private School Vouchers.” Journal of Public Economic Theory 1(1):5–50.10.1111/1097-3923.00002Search in Google Scholar
Nechyba, Thomas J. 2000. “Mobility, Targeting, and Private-School Vouchers.” American Economic Review 90(1):130–46.10.1257/aer.90.1.130Search in Google Scholar
Nechyba, Thomas J. 2003. “Introducing School Choice into Multi-District Public School Systems.” In The Economics of School Choice, edited by C. Hoxby. Chicago: University of Chicago Press.10.7208/chicago/9780226355344.003.0006Search in Google Scholar
Rouse, Celia Elena, Hannaway, Jane, Goldhaber, Dan and Figlio, David. 2013. “Feeling the Florida Heat? How Low-Performing Schools Respond to Voucher and Accountability Pressure.” American Economic Journal: Economic Policy 5(2):251–281.10.1257/pol.5.2.251Search in Google Scholar
West, Martin, and Paul Peterson. 2006. “The Efficacy of Choice Threats Within Accountability Systems: Results from Legislatively Induced Experiments.” The Economic Journal 116:C46–62.10.1111/j.1468-0297.2006.01075.xSearch in Google Scholar
- 1
National Commission of Excellence in Education (1983),“A Nation at Risk: The Imperative for Educational Reform,” Washington, DC: U.S. Government Printing Office.
- 2
The Florida Department of Education (DOE) classified schools according to five grades: A, B, C, D, and F (A – highest, F – lowest). In 1999, 78 schools got an “F”, and students in two of those schools became eligible for vouchers. In 2000, four elementary schools got an F, although none became eligible for vouchers. In 2001, no school got an F. In 2002, 64 schools got an F. Students in 10 of those schools became eligible for vouchers.
- 3
I will focus on the Milwaukee program up to 1996–1997. This is because following a 1998 Wisconsin Supreme Court ruling, there was a major shift in the program when religious private schools were allowed to participate in the program and the program entered into its second phase. Moreover, financing of the Milwaukee program saw some crucial changes, so that voucher amounts and revenue loss per student due to vouchers were not comparable between Florida and second-phase Milwaukee.
- 4
Neal (2009) also argues that choice and accountability should not be seen as policy substitutes, but argues in favor of combining both policies.
- 5
It should be noted here that the combination of private school vouchers and public school monitoring modeled in Ferreyra and Liang (2012) is different from the TOV scheme modeled in this article. In the vouchers – public monitoring scheme that they model, vouchers are already imposed. In addition, they supplement this voucher system with public monitoring. In contrast, the key feature of the TOV system is that vouchers are not already imposed. Rather, the policymaker issues a threat or establishes a target/cutoff, and vouchers are introduced only if the school fails to meet that cutoff. Also, while the policy intervention in the case of TOV is announcement of a cutoff, the public monitoring in Ferreyra and Liang (2012) takes the form of “detailed evaluations of public school performance, direct observation of classroom and administrative practices etc.,” and is costly.
- 6
The Cleveland voucher program (implemented in the 1995–1996 school year), the District of Columbia voucher program (implemented 2004–2005) and the Indiana voucher program (implemented 2011–2012) are also of the VS type, while the Ohio voucher program (implemented 2006–2007), and Louisiana voucher program (implemented 2012–2013) are of the TOV type. Among the VS-type programs, the Milwaukee program is the oldest; while among the TOV-type programs, Florida program is the oldest. Another crucial aspect is that apart from the differences in designs highlighted in the article (VS versus TOV), the other features of the programs were very similar between the Florida and Milwaukee programs (which is essential for credible comparisons of the VS and TOV designs). As a result, I focus on the Milwaukee and Florida programs.
- 7
Exceptions are Figlio and Rouse (2006) that control for all three, Hoxby (2003b) that controls for differences in pre-existing trends, and Peterson and West (2006) that controls for changes in student composition of schools. Unlike this study, the analysis in Figlio and Rouse (2006) focuses on the low stakes test. While Greene (2001) and Greene and Winters (2003) attempt to assess mean-reversion effect, their analysis is based on post-program effects of schools. Hence, any mean-reversion effect is likely to be confounded with post-program response of schools. For a more detailed literature review as well as effect on low stakes test scores in Florida, see Chakrabarti (2008a).
- 8
For the remainder of the article, I will refer to school years by the calendar year of the spring semester.
- 9
All results continue to hold if public schools are assumed to maximize enrollment subject to cost. An alternative formulation could be to model the public school as a quality maximizer. However, in that case, there would be no argument for voucher programs as far as improving public school quality is concerned.
- 10
Note that at equilibrium, private school quality will always exceed public school quality. Otherwise, no household would pay to attend a private school. Chakrabarti (2009) shows that for voucher students, random selection by private schools has indeed taken place.
- 11
Public school quality can be thought of as being embodied in public school scores. The notion here is that public school scores reflect both public school effort and public school peer-group quality, which in turn depends on the abilities of the public school students. In other words, both public school and student characteristics contribute to school scores.
- 12
For proofs and discussion of existence and uniqueness of equilibrium, see working paper version of this article, Chakrabarti (2008a). The equilibrium is unique, if the marginal utility from peer quality is not too high.
- 13
 . There are two effects. Vouchers lead to an exodus of relatively high-ability households (at each income level) to private schools, so that the new marginal household has a relatively lower marginal valuation of quality. Consequently, the number of students gained due to a marginal increase in effort is lower under vouchers. This is captured by the negative first term. Second, since the marginal utility from school quality decreases with quality (uqq
 0), the marginal number of students due to an increase in effort decreases with an increase in peer quality
  . Since vouchers lead to a fall in peer quality, the marginal number of students increases due to this factor (which is captured by the positive second term).
 - 14
Note that since peer quality is known, announcing a cutoff in terms of effort is equivalent to announcing a corresponding cutoff in terms of quality.
- 15
The intuition can be laid down in two steps. Call the VS program where all students are eligible the universal voucher shock (UVS) program and where only the low-income students are eligible the targeted voucher shock (TVS) program and the corresponding equilibrium number of students and equilibrium effort NUVS, NTVS, and eUVS, eTVS, respectively. First, note that the equilibrium rent under the TVS is greater than that under the UVS. Under the TVS, the school can attract NUVS students by giving a lower effort than under the UVS (follows from the discussion earlier and Claim 1 in Appendix A) and hence at a rent higher than under the UVS. Since the school chooses to attract NTVS students, it must be the case that rent is higher under the TVS. Second, if vouchers when imposed in the Florida-type TOV program took a targeted form, then following the argument in Proposition 2(i), the program could implement a cutoff
 . But vouchers take the universal form in Florida, which implies that the rent would be smaller than the TVS rent if the school failed to meet the cutoff. This implies that there exists a cutoff
  which satisfies the school’s incentive constraint with equality and hence can be implemented by the TOV program. Any cutoff in the range
  induces higher effort under the TOV program than under the TVS program. To summarize the above discussion, there are two features in the design of the Florida TOV that induce a higher effort than the TVS: (i) vouchers are not already imposed and (ii) the potential loss of students is greater. But, as it follows from the above discussion, the first factor is sufficient to induce a higher effort under the TOV.
 - 16
In the TOV program, it may be reasonable to think that there is a stigma attached to being labeled as a “voucher public school”. For example, Maureen Backentoss, assistant superintendent of curriculum and instruction of Lake County School District, refers to it as a “glass of cold water in the face.” In the presence of such a stigma, the public schools gain an additional utility if they are able to escape vouchers. This feature is absent in the VS program. Note that this will weigh results in favor of the TOV and will induce an even higher improvement under the TOV.
- 17
It follows from the above discussion that the corollary holds not just for the UVS system but also the TVS system.
- 18
The measure of public (private) competition here is the number of public (private) schools within a certain radius. I use 1, 2, 3, and 5 mile radii.
- 19
I restrict my analysis to elementary schools in both Florida and Milwaukee, as there were too few treated middle and high schools in the respective places to justify analysis.
- 20
In fact, there is some anecdotal evidence that D schools might have responded to the program. The superintendent of Hillsborough county, which had no F schools in 1999, announced that he would take a 5% pay cut if any of his 37 D schools received an F on the next school report card. (For more evidence, see Innerst 2000).
- 21
While 175% was the cutoff poverty level for eligibility, this cutoff was not strictly enforced (Hoxby 2003b) and households within this 10% margin (175% and free or reduced-price lunch eligibility cutoff 185%) were often allowed to apply. Also there were very few students who fell in the 175–185% range.
- 22
Note that the test scores under consideration in Florida are high stakes FCAT test scores. Since the threat in the Florida program was given in terms of grade, the response of the Florida threatened schools has to be assessed in terms of the high stakes test. Since this study is interested in examining the response of the threatened schools, it focuses on the high stakes tests in Florida. For example, even if there is no improvement in the low stakes test, it cannot be concluded that the public schools did not respond to the program. The tests under consideration in Wisconsin are state tests (WRCT or WKCE) and district test (ITBS). These tests are low stakes. Note that the comparison of the effects on the more treated schools in the two places in terms of these tests is legitimate, as the Florida FCAT tests are high stakes to the threatened schools precisely because of the Florida accountability-tied voucher system, that is, the Florida accountability-tied voucher program had the capacity to make the corresponding tests high stakes unlike the Milwaukee-type voucher program (that did not have an accountability component).
- 23
When data are available for only 2 years before program (for example, reading and math), the pre-program difference between treatment and control groups can be either a trend difference or a year effect. Specification 1 controls for this pre-program difference assuming it is a trend difference, and specification 3 controls for it assuming this difference is a year effect. Results from regressions without controlling for these pre-program differences are qualitatively similar.
- 24
In many of the tables, only the fixed-effects estimates are reported. The OLS results are very similar to the FE estimates and hence are omitted.
- 25
It should be noted here that both F and D schools received additional funds from the state. However, all results above are obtained after controlling for real per pupil expenditure. The results neither are sensitive to inclusion of real per pupil expenditure nor do change after including a polynomial in real per pupil expenditure. Moreover, even in the pre-1999 period, the critically low performing schools received extra assistance – however, this did not result in improved performance of this group in this period, as Table 4 shows in a different context.
- 26
I also consider two corresponding discontinuity samples where both groups fail the minimum criteria in reading and writing (math and writing). F schools fail the minimum criteria in math (reading) also, unlike D schools. In these samples, the probability of treatment changes discontinuously as a function of the percentage of students at or above level 2 in math (reading), and there is a sharp cutoff at 60%.
- 27
I do not use the pre-1999 reading and math NRT scores, because different districts used different NRTs during this period, which varied in content and norms. Also districts often chose different NRTs in different years. Thus, these NRTs were not comparable across districts and across time. Moreover, since districts could choose the specific NRT to administer each year, the choice was likely related to time varying (and also time-invariant) district unobservable characteristics which also affected test scores.
- 28
I would like to thank David Figlio for suggesting this strategy.
- 29
Figlio and Lucas (2004) find that following the first assignment of school grades in Florida, the better students differentially selected into schools receiving grades of “A,” though this differential sorting tapered off over time.
- 30
I also do a pair-wise non-parametric test (sign test), where I ignore the significance of coefficients and consider only their signs. Under the null of equal effects, the probability that any one effect size in Florida exceeds the corresponding one in Milwaukee is
 . Under the null, D
 Florida effect–Milwaukee effect follows a binomial distribution. D is positive in all cases. The probability of getting all positive D under the null is very small, and hence, the null of equal effects can be comfortably rejected.
 - 31
It might be worth comparing these effect sizes with those obtained in the literature. Greene (2001) and Figlio and Rouse (2006) study the effect of the 1999 Florida program on F schools in the first year after program. Greene (2001) finds F-school effects (relative to C schools) to be 0.42 standard deviations in reading and 0.67 standard deviations in math, while Figlio and Rouse (2006) finds 0.09 of a standard deviation improvement in reading and 0.23 of a standard deviation improvement in math for the F schools. These effects are not directly comparable to those in this study due to the differences in methodology, specifications, and samples. For example, the estimates in Greene (2001) do not control for mean reversion or pre-program trends or changes in demographic compositions of schools. The effects in Figlio and Rouse (2006) are relative to all higher-graded schools (so their comparison group was different), do not control for pre-existing trends or mean reversion, and also pertain to data on the group of Florida districts for which they had micro-data. Note that the main focus of Figlio and Rouse (2006) was looking at low stakes tests (not high stakes tests, so the estimates above are their initial estimates). Chiang (2009) and Rouse et al. (forthcoming) look at the second phase of the Florida program after the 2002 changes. Thus, they look at a different time period and the program parameters had also changed, and their methodology and samples were also different, so their effect sizes are not directly comparable to those in this article. Using a RD estimation strategy with a 28-point bandwidth, Chiang finds effect sizes of 0.11 in reading and 0.12 in math 1 year after the program shift. Rouse et al. (forthcoming) finds 0.6–0.14 standard deviation effect sizes in math and 0.6–0.10 standard deviations effect in reading for F schools (relative to the sample of all higher-graded schools) also 1 year after the program shift.
- 32
However, although rent falls at each realization of e′ with vouchers, this fall (or alternatively, the gain in rent from avoiding vouchers) may either increase or decrease with e′. Depending on this, under certain circumstances as Proposition 3 indicates, at very low levels of cutoff, the public school effort under TOV may be less than VS and at very high levels of cutoff, effort under TOV may be less than PP. The intuition is as follows. First consider TOV versus VS. If
 is low, schools escape vouchers for low values of e′ also. If it is the case that the gain in rent from avoiding vouchers is largest for lower values of e′, then since an increase in effort decreases the probability of occurrence of lower values of e′, public school may find it profitable not to increase effort. Now, consider TOV versus PP. If
  is high, vouchers will be incurred at high values of e′ also. If it is the case that the fall in rent due to vouchers is highest for high values of e′, then the school may not have an incentive to increase effort since an increase in effort increases the probability of occurrence of higher values of e′.
©2013 by Walter de Gruyter Berlin / Boston
Articles in the same Issue
- Masthead
- Masthead
- Contributions
- Women Rule: Preferences and Fertility in Australian Households
- Can Land Reform Avoid a Left Turn? Evidence from Chile after the Cuban Revolution
- Incentive Effects of Parents’ Transfers to Children: An Artefactual Field Experiment
- Reclassification and Academic Success among English Language Learners: New Evidence from a Large Urban School District
- Fairness, Search Frictions, and Offshoring
- The Incentive Effect of Equalization Grants on Tax Collection
- Why Have Labour Market Outcomes of Youth in Advanced Economies Deteriorated?
- A Commitment Theory of Subsidy Agreements
- The Effects of Transactions Costs and Social Distance: Evidence from a Field Experiment
- Syphilis Cycles
- Impact of Voucher Design on Public School Performance: Evidence from Florida and Milwaukee Voucher Programs
- Topics
- Outsourcing and Innovation: An Empirical Exploration of the Dynamic Relationship
- Economies of Scope, Entry Deterrence and Welfare
- Can Horizontal Mergers Without Synergies Increase Consumer Welfare? Cournot and Bertrand Competition Under Uncertain Demand
- Institutions and information in multilateral bargaining experiments