Prediction of sensory textures of cosmetics using large amplitude oscillatory shear and extensional rheology
-
Hyo-Jeong Lee


Abstract
We propose a predictive model for various sensory textures utilizing machine learning techniques based on the largest rheology and panel-tested sensory texture database ever assembled. In addition to the conventional rheological parameters typically measured in the cosmetics field, rheological parameters obtained from the large amplitude oscillatory shear (LAOS) sequence of physical processes (SPPs) and extensional rheology analyses are employed as feature variables for the predictive model. These feature variables are chosen to mimic real flow conditions during the usage of cosmetics, such as rubbing and tapping, as they are expected to contain more information related to sensory textures. It has been demonstrated that our prediction model, based on the random forest regression algorithm, can effectively predict five sensory textures: spreadability, thickness, softness, adhesiveness, and stickiness. We investigated the rheological characteristics crucial for determining each sensory texture through permutation and feature importance analyses. The important analysis highlighted the close correlation between rheological parameters from LAOS–SPP, extensional analyses, and sensory textures. By using this correlation, we interpret the perception of each sensory texture in the context of rheology.
1 Introduction
Sensory texture holds a pivotal role in shaping the consumer experience and overall satisfaction with a wide array of everyday products, including cosmetics and food items [1,2,3,4]. The panel test, such as quantitative descriptive analysis (QDA) and spectrum descriptive analysis, has been the most common and direct approach used to assess the sensory texture of cosmetics [4,5,6,7]. Although panel test-based methods have traditionally been valuable for sensory texture analysis, their utility has been constrained by inherent limitations. These limitations encompass their time-consuming nature, high cost, labor-intensive requirements, and susceptibility to the influence of extraneous factors. In recent times, there has been a notable shift toward correlating the sensory texture of cosmetics with instrumental measurements, with a particular focus on rheological measurements [8,9,10,11,12,13,14]. This approach is favored for its economic efficiency, speed, and objectivity.
Previous studies have uncovered meaningful relationships between the sensory texture of cosmetic formulations and their rheological properties [11,12,13,14]. However, these studies have often established predictive models on the basis of the assumption of a linear, semilogarithmic, or logarithmic relationship between sensory textures and rheological properties, in accordance with the prevailing assumptions in psychophysics. Such a straightforward way of constructing a prediction model was inadequate to quantitatively capture the complicated correlation between sensory texture and rheological measurements. Therefore, the accurate estimation of sensory texture using rheological measures, which requires a thorough comprehension of the complex relationship between the two, has proven to be challenging. Notably, advancements in machine learning methods now allow for a deeper understanding of the complex relationship between rheology and the sensory texture of cosmetics. Our previous research has demonstrated that by combining rheological measurements with machine learning techniques, we can quantitatively predict the sensory texture of cosmetic formulations [15]. This approach effectively captures the complex nonlinear relationship between them. The successful development of a prediction model for spreadability has demonstrated the potential for achieving a quantitative understanding of various sensory textures other than spreadability through the integration of rheological measurements and machine learning techniques.
In the development of a predictive model for sensory texture in cosmetic products, the integration of rheological data with machine learning algorithms is crucial. Paramount to this process is the precise identification and selection of relevant rheological parameters that will serve as feature variables. These parameters must exhibit a robust and strong correlation with the specific sensory textures targeted by the model. A wrong choice of rheological parameters would squander time, considering the time-consuming process of establishing a database of such parameters, and diminish prediction performance. In the cosmetics industry, relatively simple rheological measurements such as steady shear viscosity and yield stress, which can be conveniently assessed using a viscometer or an affordable rheometer, have traditionally been used as feature variables. However, an effective strategy for selecting rheological parameters, as suggested by the previous study, involves utilizing rheological measurements under flow conditions that closely resemble the actual utilization process of cosmetic products. For instance, machine learning models with parameters from large amplitude oscillatory shear (LAOS), the flow conditions of which are similar to that of the cosmetics rubbing process, have been shown to be more accurate and effective in spreadability prediction than prediction models with rheological parameters that have been conventionally employed without consideration of flow condition under actual utilization process [4,16,17]. Similarly, extensional rheological parameters hold the potential to play a pivotal role in discerning the sensory textures of cosmetics, despite, to our knowledge, not having been investigated. This can be particularly relevant since the application process of cosmetics often involves tapping or other forms of manipulation that subject cosmetic formulations to extensional deformation.
The prior study, which combined rheology and machine learning techniques for sensory texture prediction, leaves considerable room for improvement from two distinct perspectives. One crucial determinant of the accuracy and utility of the sensory texture prediction model is the size and diversity of the sample dataset. A larger and more diverse dataset encompassing rheological parameters and sensory textures from a wide range of cosmetic formulations enhances the accuracy and broadens the operational range of the sensory texture prediction model. However, establishing a dataset of rheology and sensory textures requires a substantial quantity of time and money. To the best of our knowledge, our previous work with 77 datasets of cosmetic formulations made use of the largest data [15]. Although the spreadability prediction model from the previous study demonstrated adequate performance, it is always preferable to introduce a larger dataset to improve model accuracy and operational range. In addition, the earlier research is constrained in its scope, focusing exclusively on the prediction of a single sensory texture, namely, spreadability, whereas the cosmetics industry and the psychorheology field will benefit from the prediction of multiple sensory textures.
In this work, as a continuation of our previous work, we have developed an advanced machine-learning model for predicting various sensory textures of cosmetic formulations. What sets this advanced model apart from previous prediction models is its capability to predict not only spreadability but also four additional sensory textures: thickness, softness, adhesiveness, and stickiness. The advanced prediction model uses the largest rheological measurements and panel test database of 117 samples to improve accuracy and operation range over our previous predictive model. Our advanced prediction model incorporates extensional rheological parameters of cosmetic formulations in addition to the LAOS sequence of physical process (SPP) parameters and conventional rheological parameters, which served as feature variables in the previous prediction model for spreadability. This enhancement is believed to broaden the predictive capabilities of the model, allowing it to forecast a wider range of sensory textures. To strengthen our examination of the relationship between rheological parameters and sensory textures in comparison to our previous study, we have performed feature importance analysis in addition to the premutation importance analysis. This approach has allowed us to gain a comprehensive understanding of the perception of sensory textures in cosmetic formulations in the context of rheology.
The remainder of this article is divided into three sections. The specifics of data preparation, encompassing model cosmetic formulations, sensory texture tests, and rheological measurements are presented in Section 2. Section 3 describes the machine learning algorithms used to construct the prediction models. In Section 4, prediction performance for each sensory texture is evaluated, and the correlation between rheological parameters and sensory textures is discussed based on the results of the permutation importance and feature importance analyses. We conclude our findings and discussions at the end.
2 Measurements
2.1 Materials
In Figure 1, a schematic illustration of the data preparation processes is presented. A total of 117 cosmetics formulations were meticulously prepared. These model cosmetic formulations consist of two categories of formulations, solubilization and emulsification types, which exhibit diverse skin sensations. As shown in Table 1, the fundamental components of all formulations are polyol, oil, silicone, thickener, emulsifier, and water. Fragrance and color ingredients were omitted from all formulations to prevent unexpected bias. However, it is important to note that these additives can significantly affect the rheological properties in reality. The preparation of these formulations was executed using standard laboratory equipment, such as an agitator and homogenizer. While it is challenging to provide an exact definition for all cosmetic formulations due to their diversity, most of them adopted the form of solutions or thick emulsions. The cosmetic samples utilized for prediction, as indicated in Table 1, are free of particulates. It can therefore be concluded that the predictive model developed in this study is applicable to nonparticulate systems.
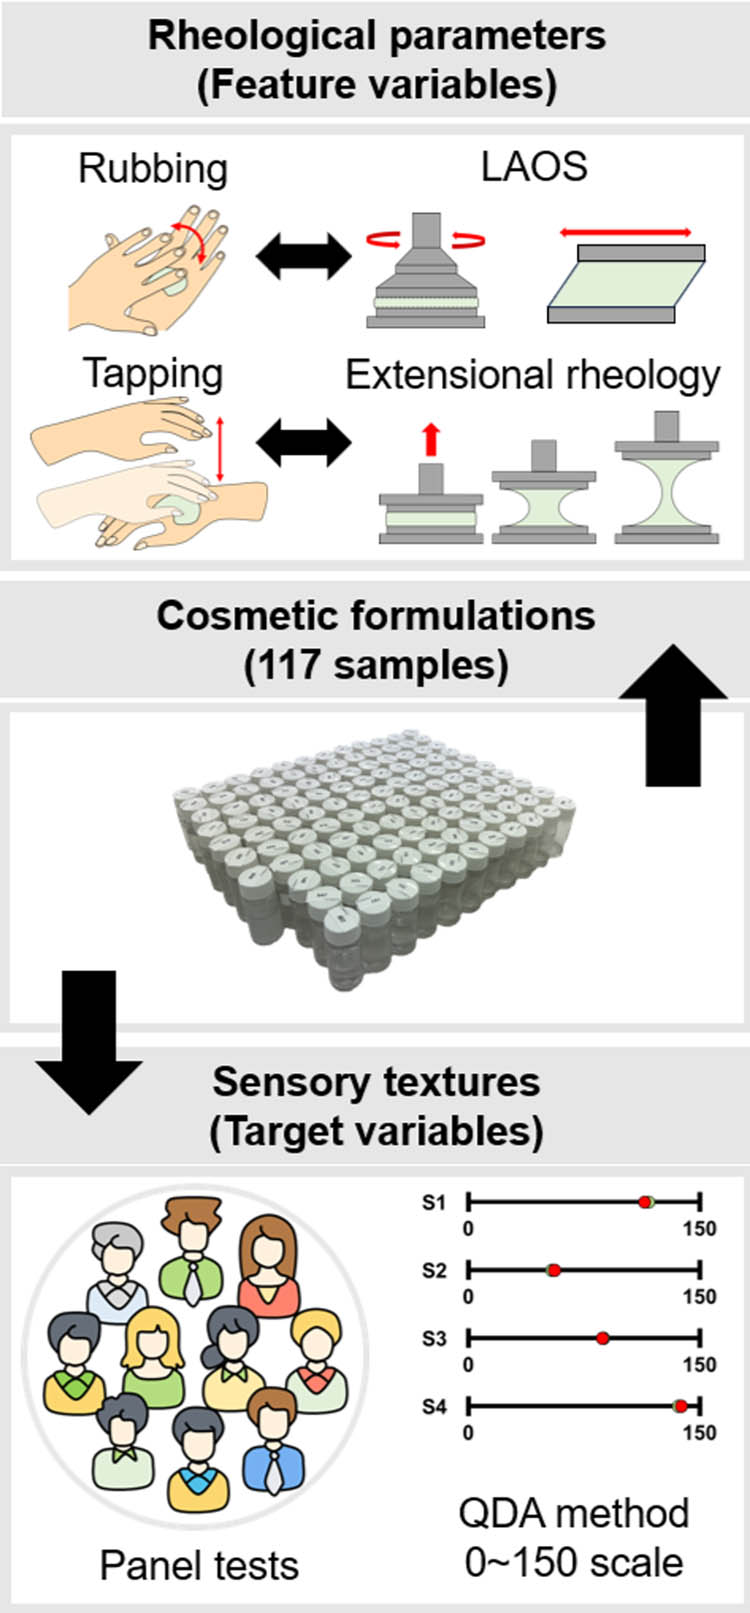
Schematic diagrams for the preparation processes of rheological and panel-tested sensory texture.
Ingredient information of 117 cosmetic formulations
| Ingredients | Type of formulation | |||
|---|---|---|---|---|
| Solubilization | Emulsification | |||
| Polyol (wt%) | ∼10 | 11–20 | 21∼ | 2–37 |
| Oil (wt%) | ∼1 | ∼1 | ∼1 | ∼15 |
| Silicone (wt%) | 0–1 | 0–10 | 0–4 | 0–33 |
| Thickener (wt%) | 0–2.0 | 0.04–1.93 | 0.04–6.24 | 0.01–13.55 |
| Emulsifier (wt%) | — | — | — | 0–3.5 |
| Water (wt%) | 61–93 | 53–86 | 31–76 | 27–83 |
| Number of samples | 27 | 36 | 25 | 25 |
2.2 Sensory texture evaluation
Sensory texture evaluation was conducted with the participation of 10 well-trained panelists. In this assessment, the QDA method, commonly employed in sensory evaluations, was utilized. The evaluation was performed in a sensory evaluation room, where temperature, relative humidity, and lighting conditions were regulated in adherence to ISO guidelines (ISO 8589:2007). To eliminate potential biases such as panel and order effects, all cosmetic formulations were presented in a fully blinded fashion, concealed by random three-digit codes. Furthermore, sensory texture assessments were performed in accordance with the Latin square design sequence [18,19,20,21].
The panelists were informed of the precise definitions of each sensory texture to assure a common understanding of sensory textures. “Spreadability” is defined as the “perceived degree of the spread strength or the spread area within the test spot while the sample covers over the skin” according to the previous research [15]. The following definitions apply to “thickness,” “softness,” “adhesiveness,” and “stickiness.” “Thickness” is defined as “the perceived degree to which the rolled sample presented a certain height between the skin and the finger.” “Softness” is defined as “the perceived degree to which the rolled sample felt soft.” The definition of “adhesiveness” is “the perceived degree to which the sample adhered to the skin when rolled.” The definition of “stickiness” is “the perceived degree to which a finger would adhere to the product's residue on the skin surface after using a sample.” The sensory attributes were evaluated on the inner forearm of the panelists. Each formulation was dispensed in 50-μL quantities via a micro pipette (Gilson MICROMAN M100E, France). Panelists spread the samples within a 5 cm diameter circle at a rate of 120 BPM (beats per minute) while rolling them. Ratings were assigned on a scale from 0 to 150 (line scale) in comparison to reference samples, with these references serving as reminders of the definitions of sensory attributes.
2.3 Rheological measurements
Simple shear rheological measurements were conducted utilizing an HR-20 rheometer (TA instruments, USA) equipped with a 40-mm crosshatched geometry, which was employed to avoid wall slippage during testing. A strain-controlled rheometer is the optimal choice for LAOS testing; alternatively, due to accessibility constraints, a stress-controlled rheometer was utilized. As there can be differences between the data obtained from a stress-controlled rheometer and a strain-controlled rheometer, we closely examined the strain signal during the oscillation and discovered that it was steady sinusoidal. In addition, the rheological measurements of 10 arbitrarily chosen cosmetic formulations from HR-20 and strain-controlled rheometer ARES-G2 (TA instruments, USA) were compared and found to be nearly identical (detailed in Supplemental material, Figures S1–S3). During the rheological measurements, we maintained a temperature of 32°C, which is comparable to the skin temperature of a hand in a room with a temperature of 15–20°C [22,23]. All samples were presheared with LAOS of strain amplitude
Extensional rheological properties were assessed using a capillary breakup extensional rheometer (CaBER, Thermo Scientific, USA). A small quantity of the sample was loaded between plates, with the initial gap set to 1 mm. Subsequently, the upper plate was elevated to a final gap of 9.3 mm using a cushioned stretching mode that imposes a constant lifting velocity of 1 mm/s followed by an exponential slowdown to mitigate issues caused by the rapid deceleration. The measurement of extensional rheological parameters was based on the change in the mid-filament diameter (
2.4 Rheological parameters as feature variables in prediction model
Feature variables used for the predictive model are categorized into three groups: conventional rheological parameters, LAOS parameters, and extensional rheological parameters. First, the conventional rheological parameter group consists of six distinct rheological parameters. Among these, the elastic modulus (
To derive LAOS parameters, we quantitatively analyze the stress response of cosmetic formulations under LAOS conditions using SPP techniques. As SPP analysis details are available in numerous prior studies [24,25,26,27,28], we only provide a concise explanation of SPP analysis. As shown in Figure 2, the rheological transition under oscillatory shear strain is depicted by a trajectory in a three-dimensional space composed of the strain (
where time derivatives of
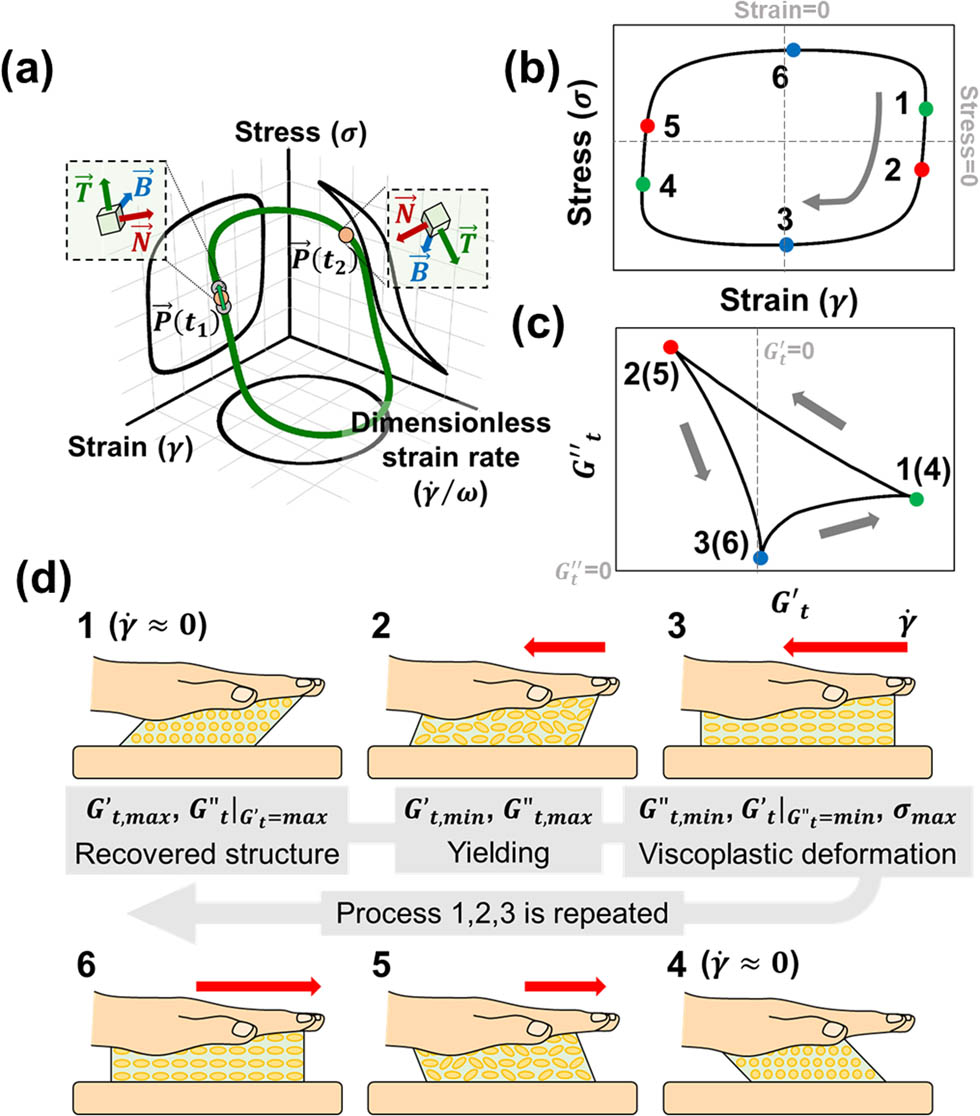
LAOS – SPP analysis and its analogy to rubbing out process of cosmetics. (a) Representation of the rheological behavior under oscillatory in three dimensions of strain (
Here,
Equation (4) can be reformulated as follows:
and compared to the total derivative of stress
As shown in Figure 2(d), the transient moduli at three pivotal points of the Cole–Cole plot were selected as features for the prediction model by bridging the LAOS to the cosmetic application process. Typically, the Cole–Cole plot under LAOS exhibits a deltoid configuration, predominantly as a consequence of the prevalence of the third harmonic within the Fourier spectrum [27,28,29]. The transient moduli at the three vertices of this deltoid shape effectively encapsulate the rheological behavior of cosmetics during the rubbing-out process, as illustrated in Figure 2(d). Near point 1 (or 4) in Figure 2(d), the strain peaks and flow are reversed, resulting in a near-zero deformation rate, which enables cosmetic structures to relax for a longer duration. As a result, point 1 (or 4), at which the transient elastic modulus attains its maximum value (
The extensional rheological measurements yielded four rheological parameters to be used as features in the prediction model. Figure 3 illustrates a schematic for extracting feature variables from extensional rheological tests. During the extension tests, the mid-filament diameter (
where
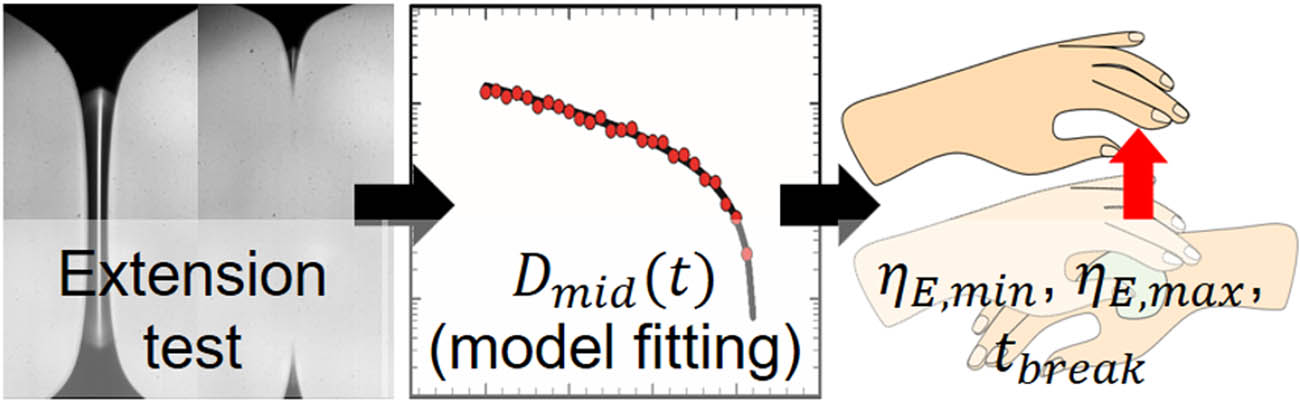
Extraction of feature variables (
From the extensional viscosities at different time points, we have chosen to include the maximum (
Summary of the feature selection for the prediction model
| Group | Feature | Description |
|---|---|---|
| Conventional parameters |
|
Linear rheological properties of cosmetic formulations under slight deformation |
|
|
Spreading stress during rapid rubbing-out | |
|
|
Relative difference in spreading stress between slow and rapid rubbing | |
| LAOS-SPP |
|
Rheological properties in a temporarily recovered state during oscillation (rubbing) |
|
|
Elastic-to-viscous transition during oscillation (rubbing) | |
|
|
Viscoplastic flow during oscillation (rubbing) | |
| Extensional rheology |
|
Rheological behavior under extensional deformation (tapping) |
|
|
Degree of extensional breakup tendency | |
|
|
Surface stability |
3 Machine learning model and variable importance analysis
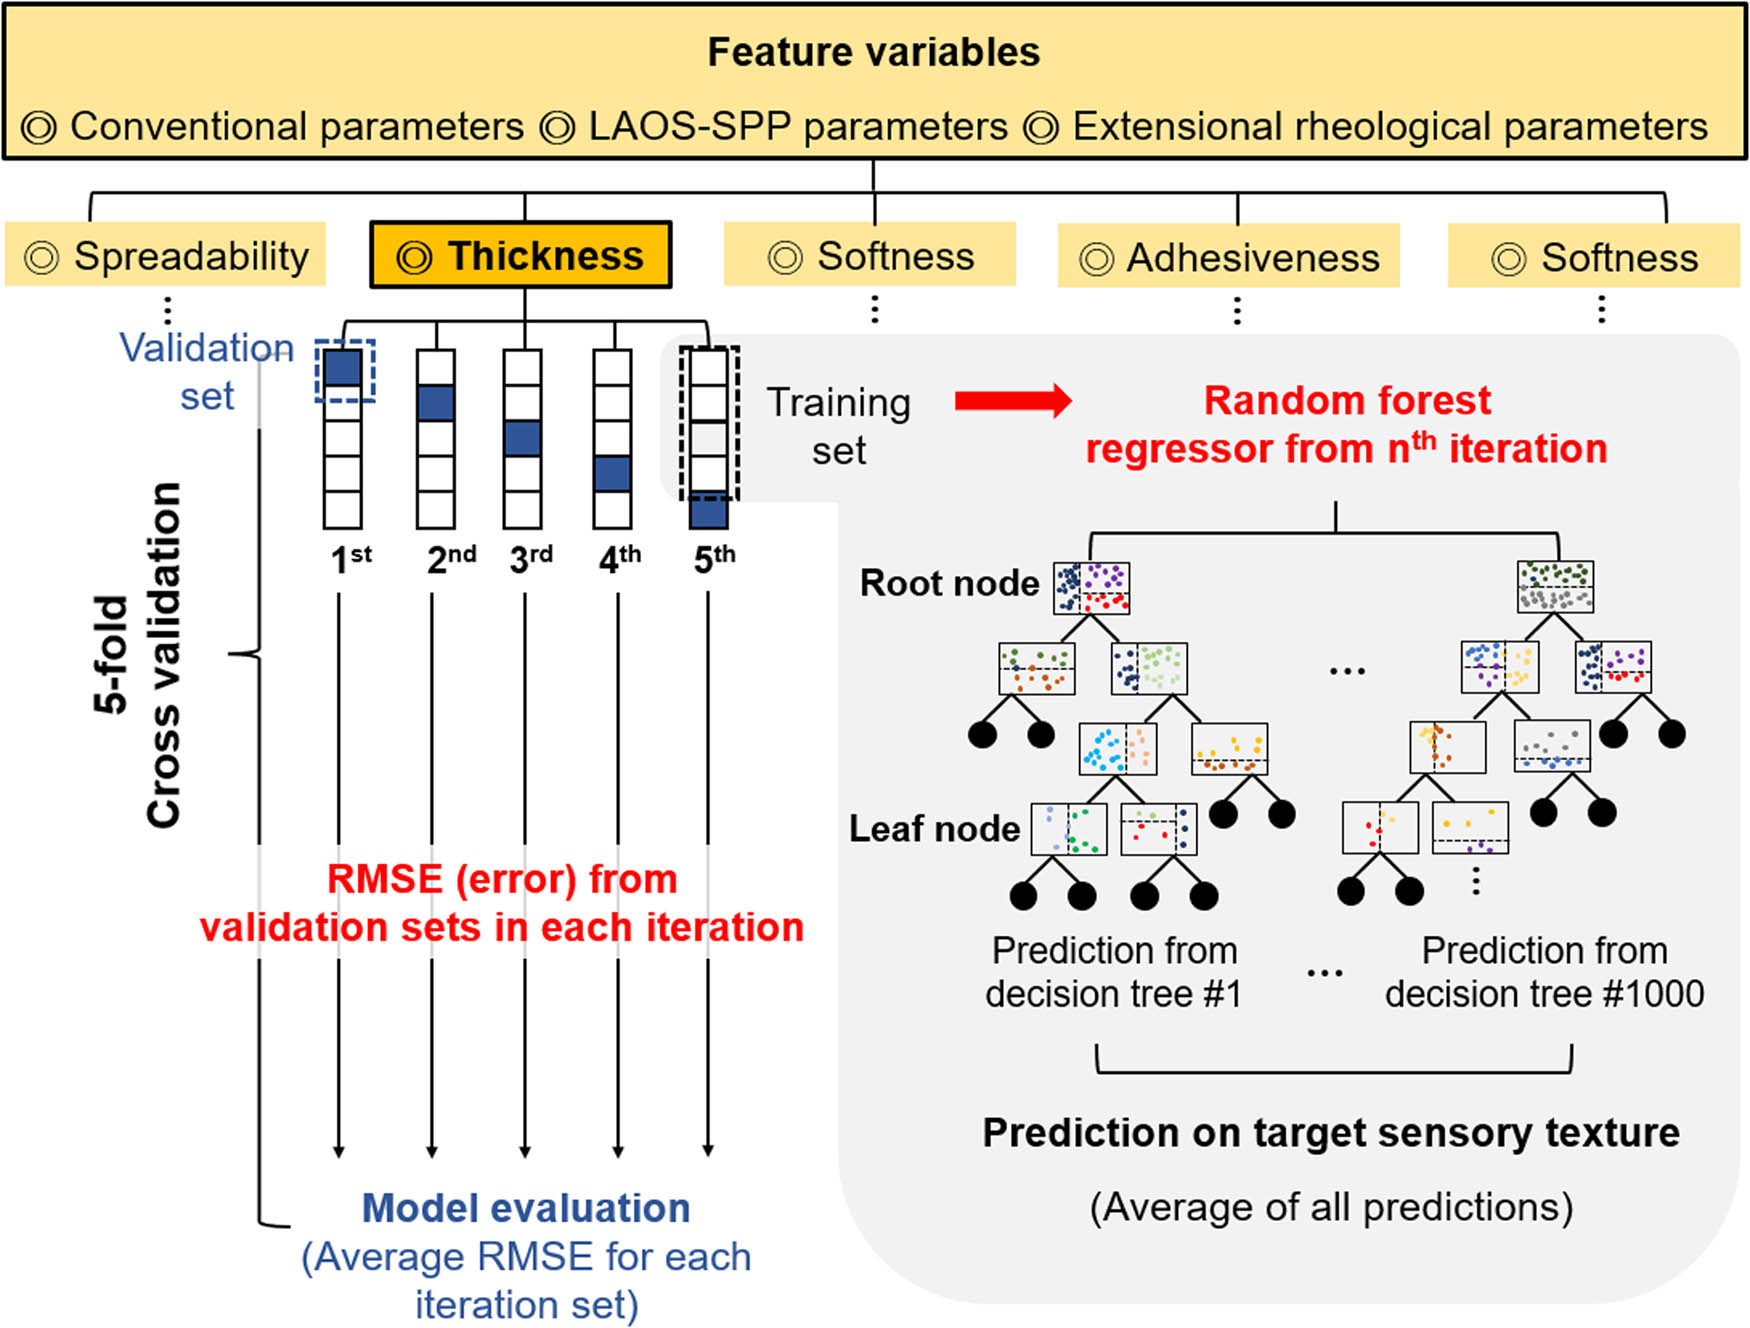
Preceding studies have revealed that there exists complicated nonlinear correlation between physical properties and sensory textures [4,15,35,36]. Our prediction model is rooted in the random forest regression, chosen for its effectiveness in capturing this nonlinear correlation between features and target variables. Given the abundance of information available elsewhere on random forest regression [37,38,39,40,41], we will explain only its fundamental principles here. The random forest regression model comprises numerous decision trees that exhibit a structure akin to actual trees, as depicted in Figures 4 and 5. A decision tree initiates at the root node, iteratively branching on the basis of the outcome variables until it eventually reaches a leaf node and assigns the predicted value. In a more detailed explanation, consider the root node of Figure 4, where the sensory texture and a selected feature domain are divided into two subdomains based on a specific feature criterion, represented by a long-dashed red line. Individual data points are assigned prediction values, denoted as
where
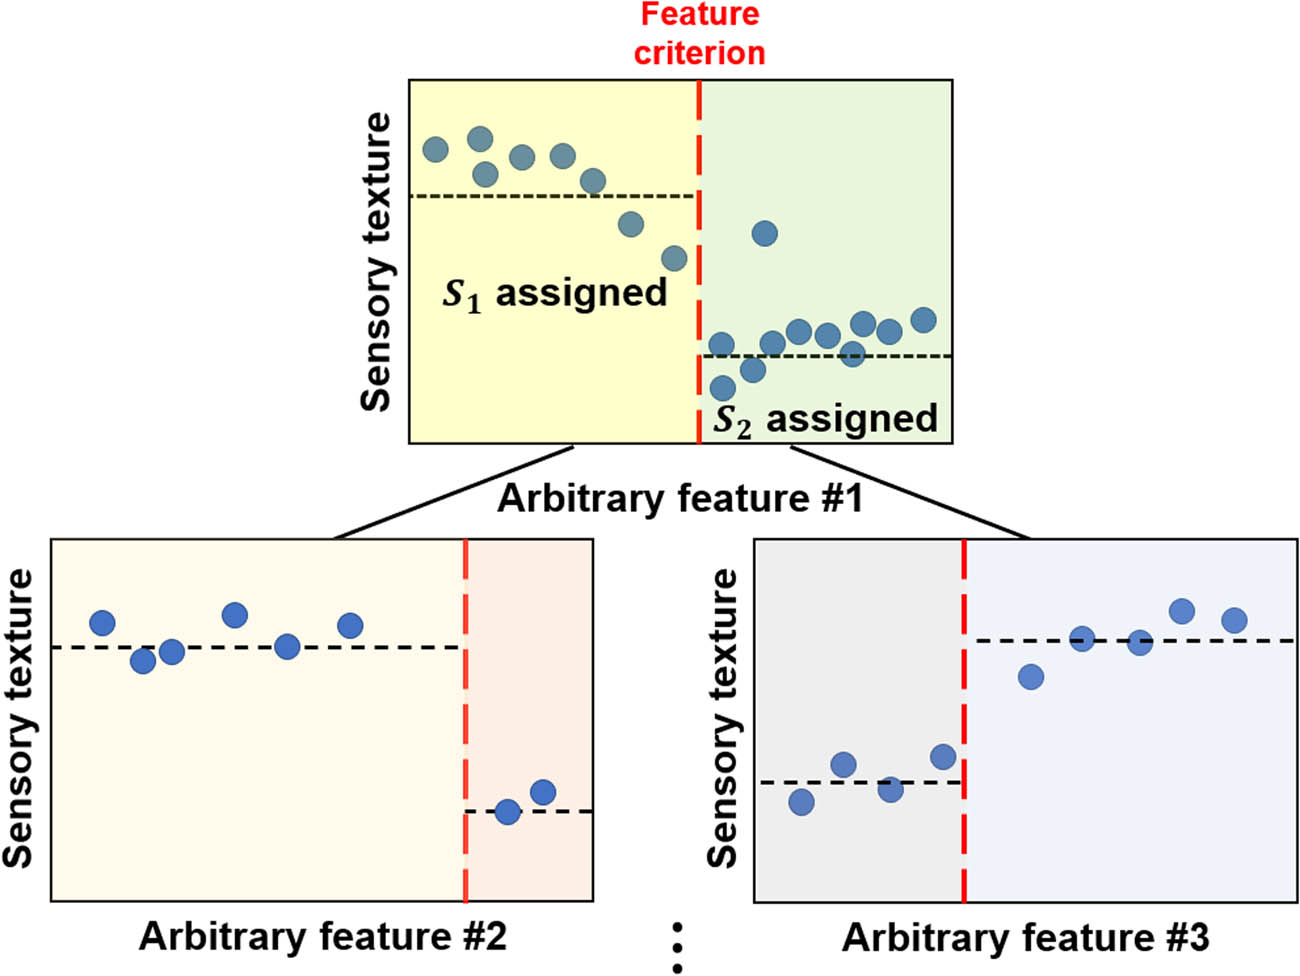
Principle of decision tree operation. The root node is divided into two internal nodes (leaves). The black short-dashed line and red long-dashed represent an assigned value in subdomains and a feature criterion, respectively.
Schematic of the random forest regression algorithm used for predicting sensory texture.
The random forest regression model, as the name suggests, employs a technique of ensemble machine learning to derive a final prediction value by averaging the output produced by each decision tree. While the random forest regression model is sophisticated and resource-intensive, with an order of magnitude of
To elucidate the significance of rheological parameters in predicting various sensory textures, two distinct feature analysis approaches were utilized. Feature importance that is measured by the average decrease in evaluation metric across all trees in the forest due to each feature was utilized as a first tool to quantify relevance between rheological parameters and sensory texture. Specifically, when a particular feature is used in a tree, the improvement in the evaluation metric, here RMSE, is calculated. The more the feature decreases the evaluation metric, the more relevant it is [49,50]. Permutation importance assesses the impact on the model’s prediction accuracy by randomly shuffling the values of each feature across samples, thereby disrupting the relationship between the feature and the target. For each feature, its values are shuffled among all observations, and the change in the model’s error is observed. A significant increase in the error upon shuffling is indicative of a high importance of that feature [51,52]. Utilizing two different analyses offers a more balanced and accurate interpretation of the relationship between rheological measurements and sensory textures by mitigating potential issues inherent in each approach, such as the bias problem associated with feature importance.
4 Results and discussion
4.1 Spreadability prediction
In Figure 6, the performance of the spreadability prediction model is displayed, along with an analysis of its feature importance results. The spreadability prediction model demonstrates an RMSE of 10.47, suggesting that the spreadability of any given cosmetic formulation can be effectively predicted within an error range of 10.47 on the 150-score scale. Although the specific pipelines of the prediction model vary, its performance is comparable to the previously developed spreadability prediction model, which was based on a smaller dataset from 77 cosmetic formulations [15]. Given that this work utilizes a larger dataset (117 samples) that encompasses a broader range of formulations with broader ingredient compositions and rheological properties, the satisfactory performance in predicting spreadability suggests that the current strategy for developing a prediction model is robust. When exposed to new cosmetic formulations, it is expected that our prediction model will make effective and accurate predictions. In addition, it is noteworthy that the spreadability values of most formulations are predicted with remarkable precision. This accuracy is evidenced by the points closely clustered around the line of perfect prediction (
Performance of the spreadability prediction model and analysis of feature importance. (a) Comparison of predicted (machine learning model) vs actual (panel test) values of 117 samples. The range of RMSE deviation (10.47) from the accurate prediction line (model prediction = panel-tested value, long dashed line) is indicated by short-dashed lines. (b) Top five features from feature importance analysis. (c) Top five features from permutation importance analysis.
To identify which rheological metrics are critical for determining the spreadability of cosmetic formulations, feature importance and permutation importance analyses were conducted. The results are displayed in Figure 6(b) and (c). In both importance analyses,
4.2 Thickness prediction
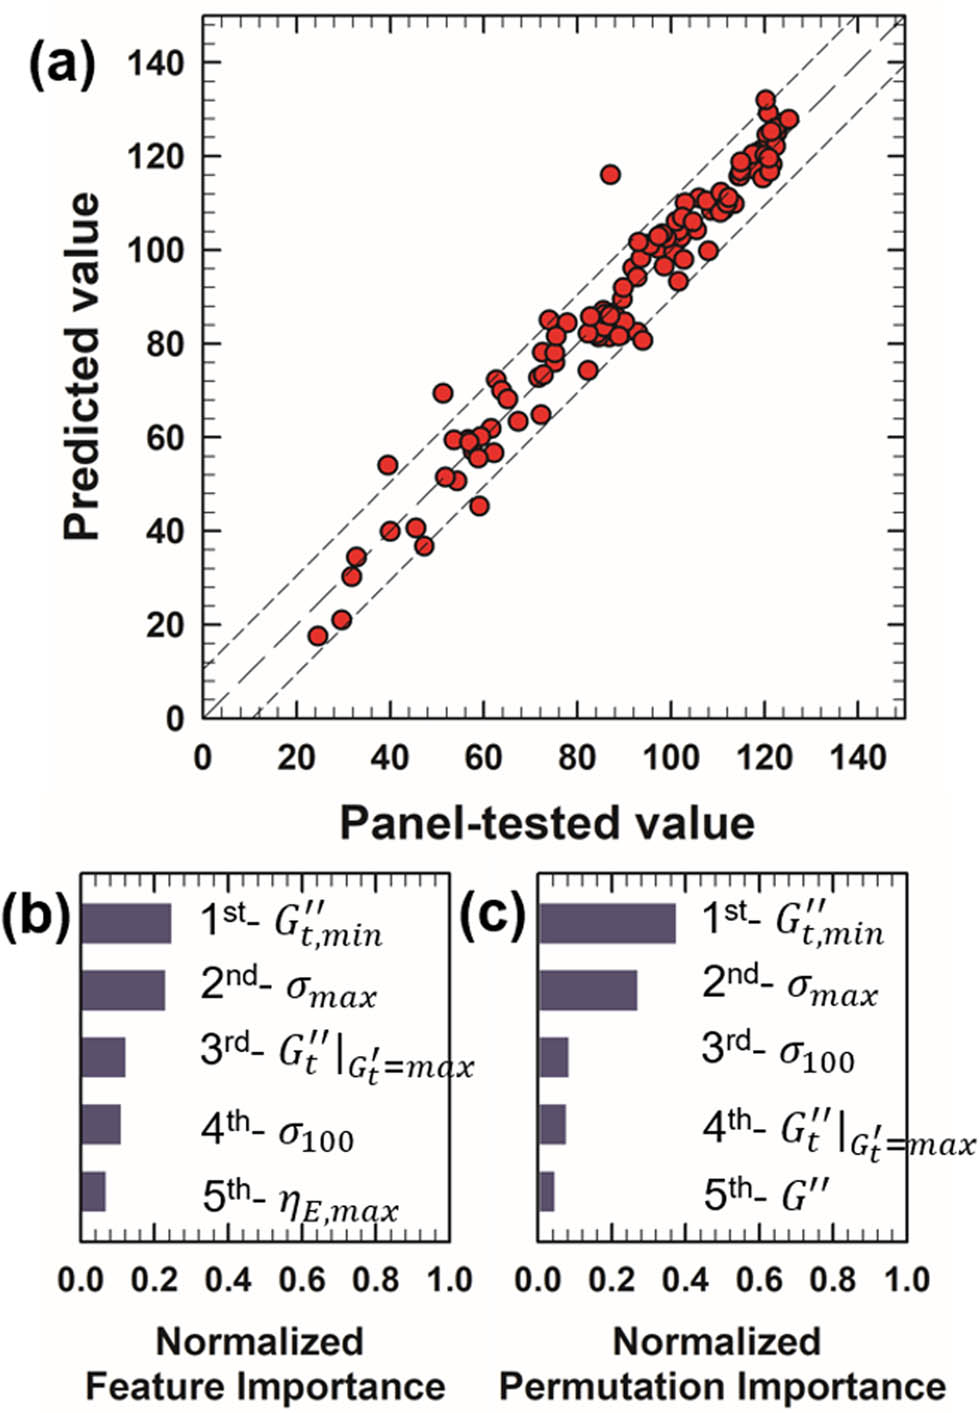
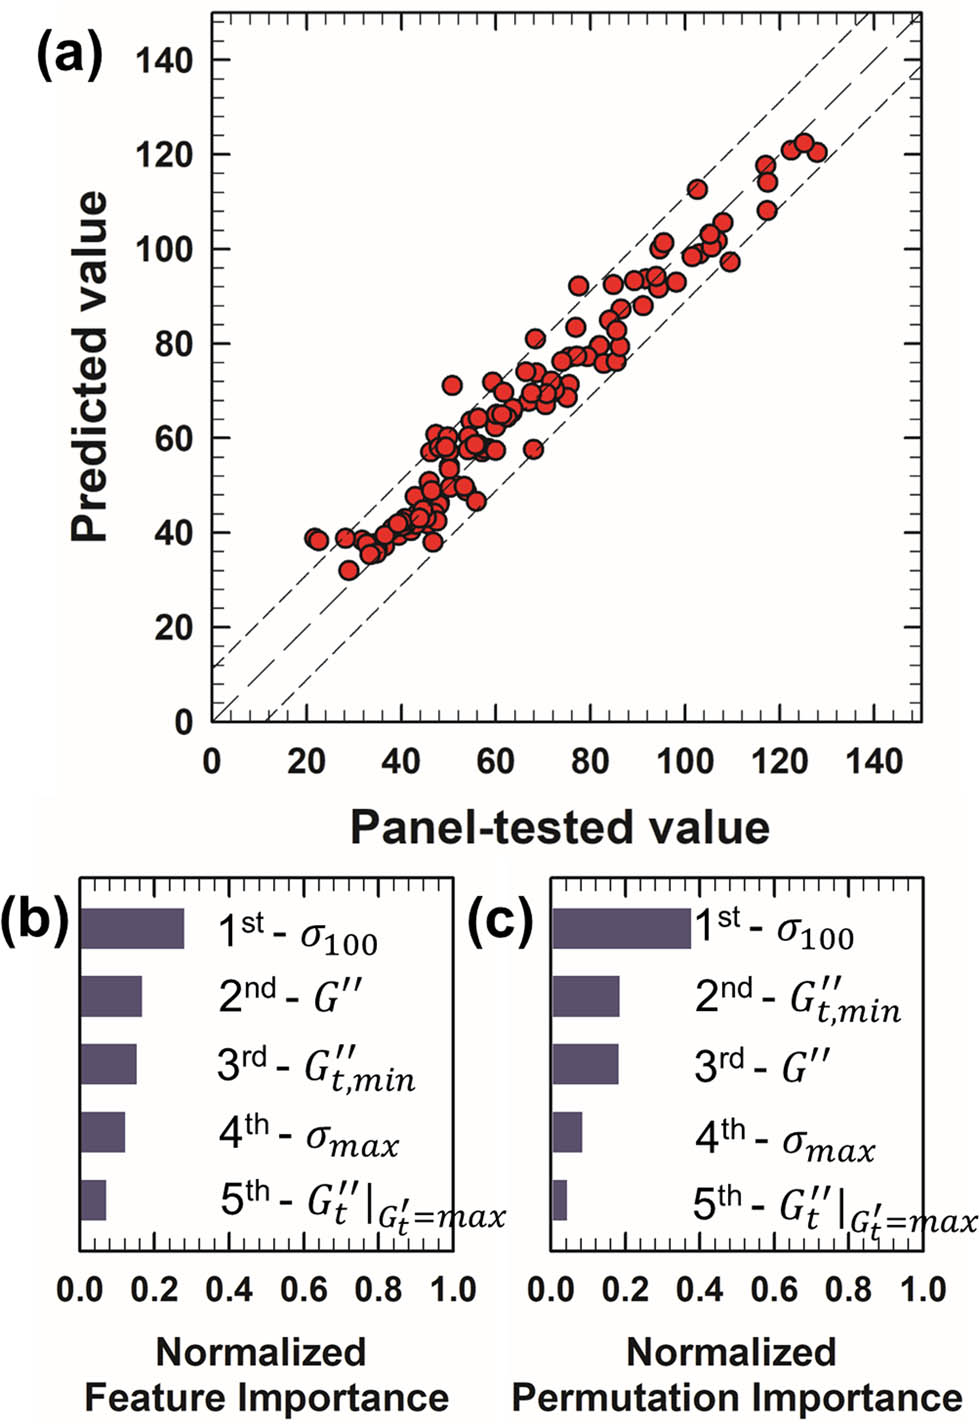
The predictive performance and feature importance analysis results of our model for thickness are illustrated in Figure 7. The RMSE for thickness prediction stands at 9.45, representing the best performance among the five sensory attributes investigated in this study. Points in Figure 7(a) are most closely clustered around the line of perfect prediction (
Performance of the thickness prediction model and analysis of feature importance. (a) Comparison of predicted (machine learning model) vs actual (panel test) values of 117 samples. The range of RMSE deviation (9.45) from the accurate prediction line (model prediction = panel-tested value, long dashed line) is indicated by short-dashed lines. (b) Top five features from feature importance analysis. (c) Top five features from permutation importance analysis.
Traditionally, shear stress and the work of shear (shear dissipation) have been the principal rheological properties linked to the sensory texture of cosmetic formulations [4,15,22,53,54], with thickeners primarily used to adjust viscosity or the intensity of shear stress [55,56]. However, our findings suggest that transient rheological behavior, represented by the transient elastic modulus
4.3 Softness prediction
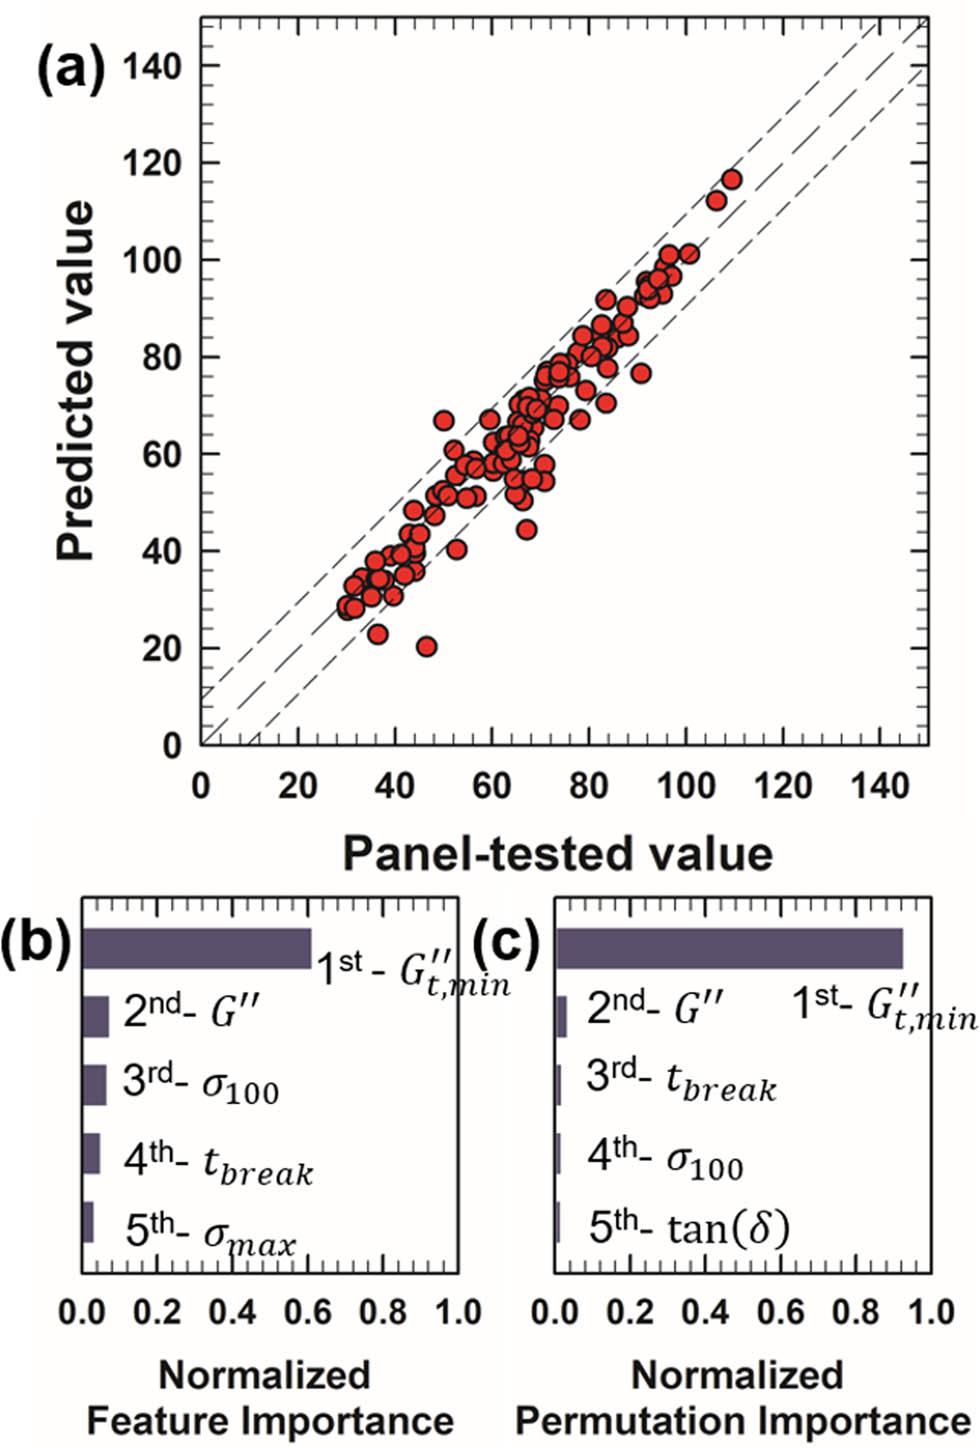
Figure 8 displays the predictive performance and feature importance analysis of our softness prediction model. The prediction model demonstrates satisfactory performance with an RMSE of 13.69, although it exhibits a comparatively lower level of performance when contrasted with the spreadability, thickness, or adhesiveness prediction models that will be introduced later. In Figure 8(a), while the data points representing the predicted value versus panel-tested value for most cosmetic formulations are closely clustered near the line of perfect prediction (
Performance of the softness prediction model and analysis of feature importance. (a) Comparison of predicted (machine learning model) vs actual (panel test) values of 117 samples. The range of RMSE deviation (13.69) from the accurate prediction line (model prediction = panel-tested value, long dashed line) is indicated by short-dashed lines. (b) Top five features from feature importance analysis. (c) Top five features from permutation importance analysis.
Feature importance and permutation importance analyses indicate that many rheological parameters play similarly important roles in determining softness. The top five features from both analyses show comparable importance, with no single feature exhibiting a dominantly high value. This contrasts with the cases of spreadability and thickness, where one or two rheological parameters demonstrate significantly greater importance. Similar to the cases of spreadability and thickness,
4.4 Adhesiveness prediction
As shown in Figure 9, our prediction model exhibits good performance in predicting adhesiveness, with an RMSE of 11.13. Remarkably, no cosmetic formulation displays significant prediction error, as evidenced by Figure 9(a), where most of the points are closely aligned with the line of perfect prediction (
Performance of the adhesiveness prediction model and analysis of feature importance. (a) Comparison of predicted (machine learning model) vs actual (panel test) values of 117 samples. The range of RMSE deviation (11.13) from the accurate prediction line (model prediction = panel-tested value, long dashed line) is indicated by short-dashed lines. (b) Top five features from feature importance analysis. (c) Top five features from permutation importance analysis.
In both feature importance and permutation importance analyses,
4.5 Stickiness prediction
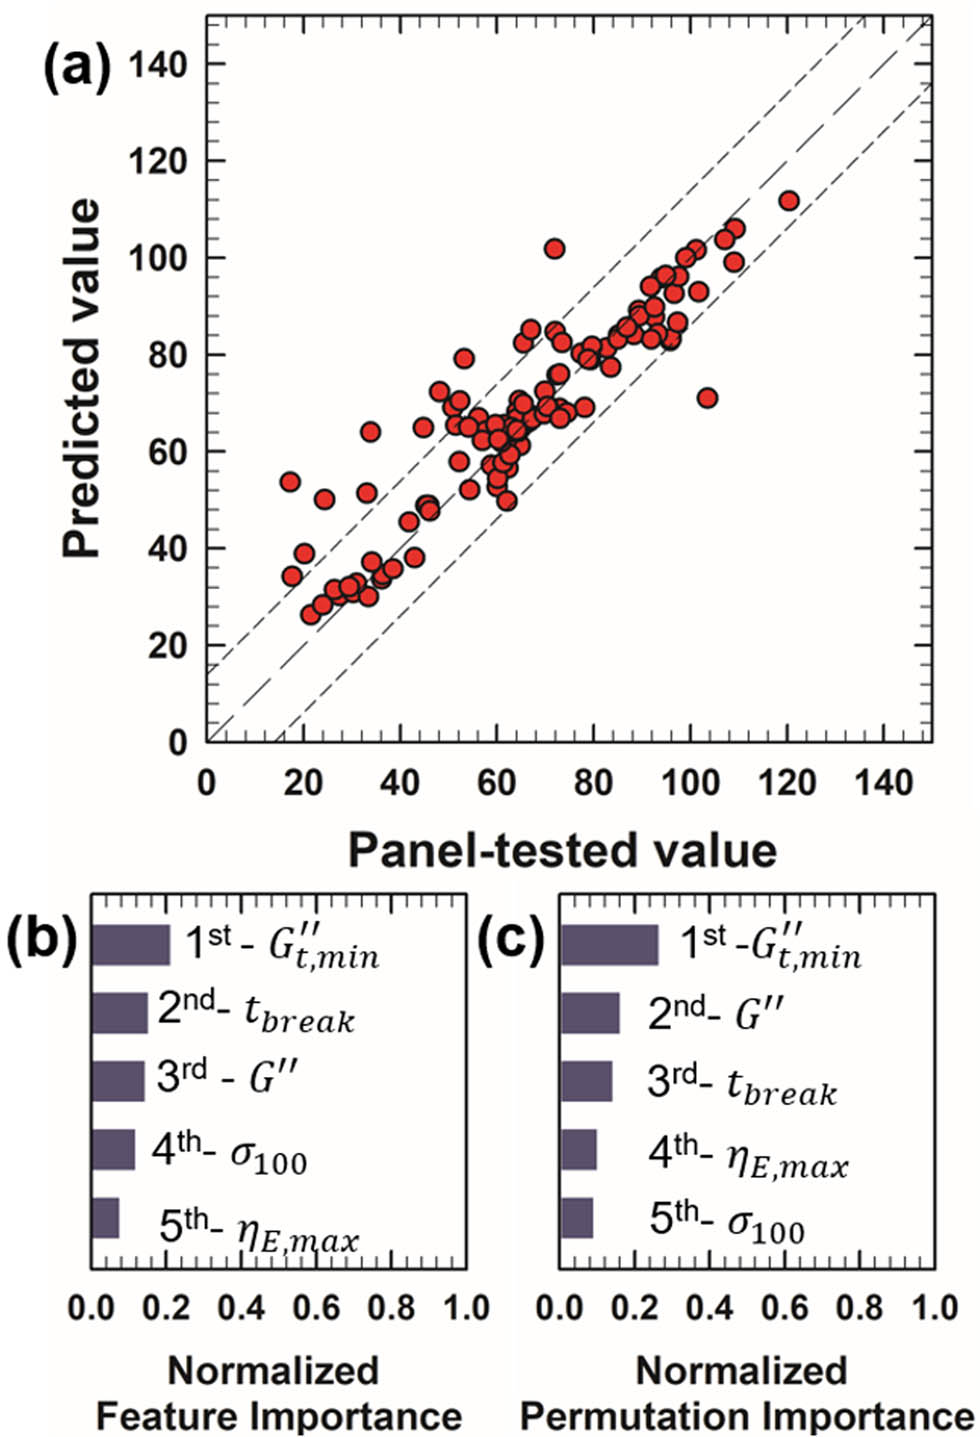
In Figure 10(a), which compares predicted and panel-tested stickiness values of cosmetic formulations, multiple data points are situated far from the line of perfect prediction (
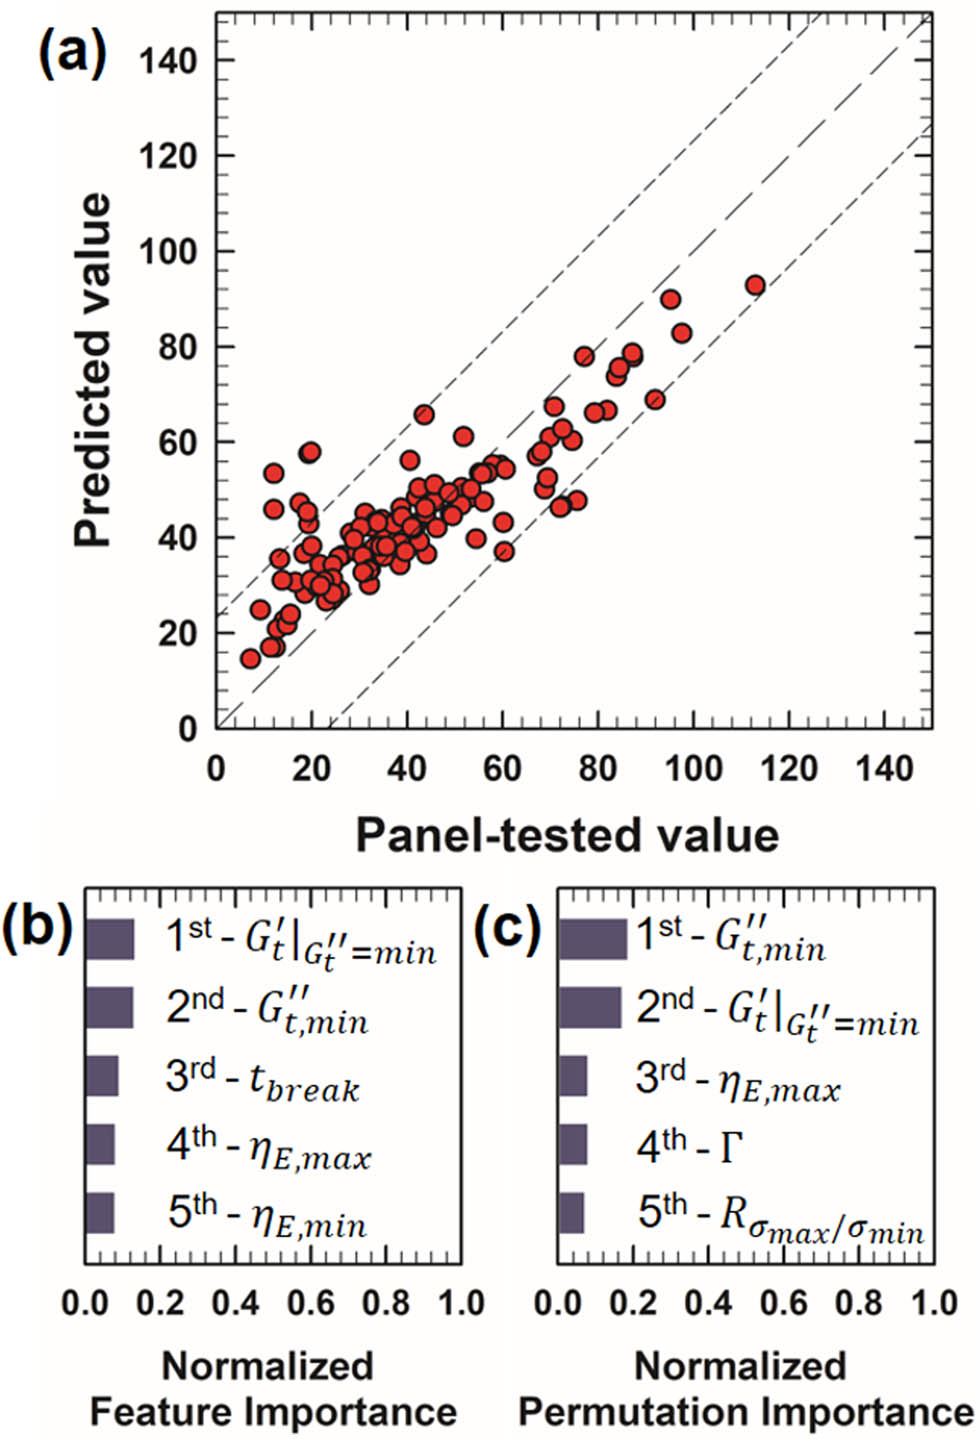
Performance of the stickiness prediction model and analysis of feature importance. (a) Comparison of predicted (machine learning model) vs actual (panel test) values of 117 samples. The range of RMSE deviation (22.15) from the accurate prediction line (model prediction = panel-tested value, long dashed line) is indicated by short-dashed lines. (b) Top five features from feature importance analysis. (c) Top five features from permutation importance analysis.
The feature importance analysis results in Figure 10(b) and (c) reveal that properties associated with extensional deformation are influential in determining stickiness. This is reasonable, considering that the perception of stickiness is likely linked to the tapping process, during which the cosmetic formulation undergoes extensional deformation.
The highest ranked rheological metrics are
5 Conclusion
A predictive model for five sensory textures of cosmetics formulations – spreadability, thickness, softness, adhesiveness, and stickiness – has been developed by integrating rheological analysis and machine learning techniques. This model expands upon previous work that established a prediction model for the limited texture of spreadability using a relatively small database. In this advanced model, rheological measurements including LAOS and extensional rheological analyses served as feature variables. These were selected considering their analogical resemblance to the flow conditions experienced during the actual cosmetics application process, such as rubbing and tapping. For the target sensory texture values, panel-tested results from 10 highly trained panels were employed. The random forest regression technique reveals complex correlations between the rheological measurements and the sensory textures. In addition, important features that play a crucial role in determining each sensory texture are investigated using feature importance and permutation importance analyses.
The prediction model exhibited highly reliable performance in predicting sensory textures, achieving reasonable RMSE values, except for the stickiness, where the prediction performance relatively lagged behind those of other sensory textures. On the basis of the results of the importance analysis, we identified key rheological metrics that are crucial in determining each sensory texture and correlated them with the actual cosmetics application process. Intriguingly, many rheological metrics from the LAOS-SPP analysis proved to be key factors in all cases of sensory texture, indicating that feature selection, which considers the analogous flow conditions of rubbing and LAOS, is effective. Particularly,
In conclusion, we emphasize the significance of our study from several distinct viewpoints. First, our established predictive model for various sensory texture of cosmetic formulations enables rapid and convenient sensory texture assessments replacing the time-consuming and costly panel tests. In terms of psychorheology, our study offers insights into how individuals perceive the sensory textures of materials, identifying the key rheological features that play a major role in this determination. Furthermore, our results are expected to be particularly useful in designing and controlling the formulations of various consumer products including cosmetics and food. From a broader perspective, our findings demonstrate how rheological analysis can be effectively combined with machine learning approaches to quantitatively examine physical phenomena that are subtly and ambiguously linked to rheological behaviors. It is interesting and encouraging that advanced rheological analyses, such as LAOS-SPP, which naturally encompasses diverse flow conditions, can effectively capture the rheological behavior of materials under actual flow conditions encountered in consumer usage or manufacturing, thereby facilitating such approaches.
-
Funding information: This work was supported by the Cosmax Inc. and the Korea Health Technology R&D Project through the Korea Health Industry Development Institute, funded by the Ministry of Health & Welfare (No. HP23C0040).
-
Author contributions: Hyo-Jeong Lee – experiment, data curation, analysis, and writing; Sung Ryul Kim – data curation, interpretation, and writing; Byoung Soo Kim – conceptualization and methodology; Suhyun Lee – experiment and data curation; Yoon Ju Yi – experiment, data curation, and writing; Han Byol Jeon – experiment, data curation, and writing; Minkyo Son – experiment, data curation, and writing; Kyunghye Park – experiment, data curation, and writing; Chun Ho Park – conceptualization; Heemuk Oh – conceptualization and methodology; Jun Bae Lee – conceptualization and methodology; Jun Dong Park – conceptualization, methodology, experiment, data curation, analysis, and writing.
-
Conflict of interest: The authors declare that this study received funding from Cosmax Inc. While Cosmax Inc. did play a role in the study, all final decisions regarding the analysis, interpretation of the data, and the content of the published article were made independently by the corresponding author.
-
Ethical approval: The conducted research is not related to either human or animal use.
-
Data availability statement: The datasets generated during and/or analyzed during the current study are available from the corresponding author on reasonable request.
References
[1] Szczesniak AS. Texture is a sensory property. Food Qual. 2002;13(4):215–25.10.1016/S0950-3293(01)00039-8Search in Google Scholar
[2] Vieira GS, Lavarde M, Fréville V, Rocha-Filho PA, Pensé-Lhéritier A. Combining sensory and texturometer parameters to characterize different type of cosmetic ingredients. Int J Cosmet Sci. 2020;42(2):156–66.10.1111/ics.12598Search in Google Scholar PubMed
[3] Nishinari K, Fang Y. Perception and measurement of food texture: Solid foods. J Texture Stud. 2018;49(2):160–201.10.1111/jtxs.12327Search in Google Scholar PubMed
[4] Gilbert L, Savary G, Grisel M, Picard C. Predicting sensory texture properties of cosmetic emulsions by physical measurements. Chemom Intell Lab Syst. 2013;124(15):21–31.10.1016/j.chemolab.2013.03.002Search in Google Scholar
[5] Turek P, Kowalska M. The use of model samples in the process of selection of sensory panel to assess cosmetic products. J Sens Stud. 2024;39(1):e12895.10.1111/joss.12895Search in Google Scholar
[6] Pensé-Lhéritier AM. Recent developments in the sensorial assessment of cosmetic products: a review. Int J Cosmet Sci. 2015;37(5):465–73.10.1111/ics.12223Search in Google Scholar PubMed
[7] Gilbert L, Picard C, Savary G, Grisel M. Impact of polymers on texture properties of cosmetic emulsions: a methodological approach. J Sens Stud. 2012;27(5):392–402.10.1111/joss.12001Search in Google Scholar
[8] Holland D. Measuring and interpreting the rheological properties of cosmetic products. Appl Rheol. 2019;1(2):108–13.10.2478/arh-1991-020211Search in Google Scholar
[9] Yao ML, Patel JC. Rheological characterization of body lotions. Appl Rheol. 2001;11(2):83–8.10.1515/arh-2001-0005Search in Google Scholar
[10] Morávková T, Stern P. Rheological and textural properties of cosmetic emulsions. Appl Rheol. 2011;21(3):35200.Search in Google Scholar
[11] Ahuja A, Lu J, Potanin A. Rheological predictions of sensory attributes of lotions. J Texture Stud. 2019;50(4):295–305.10.1111/jtxs.12401Search in Google Scholar PubMed
[12] Lee J, Lu J, Potanin A, Boyke C. Prediction of tactile sensory attributes of facial moisturizers by rheology and tribology. Biotribology. 2021;28:100201.10.1016/j.biotri.2021.100201Search in Google Scholar
[13] Cyriac F, Yi TX, Chow PS. Predicting textural attributes and frictional characteristics of topical formulations based on non-linear rheology. Biotribology. 2023;35–36:100249.10.1016/j.biotri.2023.100249Search in Google Scholar
[14] Huynh A, Garcia AG, Young LK, Szoboszlai M, Liberatore MW, Baki G. Measurements meet perceptions: rheology-texture-sensory relations when using green, bio-derived emollients in cosmetic emulsions. Int J Cosmet Sci. 2021;43(1):11–9.10.1111/ics.12661Search in Google Scholar PubMed
[15] Lee S, Kim SR, Lee HJ, Kim BS, Oh H, Lee JB, et al. Predictive model for the spreadability of cosmetic formulations based on large amplitude oscillatory shear (LAOS) and machine learning. Phys Fluids. 2022;34(10):103109.10.1063/5.0117989Search in Google Scholar
[16] Cyriac F, Yi TX, Chow PS, Macbeath C. Tactile friction and rheological studies to objectify sensory properties of topical formulations. J Rheol. 2022;66(2):305–26.10.1122/8.0000341Search in Google Scholar
[17] Ozkan S, Gillece TW, Senak L, Moore DJ. Characterization of yield stress and slip behaviour of skin/hair care gels using steady flow and LAOS measurements and their correlation with sensorial attributes. Int J Cosmet Sci. 2012;33(2):193–201.10.1111/j.1468-2494.2012.00702.xSearch in Google Scholar PubMed
[18] Schlich P. Uses of change-over designs and repeated measurements in sensory and consumer studies. Food Qual Prefer. 1993;4(4):223–35.10.1016/0950-3293(93)90166-4Search in Google Scholar
[19] Mead R, Curnow RN, Hasted AM. Statistical methods in agriculture and experimental biology. London: Chapman and Hall, Routledge; 1993.10.1007/978-1-4899-6928-6Search in Google Scholar
[20] Piggott JR, Simpson SJ, Williams SAR. Sensory analysis. Int J Food Sci Technol. 1998;33(1):7–12.10.1046/j.1365-2621.1998.00154.xSearch in Google Scholar
[21] McBride RL. Range bias in sensory evaluation. Int J Food Sci Technol. 1982;17(3):405–10.10.1111/j.1365-2621.1982.tb00195.xSearch in Google Scholar
[22] Adejokun DA, Dodou K. Quantitative sensory interpretation of rheological parameters of a cream formulation. Cosmetics. 2020;7(1):2.10.3390/cosmetics7010002Search in Google Scholar
[23] Ariyaratnam S, Rood JP. Measurement of facial skin temperature. J Dent. 1990;18(5):250–3.10.1016/0300-5712(90)90022-7Search in Google Scholar PubMed
[24] Rogers SA, Lettinga MP. A sequence of physical processes determined and quantified in large-amplitude oscillatory shear (LAOS): Application to theoretical nonlinear models. J Rheol. 2012;56(1):1–25.10.1122/1.3662962Search in Google Scholar
[25] Rogers SA. A sequence of physical processes determined and quantified in LAOS: An instantaneous local 2D/3D approach. J Rheol. 2012;56(5):1129–51.10.1122/1.4726083Search in Google Scholar
[26] Lee CW, Rogers SA. A sequence of physical. Processes quantified in LAOS by continuous local measures. Korea Aust Rheol J. 2017;29(4):269–79.10.1007/s13367-017-0027-xSearch in Google Scholar
[27] Park JD, Rogers SA. The transient behavior of soft glassy materials far from equilibrium. J Rheol. 2018;62(4):869–88.10.1122/1.5024701Search in Google Scholar
[28] Park JD, Rogers SA. Rheological manifestation of microstructural change of colloidal gel under oscillatory shear flow. Phys Fluids. 2020;32(6):063102.10.1063/5.0006792Search in Google Scholar
[29] Choi J, Nettesheim F, Rogers SA. The unification of disparate rheological measures in oscillatory shearing. Phys Fluids. 2019;31(7):073107.10.1063/1.5106378Search in Google Scholar
[30] Jaishankar A, Wee M, Matia-Merino L, Goh KKT, McKinley GH. Proving hydrogen bond interactions in a shear thickening polysaccharide using nonlinear shear and extensional rheology. Carbohydr Polym. 2015;123:136–45.10.1016/j.carbpol.2015.01.006Search in Google Scholar PubMed
[31] Oliveira MSN, Yeh R, McKinley GH. Iterated stretching, extensional rheology and formation of beads-on-a-string structures in polymer solutions. J Nonnewton Fluid Mech. 2006;137(1–3):137–48.10.1016/j.jnnfm.2006.01.014Search in Google Scholar
[32] Miller E, Clasen C, Rothstein JP. The effect of step-stretch parameters on capillary breakup extensional rheology (CaBER) measurements. Rheol Acta. 2009;48:625–39.10.1007/s00397-009-0357-9Search in Google Scholar
[33] Anna SL, McKinley GH. Effect of a controlled pre-deformation history on extensional viscosity of dilute polymer solutions. Rheol Acta. 2008;47:841–59.10.1007/s00397-007-0253-0Search in Google Scholar
[34] Anna SL, McKinley GH. Elasto-capillary thinning and breakup of model elastic liquids. J Rheol. 2001;45(1):115–38.10.1122/1.1332389Search in Google Scholar
[35] Montenegro L, Rapisarda L, Ministeri C, Puglisi G. Effects of lipids and emulsifiers on the physicochemical and sensory properties of cosmetic emulsions containing vitamin E. Cosmetics. 2015;2(1):35–47.10.3390/cosmetics2010035Search in Google Scholar
[36] Lukic M, Jaksic I, Krstonosic V, Cekic N, Savic S. A combined approach in characterization of an effective w/o hand cream: the influence of emollient on textural, sensorial and in vivo skin performance. Int J Cosmet Sci. 2012;34(2):140–9.10.1111/j.1468-2494.2011.00693.xSearch in Google Scholar PubMed
[37] Grömping U. Variable importance assessment in regression: linear regression versus random forest. Am Stat. 2012;63(4):308–19.10.1198/tast.2009.08199Search in Google Scholar
[38] Rodriguez-Galiano V, Sanchez-Castillo M, Chica-Olmo M, Chica-Rivas M. Machine learning predictive models for mineral prospectivity: An evaluation of neural networks, random forest, regression trees and support vector machines. Ore Geol Rev. 2015;71:804–18.10.1016/j.oregeorev.2015.01.001Search in Google Scholar
[39] Wang L, Zhou X, Zhu X, Dong Z, Guo W. Estimation of biomass in wheat using random forest regression algorithm and remote sensing data. Crop J. 2016;4(3):212–9.10.1016/j.cj.2016.01.008Search in Google Scholar
[40] Svetnik V, Liaw A, Tong C, Culberson JC, Sheridan RP, Feuston BP. Random forest: A classification and regression tool for compound classification and QSAR modeling. J Chem Inf Comput Sci. 2003;43(6):1947–58.10.1021/ci034160gSearch in Google Scholar PubMed
[41] Li Y, Zou C, Berecibar M, Nanini-Maury E, Chan JCW, van den Bossche P, et al. Random forest regression for online capacity estimation of lithium-ion batteries. Appl Energy. 2018;232:197–210.10.1016/j.apenergy.2018.09.182Search in Google Scholar
[42] Breiman L. Random forests. Mach Learn. 2001;45:5–32.10.1023/A:1010933404324Search in Google Scholar
[43] Liaw A, Wiener M. Classification and regression by randomForest. R news. 2002;2:18–22.Search in Google Scholar
[44] Biau G. Analysis of a random forests model. J Mach Learn Res. 2012;13:1063–95.Search in Google Scholar
[45] Feng CJ, Yu Z, Kingi U, Baig MP. Threefold vs fivefold cross validation in one-hidden-layer and two-hidden-layer predictive neural network modeling of machining surface roughness data. J Manuf Syst. 2005;24(2):93–107.10.1016/S0278-6125(05)80010-XSearch in Google Scholar
[46] Efron B, Tibshirani R. Improvements on cross-validation: the 632+ bootstrap method. J Am Stat Assoc. 1997;92(438):548–60.10.1080/01621459.1997.10474007Search in Google Scholar
[47] An S, Liu W, Venkatesh S. Fast cross-validation algorithms for least squares support vector machine and kernel ridge regression. Pattern Recognit. 2007;40(8):2154–62.10.1016/j.patcog.2006.12.015Search in Google Scholar
[48] Lei J. Cross-validation with confidence. J Am Stat Assoc. 2019;115(532):1978–97.10.1080/01621459.2019.1672556Search in Google Scholar
[49] Chai T, Draxler RR. Root mean square error (RMSE) or mean absolute error (MAE)? Geosci Model Dev Discuss. 2014;7(3):1525–34.10.5194/gmd-7-1247-2014Search in Google Scholar
[50] Kim T, Kim HY. Forecasting stock prices with a feature fusion LSTM-CNN model using different representations of the same data. PLoS One. 2019;14(2):e0212320.10.1371/journal.pone.0212320Search in Google Scholar PubMed PubMed Central
[51] Altmann A, Toloşi L, Sander O, Lengauer T. Permutation importance: a corrected feature importance measure. Bioinformatics. 2010;26(10):1340–7.10.1093/bioinformatics/btq134Search in Google Scholar PubMed
[52] Gregorutti B, Michel B, Saint-Pierre P. Correlation and variable importance in random forests. Stat Comput. 2017;27:659–78.10.1007/s11222-016-9646-1Search in Google Scholar
[53] Bekker M, Webber GV, Louw NR. Relating rheological measurements to primary and secondary skin feeling when mineral-based cosmetic emulsions and jellies are applied to the skin. Int J Cosmet Sci. 2013;35(4):354–61.10.1111/ics.12050Search in Google Scholar PubMed
[54] Bae JE, Ryoo JY, Kang NG. Effects of linear and nonlinear shear deformation on measurement for stickness of cosmetics using rotational rheometer. Korea J Cosmet Sci. 2020;2(1):33–46.Search in Google Scholar
[55] Karsheva M, Georgieva S, Handjieva S. The choice of the thickener – A way to improve the cosmetics sensory properties. J Univ Chem Technol Metall. 2007;42(2):187–94.Search in Google Scholar
[56] Gilbert L, Picard C, Savary G, Grisel M. Rheological and textural characterization of cosmetic emulsions containing natural and synthetic polymers: relationships between both data. Colloids Surf A: Physicochem Eng Asp. 2013;421:150–63.10.1016/j.colsurfa.2013.01.003Search in Google Scholar
[57] Vert M, Doi Y, Hellwich K, Hess M, Hodge P, Kubisa P, et al. Terminology for biorelated polymers and applications (IUPAC Recommendations 2012). Pure Appl Chem. 2012;84(2):377–410.10.1351/PAC-REC-10-12-04Search in Google Scholar
© 2024 the author(s), published by De Gruyter
This work is licensed under the Creative Commons Attribution 4.0 International License.
Articles in the same Issue
- Research Articles
- Bearing behavior of pile foundation in karst region: Physical model test and finite element analysis
- Study on precursor information and disaster mechanism of sudden change of seepage in mining rock mass
- Viscosity model based on Giesekus equation
- Two-dimensional rheo-optical measurement system to study dynamics and structure of complex fluids
- Assessment of heat transfer capabilities of some known nanofluids under turbulent flow conditions in a five-turn spiral pipe flow
- Cubic autocatalysis implementation in blood for non-Newtonian tetra hybrid nanofluid model through bounded artery
- Ramification of Hall effects in a non-Newtonian model past an inclined microchannel with slip and convective boundary conditions
- Computational analysis of nanoparticles and waste discharge concentration past a rotating sphere with Lorentz forces
- Viscoplastic fluid flow in pipes: A rheological study using in-situ laser Doppler velocimetry
- Prediction of sensory textures of cosmetics using large amplitude oscillatory shear and extensional rheology
- Effect of bell plate structure on high- and low-frequency characteristics of hydraulic mount
- Computational role of the heat transfer phenomenon in the reactive dynamics of catalytic nanolubricant flow past a horizontal microchannel
- Exploring concentration-dependent transport properties on an unsteady Riga plate by incorporating thermal radiation with activation energy and gyrotactic microorganisms
- Calendering of non-isothermal viscoelastic sheets of finite thickness: A theoretical study
- Electromagnetic control and heat transfer enhancement in exothermic reactions experiencing current density: The study preventing thermal explosions in reactive flow
- Characterization of the translational shear properties of the magnetorheological elastomers embedding the tilt chain-like structure
- Low-cost rolling ball viscometer for the evaluation of Newtonian and shear-thinning fluids
- Impact of calcination temperature, organic additive percentages, and testing temperature on the rheological behaviour of dried sewage sludge
- Rheo-NMR velocimetry of nanocrystalline cellulose suspensions
- Review Articles
- Master curves construction for viscoelastic functions of bituminous materials
- Electrorheological characterization of complex fluids used in electrohydrodynamic processes: Technical issues and challenges
- Corrigendum
- Corrigendum to: “The ductility performance of concrete using glass fiber mesh in beam specimens”
- Special Issue on The rheological test, modeling and numerical simulation of rock material - Part I
- Study on the evolution of permeability properties of limestone under different stress paths
- Shale hydraulic fracture morphology and inter-well interference rule under multi-wellbore test
- Investigation and numerical simulation study on the vertical bearing mechanism of large-diameter overlength piles in water-enriched soft soil areas
- Evolution characteristics of calcareous sand force chain based on particle breakage
- Structural damage characteristics and mechanism of granite residual soil
- Rheological characteristics and seepage laws of sandstone specimens containing an inclined single fracture under three-dimensional stress