Computational analysis of nanoparticles and waste discharge concentration past a rotating sphere with Lorentz forces
-
Pullare Nimmy
 ,
Anuar Ishak
,
Anuar Ishak

Abstract
As industries rely more and more on magnetohydrodynamic (MHD) systems for different uses in power, production, and management of the environment, it becomes essential to optimize these operations. The study seeks to improve the effectiveness and productivity of cooling structures, chemical reaction reactors, and contaminant control methods by investigating these intricate interconnections. Because of this, the work scrutinizes the endothermic/exothermic (EN/EX) chemical processes, convective boundary conditions, and pollutant concentration impacts on MHD nanofluid circulation around a rotating sphere. The governing equations based on the above assumptions are reduced into a system of ordinary differential equations and solved numerically with Runge–Kutta Fehlberg’s fourth- and fifth- order schemes. The obtained numerical outcomes from the numerical scheme are presented with the aid of graphs, and the results show that the rate of mass transfer decreases with an increase in the external pollutant local source and solid volume percentage. For changes in the values of the activation energy parameter and solid fraction, the rate of thermal dispersion drops for the EN case and upsurges for the EX case. The concentration profile shows increment with the addition of the external pollutant source variation parameter and local pollutant external source parameter. The outcomes of the present work can be helpful in cooling equipment, developing advanced methods for controlling pollution, environmental management, MHD generators, and various industrial contexts.
1 Introduction
The study of fluid flow around a rotating sphere has been the focused of a plethora of researchers owing to the numerous applications it has in practical engineering domains, such as chemical and food processing, thermal and nuclear plants, conveying of sediments in rivers, and combustion systems. For a while, there has been much research on spherical geometry owing to its dynamic flow characteristics and useful applications. Recently, the natural convection over a sphere placed in a porous medium was analyzed by Chamkha et al. [1]. The nonlinear convective flow of a Williamson nanoliquid past a revolving sphere was investigated by Patil and Benawadi [2]. The magnetohydrodynamic (MHD) flow and thermal transport of a Casson hybrid nanofluid (HNF) along a spinning sphere were discussed by Singla et al. [3]. Ahmad et al. [4] considered the stagnation point movement of an HNF stream around a rotating sphere. The Oldroyd-B NF path around a rotating sphere under convective heat conditions was assessed by Kenea and Ibrahim [5]. Nimmy et al. [6] discussed the effects of a chemical reaction on an MHD NF flow on a rotating sphere.
An alternative approach is to use active heat sources for the convective heat transfer process, which can influence both flow characteristics and help with temperature. The fluid motion under a magnetic field (called magnetohydrodynamics, MHD) analyzes and describes the dynamics of electrically conductive fluids that move. In recent years, scientists and engineers have been interested in MHD because it is relevant to many applications: transformers, generators, flow control, accelerators, and heating and cooling plants. Modification of a fluid’s thermophysical properties, like thermal conductivity and viscosity, can be brought about by introducing a magnetic field into the gas. Its magnetic field causes the flow rate, pressure, speed, and temperature of the fluid to change. So, one might ask what happens when a magnetic field is placed within that. The results of this question are truly remarkable in flow control applications. This has presented increased significance in thermal power and other industrial fields. So, we now use magnetically driven heat piping for cooling electronic devices and secondary circulation for liquid handling in pipes in the metallurgical industry to be vaporized and fed into solidification hearths where it may then solidify as a plate product of nuclear power water heater. Over a cone, the unsteady mass and heat transfer of fluid under the impact of the magnetic field were scrutinized by Chamkha and Rashad [7]. Under the influence of the magnetic field, the Maxwell NF movement across a rotating disk was investigated by Srilatha et al. [8]. With the influence of gyrotactic microorganisms and a magnetic dipole, the 3D flow of a non-Newtonian fluid was studied by Madhu et al. [9]. The influence of the magnetic field on the mass and heat transfer of an HNF flow along a porous medium was investigated by Sharma et al. [10]. The effect of a magnetic field on the stabilization of triple component magneto-convection for porous fluid systems was considered by Manjunatha et al. [11]. The MHD flow of hybrid ferroparticles accompanied by thermal radiation was studied by Gherieb et al. [12]. Additional significant research on magnetic fields is presented in the studies of Krishna et al., Kumar et al., Manjunatha et al., Khan et al., and Alharbi et al. [13–17].
Studies on convective heat transmission are essential for processes requiring extremely high temperatures, such as those in nuclear power plants and thermal energy storage. Because of its extensive application in manufacturing and technical industries, as well as its power supply to electronic devices and computer gadgets, the study of boundary layer problems with convective boundary conditions (BCs) has recently caught the attention of academics. Recently, the effect of convective heat transfer in a Maxwell NF stream was elucidated by Algehyne et al. [18]. The analysis of heat transfer of an HNF flow over a cone together with the convective BC was elucidated by Yahaya et al. [19]. The motion of NF along the surface of a cone with convective BCs was deliberated by Francis et al. [20]. Incorporated with the convective BCs, the mass and heat transfer enhancement of a Maxwell NF was probed by Hussain et al. [21]. Over a stretching sheet embedded in a porous medium, the HNF flow with convective conditions was simulated by Akbar et al. [22].
Energy is transported through and out of the environment during a chemical reaction, causing an increase or decrease in the temperature profile. The chemical reaction where energy is discharged into the surrounding environment is termed an exothermic chemical reaction (EX CR), and the process in which energy is extracted from the external medium is described as the endothermic chemical reaction (EN CR). The most prevalent kind of energy transfer is heat energy, which heats the surrounding environment. Hydrogen ions are released when an acid ionizes and dissolves in water. As a result, heat is released into the air. As a result, EX reactions include the burning of firewood, rusting of iron, and reactions of an acid with water. The EN CR produces a cooling effect and lowers the temperature in that vicinity. An example of an EN reaction is when the ice cube melts in water by receiving heat energy from the surroundings into the liquid. Ambient temperature increases after an EX process and decreases in the case of an EN reaction. A large number of investigators have studied the mass and heat transfer flow by using endothermic–exothermic chemical reactions (EN-EX CRs) near different geometries. Chu et al. [23] conducted a study on the HNF flow over a parabolic stretching surface with the CR and activation energy. Madhukesh et al. [24] investigated the impact of EN-EX CRs on NF transportation in a microchannel. In light of the results obtained for EN-EX CRs and activation energy, Singh et al. [25] inspected the transport of tri-hybrid NF flow past a wedge-cone surface.
The number of contaminants existing in soil, water, or air is referred to as the pollutant concentration. The globe has been worried about the unchecked rise in pollutants in recent years because of the expansion in industrial facilities, vehicles, and industrial waste, as well as the release of various hazardous gases into the atmosphere and a rise in the disposal of trash into water bodies. The health of humans, animals, and other living beings is more significantly impacted by pollutants. Nanoparticles exhibit a variety of properties that facilitate the removal of contaminants and can increase heat transfer. To determine the wide range of flow and concentrations of pollutant dispersion, experimental approaches based on field measurements are frequently employed. Elattar et al. [26] scrutinized the pollutant concentration in an NF stream past a plane surface. With the presence of waste discharge concentration, the HNF over an elongating surface was deliberated by Yaseen et al. [27]. Over a surface with varying thicknesses, Ramesh et al. [28] explored the impact of EN-EX CR and waste discharge concentration. Over a Riga plate, the effects of pollutant concentration on non-Newtonian NF movement were explored by Xin et al. [29].
Nanotechnology which is technically developed and deals with certain types of nanomaterials has been widely utilized to improve the characteristics of heat transfer in numerous fluids. The low thermal conductivity of many liquids is the main obstacle to boosting heat transmission in the electrical and mechanical approaches. It thus needs fluids with better thermal characteristics. Hence, in 1995, Choi and Eastman developed a suspension called “Nanofluid” by incorporating nanoparticles into the base fluid comprising ethylene glycol, oil, kerosene, and water. Compared to base fluids, nanofluids (NFs) possess higher thermal properties and better thermal conductivity. Applications for the superior properties of NFs may be found in a wide range of industries, such as food processing, heat exchangers, nuclear reactors, cooling appliances, medicinal equipment, and thermal management systems. Concerning these applications, the boundary layer flow past a porous medium saturated with an NF was studied by Chamkha and Rashad [30]. Over a stretching sheet, the unsteady flow of Maxwell NF was investigated by Madhu et al. [31]. The effects of ion and Hall slip on MHD flow across a vertical plate were examined by Krishna and Chamkha [32]. The thermal transport of a non-Newtonian NF over a stretching surface was elucidated by Sohail et al. [33]. Using finite element method, Liu et al. [34] investigated the thermal transport of HNF in the Prandtl fluid structure along a porous sheet. Under the influence of thermal radiation, Madhu et al. [35] probed the HNF flow over a cylinder. The impact of thermal radiation and thermophoretic effects on an NF along a microchannel was investigated by Nimmy et al. [36]. Works of Takhar et al., Sohail and Abbas, and Bai et al. [37–39] also contain some relevant studies on NFs.
Several studies have been published on the individual effects such as EN-EX CRs, convective BCs, and pollutant concentrations, but very few research articles are available regarding these aspects for the orientational flow of MHD NFs across a rotating sphere. The research void would allow us to explore a new and undiscovered area of study. This study could provide valuable information on the collective effects and interaction of NF circulation in these circumstances. Understanding these dynamics matters a lot, as they affect different engineering aspects that are responsible for the success of industries and production processes. This research could improve industrial processes and help planning for environmental preservation. By investigating these parameters, this research is aimed at enhancing the efficiency and sustainability of industrial applications with less environmental negative side effects.
2 Mathematical background of the flow problem
In the current work, an incompressible boundary layer circulation of NFs (a water and titanium oxide mixture) in a forward stagnation point with a constant temperature is examined around a rotating sphere object in the presence of an external pollutant concentration, a magnetic field, and the thermal radiation effect (Figure 1). Therefore,
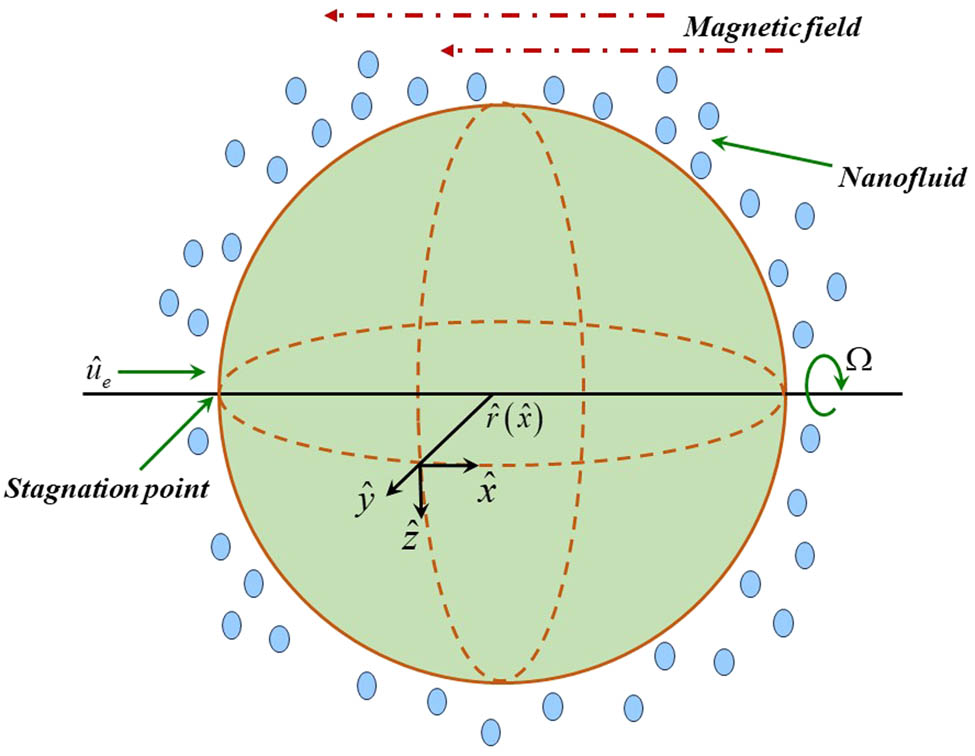
Flow geometry of the problem.
The appropriate initial and BCs are as follows:
Here,
Furthermore, to ease the analysis of the problem, we need to introduce the following similarity variables such as:
Using equation (8), the governing equations (1)–(5) are converted into the requisite posited ODEs, which are displayed as follows:
The simplified BCs are as follows:
The above-stated equations comprise distinct influential parameters. The corresponding nondimensional parameters are mathematically defined in Table 1 along with the name of the parameters.
Non-dimensional parameters
| Formula | Name of the parameter |
|---|---|
|
|
Acceleration parameter |
|
|
Rotation parameter |
|
|
Prandtl number |
|
|
Temperature ratio parameter |
|
|
Schmidt number |
|
|
Chemical reaction rate |
|
|
Activation energy |
|
|
EN-EX reaction constraint |
|
|
Local pollutant external source parameter |
|
|
External pollutant source variation parameter |
The engineering physical quantities of interest are the coefficients of skin friction
The reduced engineering coefficients are given as follows:
where
Thermophysical properties of the NF [43]
| Properties | Correlations |
|---|---|
| Density |
|
| Heat capacity |
|
| Dynamic viscosity |
|
| Thermal conductivity |
|
| Electrical conductivity |
|
Thermophysical properties of the base fluid and nanoparticles [44]
| Properties |
|
|
|
|
|
|---|---|---|---|---|---|
| TiO2 | 4,250 | 686.2 | 8.9538 |
|
— |
| H2O | 997.1 | 4,179 | 0.613 |
|
6.2 |
3 Methodology
In scientific and engineering problems, ordinary differential equations are commonly encountered and are usually solved via the Runge–Kutta technique. The integrated method RKF-45 originates from the Runge–Kutta domain, where techniques with similar errors and distinct orders are created by merging identical functions. This strategy, which combines the fifth-order scheme with the fourth-order Runge–Kutta scheme, aids in the very accurate approximation of ODE solutions as compared to lower-order approaches. The ability of the RKF-45 technique to adaptively vary the step size during integration is one of its key advantages. This helps to maintain the accuracy and capture variations in the associated solution. RKF-45 is advantageous for solving ODEs in a range of scientific and engineering applications because of the fifth-order component’s contribution in improving the accuracy and the fourth-order component’s computing efficiency.
The following is the RKF-45 method’s algorithm:
The following lists the six steps in the approach.
As the generated equations (9)–(12) and BCs (13) and (14) are very challenging to solve analytically, the resultant equations are reduced to the first order in order to determine the numerical solution. This approach can break down the problem and facilitate a solution. For this, the following substitutions are employed.
Thus, the equations in (9)–(12) are transformed into
The boundary constraints are transformed into
The transformed equations are solved via the RKF-45 approach. Since the BCs include unknowns, a shooting technique is being implemented to identify the solution that meets the conditions at infinity. This is accomplished by giving the parameter values, choosing an error tolerance of around 10−6 and a step size of 0.01. Using the thermophysical properties of the NF given in Table 3 and setting the default values for every parameter, that is,
Validation of code with the work of Malvandi [45] for some limiting cases (
|
|
0.5 | 1 | 2 | |
|---|---|---|---|---|
| Malvandi [45] |
|
0.467648 | 0.589527 | 0.779526 |
| Current study | 0.467643 | 0.589532 | 0.779529 | |
| Malvandi [45] |
|
0.79913 | 1.2828 | 1.9172 |
| Current study | 0.79915 | 1.2842 | 1.9175 | |
| Malvandi [45] |
|
0.30339 | 0.64579 | 1.05415 |
| Current study | 0.30341 | 0.64586 | 1.05416 | |
4 Analysis of results
This section presents the results of the study derived from the numerical analysis. The influence of distinct dimensionless constraints and how they affect various profiles are further elaborated upon in detail. This section provides detailed explanations of the key physical variables and various limitations that affect the rates of heat transfer, mass transfer, and surface drag force.
The influence of
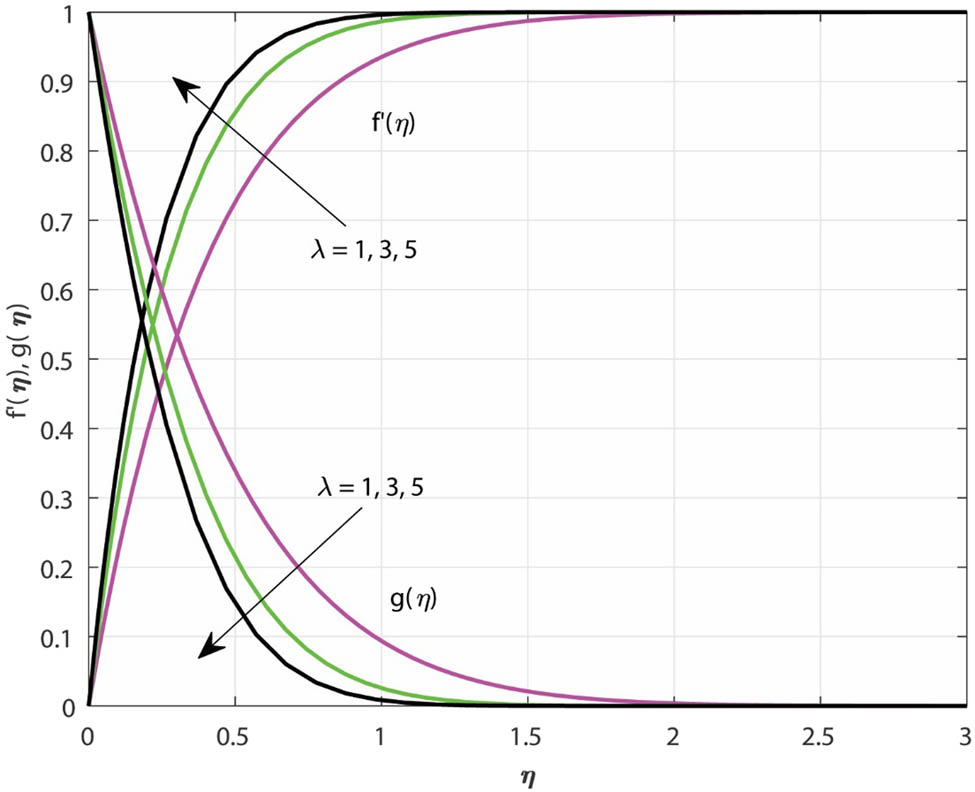
Variations in
The impact of
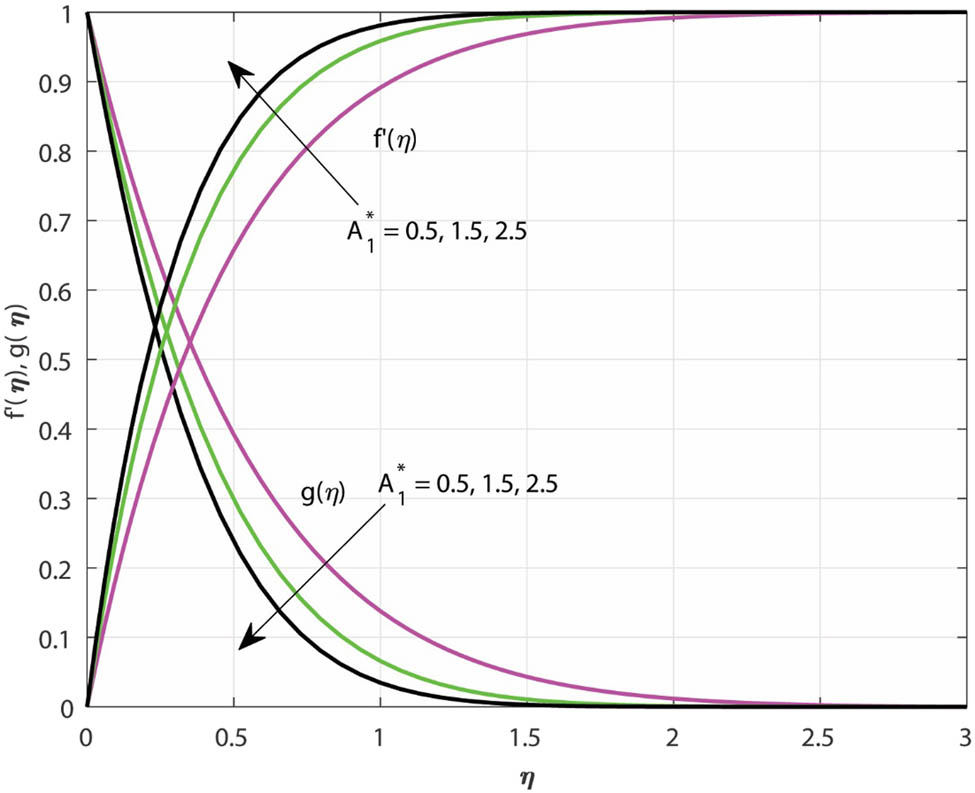
Variations in
The variations in
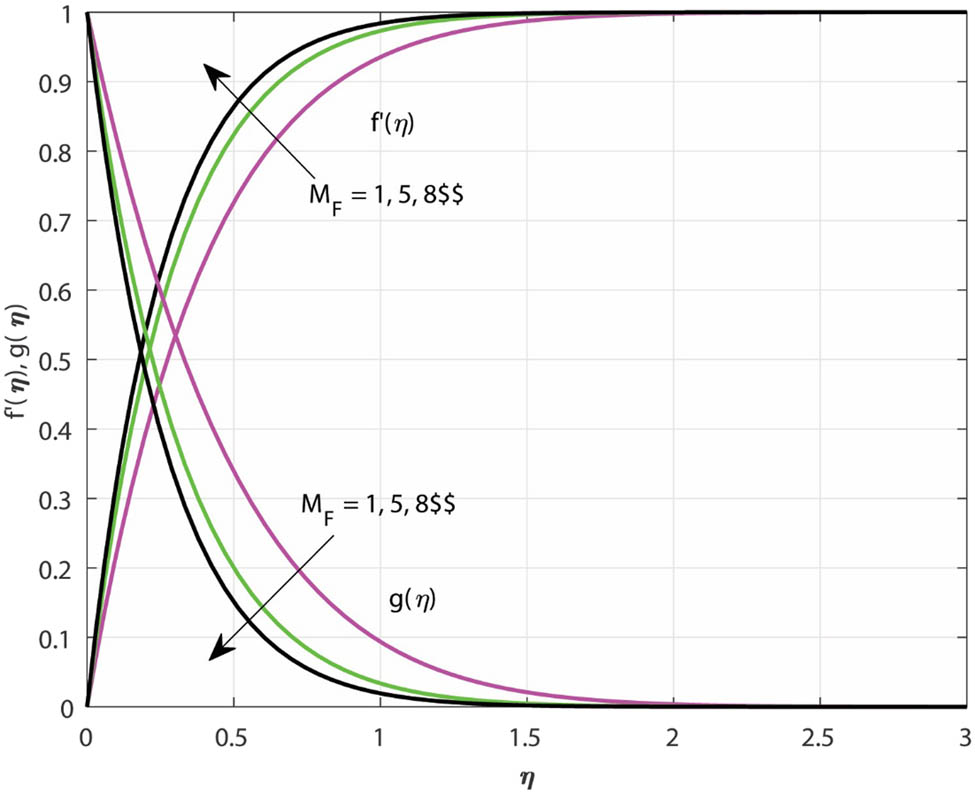
Variations in
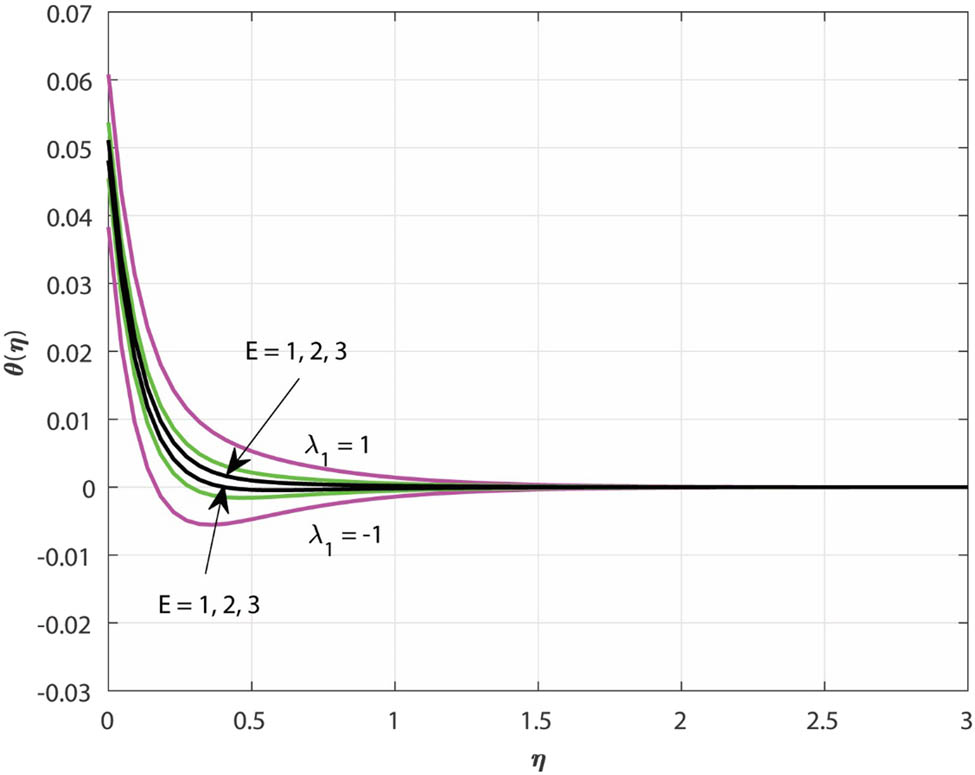
For EN (
Variations in
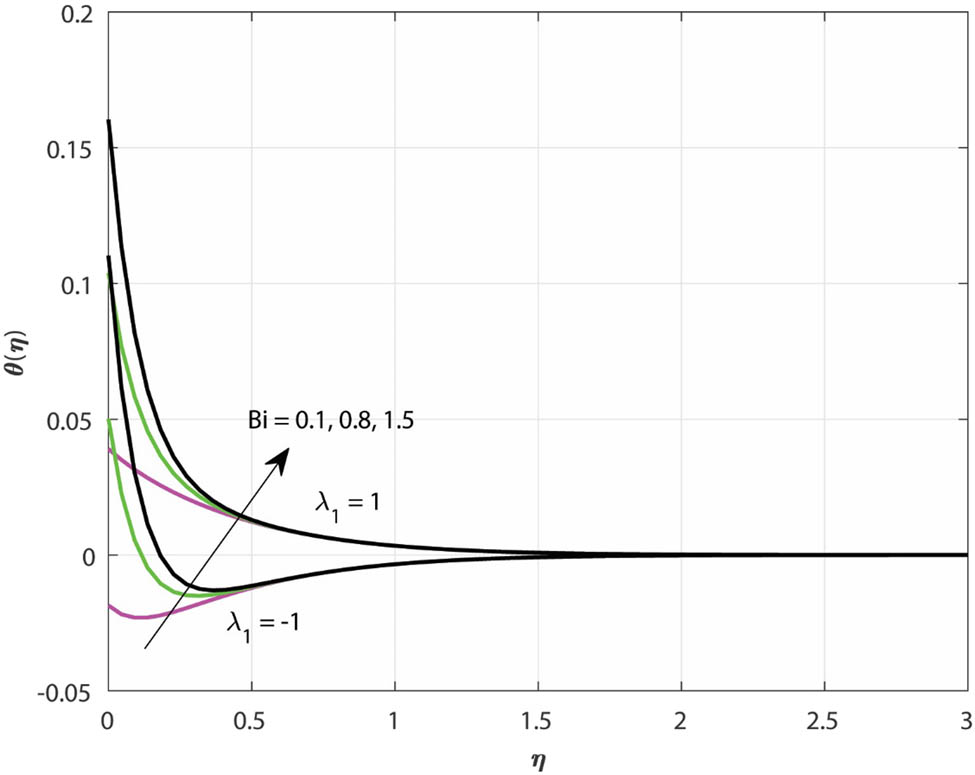
The impact of Biot number
Variations in
The variation in
Variations in
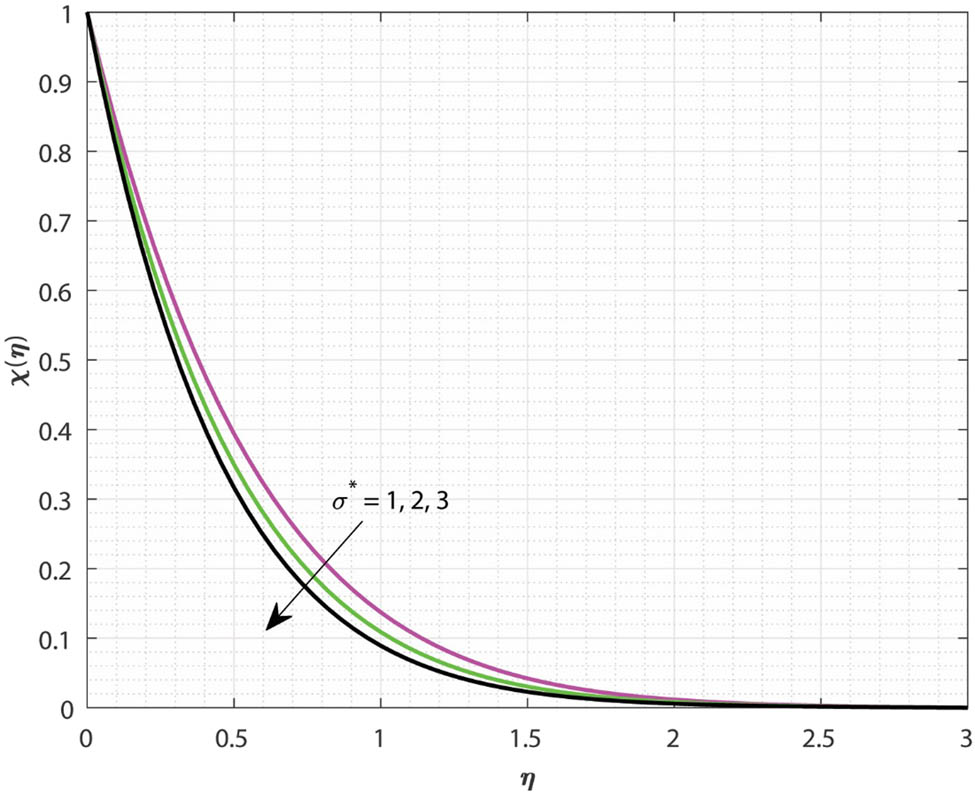
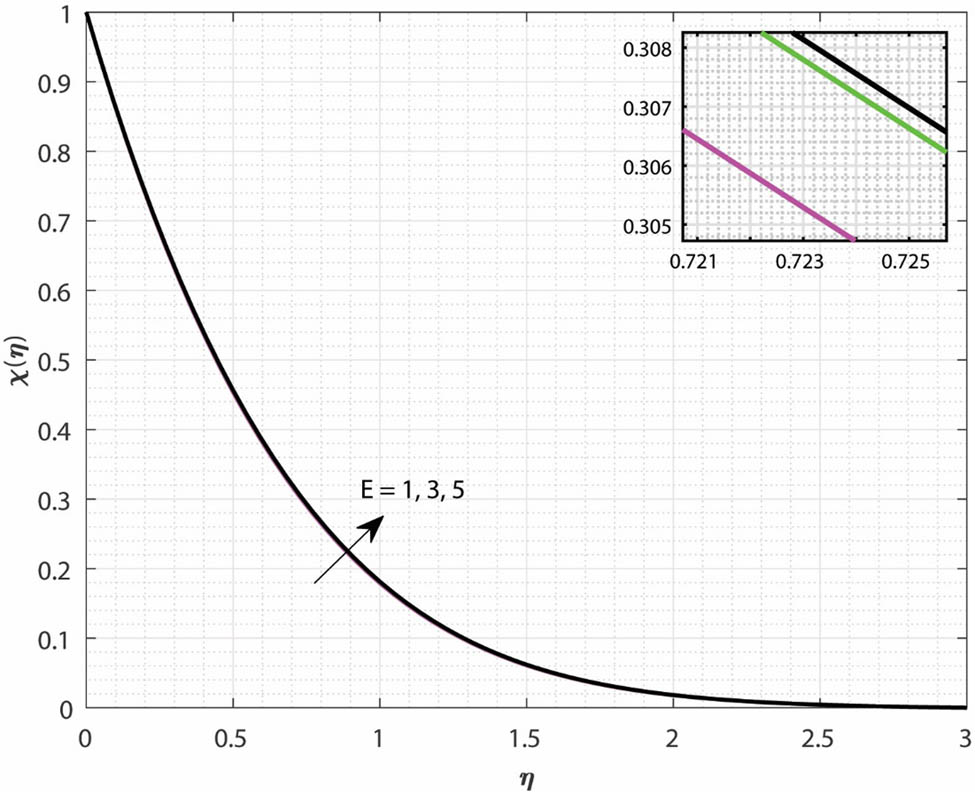
The nature of the concentration profile
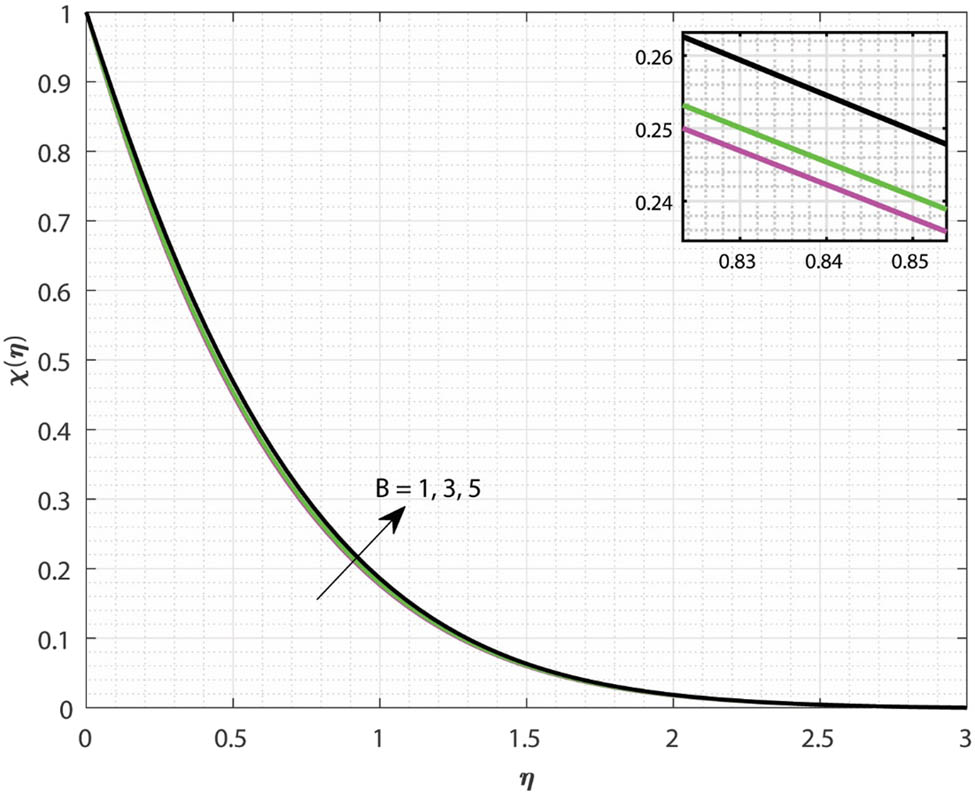
Variations in

Variations in
The influence of
Variations in
Figure 11 presents the impact of
Variations in
Figures 12 and 13 display the variations of the skin friction coefficient
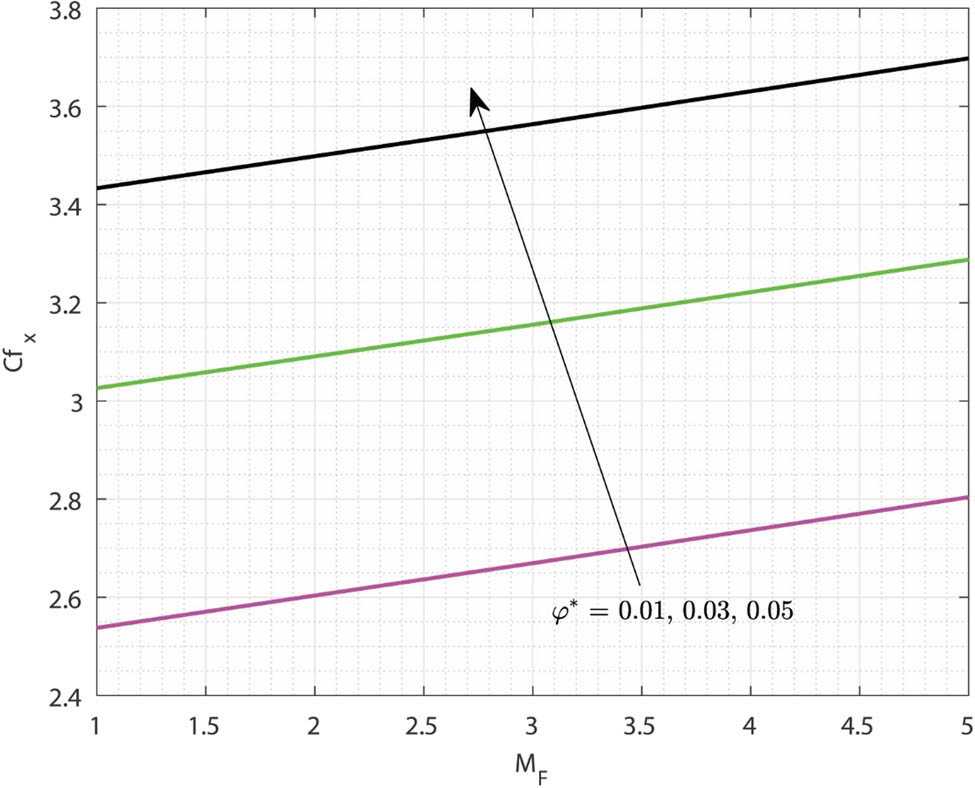
Variations in
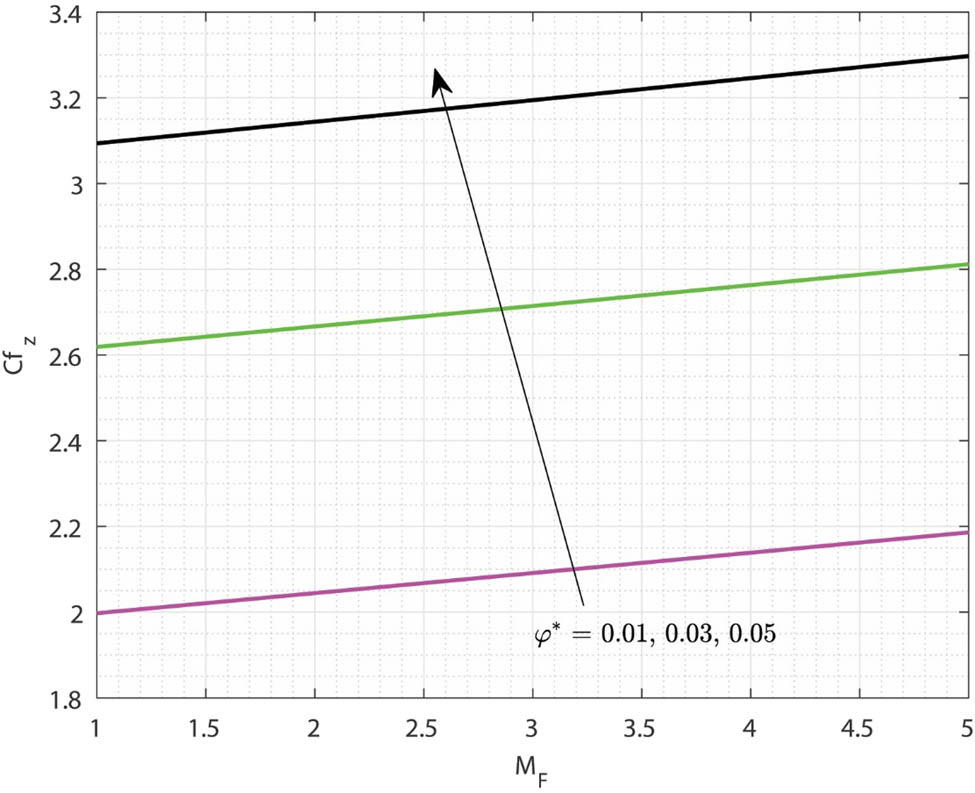
Variations in
The impact of
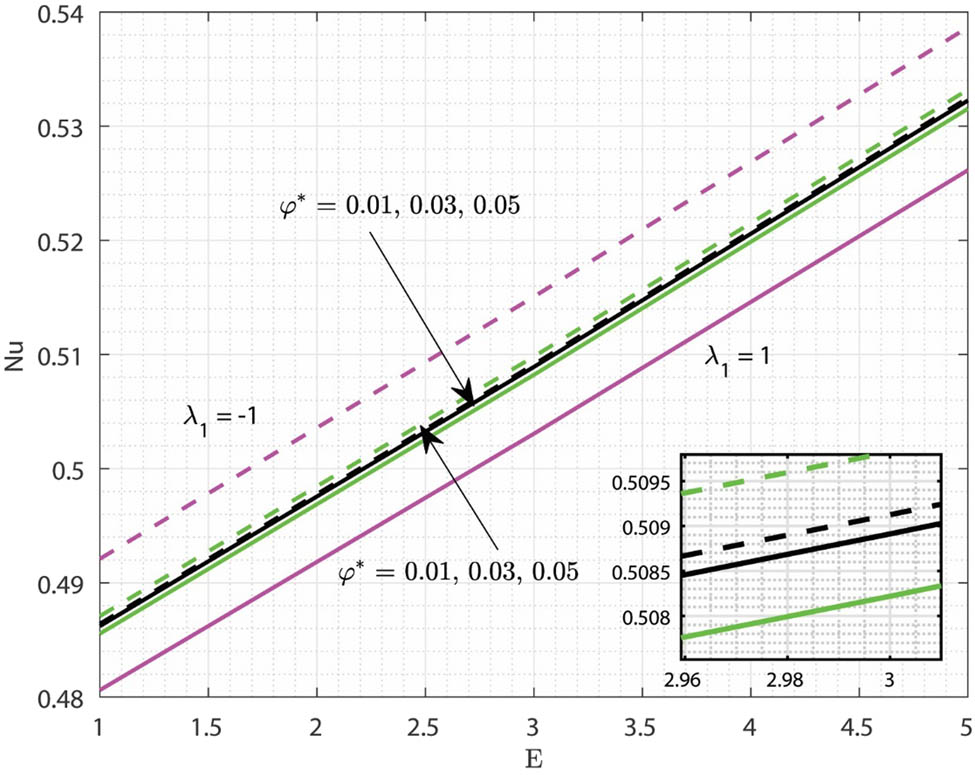
Variations in
Figure 15 demonstrates the influence of mass transfer on the local pollutant external source
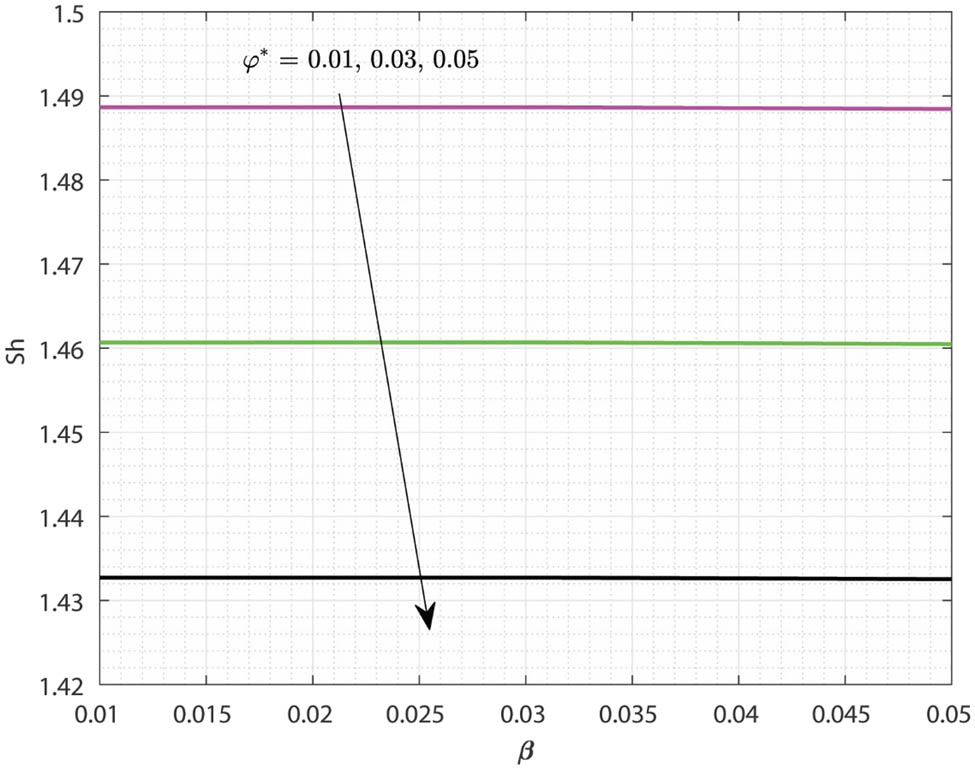
Variations in
5 Final remarks
The current research investigates the thermodynamic properties of chemical reactions, the influence of convective BCs, and the effect of pollutant concentration on the circulation of MHD NFs around a spinning sphere. The numerical results of simplified equations are obtained using a highly efficient numerical method, and these results are thoroughly analyzed and discussed. The study yielded the following novel findings.
The primary velocity increases for enhanced values of magnetic, rotation, and acceleration constraints, while a reverse behavior is seen for the secondary velocity.
The temperature decreases in the EX case and increases in the EN case for increasing values of activation energy constraint, while an opposite behavior is observed in the case of chemical reaction constraint.
In both EN/EX cases, temperature increases for Bi values.
Concentration profile shows improvement for increased values of local pollutant source and external pollutant source parameters.
The rate of thermal distribution decreases for an EN case and enhances for an EX case for changes in the values of solid fraction and activation energy parameter.
The rate of mass transfer decreases with an increase in the external pollutant local source and solid volume percentage.
The outcomes of this study have several practical implications in the real world. It can optimize thermal management, hence enhancing cooling systems in power plants and electronic gadgets. Chemical reactors can enhance the reaction efficiency and performance. The study’s findings on the impacts of pollutants are helpful for the development of sophisticated contaminant management and environmental protection measures. Furthermore, it has the potential to enhance the functionality of energy production systems, such as MHD generators, by improving their operations. In summary, the results enhance the development of more efficient and long-lasting solutions in many commercial and ecological contexts.
Acknowledgements
This work was funded by the Universiti Kebangsaan Malaysia project number “DIP-2023-005.” The authors thank the Deanship of Scientific Research, Islamic University of Madinah, Madinah, Saudi Arabia, for supporting this research work. In addition, this study was supported via funding from the Prince Sattam bin Abdulaziz University project number (PSAU/2024/R/1445).
-
Funding information: This work was funded by the Universiti Kebangsaan Malaysia project number “DIP-2023-005.” The authors thank the Deanship of Scientific Research, Islamic University of Madinah, Madinah, Saudi Arabia, for supporting this research work. In addition, this study was supported via funding from the Prince Sattam bin Abdulaziz University project number (PSAU/2024/R/1445).
-
Author contributions: P.N., A.M.O., and K.V.N: conceptualization, methodology, software, formal analysis, validation, and writing – original draft. J.K.M. and U.K.: Writing – original draft, data curation, investigation, visualization, software, and validation. A.I.: conceptualization, writing – review & editing, supervision, resources, and writing – original draft. D.S. and R.K.: validation, writing – review & editing, software, and writing – original draft. S.M.H. and A.M.A.: validation, writing – review & editing, software, provided significant feedback, and assisted in the revised version of the manuscript. Further, they have also supported revising the manuscript critically for important intellectual content.
-
Conflict of interest: The authors declare that they have no conflict of interest.
-
Data availability statement: The datasets used and/or analyzed during the current study are available from the corresponding author upon reasonable request.
References
[1] Chamkha A, Gorla RSR, Ghodeswar K. Non-similar solution for natural convective boundary layer flow over a sphere embedded in a porous medium saturated with a nanofluid. Transp Porous Med. 2011;86:13–22. 10.1007/s11242-010-9601-0.Search in Google Scholar
[2] Patil PM, Benawadi S. The mixed convection flow of a Williamson nanoliquid over a rotating sphere with the aspects of activation energy. Int J Model Simul. 2024;44:31–43. 10.1080/02286203.2022.2151965.Search in Google Scholar
[3] Singla T, Kumar B, Sharma S. Mixed convective viscous dissipative flow of Casson hybrid nanofluid with variable thermal conductivity at the stagnation zone of a rotating sphere. Can J Chem Eng. 2024. 10.1002/cjce.25352.Search in Google Scholar
[4] Ahmad H, Alnahdi AS, Bilal M, Albalwi MD, Faqihi AA. Energy and mass transmission through hybrid nanofluid flow passing over a spinning sphere with magnetic effect and heat source/sink. Nanotechnol Rev. 2024;13. 10.1515/ntrev-2023-0194.Search in Google Scholar
[5] Kenea G, Ibrahim W. Nonlinear convection stagnation point flow of Oldroyd-B nanofluid with non-Fourier heat and non-Fick’s mass flux over a spinning sphere. Sci Rep. 2024;14:841. 10.1038/s41598-024-51475-z.Search in Google Scholar PubMed PubMed Central
[6] Nimmy P, Obalalu AM, Nagaraja KV, Madhukesh JK, Khan U, Ishak A, et al. Thermal scrutinization of time-dependent flow of nanoparticles over a rotating sphere with autocatalytic chemical reaction. Eur Phys J Plus. 2024;139:291. 10.1140/epjp/s13360-024-05081-7.Search in Google Scholar
[7] Chamkha AJ, Rashad AM. Unsteady heat and mass transfer by MHD mixed convection flow from a rotating vertical cone with chemical reaction and Soret and Dufour effects. Can J Chem Eng. 2014;92:758–67. 10.1002/cjce.21894.Search in Google Scholar
[8] Srilatha P, Madhu J, Khan U, Kumar RN, Gowda RP, Ahmed SB, et al. Heat transfer analysis in magnetohydrodynamic nanofluid flow induced by a rotating rough disk with non-Fourier heat flux: aspects of modified Maxwell–Bruggeman and Krieger–Dougherty models. Nanoscale Adv. 2023;5:5941–51. 10.1039/D3NA00711A.Search in Google Scholar
[9] Madhu J, Baili J, Kumar RN, Prasannakumara BC, Gowda RJP. Multilayer neural networks for studying three-dimensional flow of non-Newtonian fluid flow with the impact of magnetic dipole and gyrotactic microorganisms. Phys Scr. 2023;98:115228. 10.1088/1402-4896/acfe5e.Search in Google Scholar
[10] Sharma G, Hanumagowda BN, Varma SVK, Kumar RN, Alqahtani AS, Malik MY. Impact of magnetic field and nonlinear radiation on the flow of Brinkmann-type chemically reactive hybrid nanofluid: a numerical study. J Therm Anal Calorim. 2024;149:745–59. 10.1007/s10973-023-12720-1.Search in Google Scholar
[11] Manjunatha N, Yellamma, Sumithra R, Verma A, Gowda RP, Madhu J. The impact of the heat source/sink on triple component magneto-convection in superposed porous and fluid system. Mod Phys Lett B. 2024;38:2450020. 10.1142/S0217984924500209.Search in Google Scholar
[12] Gherieb S, Kezzar M, Ayub A, Sari MR, Khan U, Muhammad T, et al. Insight into the dynamics of slip and radiative effect on magnetohydrodynamic flow of hybrid ferroparticles over a porous deformable sheet. ZAMM – J Appl Math Mech/Z Für Angew Math Und Mech. 2024;104:e202300729. 10.1002/zamm.202300729.Search in Google Scholar
[13] Krishna MV, Swarnalathamma BV, Chamkha AJ. Investigations of Soret, Joule and Hall effects on MHD rotating mixed convective flow past an infinite vertical porous plate. J Ocean Eng Sci. 2019;4:263–75. 10.1016/j.joes.2019.05.002.Search in Google Scholar
[14] Kumar B, Seth GS, Nandkeolyar R, Chamkha AJ. Outlining the impact of induced magnetic field and thermal radiation on magneto-convection flow of dissipative fluid. Int J Therm Sci. 2019;146:106101. 10.1016/j.ijthermalsci.2019.106101.Search in Google Scholar
[15] Manjunatha S, Kuttan BA, Jayanthi S, Chamkha A, Gireesha BJ. Heat transfer enhancement in the boundary layer flow of hybrid nanofluids due to variable viscosity and natural convection. Heliyon. 2019;5:e01469. 10.1016/j.heliyon.2019.e01469.Search in Google Scholar PubMed PubMed Central
[16] Khan U, Zaib A, Ishak A, Sherif E-SM, Wróblewski P. Unsteady slip flow of special second-grade fluid induced by Fe3O4 particles past a movable sheet with magnetic and nonlinear heat source/sink. Int J Numer Methods Heat Fluid Flow. 2024;34:2321–44. 10.1108/HFF-01-2024-0030.Search in Google Scholar
[17] Alharbi LF, Khan U, Zaib A, Ishak A. Analyzing the impact of thermophoresis particle deposition and magnetohydrodynamic cross-flow of Williamson hybrid nanofluids across a permeable deformable surface. ZAMM – J Appl Math Mech/Z Für Angew Math Und Mech. 2024;104:e202300947. 10.1002/zamm.202300947.Search in Google Scholar
[18] Algehyne EA, Abdelmohsen SAM, Gowda RJP, Kumar RN, Abdelbacki AMM, Gorji MR, et al. Mathematical modeling of magnetic dipole effect on convective heat transfer in Maxwell nanofluid flow: single and multi-walled carbon nanotubes. Waves Random Complex Media. 2023;33:489–504. 10.1080/17455030.2022.2125598.Search in Google Scholar
[19] Yahaya RI, Mustafa MS, Arifin NM, Pop I, Wahid NS, Ali FM, et al. Mixed convection hybrid nanofluid flow over a stationary permeable vertical cone with thermal radiation and convective boundary condition. ZAMM – J Appl Math Mech/Z Für Angew Math Und Mech. 2024;104:e202300428. 10.1002/zamm.202300428.Search in Google Scholar
[20] Francis P, Sambath P, Fernandez-Gamiz U, Noeiaghdam S, Dinarvand S. Computational analysis of bio-convective Eyring-Powell nanofluid flow with magneto-hydrodynamic effects over an isothermal cone surface with convective boundary condition. Heliyon. 2024;10:e25088. 10.1016/j.heliyon.2024.e25088.Search in Google Scholar PubMed PubMed Central
[21] Hussain Z, Aljuaydi F, Ayaz M, Islam S. Enhancing thermal efficiency in MHD kerosene oil-based ternary hybrid nanofluid flow over a stretching sheet with convective boundary conditions. Results Eng. 2024;22:102151. 10.1016/j.rineng.2024.102151.Search in Google Scholar
[22] Akbar NS, Zamir T, Akram J, Noor T, Muhammad T. Simulation of hybrid boiling nano fluid flow with convective boundary conditions through a porous stretching sheet through Levenberg Marquardt artificial neural networks approach. Int J Heat Mass Transf. 2024;228:125615. 10.1016/j.ijheatmasstransfer.2024.125615.Search in Google Scholar
[23] Chu Y-M, Nazir U, Sohail M, Selim M, Lee J-R. Enhancement in thermal energy and solute particles using hybrid nanoparticles by engaging activation energy and chemical reaction over a parabolic surface via finite element approach. Fractal Fract. 2021;5:119. 10.3390/fractalfract5030119.Search in Google Scholar
[24] Madhukesh JK, Prasannakumara BC, Shehzad SA, Anwar MI, Nasir S. Endothermic and exothermic chemical reactions’ influences on a nanofluid flow across a permeable microchannel with a porous medium. Int J Ambient Energy. 2024;45:2325515. 10.1080/01430750.2024.2325515.Search in Google Scholar
[25] Singh V, Naduvinamani NB, Vinutha K, Prasannakumara BC, Madhukesh JK, Abdulrahman A. Sodium alginate-based MHD ternary nanofluid flow across a cone and wedge with exothermic/endothermic chemical reactions: A numerical study. Numer Heat Transfer, Part A: Appl. 2024;1–20. 10.1080/10407782.2024.2355520.Search in Google Scholar
[26] Elattar S, Khan U, Zaib A, Ishak A, Saleh W, Abed AM. Scrutinization of waste discharge concentrations in Eyring-Powell nanofluid past a deformable horizontal plane surface. Water. 2023;15:3419. 10.3390/w15193419.Search in Google Scholar
[27] Yaseen M, Rawat SK, Khan U, Sarris IE, Khan H, Negi AS, et al. Computational analysis of heat and mass transfer flow of wall jet hybrid nanofluid with irregular heat source/sink effects and waste discharge concentration. J Magn Magn Mater. 2023;588:171434. 10.1016/j.jmmm.2023.171434.Search in Google Scholar
[28] Ramesh GK, Madhukesh JK, Aly EH, Gireesha BJ. Endothermic and exothermic chemical reaction on MHD ternary (Fe2O4–TiO2–Ag/H2O) nanofluid flow over a variable thickness surface. J Therm Anal Calorim. 2024;149:6503–15. 10.1007/s10973-024-13013-x.Search in Google Scholar
[29] Xin X, Ganie AH, Alwuthaynani M, Bonyah E, El-Wahed Khalifa HA, Fathima D, et al. Parametric analysis of pollutant discharge concentration in non-Newtonian nanofluid flow across a permeable Riga sheet with thermal radiation. AIP Adv. 2024;14:045018. 10.1063/5.0200401.Search in Google Scholar
[30] Chamkha AJ, Rashad AM. Natural convection from a vertical permeable cone in a nanofluid saturated porous media for uniform heat and nanoparticles volume fraction fluxes. Int J Numer Methods Heat Fluid Flow. 2012;22:1073–85. 10.1108/09615531211271871.Search in Google Scholar
[31] Madhu M, Kishan N, Chamkha AJ. Unsteady flow of a Maxwell nanofluid over a stretching surface in the presence of magnetohydrodynamic and thermal radiation effects. Propuls Power Res. 2017;6:31–40. 10.1016/j.jppr.2017.01.002.Search in Google Scholar
[32] Krishna MV, Chamkha AJ. Hall and ion slip effects on unsteady MHD convective rotating flow of nanofluids – Application in biomedical engineering. J Egypt Math Soc. 2020;28:1. 10.1186/s42787-019-0065-2.Search in Google Scholar
[33] Sohail M, Alrabaiah H, Nazir U. Radiative flow of MHD non-Newtonian fluid by utilizing the updated version of heat flux model under Joule heating. Heat Transf. 2021;50:3407–25. 10.1002/htj.22034.Search in Google Scholar
[34] Liu J, Nazir U, Sohail M, Mukdasai K, Singh A, Alanazi M, et al. Numerical investigation of thermal enhancement using MoS2–Ag/C2H6O2 in Prandtl fluid with Soret and Dufour effects across a vertical sheet. AIP Adv. 2023;13:075112. 10.1063/5.0152262.Search in Google Scholar
[35] Madhu J, Madhukesh JK, Sarris I, Prasannakumara BC, Ramesh GK, Shah NA, et al. Influence of quadratic thermal radiation and activation energy impacts over oblique stagnation point hybrid nanofluid flow across a cylinder. Case Stud Therm Eng. 2024;60:104624. 10.1016/j.csite.2024.104624.Search in Google Scholar
[36] Nimmy P, Kumar RN, Madhukesh JK, Khan U, Ishak A, Nagaraja KV, et al. The significance of quadratic thermal radiative scrutinization of a nanofluid flow across a microchannel with thermophoretic particle deposition effects. Nanotechnol Rev. 2024;13. 10.1515/ntrev-2024-0045.Search in Google Scholar
[37] Takhar HS, Chamkha AJ, Nath G. Combined heat and mass transfer along a vertical moving cylinder with a free stream. Heat Mass Transf. 2000;36:237–46. 10.1007/s002310050391.Search in Google Scholar
[38] Sohail M, Abbas ST. Utilization of variable thermal conductivity and diffusion coefficient on non-Newtonian Prandtl model with modified heat and mass fluxes. Multidiscip Model Mater Struct. 2024;20:317–40. 10.1108/MMMS-10-2023-0328.Search in Google Scholar
[39] Bai D, Muhammad N, Shah NA, Ali B, Raju CSK, Wakif A, et al. OpenFOAM simulation of turbulent flow in a complex dam structure. Indian J Phys. 2024;98:3277–86. 10.1007/s12648-024-03085-8.Search in Google Scholar
[40] Madhukesh JK, Sahar F, Prasannakumara BC, Shehzad SA. Waste discharge concentration and quadratic thermal radiation influences on time-dependent nanofluid flow over a porous rotating sphere. Numer Heat Transfer, Part B: Fundam. 2024;1–19. 10.1080/10407790.2024.2336205.Search in Google Scholar
[41] Karthik K, Srilatha P, Madhukesh JK, Khan U, Prasannakumara BC, Kumar R, et al. Computational examination of heat and mass transfer of nanofluid flow across an inclined cylinder with endothermic/exothermic chemical reaction. Case Stud Therm Eng. 2024;57:104336. 10.1016/j.csite.2024.104336.Search in Google Scholar
[42] Ramesh GK, Madhukesh JK, Ali Shah N, Yook S-J. Flow of hybrid CNTs past a rotating sphere subjected to thermal radiation and thermophoretic particle deposition. Alex Eng J. 2023;64:969–79. 10.1016/j.aej.2022.09.026.Search in Google Scholar
[43] Devi SPA, Devi SSU. Numerical investigation of hydromagnetic hybrid Cu – Al2O3/water nanofluid flow over a permeable stretching sheet with suction. Int J Nonlinear Sci Numer Simul. 2016;17:249–57. 10.1515/ijnsns-2016-0037.Search in Google Scholar
[44] Waini I, Khan U, Zaib A, Ishak A, Pop I. Inspection of TiO2-CoFe2O4 nanoparticles on MHD flow toward a shrinking cylinder with radiative heat transfer. J Mol Liq. 2022;361:119615. 10.1016/j.molliq.2022.119615.Search in Google Scholar
[45] Malvandi A. The unsteady flow of a nanofluid in the stagnation point region of a time-dependent rotating sphere. Therm Sci. 2015;19:1603–12. 10.2298/TSCI121020079M.Search in Google Scholar
© 2024 the author(s), published by De Gruyter
This work is licensed under the Creative Commons Attribution 4.0 International License.
Articles in the same Issue
- Research Articles
- Bearing behavior of pile foundation in karst region: Physical model test and finite element analysis
- Study on precursor information and disaster mechanism of sudden change of seepage in mining rock mass
- Viscosity model based on Giesekus equation
- Two-dimensional rheo-optical measurement system to study dynamics and structure of complex fluids
- Assessment of heat transfer capabilities of some known nanofluids under turbulent flow conditions in a five-turn spiral pipe flow
- Cubic autocatalysis implementation in blood for non-Newtonian tetra hybrid nanofluid model through bounded artery
- Ramification of Hall effects in a non-Newtonian model past an inclined microchannel with slip and convective boundary conditions
- Computational analysis of nanoparticles and waste discharge concentration past a rotating sphere with Lorentz forces
- Viscoplastic fluid flow in pipes: A rheological study using in-situ laser Doppler velocimetry
- Prediction of sensory textures of cosmetics using large amplitude oscillatory shear and extensional rheology
- Effect of bell plate structure on high- and low-frequency characteristics of hydraulic mount
- Computational role of the heat transfer phenomenon in the reactive dynamics of catalytic nanolubricant flow past a horizontal microchannel
- Exploring concentration-dependent transport properties on an unsteady Riga plate by incorporating thermal radiation with activation energy and gyrotactic microorganisms
- Calendering of non-isothermal viscoelastic sheets of finite thickness: A theoretical study
- Electromagnetic control and heat transfer enhancement in exothermic reactions experiencing current density: The study preventing thermal explosions in reactive flow
- Characterization of the translational shear properties of the magnetorheological elastomers embedding the tilt chain-like structure
- Low-cost rolling ball viscometer for the evaluation of Newtonian and shear-thinning fluids
- Impact of calcination temperature, organic additive percentages, and testing temperature on the rheological behaviour of dried sewage sludge
- Rheo-NMR velocimetry of nanocrystalline cellulose suspensions
- Review Articles
- Master curves construction for viscoelastic functions of bituminous materials
- Electrorheological characterization of complex fluids used in electrohydrodynamic processes: Technical issues and challenges
- Corrigendum
- Corrigendum to: “The ductility performance of concrete using glass fiber mesh in beam specimens”
- Special Issue on The rheological test, modeling and numerical simulation of rock material - Part I
- Study on the evolution of permeability properties of limestone under different stress paths
- Shale hydraulic fracture morphology and inter-well interference rule under multi-wellbore test
- Investigation and numerical simulation study on the vertical bearing mechanism of large-diameter overlength piles in water-enriched soft soil areas
- Evolution characteristics of calcareous sand force chain based on particle breakage
- Structural damage characteristics and mechanism of granite residual soil
- Rheological characteristics and seepage laws of sandstone specimens containing an inclined single fracture under three-dimensional stress