Spanish society of laboratory medicine external quality assurance programmes: evolution of the analytical performance of clinical laboratories over 30 years and comparison with other programmes
-
Carmen Perich
 ,
Carmen Ricós
,
Carmen Ricós

Abstract
The purpose of this study is to understand the evolution of the analytical performance of the laboratories participating in the Spanish society of laboratory medicine (SEQCML) external quality assurance (EQA) programmes during its 30 years of operation and to compare it with the performance of other EQA programmes to establish whether the results are similar. The results obtained during this period are evaluated by applying the biological variability (BV) and state of the art-derived quality specifications. In addition, the results are compared with those obtained by other EQA programme organisations. It is noted that the laboratories participating in the EQA–SEQCML programmes have improved their performance over 30 years of experience and that the specifications derived from biological variation are achievable. It is difficult to compare EQA programmes, due to lack of accessibility and the differences in the design of these programmes (control materials, calculations used and analytical specifications established). The data from this study show that for some biological magnitudes the results obtained by the programmes are not yet harmonised, although efforts are being made to achieve this. Organisers of EQA programmes should also join the harmonisation effort by providing information on their results to enable comparison.
Introduction
External quality assurance (EQA) programmes are a key component of laboratory quality management. Their involvement enables the laboratory to evaluate and monitor its analytical performance, compare the reliability of measurement procedures and understand the degree of harmonisation of analytical results.
The Spanish Society of Laboratory Medicine (SEQCML) launched its first EQA programme in 1981, including 20 biochemical serum magnitudes and with 147 participants [1]. Since then, we have incorporated our own programmes and established collaborations with national and European programmes (Spanish Society of Haematology and Haemotherapy for haematological magnitudes, UK NEQAS for immunology and allergy, and OELM for trace elements). The SEQCML currently distributes 29 programmes, for all laboratory areas, covering 189 biological magnitudes and involving around 700 laboratories.
The information to be provided by an EQA programme according to the Task Group on Performance Specifications for EQAS of the European Federation of Clinical Chemistry and Laboratory Medicine (EFLM-TG-EQA) created at the 1st Strategic Conference in Milan in 2014 [2], in order to allow participants to correctly interpret their results [3] involves: the control material distributed, the target value to which the laboratory result is compared, how the analytical performance of the participant is expressed and the evaluation criterion used.
The control material for most SEQCML EQA programmes is stabilised serum except for the commutable serum programme (SCR) with reference method values assignment (SCR) which uses frozen human serum.
The target value of the control samples is the average value obtained by each group of users of the same analytical method and instrument (homogeneous group or peer group), and that of the SCR programme is the certified reference value.
The analytical performance of the laboratory is expressed by the percentage deviation (PD%) of each result from target value, indicative of total analytical error (ET). The analytical performance of the participating methods is expressed by the coefficient of variation (CV) between laboratories, which indicates the imprecision of each homogeneous group, and by the PD% of the average for each homogeneous group, indicating the bias of that method.
The assessment criterion has changed over the years: until 1993 the statistical criterion of the standard score with respect to the homogeneous group was used [4]. From 1994 onwards, the analytical quality specification (AQS) derived from the biological variability (BV) was also applied, where data were available [5] and otherwise, after 2011, the 90th percentile of the results of the individual deviations (PD%) obtained by the participants, after exclusion of extreme values, was applied.
In the case of using BV, three “levels” of demand are used, called minimum, desirable and optimum [6], according to the percentage of individual deviations of the laboratories complying with the specification:
Minimum: less than 80% of PD%s would comply
Desirable: between 80 and 90%
Optimal: 90% or more PD% would be within the limit defined by BV.
Following the categorisation of EQA programmes described by Miller et al. [7] most of the programmes in the SEQCML are category 4 (control material for stabilised human serum, value assigned by homogeneous group, repeated measurements, EPA based on BV); the SCR programme is category 1 (control material for frozen human serum, value assigned by reference method, repeated measurements, EPA based on BV).
The objectives of this study are to understand the evolution of the analytical performance of the laboratories participating in the SEQCML EQA programmes over more than 30 years of operation (1981 – 2018), and to compare the analytical performance obtained by laboratories participating in the SEQCML EQA programmes with that of participants in other EQA programmes.
Materials and methods
The material used in this study is the reports for the individual and end-of-cycle laboratory, which the SEQCML EQA programmes provide to the participants.
Report for the individual laboratory
This has evolved over time and now meets the recommendations of EFLM-TF-EQA [3]. The data included are:
Histogram of distribution of results.
Number of results received.
Number of results included in the statistical calculations (aberrant values, which repeatedly exceed the mean interval ± 3 standard deviations, are excluded until no data fall outside this interval) [8].
Mean and standard deviation of all participants, of the same method as the participant and of the same method and instrument (homogeneous group).
Result obtained by the laboratory and its deviation from the target value, expressed as a standard score and as a percentage.
Acceptable percentage deviation based on the criterion derived from BV for analytical ET, a graph with the results of the previous 12 months and their deviation from the BV (Supplementary Figure 1) having been added in 2005.
Under the SCR programme the report includes:
Percentage deviation from the reference value for the 6 samples,
CV (obtained between control replicates) for the laboratory,
Mean value, CV and percentage deviation mean of the homogeneous group (same method, instrument and traceability) from the reference value (A of Supplementary Figure 2)
In line with its educational purpose, the organisation prepares and sends technical notes relating to the programmes in order to help participants interpret the results. There is also two-way communication for any queries that participating laboratories may have.
End-of-cycle report
This report contains the indicators for the analytical performance of the participating methods:
Inter-laboratory variation coefficient within homogeneous groups.
Homogeneous group bias (difference between group mean and target value).
Since 2011, percentages of the deviation of each result in comparison to the homogeneous group (PD%). Initially the 90th percentile (P90) was shown, but from 2017 onwards P20, P50 and P70 are also included so that each laboratory can select its specification.
The method used is visual inspection of the end-of-cycle reports issued from 1981 to 2018, quantification of the percentage of results in compliance with the EPA and a visual comparison of the indicators with those of programmes in other countries.
Results
Change in the analytical performance of laboratories participating in the SEQCML EQA programmes
The individual report provides the deviation from the peer group. Figure 1 shows the percentage of individual laboratory results (taken from individual reports) in 2018, whose deviation (PD%) from the homogeneous group meets the quality specification for analytical ET derived from the BV (minimum, desirable or optimal), on the serum biochemistry programme.
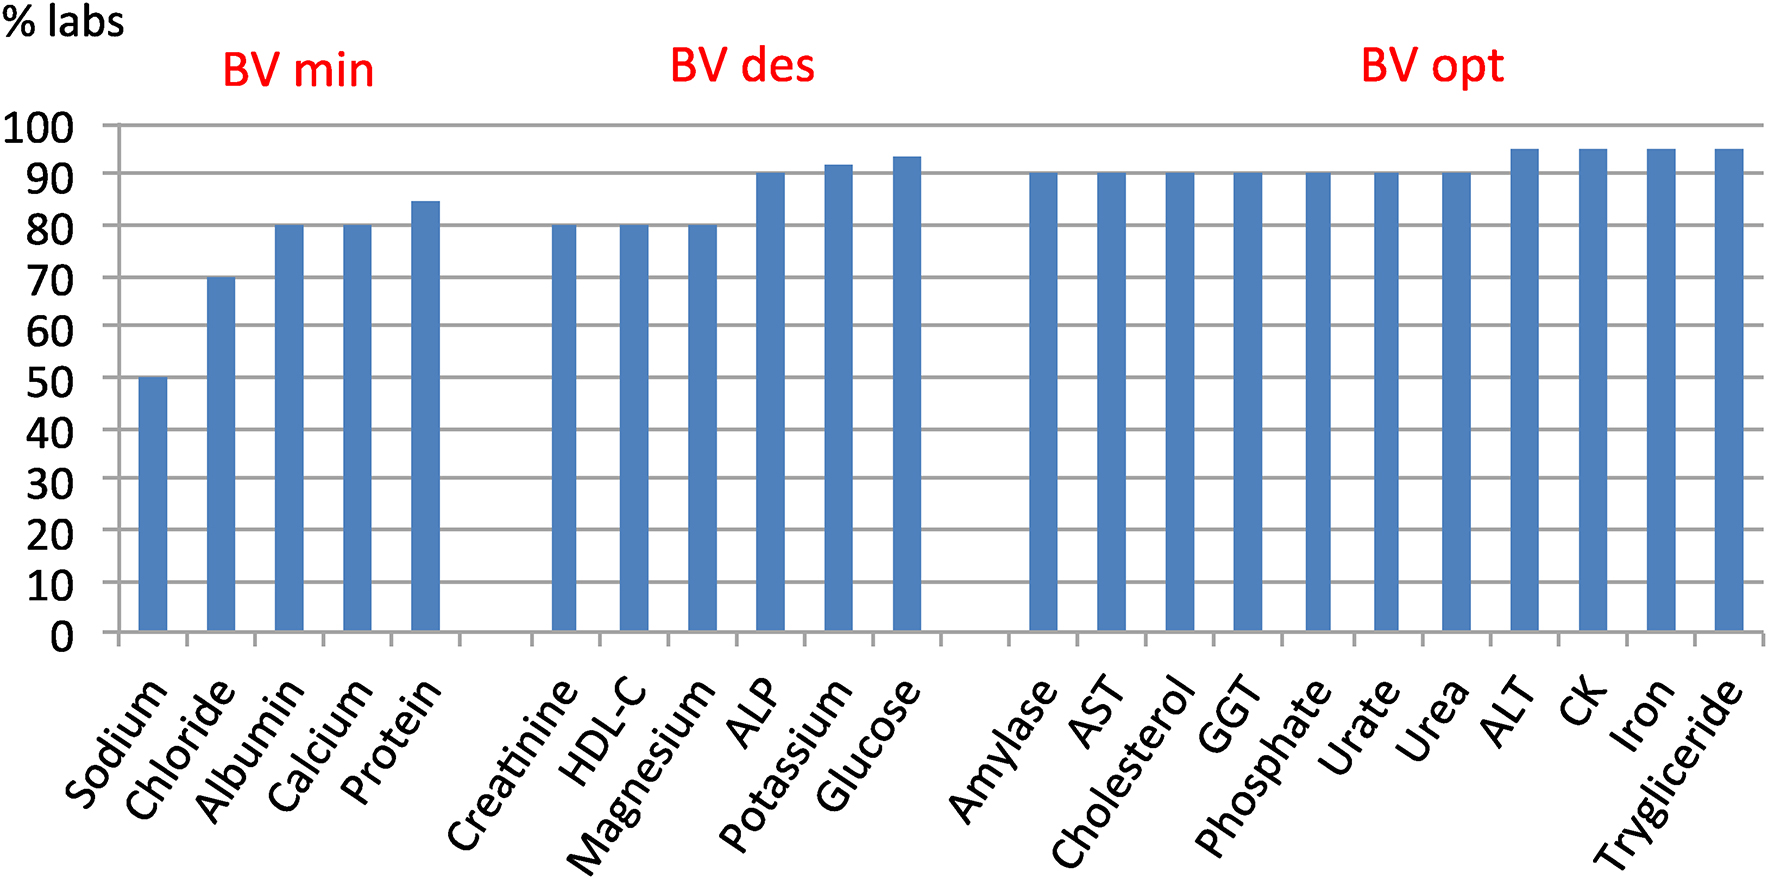
Compliance with the BV-derived total analytical error specification of the 2018 Serum Biochemistry Programme.
For most biological quantities, 90% of the participants' results meet the specification and even for quantities with higher homoeostatic regulation (lower BV and more restrictive specifications), 50% or more of laboratories are already able to meet the requirement.
A comparison of the 90th percentile PD% for the laboratories participating in the hormone programme between 2012 and 2018, a very important decrease can be observed (Supplementary Figure 3). 90% of laboratory insulin results in 2012 had a PD = 39%, which decreased to a PD% = 14% in 2018. Likewise, the P90 of the C-peptide results decreased from 23 to 14% and the thyrotropin results from 13 to 9%.
The end-of-cycle report shows the indicators of inter-laboratory imprecision (measured as CV) and bias towards the homogeneous group (measured as PD%). Figure 2 shows five time slices of magnitudes chosen as representative of substrates (glucose), electrolytes (potassium), Alanine aminotransferase (ALT) and thyroid-stimulating hormone (TSH):
Glucose (Figure 2A): the predominant use of enzymatic methods since the 1990s reduced inter-laboratory imprecision to 6% and bias to 10%. With the use of more specific enzymatic methods, a CV of 4% and a PD% of 7% were obtained in 2018.
Potassium (Figure 2B): in 1984 there were more than 10 possible methods for analysing potassium, with a CV of 5.5% and a bias of 7%; from 1989 to 2000 there were flame photometry and potentiometry together and subsequently only potentiometry. Analytical performance indicators gradually improved to a CV of 2% and a bias of 2% by 2018.
ALT (Figure 2C): as with other enzymes, the disappearance of colourimetric methods led to a reduction in inter-laboratory imprecision, from CVs close to 50% to CVs below 5%. Bias also decreased dramatically.
TSH (Figure 2D): the hormone programme was started in 1999, using different analytical methods with a CV of 12% and a bias of 30%. As of 2010, with the predominant use of luminescent methods, the CV had decreased to 5% and the bias to 15%.
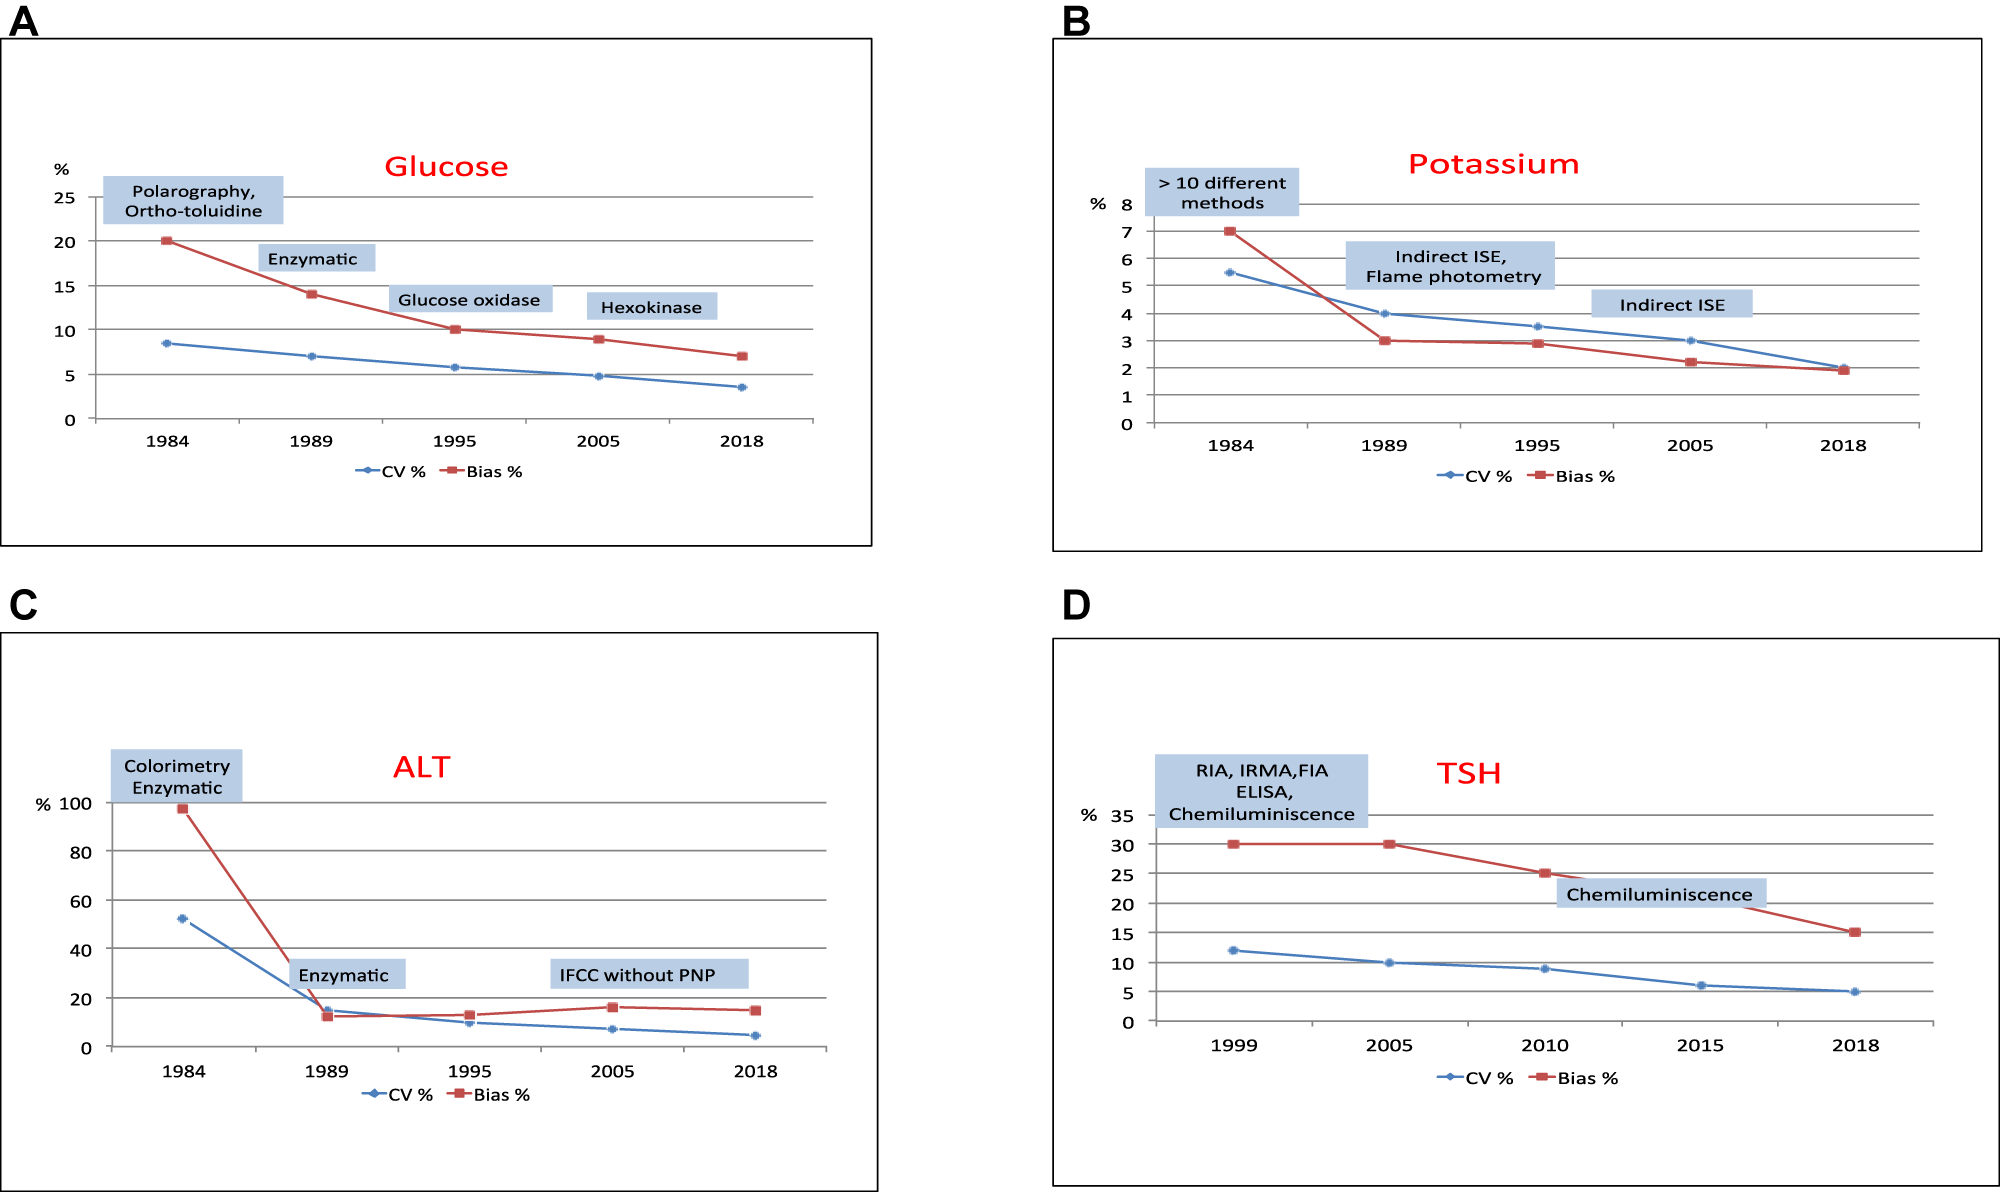
Evolution of inter-laboratory imprecision and bias towards the homogeneous group.
Comparison of SEQCML EQA programmes with other EQA programmes
Table 1 shows the inter-laboratory imprecision obtained in 2018 by the SEQCML (non-commutable control) programme [8], the Dutch Stichting Kwaliteitsbewaking Medische Laboratoriumdiagnostiek (SKML) programme (commutable control) [9], the Belgian Empower project (commutable control) [10] and the German Referenzinstitutfür Bioanalytik (non-commutable control) [11], for some biological parameters in serum biochemistry. In general the CV are similar across the different programmes, except for ALT (CV between 4 and 10%) and LDH (CV between 2.6 and 9.0%).
Inter-laboratory imprecision (CV%) obtained by several European programmes in 2018.
| Magnitude | SEQC (NC) [8] | SKML (C) [9] | Empower project (C) [10] | RfB (NC) [11] |
|---|---|---|---|---|
| Albumin | 4.5 | 4.0 | – | 4.7 |
| ALT | 4.9 | 10.0 | 9.1 | 5.5 |
| AST | 5.0 | 7.5 | 3.3 | 5.7 |
| Calcium | 2.3 | 2.0 | – | 2.7 |
| Creatinine | 5.7 | 5.5 | – | 4.4 |
| Phosphate | 3.3 | 4.0 | – | 3.6 |
| GGT | 5.7 | 8.5 | 6.9 | 4.8 |
| Glucose | 3.4 | 4.0 | – | 3.4 |
| LDH | 5.1 | 9.0 | 2.6 | 4.4 |
| Magnesium | 3.4 | 6.0 | – | 4.0 |
| Potassium | 2.0 | 1.0 | 1.2 | 2.3 |
| Sodium | 1.6 | 0.9 | 0.8 | 1.9 |
| Urate | 2.6 | 3.0 | – | 4.0 |
| Urea | 3.5 | 4.0 | – | 4.8 |
-
C, commutable samples; NC, non-commutable samples.
Table 2 visually compares the PD% to the peer group obtained in the SEQCML and ProBioQual (France) programmes [12]; both use non-commutable material and the peer group as the target value. For this indicator, better results are observed in the SEQCML programme (visually lower PD%).
Total analytical error (PD% compared to peer group) obtained by the 90th percentile of participants in two European programmes.
| Magnitude | SEQCML [8] 2018 | PBQ [12] 2015 |
|---|---|---|
| Alkaline Phosphatase | 10.4 | 15.1 |
| ALT | 7.5 | 11.7 |
| Amylase | 7.2 | 9.1 |
| AST | 7.8 | 10.8 |
| Bilirubin | 8.4 | 12.0 |
| Calcium | 4.3 | 5.7 |
| Cholesterol | 5.5 | 6.6 |
| Creatine kinase | 8.3 | 11.8 |
| Chlorine | 3.9 | 5.6 |
| Creatinine | 9.2 | 11.0 |
| GGT | 9.7 | 14.1 |
| Glucose | 5.0 | 7.3 |
| Potassium | 3.2 | 4.6 |
| LDH | 9.9 | 15.2 |
| Lipase | 11.0 | 13.3 |
| Magnesium | 6.0 | 10.1 |
| Sodium | 2.7 | 3.6 |
| Phosphate | 5.9 | 8.2 |
| Triglyceride | 6.5 | 8.6 |
| Urate | 5.4 | 5.9 |
| Urea | 6.4 | 12.5 |
-
Non-commutable controls. Target value: average of the homogeneous group.
Table 3 presents the 2018 results of the bias (PD%) obtained in three programmes using commutable controls with values assigned by certified reference methods (SEQCML–SCR, SKML and Empower Project) (8,10,13). The values shown correspond to the percentage deviation between the average of the most frequent peer group and the reference value. The data are for enzymes determined by methods recommended by IFCC. A lower bias (visually lower PD%) is observed in the results of the SEQCML and SKML programmes.
Bias (PD%) with respect to the reference method obtained for enzymes determined by the IFCC-recommended methods (2018).
| Magnitude | SEQC [8] | SKML [10] | Empower Project [13] |
|---|---|---|---|
| Alkaline Phosphatase | −6.0 | −10.0 | −15.0 |
| ALT | −16.0 | −14.0 | −25.0 |
| AST | −12.0 | −11.0 | −26.0 |
| Creatine kinase | 3.0 | 4.0 | |
| GGT | −5.5 | −8.0 | −15.0 |
| LDH | −8.0 | −5.0 | −18.0 |
Table 4 shows the observations published in different studies [8], [13], [14], [15], [16] regarding the comparability of results between method-instrument systems, using commutable control materials. The authors consider that there is good harmonisation for urea, cholesterol, glucose, uric acid and potassium and poor standardisation for creatinine, calcium, magnesium, chlorine and sodium; while results for protein and phosphate are discrepant. However, it is important to emphasise that these organisations used different EPAs (state of the art, BV), to consider the degree of harmonisation of these biological magnitudes.
Degree of comparability between method-instrument systems according to several studies.
| Magnitude | SCR SEQC [8] | SKML [13] | Empower [14] | Miller [15] | Van Houcke [16] |
|---|---|---|---|---|---|
| Urea | – | YES | – | YES | – |
| Cholesterol | – | YES | YES | YES | – |
| Glucose | DEP | YES | YES | YES | – |
| Creatinine | NO | NO | DEP | – | – |
| Phosphate | – | – | YES | DEP | – |
| Protein | DEP | DEP | YES | – | YES |
| Urate | YES | YES | YES | YES | – |
| Calcium | DEP | NO | NO | – | DEP |
| Magnesium | DEP | DEP | DEP | DEP | DEP |
| Chlorine | DEP | NO | DEP | NO | – |
| Potassium | YES | YES | YES | YES | – |
| Sodium | NO | NO | YES | NO | – |
-
YES, standardised method-instrument systems; NO, non-standardised method-instrument systems; DEP, some systems are standardised and others are not.
Discussion
The control material for an EQA should be similar to patient samples and the target value should be determined by certified reference methods [3]. Only one of the 29 SEQC programmes currently meets these conditions (SCR), the main difficulties being a lack of commutable control materials and reference methods for all biological quantities in the clinical laboratory.
If the EQA programme uses commutable material with a value assigned by reference methods, it can evaluate the true accuracy of the individual laboratory, assess analytical methods and estimate bias and promote standardisation. Otherwise, it can only assess the individual laboratory and compare homogeneous groups.
Indicators of analytical performance: The analytical ET, calculated imprecision and bias, and type of EPA used in the SEQCML programmes to evaluate participants follow the recommendation of the 1st European Federation of Clinical Chemistry and Laboratory Medicine (EFLM) Strategic Conference (Milan 2014) [17].
The participating laboratories have improved their performance over the years, as is shown by increased compliance with the EPA (Figure 1) and a decrease in deviations from target value. The use of the BV-derived criterion to evaluate the results probably contributed to this improvement.
Despite criticism of the use of BV as a performance specification because it is too strict [17], this study shows that laboratories can achieve them for many biological magnitudes.
The decrease in dispersion of methods, the cessation of obsolete methods (enzymes) and the use of chemiluminescence in immunoassays (Figure 2) are contributing factors in improved performance.
It is difficult to compare SEQCML EQA programmes with other programmes from different organisations because the reports are only accessible to participants. This study therefore only presents data from programmes that publish their results in international journals or on open access websites. Other difficulties lie in the differences in the control materials distributed, the criteria for forming homogeneous groups, the calculations performed and in the quality specifications applied to assess the results.
The lower PD% of the SEQCML compared to ProBioQual (Table 2) are probably due to the fact that the Spanish programme uses BV as a specification, while the French programme uses the more permissive current method performance.
However, the discrepancies observed in the three programmes that use commutable controls with values assigned by certified reference methods (Table 3) cannot be explained in light of the data available in this study.
When the EPAs are based on state of the art, it has been found that most programmes do not define the ‘state of the art’ as the best possible performance of the methods used by the participants, as recommended at the 1st EFLM Strategic Conference in Milan [18], but as the current performance of the methods. This is a further difficulty in achieving harmonisation.
The data shown in this study reveal that, despite the fact that performance is continuously improving within each programme and efforts are being made for harmonisation, the results obtained under different programmes for some biological magnitudes are still not harmonised.
Harmonisation could be achieved through the efforts of all parties involved in the activity of the medical laboratory: international organisations that promote standards and guidelines, scientific societies that disseminate their data, the in vitro diagnostic industry that puts standardised methods and calibrated analytical systems on the market with documented traceability standards, and healthcare laboratories that use the best methods with rigour and protocolisation.
Since 1998 the international community has been making efforts to achieve harmonisation, as reflected in the following documentation:
European Directive for the In Vitro Diagnostic Industry (1998), requiring suppliers to ensure traceability at the highest reference level, wherever possible.
ISO 17511 (2003): In vitro diagnostic medical devices-Measurement of quantities biological samples – Metrological traceability of values assigned to calibration and control materials. This standard was published following the same requirements as the European directive [19]
JCTLM (2002): established by several international bodies that keep a database of reference materials, analytical procedures and reference laboratories as per ISO 17511 [20]
ICHCLR (2013): this consortium has a global portal where updated information on the status of standardisation/harmonisation of biological quantities is collected and protocols are developed to establish harmonisation of those biological quantities for which no reference materials and methods exist [21]
The new ISO/NP 21151 standard (under development), defining protocols to be followed to ensure harmonisation of quantities without reference materials or methods [19]
EQA programmes play an important role in monitoring the harmonisation of medical laboratory performance, but the use of commutable controls with certified reference values should be encouraged wherever possible and the recommended analytical performance specifications applied.
In conclusions, the laboratories participating in the SEQCML EQA programmes have significantly improved their performance over the 30 years. The specifications derived from biological variation are achievable by many laboratories in our country. For biological quantities with no known BV data, the current state of the art is used, rather than the best possible. Organisers of EQA programmes should also join the harmonisation effort by making information on their results available to other interested professionals and by facilitating comparisons between organisations.
-
Research funding: None declared.
-
Author contributions: All authors have accepted responsibility for the entire content of this manuscript and approved its submission.
-
Competing interests: Authors state no conflict of interest.
-
Ethical approval: Not required for this study.
-
Article Note: The original submission can be found here: https://doi.org/10.1515/almed-2019-0024
References
1. Ramon F, Alsina MJ, Areal R, Cortés M, Navarro JM, Salas A. Evaluación del IV Programa de Control de Calidad Interlaboratorios de la SEQC. Quim Clin 1984;3:82–116.Search in Google Scholar
2. Panthegini M, Sandberg S. Defining analytical performance specifications 15 years after Stockholm conference. Clin Chem Lab Med 2015;53:829–32. https://doi.org/10.1515/cclm-2015-0303.10.1515/cclm-2015-0303Search in Google Scholar PubMed
3. Jones GRD, Albarede S, Kesseler D, MacKenzie F, Mammen J, Pedersen M, et al. Analytical performance specifications for external quality assessment- definitions and descriptions. Clin Chem Lab Med 2017;55:949–55. https://doi.org/10.1515/cclm-2017-0151.Search in Google Scholar PubMed
4. Buttner J, Borth R, Boutwell JH, Broughton P, Bowyer RC. Recomendación aprobada (1982) sobre Control de Calidad en Química Clínica. IFCC. Quim Clin 1983;2:87–93.Search in Google Scholar
5. Minchinela J, Ricós C, Perich C, Fernández-Calle P, Álvarez V, Doménech MV, et al. Biological variation database and quality specifications for imprecision, bias and total error (desirable and minimum). The 2014 update; 2012. Available from: https://www.westgard.com/biodatabase-2014-update.htm [Accedido en 16 Sept 2019].Search in Google Scholar
6. Fraser CG, Petersen PH, Libeer JC, Ricós C. Proposals for setting generally applicable quality goals solely based on biology. Ann Clin Biochem 1997;34:8–12. https://doi.org/10.1177/000456329703400103.Search in Google Scholar PubMed
7. Miller GW, Jones GRD, Horowitz GL, Weykamp C. Proficiency testing/External quality assessment: current challenges and future directions. Clin Chem 2011;57:1670–80. https://doi.org/10.1373/clinchem.2011.168641.Search in Google Scholar PubMed
8. Comité de Programas externos SEQCML. Descripción General del Funcionamiento de los Programas de Bioquímica. Publicación anual. Available from: https://www.contcal.org [Accessed 11 Dec 2019].Search in Google Scholar
9. Jansen R, Cobaert CM, Weykamp C, Thelen M. The quest for equivalence of test results: the pilgrimage of the Dutch Calibration 2000 program for metrological traceability. Clin Chem Lab Med 2018;56:1673–84. https://doi.org/10.1515/cclm-2017-0796.Search in Google Scholar PubMed
10. Empower project. Available from: https://www.stt-consulting.com/news.php?rubriek=8 [Accessed 11 Dec 2019].Search in Google Scholar
11. Referenz institut für Bioanalytik (RfB). Available from: https://www.rfb.bio/cgi/surveys?searchType=rv_type&rv_type=KS&analyte=all&year=2018 [Accessed 11 Dec 2019].Search in Google Scholar
12. Matar G, Poggi B, Meley R, Bon C, Chardon L, Chikh K, et al. Uncertainty in measurement for 43 biochemistry, immunoassay, and hemostasis routine analytes evaluated by a method using only external quality assessment data. Clin Chem Lab Med 2015;53:1725–36. https://doi.org/10.1515/cclm-2014-0942.Search in Google Scholar PubMed
13. Weykamp C, Secchiero S, Plebani M, Thelen M, Cobbaert C, Thomas A, et al. Analytical performance of 17 general chemistry analytes across countries and across manufacturers in the inputs project of EQA organizers in Italy, The Netherlands, Portugal, United Kingdom and Spain. Clin Chem Lab Med 2017;55:203–11. https://doi.org/10.1515/cclm-2016-0220.Search in Google Scholar PubMed
14. De Grande LAC, Goosens K, Van Uytfanghe K, Stöckl D, Thienpont LM. The Empower project: a new way of assessing and monitoring test comparability and stability. Clin Chem Lab Med 2015;53:1197–204. https://doi.org/10.1515/cclm-2014-0959.Search in Google Scholar PubMed
15. Miller WG, Myers GL, Ashwood ER, Killeen AA, Wang E, Ehlers GW, et al. State of the art in trueness and interlaboratory harmonization for 10 analytes in general clinical chemistry. Arch Pathol Lab Med 2008;132:838–46.10.5858/2008-132-838-SOTAITSearch in Google Scholar PubMed
16. Van Houcke SK, Rustad P, Stepman HC, Kristensen GB, Stöckl D, Rooras TH, et al. Calcium, magnesium, albumin and total protein measurement in serum as assessed with 20 fresh-frozen single-donation sera. Clin Chem 2012;58:1597–603. https://doi.org/10.1373/clinchem.2012.189670.Search in Google Scholar PubMed
17. Carobene A. Reliability of biological variation data available in an online database: need to improvement. Clin Chem Lab Med 2015;53:871–7. https://doi.org/10.1515/cclm-2014-1133.Search in Google Scholar PubMed
18. Sandberg S, Fraser C, Horwath A, Jansen R, Jones G, Oostehuiss W, et al. Defining analytical performance specifications–consensus of the 1st strategic conference EFLM. Clin Chem Lab Med 2015;53:833–5. https://doi.org/10.1515/cclm-2015-0067.Search in Google Scholar PubMed
19. International Organization for Standarization. Available from: www.iso.org [Accessed 11 Dec 2019].Search in Google Scholar
20. Joint committee for traceability in laboratory medicine. Available from: https://www.bipm.org/en/committees/jc/jctlm [Accessed 06 Nov 2019].Search in Google Scholar
21. The international consortium for harmonization of clinical laboratory results. Available from: www.harmonization.net.Search in Google Scholar
Supplementary Material
Supplementary data to this article can be found online at https://doi.org/10.1515/almed-2020-0019.
© 2020 Carmen Perich et al., published by De Gruyter
This work is licensed under the Creative Commons Attribution 4.0 International License.
Articles in the same Issue
- Editorial
- The role of laboratory medicine specialists in the COVID-19 pandemic
- El profesional de la Medicina de Laboratorio ante la pandemia por COVID-19
- Laboratory medicine resilience during coronavirus disease 2019 (COVID-19) pandemic
- La capacidad de resiliencia de la medicina de laboratorio durante la pandemia de la enfermedad por coronavirus (COVID-19) iniciada en 2019
- Review / Artículo de Revisión
- Biomarkers of male hypogonadism in childhood and adolescence
- Biomarcadores de hipogonadismo masculino en la infancia y la adolescencia
- Original Article / Artículo Original
- Spanish society of laboratory medicine external quality assurance programmes: evolution of the analytical performance of clinical laboratories over 30 years and comparison with other programmes
- Programas de garantía externa de la calidad SEQCML. Evolución de las prestaciones analíticas de los laboratorios clínicos a lo largo de 30 años y comparación con otros programas
- Influence of study model, baseline catalytic concentrations and analytical system on the stability of serum alanine aminotransferase
- Estabilidad de la alanina aminotransferasa en suero. Efecto del modelo de estudio, la concentración catalítica inicial y la plataforma analítica
- Assessment of a change of protocol of prenatal screening by inclusion of non-invasive prenatal diagnosis
- Valoración de un cambio de protocolo del cribado prenatal mediante la inclusión del diagnóstico prenatal no invasivo
- Case Report / Caso Clínico
- Cystinuria: urine sediment as a diagnostic test
- Cistinuria: sedimento de orina como herramienta diagnóstica
- Letter to the Editor / Carta al Editor
- Unnecessary test ordering in clinical trials: human chorionic gonadotropin as an example
- Realización de pruebas innecesarias en los ensayos clínicos: hCG como ejemplo