
Carbon Emissions and Carbon Intensity in China’s Exports: A Contrast of SRIO and GIRIO Methods
-
Hao Xiao
 ,
Jianguo Wang
,
Jianguo Wang

Abstract
This paper compares differences between single regional input-output (SRIO) model and global interregional IO model (GIRIO) used in the area of carbon emission embodied in exports under global supply chain, and decomposes carbon emissions and carbon intensity in exports according to export path based on KWW (2014). Empirical analysis in China’s exports in 1995, 2000, 2005 and 2009 shows: 1) GIRIO model yielded about 2.11% less domestic emissions absorbed abroad, 0.8% more domestic emissions in exports, 1.5 times more foreign emissions in exports in 2009, compared to SRIO model. 2) USA and EU absorb most carbon emissions in China’s exports, but with declining share. Increasing domestic emissions firstly exported to developing countries but finally returned home and emissions from developing countries in China’s exports show their contribution from developing countries. Discrepancies between bilateral carbon emissions flows changes and direct trade flows changes suggest indirect carbon emissions transfer by third parties are neglected in SRIO model. 3) Despite dramatic decrease, China still bears 1.52 times more carbon emissions per GDP gained than foreign countries in fragmentation of China’s exports production in 2009, indicating different roles in production fragmentation.
1 Introduction
After more than thirty years of opening-up, China has become the world’s largest exporter and the second largest importer. Meanwhile, China also has become the world’s largest greenhouse gases emitter. However, one important feature of global trade is that a country’s carbon footprints are international. With the imbalance of carbon emission efficient and trade across countries, some policies like carbon tariff and global carbon market has become a hot topic in the area of trade and environment[1]. Accurate estimation of carbon emissions embodied in trade is primary for allocating carbon emissions reduction responsibility, especially consumer-based and producer-based responsibility. For example, carbon leakage from Kyoto Protocol is 10.8% of total domestic emissions, and 44.3% of total emissions in imports from non-Annex B countries[2].
The most common methodology to study carbon emissions embodied in trade is input-output analysis, for capturing both direct and indirect emissions with exports production. Those literatures are mainly divided into two types: single regional IO models (SRIO) and multiregional IO model (MRIO). Non-competitive SRIO model clarifies imperfect substitutability between imported intermediate goods and domestic intermediate goods, which is more popular to study carbon emission in China’s gross trade[3–5], emission in China’s bilateral trade[6, 7]. However, SRIO model does not distinguish sources of imported intermediate inputs and technology differences among imported product[8, 9]. The production function assumes that all imported intermediate inputs must contain 100% foreign value added (carbon emissions), i.e. no indirect domestic content in imports[10]. Under global fragmentation, imports contain imported inputs from all countries, including itself, when exports partly return home after re-processing. In addition, SRIO model fails to capture indirect carbon emissions flows via third countries and feedback effects that occur when intermediate trade prevails[11, 12].
MRIO model addresses those shortcomings in SRIO model[13]. When comparing MRIO and SRIO allocation[9], found differences of 5%~6% for US carbon emissions in exports and 11%~13% for its carbon emissions in imports between 1994 and 2004. The difference could be excess of 20% for some countries, depending on trade structures[14]. Also it indicated increased emissions exports from China and emerging countries to developed countries[15]. By improvement in detailed information on interregional, inter-sector supply and demand information, GIRIO model is more effective to estimate international production sharing[10, 16, 17], emissions embodied in trade[18–20].
A key technical framework KWW by [10] based on GIRIO model, completely decomposed gross exports to value-added components by origins and final destinations: domestic value-added exports, returned domestic value-added in exports, foreign value-added in exports. It traces actual value-added flows under gross trade. Results indicate domestic value-added accounted for less than 50% of China’s processing exports, and trade surplus with the US and Western EU measured in value-added terms was 41%, 49% less than that measured in gross terms in 2004. Similarly, under global production fragmentation, estimation of carbon emissions in gross exports diverges from actual carbon emissions flows. Considering the fact that domestic emissions may firstly “exported” but finally “return” home via re-imports, how much carbon emissions actually absorbed by foreign countries? Also, carbon emissions in direct exports may further transferred to third countries, what is actual bilateral carbon leakage? Accurate analysis of these special features requires estimating carbon emissions in exports under GIRIO model.
Furthermore, how much environmental cost each country’ bears per GDP created under exports production fragmentation? Considering different emissions flows, value-added flows required directly and indirectly by different final demands, it is worth to estimate embodied carbon intensity by “demand” side, i.e., embodied carbon intensity induced by consumption, exports, investment of each economy[21], although most studies merely estimate carbon intensity directly from “producer” side. As both matters, we estimate embodied carbon intensity by origin by destination in different exports fragmentation processes.
Following the framework by [10], this paper decomposes carbon emissions and carbon intensity in export by origins and destinations in GIRIO model, compares the differences with SRIO approach, and empirically estimates emissions in China’s exports in 1995, 2000, 2005 and 2009. Main contributions include: 1) Extending KWW framework to decompose carbon emissions in exports according to its export path at national, bilateral level, and systematically compares differences between SRIO model and GIRIO model in analyzing carbon emissions in exports; 2) Bilateral analysis specifies each trade partner’s absorption of China’s domestic emissions, contribution to returned domestic emissions and their emissions induced by China’s exports. Cross country comparison shows their different roles in carbon emissions distribution; 3) By joining value-added accounts and carbon emissions accounts, promote embodied domestic and foreign carbon intensity in exports, to measure environmental cost per GDP gained in exports production fragmentation.
2 Methodology
2.1 Carbon Emissions and Carbon Intensity in Exports in SRIO Model
In standard SRIO model, suppose S as object country, with n industries. Assume AD as direct input coefficients matrix of domestic products, AM as direct input coefficients matrix of imported products, vS as value-added coefficient vector. Exports ExS includes domestic value-added in exports
Similarly, carbon emissions in exports include domestic carbon emissions in exports
Environmental cost per GDP created in export production is calculated by combining corresponding value-added terms and carbon emissions terms: embodied domestic carbon intensity in exports
2.2 Carbon emissions and carbon intensities in exports in GIRIO model
Assume there are G countries, each with n industries. Suppose S as object country (exporter), and R, T as any other countries. GIRIO model covers worldwide interregional, inter-sector supply-demand linkages, that is, imported production distinguished by country source. Suppose YSR as country R’s final demand of country S's products, A as direct input coefficient, B as Leontief coefficient matrix. v is direct value-added coefficient vector, c is direct carbon emissions coefficient vector.
Under global intermediate trade, direct importer is not always the final destination of exported goods, and direct exports are not always the origin of exported products. By transforming endogenous intermediate trade in GIRIO model to terms induced by exogenous final demand, a key technical step by (7) decomposed gross exports flows to value-added flows by origins by final destinations[10]: (a) Domestic value-added exports
Similarly, carbon emissions in S′ exports can also be decomposed by original producers by final destinations along global supply chains. Carbon emissions in S′ exports CEES*:
Domestic carbon emission exports
(9)(9) include S′ domestic emissions in final exports to R absorbed by R (1st term), in intermediate exports to R absorbed by R (2nd term), and in intermediate exports to T for production of final products absorbed by R (3rd term), involving indirect carbon emissions exports via third parties.
Specifically S′ domestic emissions exports to country R:
(10)Domestic emissions in intermediate exports but finally returns home
(11)Specifically R′s contribution in returned emissions in S′ exports:
(12)(11) and (12) include S′ domestic emissions in intermediate exports to R but returns home via final imports (1st term), via intermediate imports (2nd term), and domestic emissions in intermediate exports to R, then return home via intermediate imports but then exported, also double counted term but belongs to domestic emissions in exports (3rd term).
Domestic emissions in exports
(13)Foreign carbon emissions in S′ exports
(14)Specifically T′s carbon emissions in S′ exports
(15)
(14) and (15) include T′ emissions in intermediate exports to S for producing S′ final exports absorbed abroad (1st term), for producing S′ intermediate exports absorbed abroad (2nd term), for producing S′ intermediate exports then used by R to producing R′ exports, also double-counted but belongs to foreign emissions in exports (3rd term).
Above decomposition shows value-added distribution and carbon emissions transfer among countries in exports production. Combing value-added and emissions accounting by origin by destination, calculate each country’s potential environment cost per value-added gained, i.e. embodied carbon intensity of each component, which indicates different participation in exports production fragmentation.
Then, embodied domestic carbon intensity in exports absorbed abroad
Overall domestic carbon intensity in exports
Figure 1 show the overall extending KWW framework of value-added, carbon emissions, and carbon intensities accounting of gross export.
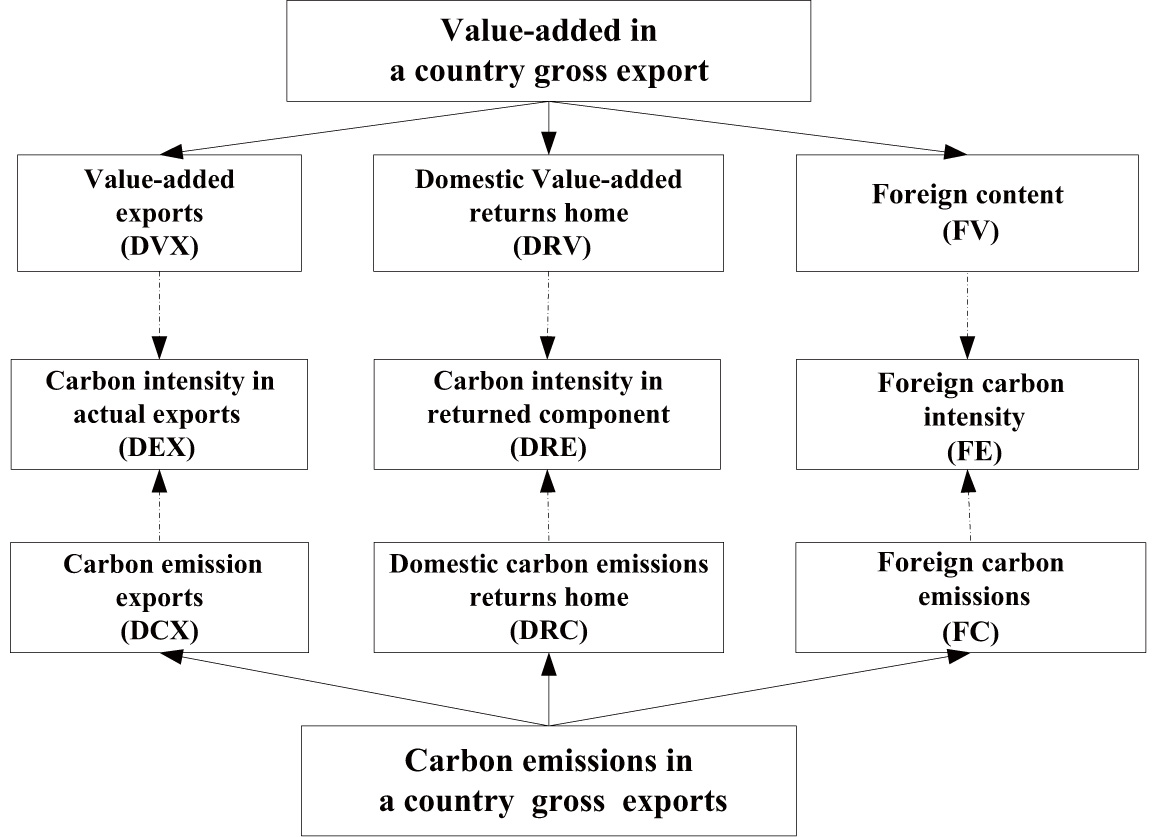
Value-added, carbon emissions, and carbon intensities accounting of gross exports
2.3 Contrast of SRIO and GIRIO Model in Exports Analysis
SRIO model mainly specifies domestic production while GIRIO model captures global interregional inter-sector linkages. Different scopes in Leontief matrix, intermediate and final trade flows thus affect estimation of carbon emissions and carbon intensities embodied in exports.
Specially, based on the assumption that all imported intermediates contain 100% foreign content, i.e., no domestic emissions that initially exported but returned home via intermediate imports
Furthermore, when more than one country export intermediate products, direct importer is not always the final destination, and direct exporter is not always the origin of value-added and carbon emissions in exports. SRIO model merely considers direct trade. By contrast, GIRIO model estimates bilateral carbon emissions flows
As for environment losses per GDP gained in exports production fragmentation, SRIO model estimates
Accurate calculation of carbon emissions and embodied carbon intensity in exports is important for understand carbon emissions responsibilities among producers and consumers in different countries, especially for large export-oriented economy. We further empirically compare the two approaches by decomposing carbon emissions and carbon intensity in China’s exports.
3 Empirical Results
3.1 Data
We use the data from national input-output table (SRIO), world input-output table (GIRIO) and Environmental Accounts of WIOD database. Although household emission data are available, we focus on CO2 emission from production. To facilitate analysis, we merger 41 economies into 8 regions: Mainland China, the EU, USA, Canada (CAN), Australia (AUS), other emerging countries (Brazil, Russia, India, Indonesia, Mexico, Turkey; EMR), other East Asia countries or regions (Japan, Korea, Taiwan; OEA), and the rest of the world (ROW). Also, merge original sector 19, 20, 21 into retail and wholesale, merge original sector 34, 35 into Social and Private Service. New SRIO table contains 1 economy, 32 sectors; new GIRIO table contains 8 economies, each with 32 sectors. Then we use SRIO model and GIRIO model to analyze carbon emissions and carbon intensity in China’s exports in 1995, 2000, 2005 and 2009.
3.2 Carbon Emissions in China’s Exports at National Level
Shown by Table 1 and Table 2, there are differences by SRIO model and GIRIO model in estimation of carbon emissions in China’s exports. And the discrepancies generally increased from 1995 to 2009. Specifically, by considering emissions firstly exported but finally returned home, and different technology in domestic and imported inputs, compared with SRIO model, GIRIO model yields more domestic missions in exports
Carbon emissions distribution in China’s exports by SRIO model
| Year | Total | ||||
|---|---|---|---|---|---|
| MT CO2 | Share% | MT CO2 | Share% | MT CO2 | |
| 1995 | 596.46 | 95.55 | 27.79 | 4.45 | 624.25 |
| 2000 | 601.29 | 95.76 | 26.6 | 4.24 | 627.89 |
| 2005 | 1429.3 | 95.38 | 69.19 | 4.62 | 1498.49 |
| 2009 | 1512.5 | 96.4 | 56.49 | 3.6 | 1568.99 |
Carbon emissions distribution in China’s exports by GIRIO model
| Year | Total | ||||||||
|---|---|---|---|---|---|---|---|---|---|
| MT CO2 | Share% | MT CO2 | Share% | MT CO2 | Share% | MT CO2 | Share% | MT CO2 | |
| 1995 | 593.77 | 96.31 | 3.45 | 0.56 | 597.22 | 96.87 | 20.45 | 3.31 | 617.68 |
| 2000 | 595.96 | 92.42 | 6.9 | 1.07 | 602.86 | 93.49 | 41.99 | 6.51 | 644.85 |
| 2005 | 1405.5 | 88.36 | 38.05 | 2.39 | 1443.55 | 90.75 | 147.03 | 9.24 | 1590.58 |
| 2009 | 1480.6 | 88.84 | 44.29 | 2.66 | 1524.89 | 91.50 | 141.69 | 8.50 | 1666.58 |
Of carbon emissions in China’s exports by GIRIO model (Table 2), the majority is absorbed abroad
3.3 China’s Carbon Emissions Exports at Bilateral Level
Table 3 illustrates China’s domestic emissions absorbed by each country directly and indirectly
Decomposition of China’s carbon emissions exports by trade partners
| Regions | 1995 | 2000 | 2005 | 2009 | ||||
|---|---|---|---|---|---|---|---|---|
| MT CO2 | Share% | MT CO2 | Share% | MT CO2 | Share% | MT CO2 | Share% | |
| USA | 157.34 | 25.47 | 182.82 | 28.35 | 396.18 | 24.91 | 343.99 | 20.64 |
| EU | 138.16 | 22.37 | 132.98 | 30.62 | 302.33 | 19.01 | 327.02 | 19.62 |
| CAN | 17.95 | 2.91 | 18.00 | 2.79 | 45.54 | 2.86 | 50.14 | 3.01 |
| AUS | 14.45 | 2.34 | 12.86 | 1.99 | 35.97 | 2.26 | 48.96 | 2.94 |
| EMR | 28.38 | 4.59 | 32.83 | 5.09 | 110.63 | 6.96 | 176.99 | 10.62 |
| OEA | 134.62 | 21.79 | 123.83 | 19.20 | 237.41 | 14.93 | 201.13 | 12.07 |
| ROW | 103.95 | 16.83 | 94.43 | 14.64 | 281.48 | 17.70 | 335.83 | 20.15 |
| Total | 594.85 | 96.3 | 597.75 | 92.68 | 1409.54 | 88.63 | 1484.06 | 89.05 |
In 1995, about 157.34MT (25.47%) domestic emissions are “consumed” by USA, and 138.16 MT (22.37%) by the EU. The amounts increased rapidly to 343.99MT (20.64%), 327.02MT (20.64%) respectively in 2009. It constitutes major parts of China’s carbon emissions exports. Emissions exports to other East Asia (OEA) also increased in absolute amount but reduced in relative share, from 134.62MT (21.79%) in 1995 to 201.13MT (12.07%) in 2009. On the contrary, carbon emissions absorbed by other emerging countries (EMR) and rest of the world (ROW) increased steadily from 28.38MT (4.59%), 103.95 (16.83%) in 1995 to 176.99MT (10.62%), 335.83MT (20.15%) in 2009. It can be seen final destinations of China’s carbon emissions in exports are slowly shifting from developed countries to other emerging countries. If China is to tackle the problem of carbon leakage, other emerging countries’ demand cannot be neglected.
Figure 2 shows shares of China’s carbon emissions exports to each country by GIRIO model, and corresponding direct bilateral exports shares. Contradiction of exports share change and carbon emissions exports share change indicates indirect emissions flows are concealed in direct trade relationships. Impressively, despite China’s direct exports to EU reduced dramatically from 26.66% to 21.80% from 2000 to 2009, share of carbon emissions exports to EU remained stable. Also, although exports share to USA remained the same from 2000 to 2009, share of carbon emissions exports to USA decreased dramatically. Possibly because besides carbon emissions leakage by direct exports, USA and the EU also absorb China’s emission by importing from other countries; and carbon emissions in direct exports to USA and the EU may finally absorbed by other countries, all of which are indirect carbon emissions exports by third countries. It highlights our work in tracing emissions back to origins and final destinations in GIRIO model.
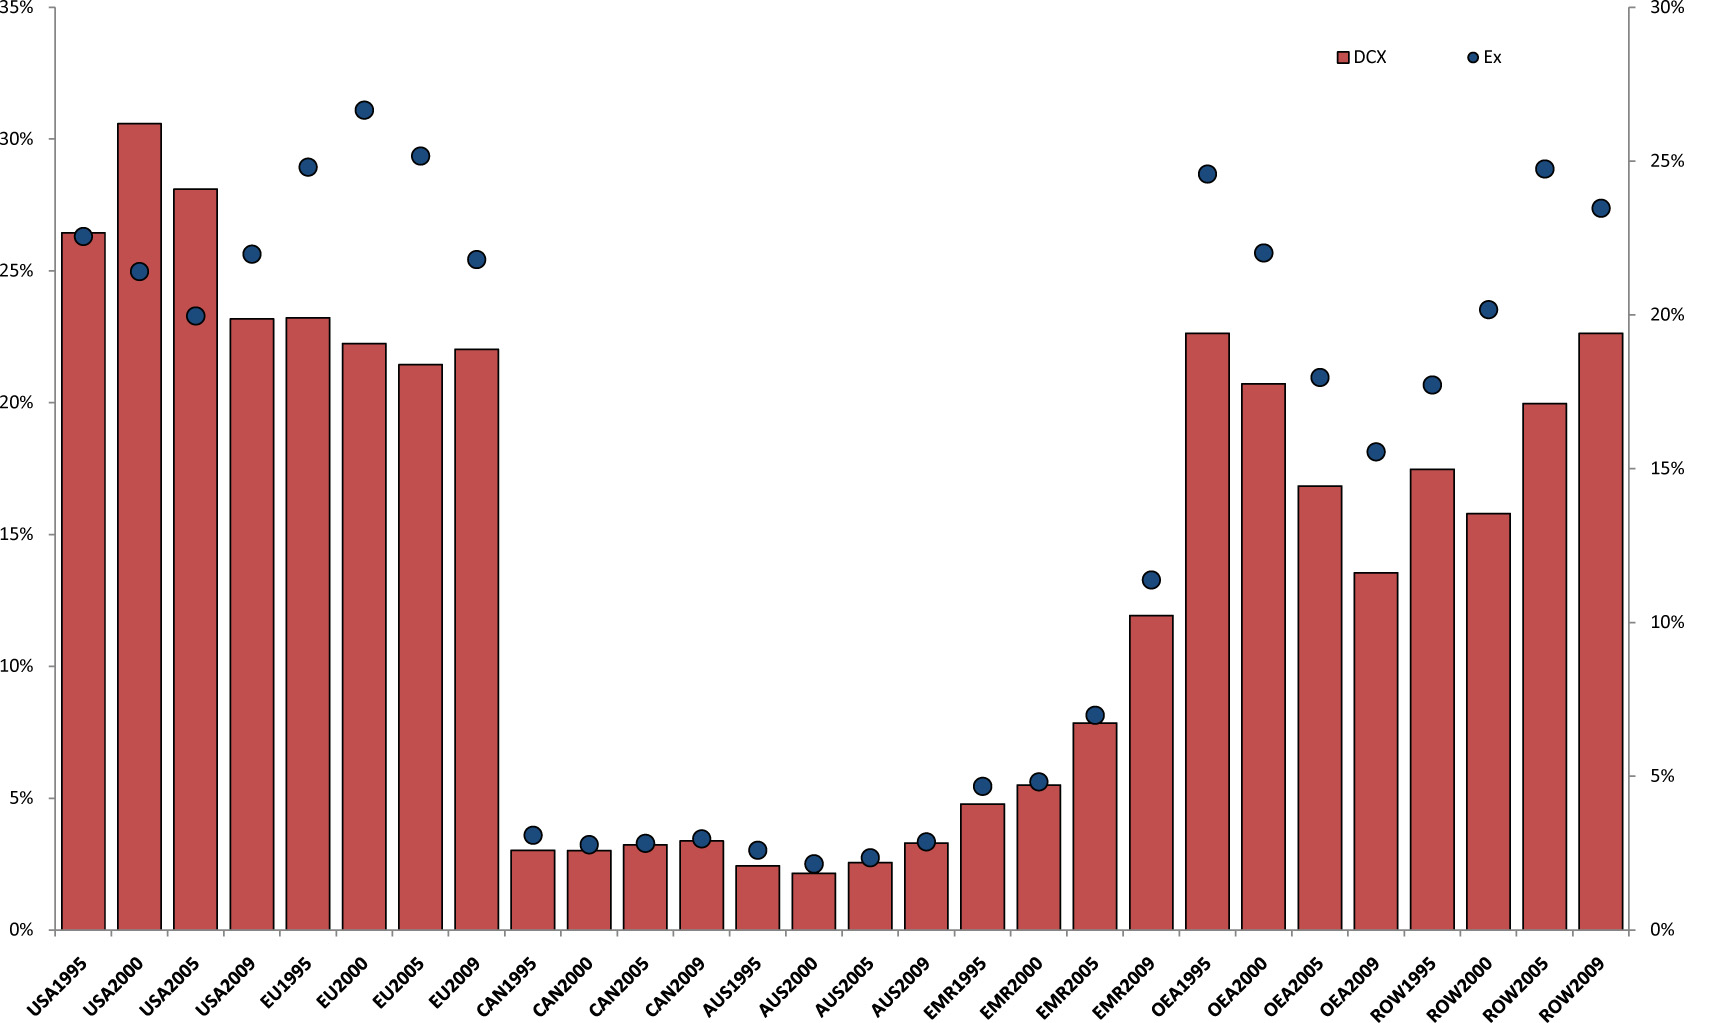
Share of China’s domestic carbon emission exports to each country and exports to each country
3.4 China’s Returned Carbon Emissions at Bilateral Level
Table 4 shows domestic carbon missions firstly exported to each region but finally returned home via imports
Decomposition of China’s returned carbon emissions by trade partners
| Regions | 1995 | 2000 | 2005 | 2009 | ||||
|---|---|---|---|---|---|---|---|---|
| MT CO2 | Share% | MT CO2 | Share% | MT CO2 | Share% | MT CO2 | Share% | |
| USA | 0.42 | 0.07 | 0.34 | 0.05 | 1.90 | 0.12 | 5.24 | 0.31 |
| EU | 0.21 | 0.03 | 0.78 | 0.12 | 3.27 | 0.21 | 2.69 | 0.16 |
| CAN | 0.05 | 0.01 | 0.08 | 0.01 | 0.26 | 0.02 | 0.42 | 0.03 |
| AUS | 0.09 | 0.01 | 0.14 | 0.02 | 0.54 | 0.03 | 1.17 | 0.07 |
| EMR | 0.07 | 0.01 | 0.18 | 0.03 | 0.90 | 0.06 | 1.49 | 0.09 |
| OEA | 1.85 | 0.30 | 3.51 | 0.55 | 16.22 | 1.02 | 18.99 | 1.14 |
| ROW | 0.77 | 0.12 | 1.88 | 0.29 | 14.95 | 0.94 | 14.29 | 0.86 |
| Total | 3.45 | 0.56 | 6.90 | 1.07 | 38.05 | 2.39 | 44.29 | 2.66 |
3.5 Foreign Carbon Emissions in China’s Exports at Bilateral Level
Table 5 shows foreign emissions in imported inputs in the production of China’s exports, resembling China’s carbon emission outsourcing. China mainly transfers environmental pressure in exports production to developing countries, with increasing trend during the period. Specifically, embodied emissions in China’s exports from developing countries (EMR, OEA, ROW) amounted to 14.42MT in 1995, then rose sharply to 117.45MT in 2005, but slightly fell down to 111.2MT (about 6.68%) in 2009. Emissions from developed countries (USA, the EU, AUS and CAN) also increased to 30.49MT in 2009, but with low share (merely 1.83%). Foreign emissions in China’s exports reflect extension of global supply chains in China’s production process, together with China’s ability to transfer carbon emissions.
Decomposition of foreign carbon emissions in China’s exports by trade partners
| Regions | 1995 | 2000 | 2005 | 2009 | ||||
|---|---|---|---|---|---|---|---|---|
| MT CO2 | Share% | MT CO2 | Share% | MT CO2 | Share% | MT CO2 | Share% | |
| USA | 2.32 | 0.38 | 3.12 | 0.48 | 9.33 | 0.59 | 10.66 | 0.64 |
| EU | 2.31 | 0.37 | 4.29 | 0.67 | 13.01 | 0.82 | 11.44 | 0.69 |
| CAN | 0.62 | 0.10 | 0.90 | 0.14 | 2.41 | 0.15 | 2.69 | 0.16 |
| AUS | 0.79 | 0.13 | 1.79 | 0.28 | 4.83 | 0.30 | 5.70 | 0.34 |
| EMR | 3.26 | 0.53 | 6.03 | 0.93 | 22.13 | 1.39 | 23.77 | 1.43 |
| OEA | 4.88 | 0.79 | 10.92 | 1.69 | 34.86 | 2.19 | 33.34 | 2.00 |
| ROW | 6.28 | 1.02 | 14.93 | 2.32 | 60.46 | 3.80 | 54.09 | 3.25 |
| Total | 20.46 | 3.32 | 41.98 | 6.51 | 147.03 | 9.24 | 141.69 | 8.51 |
Figure 3 compares share of foreign emissions in China’s exports based on GIRIO model, and share of imported intermediates goods. Different trends between the two estimations suggest origins of embodied foreign emissions in direct and indirect trade be traced under GIRIO model. Of foreign emissions in China’s exports, carbon emissions from USA and the EU decreased from 11.34%, 11.29% in 1995 to 7.52%, 8.07% in 2009 respectively. However, share of intermediate imports from USA remained relatively stable, and intermediate imports from EU even rose from 6.8% in 2000 to 9.57% in 2009. Also, carbon emissions from OEA in China’s exports maintained at 24%, while imported inputs from EA declined from 43.06% in 1995 to 28.76% in 2009.
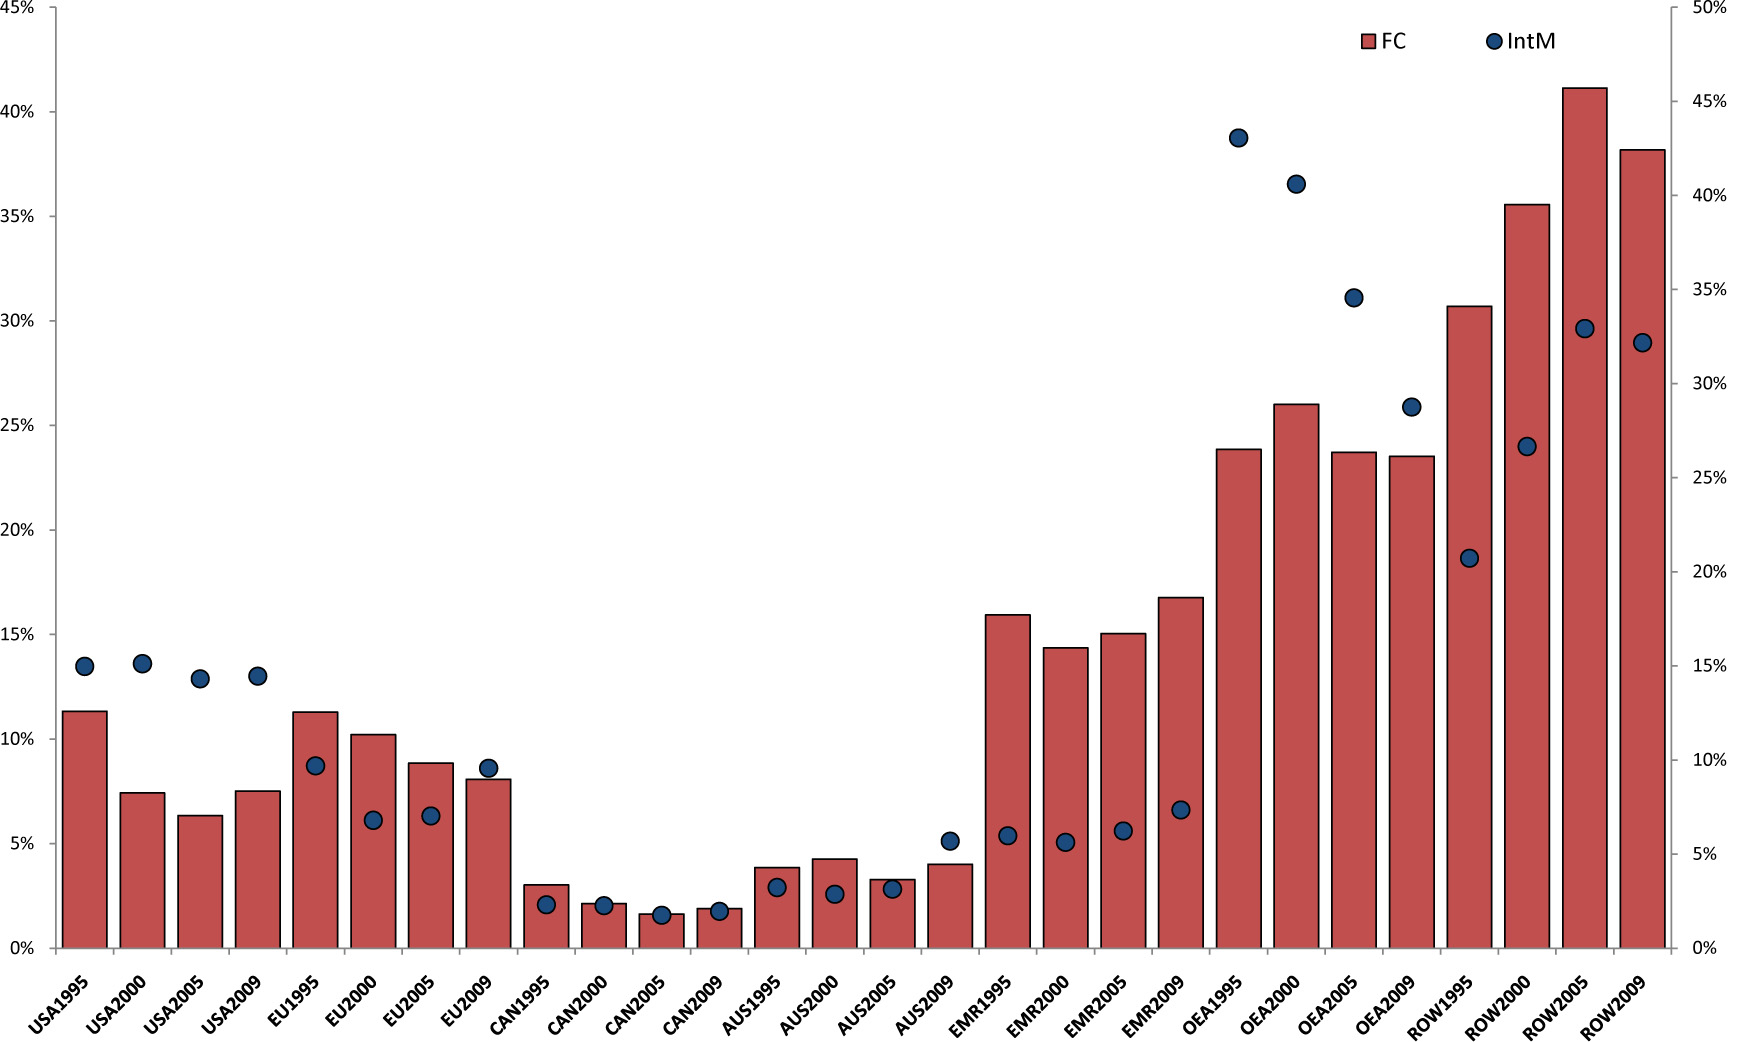
Share of China’s carbon exports contain foreign parts from each country and intermediate import from each country
Take EU for example, its exports may contain much foreign emissions, especially emissions from developing countries. It is actually other developing countries’ carbon emissions exports to China via the EU. Therefore, despite growing direct exports, embodied carbon emissions from the EU in China’s exports may even decline. Similarly, despite descending imports from EU, imported emissions in China’s exports could probably increase by growing indirect carbon emissions exports. Under global production fragmentation, bilateral carbon emissions flows should be analyzed by tracing its origins in GIRIO model.
3.6 Embodied Carbon Intensities in China’s Exports
Combing value-added gains and carbon emissions accounts in each component in exports, Table 6 compares environmental cost per value-added in exports production fragmentation in GIRIO and SRIO framework. Generally, domestic carbon intensity in exports in GIRIO model
Embodied carbon intensity in exports from value-added perspective (MT CO2 /billion dollars)
| Year | GIRIO Approach | SRIO Approach | |||
|---|---|---|---|---|---|
| 1995 | 4.28 | 4.58 | 4.28 | 0.79 | 4.23 |
| 2000 | 2.61 | 2.88 | 2.61 | 0.87 | 2.61 |
| 2005 | 2.32 | 2.58 | 2.33 | 0.68 | 2.32 |
| 2009 | 1.44 | 1.59 | 1.44 | 0.57 | 1.42 |
Despite dramatic decrease,
Specifically, in 1995,
4 Conclusions and Suggestions
This paper compares differences between SRIO model and GIRIO model in analyzing carbon emissions and embodied carbon intensity in exports under global fragmentation. Based on GIRIO model, decomposes carbon emissions and carbon intensities in exports by origin by destination along global supply chains.
Systematic comparison shows, by considering domestic emissions firstly exported but return home, and technology differences among imported inputs, GIRIO yields about 2.11% less domestic emissions absorbed abroad, 0.8% more domestic emissions in exports, 1.5 times more foreign emissions in exports than SRIO model in 2009. The discrepancies enlarged over the period. Different share changes between bilateral carbon emissions flows and bilateral trade flows indicate indirect carbon emissions transfer via third countries concealed in SRIO model, which requires tracing emissions by origin and destination in GIRIO model.
As for carbon emissions flows, domestic emissions exports are mainly absorbed by USA, the EU though with declining trend. Share of domestic emissions exports to other emerging countries (EMR) increased during the period. Domestic emissions firstly exported to developing countries but finally returns home, and embodied emissions from developing countries in China’s exports experienced rapid growth in absolute amount and relative share. Exports production fragmentation with developing countries contributes to China’s carbon emissions outsourcing. In China’s exports production fragmentation, China bears 1.52 times more carbon emissions emitted per GDP gained than foreign countries, despite dramatic decrease in absolute amount. China mainly specialize in “carbon intensive” process while imports relatively “value-added intensive” process.
We attempt to raise some useful suggestions with respect to carbon emissions in China’s exports as follows.
Increase awareness of carbon emissions leakage. By indirect trade, developed countries absorb more carbon emissions, while China outsourcing more emissions to other East Asia countries. Developed countries should bear more responsibility for China’s carbon emissions.
Optimize carbon emissions distribution by extending supply chains in exports production to developing countries. Carbon emissions in exports to these countries tend to return back or finally transfer to other countries. Cooperation with these countries will lessen China’s carbon emissions burden, by outsourcing carbon emission-intensive process, though at the cost of low-skilled employment and value-added. Encouraging trade policy may be beneficial for China’s carbon emissions distribution, and stimulate China’s value chains upgrade.
Reduce carbon intensity to control emissions. China has participated in “low-value”, “high-pollution” process. Embodied domestic carbon intensity drop during 2005–2009 indicated China’s potential and intention in carbon emissions reduction and economic transformation. To move upwards in global supply chains, more effort is needed for reducing production fragment emissions while improving value-added gained in exports production fragmentation.
References
[1] Qiao H, Song N, Gao H W. Analysis on the strategies of European Union’s airline carbon tax with Stackelberg game models. Systems Engineering — Theory & Practice, 2014, 34(1): 158–167.Suche in Google Scholar
[2] Peters G P, Hertwich E G. CO2 embodied in international trade with implications for global climate policy. Environmental Science & Technology, 2008, 42(5): 1401–1407.10.1021/es072023kSuche in Google Scholar PubMed
[3] Weber C L, Peters G P, Guan D, et al. The contribution of Chinese exports to climate change. Energy Policy, 2008, 36(9): 3572–3577.10.1016/j.enpol.2008.06.009Suche in Google Scholar
[4] Lin B, Sun C. Evaluating carbon dioxide emissions in international trade of China. Energy Policy, 2010, 38(1): 613–621.10.1016/j.enpol.2009.10.014Suche in Google Scholar
[5] Minx J C, Baiocchi G, Peters G P, et al. A “carbonizing dragon”: China’s fast growing CO2 emissions revisited. Environmental Science & Technology, 2011, 45(21): 9144–9153.10.1021/es201497mSuche in Google Scholar PubMed
[6] Dong Y, Ishikawa M, Liu X, et al. An analysis of the driving forces of CO2 emissions embodied in Japan-China trade. Energy Policy, 2010, 38(11): 6784–6792.10.1016/j.enpol.2010.06.050Suche in Google Scholar
[7] Du H, Guo J, Mao G, et al. CO2 emissions embodied in China-US trade: Input-output analysis based on the emergy/dollar ratio. Energy Policy, 2011, 39(10): 5980–5987.10.1016/j.enpol.2011.06.060Suche in Google Scholar
[8] Los B, Timmer M P, de Vries G J. How important are exports for job growth in China? A demand side analysis. Journal of Comparative Economics, 2015, 43(1): 19–32.10.1016/j.jce.2014.11.007Suche in Google Scholar
[9] Weber C L, Matthews H S. Embodied environmental emissions in US international trade, 1997–2004. Environmental Science & Technology, 2007, 41(14): 4875–4881.10.1021/es0629110Suche in Google Scholar PubMed
[10] Koopman R, Wang Z, Wei S J. Tracing value-added and double counting in gross exports. American Economic Review, 2014, 104(2): 459–494.10.3386/w18579Suche in Google Scholar
[11] Su B, Ang B W. Multi-region input-output analysis of CO2 emissions embodied in trade: The feedback effects. Ecological Economics, 2011, 71: 42–53.10.1016/j.ecolecon.2011.08.024Suche in Google Scholar
[12] Su B, Ang B W. Input-output analysis of CO2 emissions embodied in trade: A multi-region model for China. Applied Energy, 2014, 114: 377–384.10.1016/j.apenergy.2013.09.036Suche in Google Scholar
[13] Wiedmann T. A review of recent multi-region input-output models used for consumption-based emission and resource accounting. Ecological Economics, 2009, 69(2): 211–222.10.1016/j.ecolecon.2009.08.026Suche in Google Scholar
[14] Peters G P. From production-based to consumption-based national emission inventories. Ecological Economics, 2008, 65(1): 13–23.10.1016/j.ecolecon.2007.10.014Suche in Google Scholar
[15] Peters G P, Andrew R, Lennox J. Constructing an environmentally-extended multi-regional input-output table using the GTAP database. Economic Systems Research, 2011, 23(2): 131–152.10.1080/09535314.2011.563234Suche in Google Scholar
[16] Timmer M P, Los B, Stehrer R, et al. Fragmentation, incomes and jobs: An analysis of European competitiveness. Economic Policy, 2013, 28(76): 613–661.10.1596/1813-9450-6833Suche in Google Scholar
[17] Wang Z, Wei S J, Zhu K. Quantifying international production sharing at the bilateral and sector levels. National Bureau of Economic Research, 2013, No. w19677.10.3386/w19677Suche in Google Scholar
[18] Meng B, Peters G, Wang Z. Tracing CO2 emissions in global value chains. SSRN, 2014, http://ssrn.com/abstract=2541893.10.2139/ssrn.2541893Suche in Google Scholar
[19] Zhang W, Peng S. Comparative analysis of “North” and “South” country’s environmental pressure from consumption and production based perspectives. World Economy, 2014(8): 126–150.Suche in Google Scholar
[20] Xu Y, Dietzenbacher E. A structural decomposition analysis of the emissions embodied in trade. Ecological Economics, 2014, 101: 10–20.10.1016/j.ecolecon.2014.02.015Suche in Google Scholar
[21] Xiao H, Yang J H, Qiao H. Quantification and decomposition of global carbon intensity induced by final demand. Systems Engineering — Theory & Practice, 2015, 35(7): 1646–1656.Suche in Google Scholar
© 2015 Walter de Gruyter GmbH, Berlin/Boston
Artikel in diesem Heft
- Domino Effect Analysis, Assessment and Prevention in Process Industries
- Carbon Emissions and Carbon Intensity in China’s Exports: A Contrast of SRIO and GIRIO Methods
- Game Analysis in a Dual Channels System with Different Power Structures and Service Provision
- Uniform Parallel Machine Scheduling Problem with Controllable Delivery Times
- Dealing with Interval DEA Based on Error Propagation and Entropy: A Case Study of Energy Efficiency of Regions in China Considering Environmental Factors
- A Data-Centric Approach for Model-Based Systems Engineering
- Testing for Spatial Lag Effects in Varying Coefficient Spatial Autoregressive Models
- A Generic Statistics-Based Tessellation Method of Voronoi Diagram