
An Improved Model of Dividend Tax Based on Continuous Function
-
Chunning Yan
 ,
Hang Zhang
,
Hang Zhang

Abstract
By comparing several kinds of continuous functions, a normal distribution function-based model is proposed to improve the existing Levy policy of dividend tax in this paper. The improved model is adopted to stimulate the long-term investment and contain the short-term speculation. Further, this improved model paves an avenue to overcome the deficiency on the double policy of dividend tax rate by holding stock period with one day difference and also adjust the tax revenues by controlling the parameters of the distribution function. The findings from this study suggest that the improved model with normal distribution function may provide more reasonable results based on the data from the stock market and, finally, the proper decision is discussed.
1 Introduction
Differentiated Levy of dividend tax, the first regulations, issued by the Ministry of Finance after the 18th National Congress of our Party in China has been attached importance to the government as the categories of tax. The importance of capital market has been given expression to the existing policy by the government. It is real validity to guide the capital market in building philosophy of the correct investment. As we know, the effective taxation system is the cornerstone to ensure the healthy development of the stock market.
Dividend tax gives rise to abroad controversy in recent years, and its effect has attracted considerable research interest in foreign academia. Lasfer[1] showed that companies who paid dividend bonus can make the maximal profit for the shareholders with the analysis of UK. Amihud and Murgia[2] studied that the value of company can be improved by the high tax of dividend bonus in Germany. However, the dividend bonus for the most investors is relatively lower than that for others actually. Getry et al.[3] found that the value of the company had a positive correlation with basic tax. The tax of dividend bonus will be capitalized by the share price in the future. Andres et al.[4] found that the companies were willing to reduce dividend bonus because of the lower profits temporality in Germany, which was opposite with Britain and America. Nam et al.[5] found that it is more profitable to pay the dividend bonus after the tax reduced than before by exploring the policy in America in 2003. The motivation of managers is showed step by step after tax reduced. Poterba and Summers[6] performed the regression model to verify the negative correlation between dividend bonus and tax by the research of the company’s investment and dividend payments. They analyzed the effect of the reform of the dividend bonus policy from 1950 to 1981 in Britain, in which company preferred to remain the fund to reduce the capital cost. Auerbach et al.[7] found that the reform of the dividend tax made more profits for the companies who were still in the development stage with the analysis of the policy in America in 2003. Guo et al.[8] made suggestions directly to perfect our tax system of capital market based on the analysis of the effect of the tax capital market mechanism, such as expanding the scope of the tax levied. Ma et al.[9] surveyed the treating method of the double dividend of the tax policy adopted in the Organization for Economic Co-operation and Development member states, and agreed to Levy the dividend tax partly in China. Zhou et al.[10] concluded the industry has an appreciable impact to the dividend distribution of companies in China based on the intensive studies of industry characteristics, involved 838 A shares from 2000 to 2003. The utilities of industry’s dividend payment rate were higher. Du et al.[11] showed that dividend tax has a negative correlation with financing structure of the company, which prejudiced to select the optimum financing structure and expanded investment in China. Liu[12] studied hundreds of listed companies from 1997 to 2006 and found that one of the most important factors which affect the financing structure of the company was dividend tax.
According to the relevant provisions of the “individual income tax law”, dividend tax belongs to the category of “individual income tax”. Differentiated Levy of dividend tax issued by the Ministry of Finance regulate the tax rate is 5% by holding stock period more than one year, 10% more than one month, and 20% less than one month since 2013. However, it is not good enough to adjust the capricious market by the differentiated Levy of dividend tax policy. Continuous function adopted in this paper can improve the existing step function.
2 The dividend tax model
The existing Levy policies of dividend tax are described in this section, divided into before 2013 and after 2013.
2.1 Description of the model before 2013
According to the State Administration of Taxation (SAT), dividend bonus of individual investors had been preferential treatment for 50% tax reduction which obtained from listed company since 2005. At the same time, 20% of personal income tax should be paid by individuals for possession of China’s bonds, stocks and options, but obtained from Chinese companies, enterprises or other economic organizations. The actual tax rate burden was equal to 10% before 2013.
The sample is the cash dividends selected from A-share listed companies in 2011 in China (ignoring the bonus share to shareholders). A-share means RMB ordinary shares. The shares are issued by the domestic companies in China. Also, the shares are subscribed and traded in RMB currencies by the domestic institutions or individuals. According to the database of Tongdaxin, there are 1618 companies who hand out cash dividends in A-share listed companies.
Then, the tax revenues on dividend bonus paid by A-share listed companies in 2011 is established with the actual tax burden, the total number of equity and the data of cash dividends. The tax revenues on dividend bonus are equal to 55.61 billion.
2.2 Analysis of the model since 2013
The existing policy of dividend tax had been executed for individual public offering stocks and transfer shares of listed companies in the securities market since 2013. The calculation flowchart for the existing policy model of dividend tax is showed as follows:
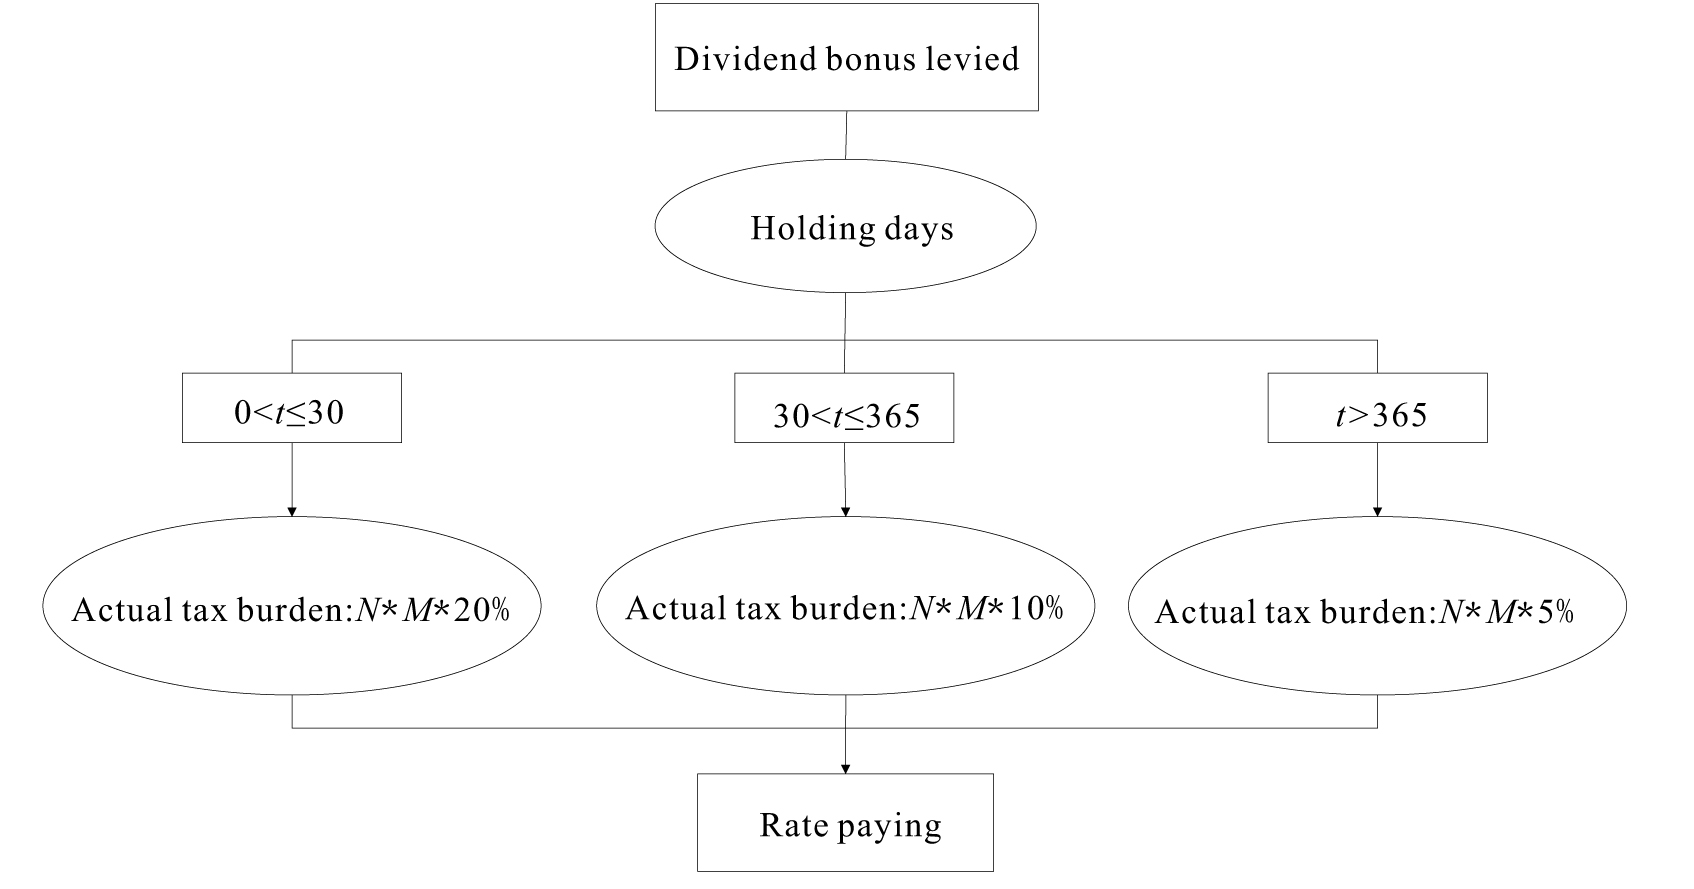
The calculation flowchart for the existing policy of dividend tax
Let N be the number of shares who buy from the listed companies, M indicate that the listed companies distribute the cash dividend per share, and t be the holding days. Existing policy stipulates that dividend tax levied is divided into three phases according to the holding stock period. From the perspective of quantitative analysis, the differentiated Levy model of dividend bonus can be showed as follows:
where DM indicates tax amount payable, Y means as 0-1 variables: Y1 = 1 indicates the holding stock period less than one month, Y2 = 1 indicates the period more than one month and less than one year, Y3 = 1 indicates the period more than one year. A 0-1 programming model is established for calculating the tax revenues on dividend bonus as the objective. Next, considering all listed companies who distributed the cash dividends, we count the tax revenues (billion) on dividend bonus in 2011 as following:
where W indicates the dividend tax revenues, Qi is the total capital stock of company i, Mi is the cash dividend bonus per share of company i in 2011, rt means the actual tax rate who hold the stock for t days. We assumed the holding days within 450, and the distributions are uniformed in a month, a month to half a year and more than half a year. a calls short-term proportion that the investors hold the stocks in a month; b means the holding stocks proportion from a month to half a year that called mid-term proportion; c means holding stocks proportion for more than half a year that called long-term proportion.
In this section, the dividend tax revenues of 1618 listed companies are counted by the existing dividend tax model in Table 1 in 2011. At first, the result is calculated on the assumption than a is equal to 60%, b is equal to 30%, c is equal to 10%. Thus the dividend tax revenues are equal to 88.10 billion. Then it is equal to 52.70 billion if a is equal to 5%, b is equal to 30%, c is equal to 65%. It can be clearly seen in the Table 1. Thus, if c becomes far less than a, W is smaller than before.
The tax revenues of existing dividend policy
| short-term proportion a | mid-term proportion b | long-term proportion c | W (billion) |
|---|---|---|---|
| 60% | 30% | 10% | 88.10 |
| 5% | 30% | 65% | 52.70 |
3 Description of the improved model
The model of existing dividend tax policy issued by SAT stipulates three phases of tax rate. However, the deficiency on the double policy of dividend tax rate by holding stock period with one day difference cannot be overcome. For instance, someone buys a company’s share, and the holding stock period is just a month. Then, the tax rate of dividend bonus is 20%. If the holding stock period is a month plus one day, the tax rate is 10% according to the existing dividend tax policy. This problem can be resolved by using a continuous function introduced in this paper instead of the existing step function. It aims to dampen shocks and stimulate the long-term investment.
3.1 Principle of continuous function
The tax on dividend bonus should decrease along with the growth of the holding days. So the function should continuously decline in the field of definition. Its first-order derivative satisfies f′(t) < 0, and the second derivative satisfies f″(t) > 0 at time t. Long-term investment can be encouraged, and short-term speculation should be contained by the improved model of dividend tax.
3.2 Continuous function and determination of parameter
Among several kinds of continuous functions, we pick the right area of the normal distribution function f1(t),
whose mean values equal zero. Its first-order derivative satisfies
Because Equation (4) is a continuous function, the tax rates of dividend bonus at sometimes are showed in Table 2.
The tax rate of dividend bonus optimized by the normal distribution function
| Day | t=2 | t=10 | t=30 | t=45 | t=60 | t=75 | t=90 | t=120 | t=150 | t=180 |
|---|---|---|---|---|---|---|---|---|---|---|
| Tax rate | 50.00% | 49.11% | 41.85% | 33.42% | 24.39% | 16.27% | 9.91% | 2.81% | 0.56% | 0.08% |
Let DM1 be the tax payable which uses improved dividend bonus model with normal distribution function. Thus, the improved differentiated Levy model of dividend bonus can be showed as follows:
Let S1 denote the dividend tax revenues obtained by the normal distribution function, Qi be the total capital stock of company i, and Mi be the cash dividend bonus per share of the company i in 2011. The d indicates the rate of change on the dividend tax revenues between the existing policy and improved model. Then, the tax revenues on dividends bonus obtained by the normal distribution function is given by
The exponential function f2(t) = k2σ2t(t > 0, 0 < σ2 < 1) with k2=0.51 and σ2 = 0.99 met the above-mentioned rule. Its first-order derivative satisfies
The power function f3(t) = k3tσ3(t > 0, σ3 < 0) with k3 = 0.5 and σ3 = −0.32 also met the above-mentioned rule. Its first-order derivative satisfies
The results of the dividend tax obtained by the exponential function and power function are showed in Section 3.3. As illustration, we only consider the dividend tax policy models based on normal distribution function, exponential function and power function in this paper.
3.3 Comparison of the three continuous functions
The three continuous functions all can achieve the ends to regulate the dividend tax revenues, and set the tax rate beginning with 50%. Towards this end, the tax rates are different as shown in Figure 2 below.

Comparison of the tax rate of dividend bonus
The tax rate of dividend bonus obtained by the normal distribution function changes slowly when the holding stock period is less than one month as shown in Figure 2. It is better to contain the short-term speculation. However, the tax rate obtained by the power function decreases dramatically with the holding stock period being less than one month. It may lead to undersell in the short-term and stock market fluctuation. Also, the tax rate gained by the normal distribution function is closed to zero when the holding stock period is more than half a year depicted in Figure 2. It is availed to the long-term investment. However, the tax rate obtained by the exponential function is a flat curve when the holding stock period is more than half a year. It hinders the long-term investment. Therefore, the dividend tax model based on the normal distribution function can not only stimulate the long-term investment, but also contain the short-term speculation, indicating that it follows the demand of tax regulation and has a better effect.
As we know, d indicates the rate of change on the dividend tax revenues between the existing policy and improved model. Therefore d is the bigger the better on the condition of a is larger than c. It can do better to contain the short-term speculation. Next d is the smaller the better on the condition of a is smaller than c. It can do better to promote to the long-term investment. Given the values of a, b and c, the result of the tax revenues can be counted. The models based on the normal distribution function, exponential function and power function also yield the data of the dividend tax (billion) in 2011, shown in Table 3. So, the normal distribution function is more suitable than others from this rule.
The dividend tax revenues obtained by the three continuous functions
| a | b | c | Normal distribution function | Exponential function | Power function | |||
|---|---|---|---|---|---|---|---|---|
| S1(billion) | d1 | S2(billion) | d2 | S3(billion) | d3 | |||
| 60% | 30% | 10% | 176.12 | 99.91 | 180.10 | 104.43 | 102.41 | 16.24 |
| 5% | 30% | 65% | 32.03 | −39.22 | 54.86 | 4.10 | 55.23 | 4.80 |
It is seen from Table 3 that the dividend tax revenues based on normal distribution function is equal to 176.12 billion when the short-term stock proportion accounts for 60%. It increases by 99.91% in comparison with the three-step model, which is benefit to contain the short-term speculation. The shorter the holding stock time is, the higher the tax is. However, the dividend tax revenues based on the power function just increases by 16.24% compared with the three-step model. Thus, the effect of containing the short-term speculation is inconspicuous. Conversely, the dividend tax revenues based on the normal distribution function reduce by 39.22% in comparison with the three step model when the long-term stock proportion accounts for 65%. It is benefit to stimulate the long-term investment. The longer the holding stock time is, the lower the tax is. Whereas, the dividend tax revenues based on the power function and exponential function are higher than those based on the three step model when the long-term stock proportion is higher. It prejudices the long-term investment. In summary, due to more obvious effect, the model based on the normal distribution function is regarded as the best one to improve the three-step model.
4 Adjustment of dividend tax revenues and empirical analysis
The tax revenues can also be adjusted by controlling the parameters of the distribution function as described in Section 3. To save space, the numerical results for the exponential function and power function are omitted. For the adjusted parameter of the normal distribution function with σ = 45 and σ = 55, the results of the tax revenues are summarized in Table 4.
The tax revenues based on the normal distribution function with σ = 45 and σ = 55
| a | b | c | W(billion) | σ = 45 | σ = 55 | ||
|---|---|---|---|---|---|---|---|
| S1(billion) | d1 | S1(billion) | d1 | ||||
| 60% | 30% | 10% | 86.19 | 189.63 | 115.24 | 164.62 | 86.86 |
| 5% | 30% | 65% | 40.32 | 31.74 | –39.77 | 32.27 | –38.77 |
We can see from Table 4 that, for a = 60%, b = 30% and c = 10%, the dividend tax revenues based on the model with normal distribution function are about 115.24% and 86.86% higher than those based on the three-step model with σ = 45 and σ = 55, respectively, since 2013. Turned down the value of σ can improve the tax revenues in this situation. The government can ensure healthy development of the stock market by improving the tax revenues when short-term speculators accounts higher. We can also see that, for a = 5%, b = 30% and c = 65%, the tax revenues are about 39.77% and 38.77% less than those, when σ = 45 and σ = 55, respectively, since 2013. Similarly, it is efficient to encourage long-term investment for the government by reducing the tax. Turned down the value of σ can reduce the tax revenues in this situation.
The empirical analysis by comparing the existing policy model to the dividend tax model based on the normal distribution function indicates as follows. The sample is A-shares of Changyu (000869) which hands out cash dividends in 2011. It is assumed that someone holds 10000 shares of A-shares of Changyu who gains 15200 RMB of dividend bonus, showed the tax burden in Table 5. We just show the result at some points, because the improved function is a continuous function. Then, we count the dividend tax by the improved model and the existing policy in the Table 5.
Comparison of the dividend tax on the basis of Changyu
| Holding periods | t = 2 | t = 10 | t = 30 | t = 60 | t = 90 | t = 150 | t = 180 | t = 365 | t = 450 |
|---|---|---|---|---|---|---|---|---|---|
| tax of existing policy | 3040 | 3040 | 3040 | 1520 | 1520 | 1520 | 1520 | 1520 | 760 |
| tax of improved model | 7610.20 | 7465.47 | 6361.66 | 3707.24 | 1507.25 | 84.61 | 11.68 | 0 | 0 |
The detailed values of the dividend tax can be counted by combining the dividend tax model based on the normal distribution function. As is shown in Table 5, the actual tax burden of dividend bonus based on the improved model is a far more than that based on the existing policy using step function with 0 < t < 30 for A-shares of Changyu. Short-term holders have almost no profit. The actual tax rate of the existing policy directly descends from 20% to 10% if the holding stock period is a month plus one day. It may lead rapid fluctuation of stock market if the institutional investors vote with their feet. Also the actual tax rate curve declines gradually based on the normal distribution function when the investors hold the socks for a short time. But the tax burden is almost equal to zero if the investors hold the stocks for half a year. Thus, it is better to stimulate the long-term holders.
5 Concluding discussion and remarks
At first, the tax revenues can be adjusted by controlling the parameter of the improved dividend tax model. We can improve the tax properly with a background of overheating stock market. Moreover, we can reduce the tax to protect the investors with a depressed stock market. As mentioned earlier, the value of σ is 45 or even lower to improve the tax burden if the short-term holders account for 60% or more. Conversely, σ can be higher to reduce the tax burden if the long-term holders account for more, stimulating the long-term investment. According to the sample in 2011, σ is valued between 45 to 55, the value of the dividend tax revenues is 189.63 billion to 164.62 billion if the short-term holders account for 60%. According to calculations, the actual tax revenues of dividends bonus in 2011 are equal to 55.61 billion which is far less than the result of the model proposed in this paper. It may be a rare thing to sell the stocks in short-term. The value of the dividend tax revenues are 31.74 billion to 32.27 billion if the long-term holders account for 65%. It is in turn less than the tax revenues which promote long-term investment.
Secondly, the existing dividend tax policy takes the different tax. It is based on the different holding stock periods of the investors who obtained dividend bonus from listed companies. Assumed that someone holds 10000 shares of A-shares of Changyu for 30 days, he should pay 3040 yuan for dividend tax based on the existing policy, while he has to pay 6361.66 yuan based on the improved model introduced in this paper. Thus, the model based on the normal distribution function is better to contain the short-term speculation. Assumed that someone holds 10000 shares of A-shares of Changyu for 180 days, he should pay 1520 yuan for dividend tax based on the existing policy, but he needs just pay 11.68 yuan based on the improved model. Obviously, the improved model is better to simulate the long-term investment.
Finally, the model considered in this paper can not only overcome the deficiency about the tax rate differs by two times from the holding stock period by one day difference, but also inherits the advantage of the existing dividend tax policy. Investors would not sell stocks on the same day under the guidance of the improved model. Thus, it is benefit to reduce the risk and damping shocks. Meanwhile, the company may obtain more attention to the market if the dividend bonus is higher, and investors will hold the shares for a long-term.
Acknowledgements
The authors gratefully acknowledge the Editor and two anonymous referees for their insightful comments and helpful suggestions that led to a marked improvement of the article.
References
[1] Colebrook C, McHoul A, Lasfer M A. Taxes and dividends: The UK evidence. Journal of Banking and Finance, 1996, 20(3): 455–472.10.1016/0378-4266(95)00012-7Suche in Google Scholar
[2] Amihud Y, Murgia M. Dividend, taxes, and signaling: Evidence from Germany. The Journal of Finance, 2012, 52(1): 397–408.10.1111/j.1540-6261.1997.tb03822.xSuche in Google Scholar
[3] Getry W M, Kemsley D, Mayer C J. Dividend taxes and share prices: Evidence from real estate investment trusts. The Journal of Finance, 2003, 58(1): 261–282.10.1111/1540-6261.00524Suche in Google Scholar
[4] Andres C, Betzer A, Goergen M, et al. Dividend policy of German firms: A panel data analysis of partial adjustment models. Journal of Empirical Finance, 2009, 16(2): 175–187.10.1016/j.jempfin.2008.08.002Suche in Google Scholar
[5] Nam J, Wang J, Zhang G. The impact of the dividend tax cut and managerial stock holdings on corporate dividend policy. Global Finance Journal, 2010, 21(3): 275–292.10.1016/j.gfj.2010.09.005Suche in Google Scholar
[6] Poterba J M, Summers L H. The economic effects of dividend taxation. Homewood, IL: Richard D. Irwin, 1985, 18(3): 227–284.Suche in Google Scholar
[7] Auerbach A J, Hassett K A. Leverage and dividend irrelevance under corporate and personal taxation. Journal of Finance, 2005, 35(2): 53–67.Suche in Google Scholar
[8] Guo T Y, Lu Y. Problems and solutions on China’s tax system of capital market. Taxation Research, 2008(12): 33–35.Suche in Google Scholar
[9] Ma G Q, Li W P. The study of tax system of dividend and bonus double taxation. Research on Financial and Economic Issues, 2008(12): 77–81.Suche in Google Scholar
[10] Zhou H W, Li Z F, Tang C Y. The influence of industrial in dividend distribution: An empirical study on Chinese listed companies. Forecasting, 2004, 23(6): 62–79.Suche in Google Scholar
[11] Du L, Chen J P, Zhang L Z. The dividend tax reform in our country based on the influence of the capital cost of the company. World Economic Outlook, 2007(1): 52–57.Suche in Google Scholar
[12] Liu Q Q. The study of the financing structure of listed companies and its influencing factors in China. Jilin University, 2008.Suche in Google Scholar
© 2014 Walter de Gruyter GmbH, Berlin/Boston
Artikel in diesem Heft
- An EPC Forecasting Method for Stock Index Based on Integrating Empirical Mode Decomposition, SVM and Cuckoo Search Algorithm
- American Option Pricing Using Particle Filtering Under Stochastic Volatility Correlated Jump Model
- The Stochastic Cash Balance Problem with Fixed Costs: The Risk-averse Case
- Study of How Experience Involvement Affects Users’ Continuance Intention to Use Mobile Reading
- Optimizing the Grey GM(1,N) Model by Rebuilding All the Back Ground Values
- Linear Quadratic Nash Differential Games of Stochastic Singular Systems
- Research on Management of Food Enterprise Technological Innovation Based on Overall Unbalanced Multiplicative Linguistic Evaluation Scale
- An Improved Model of Dividend Tax Based on Continuous Function