
Facile Combustion Synthesis of (Y,Pr)2O3 Red Phosphor: Study of Luminescence Dependence on Dopant Concentration and Enhancement by the Effect of Co-dopant
-
K. Vini


Abstract
There occurs a great interest in explaining the dependence of dopant concentration on the luminescence efficiency of rare earth oxides. Unambiguously, this study explains that luminescence intensity increases with increase in dopant concentration only up to optimised value. The syntheses of doped and co-doped yttrium oxide (Y2O3) nanophosphors in this study were carried out by making use of combustion method. This method produces the nanophosphors that have sizes ranging between 5 and 20 nm as confirmed by transmission electron microscopy. X-ray diffraction pattern confirms that the incorporation of praseodymium oxide (Pr3+) and gadolinium oxide (Gd3+) does not cause any change in the cubic structure of Y2O3. The phase purity has been confirmed by Fourier transform infrared spectrum. Diffuse reflectance spectra reveal that the bandgap increases with increase in annealing temperature. Bandgap has been calculated by making use of the Kubelka–Munk function. Strongest emission was observed at 605 nm with 2 wt% of Pr3+ as optimised concentration. Replacement of Y3+ by Gd3+ partially enhances the 605-nm emission linearly. The [Y:Pr:Gd] exhibits luminescence intensity of 2.705 times more than that of Y:Pr nanophosphors. This is for the first time our team has made a detailed study regarding the effects of co-doping in the case of Y2O3:Pr powders. We have successfully presented the changes that happen to the particle after co-doping especially in the particle size and luminescence properties.
1 Introduction
Phosphors play an important role in display applications. Some of the significant features of this type of applications are long life and high luminescence properties. Researches have been done extensively to find the ways to increase the luminescence of nanophosphors. One such method is the incorporation of rare earth elements as dopants into the host lattice [1]. White light-emitting diodes (LEDs) are under extensive study and have become a hot topic in terms of both their fundamental and technological importance because of their reduced volume, long life span, high efficiency, free of mercury pollution, and conservation of energy [2], [3], [4], [5], [6]. Fabrication of white LEDs can be done by many ways. It can be done either by the combination of single near-ultraviolet (UV) LED with red-blue-green (RGB) colour phosphor or by the combination of blue LED with yellow phosphor. In the last decade, detailed investigation has been carried out by the researchers on the red light-emitting phosphors by doping with europium oxide (Eu2+ and Eu3+) [7]. Yttrium oxide (Y2O3) doped with Eu3+ nanophosphors exhibits high-luminescence phenomena under cathode ray and UV excitation [8]. Later, many scientists reported the red light-emitting properties of samarium oxide (Sm3+) when it incorporates into Y2O3 under the excitation [7]. This work mainly focussed on luminescence properties of praseodymium (Pr)-doped Y2O3 nanophosphors. Although some work has been done in connection with Pr-doped nanophosphors, still much more work has to be done on this topic to get deep inside into Physics [9]. Praseodymium oxide is one among the rare earth elements that can be used as red light-emitting phosphors in the host lattice [10]. Light-emitting properties of Pr3+ depend on the nature of the host lattice. The lanthanum oxide (La2O3) doped with Pr3+ emits green colour, but in the case of cubic Y2O3 doped with Pr3+, emission of red light prevails. The up-conversion properties of Y2O3 doped with Pr3+ have been paid much more attention because of its application in short-wavelength laser [11].
Traditionally, synthesis of phosphors has been done by solid-state reactions. The particle size, synthesised by this method, is in micrometer range. The process of grinding is required to convert larger phosphors into smaller one. Unfortunately, some additional defects are reported because of this grinding process, which in turn reduces the luminescence properties. However, combustion method results in the preparation of small sized phosphors at low temperature with less time [7]. This article reports the preparation of Y2O3:Pr3+ red phosphor by combustion reaction and luminescence enhancement by the addition of co-dopant.
2 Experimental
For synthesis work, Y2O3, praseodymium oxide (Pr2O3), nitric acid (HNO3), and citric acid (C6H8O7) were used as the precursor materials. The chemicals that we take are of analytical grade, purchased from Sigma–Aldrich (99.99 %, Bengaluru) and used without further purification. 0.99 g of Y2O3 and 0.01 g of Pr2O3 (total of 1 g) were dissolved in a mixture of solution containing 25 mL of deionised water and 25 mL of concentrated HNO3. We know that most of the rare earth oxides are insoluble in water. Thus, we added HNO3 as one of the solvents and then heat at 373 K for 2 h with constant stirring. When the solution started boiling, first fumes appeared, and then the solution turned milky white colour. Finally, solution resulted into a transparent solution and was viscous in nature. The metallic ions required for the reaction were present in the solution. When the solution cooled, we added C6H8O7 [12]. The purpose of addition of C6H8O7 is that it acts as a chelating agent in converting the solution to gel [13]. The amount of C6H8O7 to metal solution is in the ratio 2:1 [12]. The metal–citrate complex was formed by the addition of C6H8O7 to the metal solution, which suddenly precipitated out from the solution [12]. When the solution was heated at 373 K, the amount of solution slowly decreased, and the colour of the solution became pale yellow, which was due to decomposition of nitrate, and finally transparent sol was obtained. Further heating resulted to dehydration and hence caused the condensation reaction between acid groups with the formation of water. Removal of excess water resulted in the transformation of sol into transparent gel [13]. The remaining gel has been collected in silica/alumina crucible and annealed to 773 K for 3 h in the furnace with the heating rate of 333 K/h. Finally, we obtained sandal colour Y2O3:Pr nanopowders. We repeated the experiment by changing the concentration of Pr and obtained the optimised concentration followed by annealing at various temperatures. With the optimised concentration, we extended our study on the effect of pH, which is one of the important parameters for size tailoring and Pr3+ luminescence. By the addition of ammonium hydroxide, the pH of the solution varied from 4 to 10, and the dependence of luminescence on pH was studied. In the second step, Y2O3:Pr has been co-doped with Gd3+, and the detailed study regarding the aftereffects of co-doping was performed.
The structure and crystallinity of the powders were analysed by X-ray diffraction (XRD) using Rigaku Miniflex 600, Mumbai (λ = 0.15406 nm, 40 kV, 15 mA). The phase purity of the samples was studied using Fourier transform infrared spectrum (FTIR ) in the wavelength range of 400–4000 cm−1 using Cary 630 with ATR (Agilent Technologies, Bengaluru). Diffuse reflectance spectra (DRSs) of samples prepared by the present method were analysed using UV-Vis spectrophotometer (Lambda; PerkinElmer, Thane) in the wavelength range of 200–800 nm. The studies regarding photoluminescence (PL) were characterised on Cary Eclipse Fluorescence Spectrometer (Agilent Technologies, Bengaluru). The studies related to the size and morphology of powders were carried out by JEM-2100 (Jeol, Tokyo, Japan) high-resolution transmission electron microscopy (TEM). The machine was operating at an accelerating voltage of 200 kV.
3 Results and Discussion
3.1 Structural Analysis
3.1.1 X-ray Diffraction
At present, we have focussed on the optimisation of the optical properties of the powder as a function of Pr concentration. 2 wt% of Pr3+-doped Y2O3 powder seems to be the maximum in the case of luminescence intensity when compared with other Pr3+ concentrations [14]. Figure 1a shows the XRD studies of the phase formation of pure Y2O3 and 2 wt% Pr3+-doped Y2O3 powders. The XRD pattern confirms that the product formed is of single-phase compound. This was revealed from the nature of the diffraction peaks, which were single and sharp [15]. The pure Y2O3 nanoparticles and 1173 K–annealed Pr3+-doped Y2O3 powders exhibit identical XRD pattern [16]. The ionic radius of Pr3+ is 1.13 A0, and that of Y3+ is 0.90 A0, which are very close. Thus, the substitution of Y3+ with Pr3+ ions is easily possible. The results give evidence that the crystal structure remains the same even after the incorporation of Pr3+ into the host Y2O3 lattice [15]. Quite interestingly, it has been noted that all the peaks including minor peaks correspond to Y2O3, which indicates that the Pr2O3 is properly substituted into Y2O3, although the ionic radius of Y3+ is slightly smaller than Pr3+ ions [17]. This, in turn, confirms that the method that we adopted is excellent for doping by making powders with the substitution of Pr in the host Y2O3 [17]. The (hkl) values of all the peaks are indexed in the XRD studies. The diffraction peaks are indexed in accordance with the JCPDS file no. 41-1105. It confirms that the obtained samples have cubic structure [7], [18]. The unit cell lattice parameters were a = b = c = 10.60 A0 with α = β = γ = 900 [15]. The strongest peak appeared to be at 2θ = 29.15. This corresponds to (222) plane for all the compounds. No other extra peaks were noticed, which indicates the presence of impurities [15].
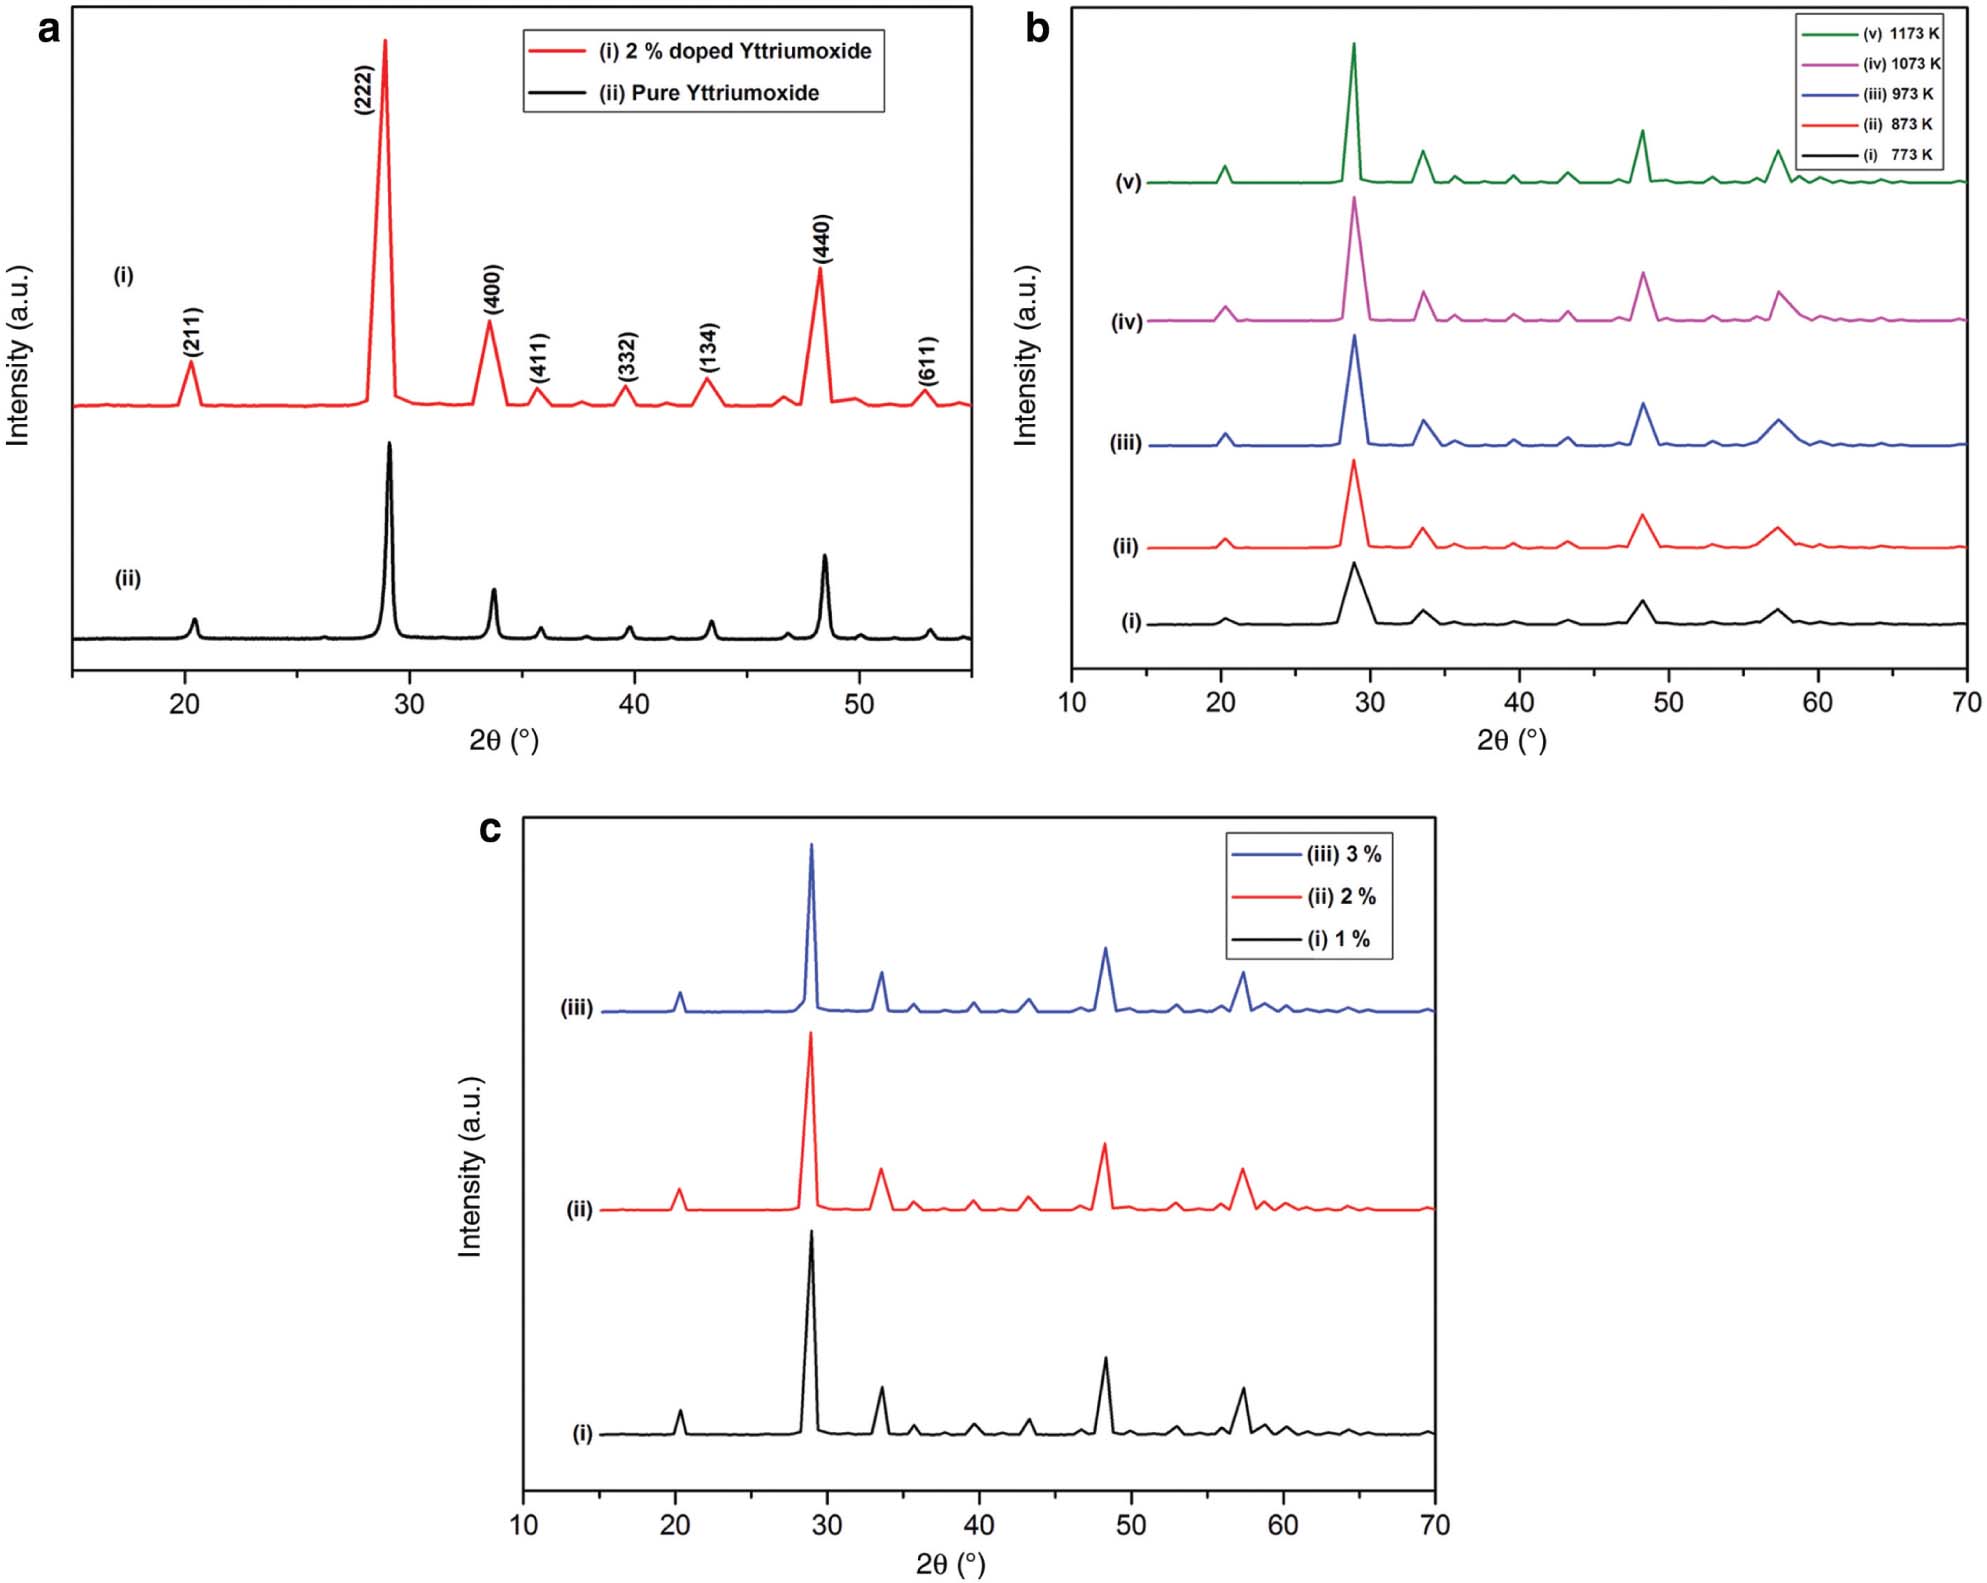
XRD spectra of (a) undoped and 2 wt% Pr3+-doped samples, (b) 2 wt% Pr3+-doped samples annealed at different temperatures, and (c) samples of various Pr3+ concentrations annealed at 1173 K.
The XRD studies of 2 wt% Pr3+-doped Y2O3 phosphors in synthesised temperature and annealed at different temperatures are shown in Figure 1b. During the phase evaluation, the obtained diffraction peaks reveal that the incidence of X-rays on the as-prepared sample shows amorphous nature [19]. At this stage, there appear wide diffraction peaks. The wider peaks can be correlated to the smaller crystallite size [17]. Further, the process of annealing results in the phase transformation of the samples from amorphous to crystalline of Pr3+-doped Y2O3 nanoparticles [17]. The crystallinity improvement with annealing temperature may be because of the enhanced oxidation kinetics [20]. The final product that we synthesised by the combustion method is of highly crystalline nature. This was confirmed by the presence of strong and sharp diffraction peaks that the sample exhibits [21]. This strongly reveals the dependence of the crystallite size and crystallinity of the Pr-doped Y2O3 nanoparticles on the annealing temperature [17]. As far as the phosphors are considered, this is very important because high crystallinity usually means less defects and bright luminescence [21]. The FWHM value of the peak is high for as-synthesised samples when compared to samples annealed at higher temperature. It was expected that when the annealing temperature of the samples increases, the width of the peak becomes narrower. Clearly, this is because of the enhancement in crystallinity of the Pr3+-doped Y2O3 nanopowders [22]. There occurs size increment from 7 to 17 nm when the samples annealed from 773 to 1173 K, respectively [23]. Crystallite size grows with temperature. In the case of nanophosphors, when the size of the grain increases, surface area of the particles decreases, which in turn increases the luminescence intensity. This can be due to the reduction of surface defects as well as the nonradiative rates [14]. When the annealing temperature increases, the lattice parameter decreases, and the crystallite size increases. This indicates that the lattice plane was so close, which in turn led to enhancement of density and reduction of dislocation density [24]. Moreover, there appears the presence of tensile strain and reduction of lattice constant. This was confirmed through the shifting of peaks towards longer angles as the temperature increases [24].
Structural parameters of doped Y2O3 phosphors.
| Temperature (K) of 6 wt% Eu3+ | FWHM (β) (degree) | Lattice parameter a (A0) | Crystallite size D (nm) | Interplanar spacing | Dislocation density (δ) | Particle density (Dx) g/cm3 | Microstrain (ε) (10−3) |
|---|---|---|---|---|---|---|---|
| Debye–Scherrer | |||||||
| 773 | 1.09852 | 10.6448 | 7.46 | 3.0728 | 1.79 | 4.9739 | −0.0229 |
| 873 | 0.82835 | 10.6373 | 9.90 | 3.0707 | 1.02 | 4.9844 | −0.0173 |
| 973 | 0.7707 | 10.6355 | 10.64 | 3.0702 | 0.88 | 4.9869 | −0.0161 |
| 1073 | 0.69987 | 10.6250 | 11.71 | 3.0671 | 0.72 | 5.0017 | −0.0146 |
| 1173 | 0.48747 | 10.6158 | 16.81 | 3.0645 | 0.35 | 5.0148 | −0.0102 |
| Concentration (%) of samples annealed at 1173 K | |||||||
| 1 % | 0.53608 | 10.6094 | 15.29 | 3.0626 | 0.42 | 5.0238 | −0.0112 |
| 2 % | 0.48747 | 10.6158 | 16.81 | 3.0645 | 0.35 | 5.0148 | −0.0102 |
| 3 % | 0.49479 | 10.6308 | 16.57 | 3.0688 | 0.36 | 4.9936 | −0.0103 |
Determination of crystallite size can be done from the most intense peak by making use of Scherrer equation. Calculation of lattice parameter and lattice constant was also done.
One interesting and important observation is that the particle size increases with increase in dopant concentration annealed at a particular temperature, as shown in Figure 1c [22]. But the quenching process of luminescence occurs when the dopant concentration exceeds a particular value, and this will be discussed in detail later [21]. Praseodymium atom is heavier than yttrium, so this difference in their mass may play an important role during synthesis reaction of growth process through diffusion [22]. A slight increase was observed in the lattice parameter when the Pr3+ concentration increases. This is clear because Pr3+ has a larger ionic radius when compared to Y3+. This systematic increase of lattice parameter confirms that the Pr3+ ions are properly incorporated into the host lattice [16]. This can be also confirmed from the diffraction peaks. The peaks are shifted towards smaller angles when Pr3+ concentration increases, which in turn confirms that Pr3+ is inserted properly into Y2O3 site [25].
Crystallite size is not the only factor that is responsible for the broadening of the peak. Presence of strain also plays an important role [15]. The effects of both in the case of peak broadening are not dependent on each other. They can be studied by the Hall–Williamson plot. Figure 2a shows the Hall–Williamson plot to calculate the strain. The strain value (ε) that we obtained is found to be minute, which is of the range 10−3, which indicates its effect is negligible [15].
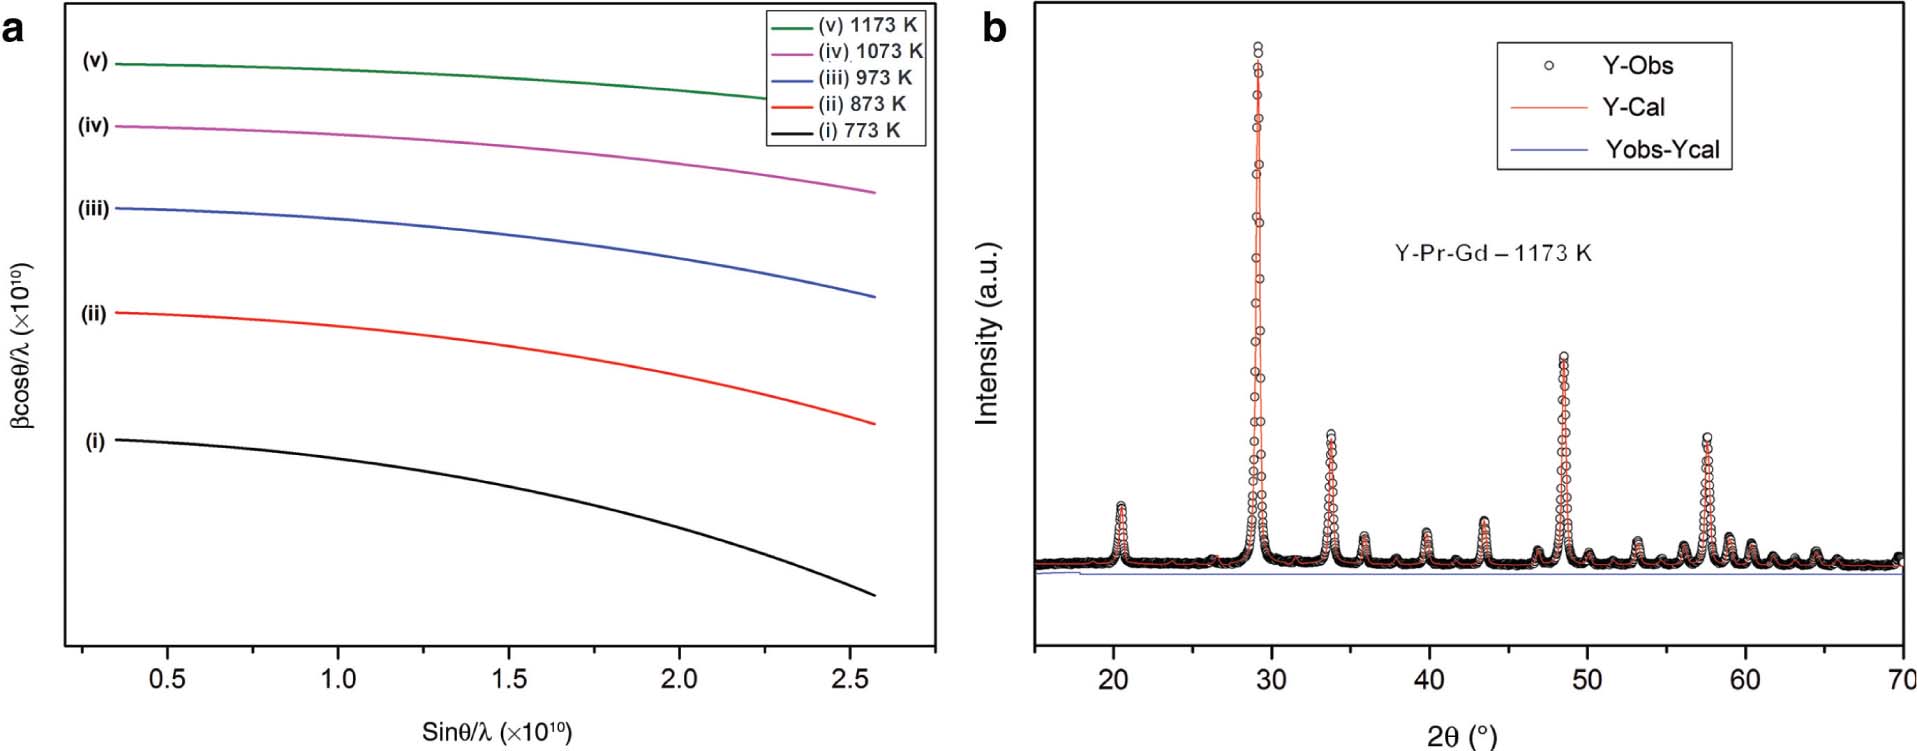
(a) Hall Williamson plot to calculate the strain. (b) Rietveld refinement of Y2O3:2 wt% Pr:1 wt% Gd phosphor.
Calculations of particle density, dislocation density, FWHM, lattice parameter, strain, and crystallite size are tabulated in Table 1. The Rietveld refinement was employed purely to confirm the cubic structure of the as-synthesised sample. The data points were refined using the FULLPROF program. Figure 2b represents the Rietveld refinement of the calcined Y2O3:2 wt% Pr:1 wt% Gd sample. The experimental and stimulated XRD intensities are in agreement with each other [26], [27].
Structural parameters of co-doped Y2O3 phosphors.
| Temperature (K) of 6 wt% Eu3+ and | FWHM (β) (degree) | Lattice parameter a (A0) | Crystallite size D (nm) | Interplanar spacing | Dislocation density (δ) | Particle density (Dx) g/cm3 | Microstrain (ε) (10−3) |
|---|---|---|---|---|---|---|---|
| Debye–Scherrer | |||||||
| 773 | 0.66295 | 10.6427 | 12.37 | 3.0722 | 4.03 | 4.9768 | −0.119 |
| 873 | 0.47461 | 10.6355 | 17.28 | 3.0702 | 4.02 | 4.9869 | −0.08522 |
| 973 | 0.37781 | 10.6284 | 21.71 | 3.0681 | 4.00 | 4.9969 | −0.06784 |
| 1073 | 0.28172 | 10.6212 | 29.12 | 3.0660 | 3.98 | 5.0071 | −0.05058 |
| 1173 | 0.19902 | 10.6070 | 41.22 | 3.0619 | 3.95 | 5.0272 | −0.03573 |
| Concentration (%) of samples annealed at 1173 K | |||||||
| 1 % | 0.19902 | 10.6070 | 41.22 | 3.0619 | 3.95 | 5.0272 | −0.03573 |
| 2 % | 0.19935 | 10.6141 | 41.15 | 3.0640 | 3.97 | 5.0172 | −0.03579 |
| 3 % | 0.25166 | 10.6355 | 32.59 | 3.0702 | 4.02 | 4.9869 | −0.04519 |
Optimised dopant concentration is obtained when we add 2 wt% of Pr3+ to Y2O3. To this optimised dopant concentration, we add different percentages of Gd2O3 as co-dopant. After co-doping with Gd3+, optimised concentration is obtained when Pr3+ is at 2 wt% and Gd3+ is at 1 wt%. The addition of dopant and co-dopant does not cause any change in the structure of the host. Figure 3a shows the XRD spectra of co-doped samples (Gd3+ 1 wt%) annealed at different temperature, and Figure 3b shows the XRD spectra of various co-dopant concentrations annealed at 1173 K [28]. After co-doping with Gd3+, all the peaks including minor peaks correspond to Y2O3 structure with Ia3 as space group. This was confirmed from the JCPDS file no. 43-1036. Shifting of peak appears when the temperature increases. The most intense peak that corresponds to (222) plane was found to be at 2θ = 29.154, 29.153, 29.153, 29.15, and 29.15 annealed at 773, 873, 973, 1073, and 1173 K, respectively. This confirms the formation of homogeneous powder at higher annealing temperature by redistribution of Y3+, Pr3+, and Gd3+ that possess different sizes via interdiffusion. The concentration gradients present in the precursor are responsible for the redistribution of cations [29]. Addition of co-dopant results in an increment of lattice parameter. This also confirms that the obtained oxides are homogeneous in nature [29]. Addition of co-dopant does not cause any change in the phase and crystal structure. But crystallite size increases. Moreover, lattice energy change exhibits lattice strain [17]. Obviously, it has been found that incorporation of Gd into Y2O3 site acts as self-promoter to attain good crystallisation [30]. Table 2 summarises the calculated values.
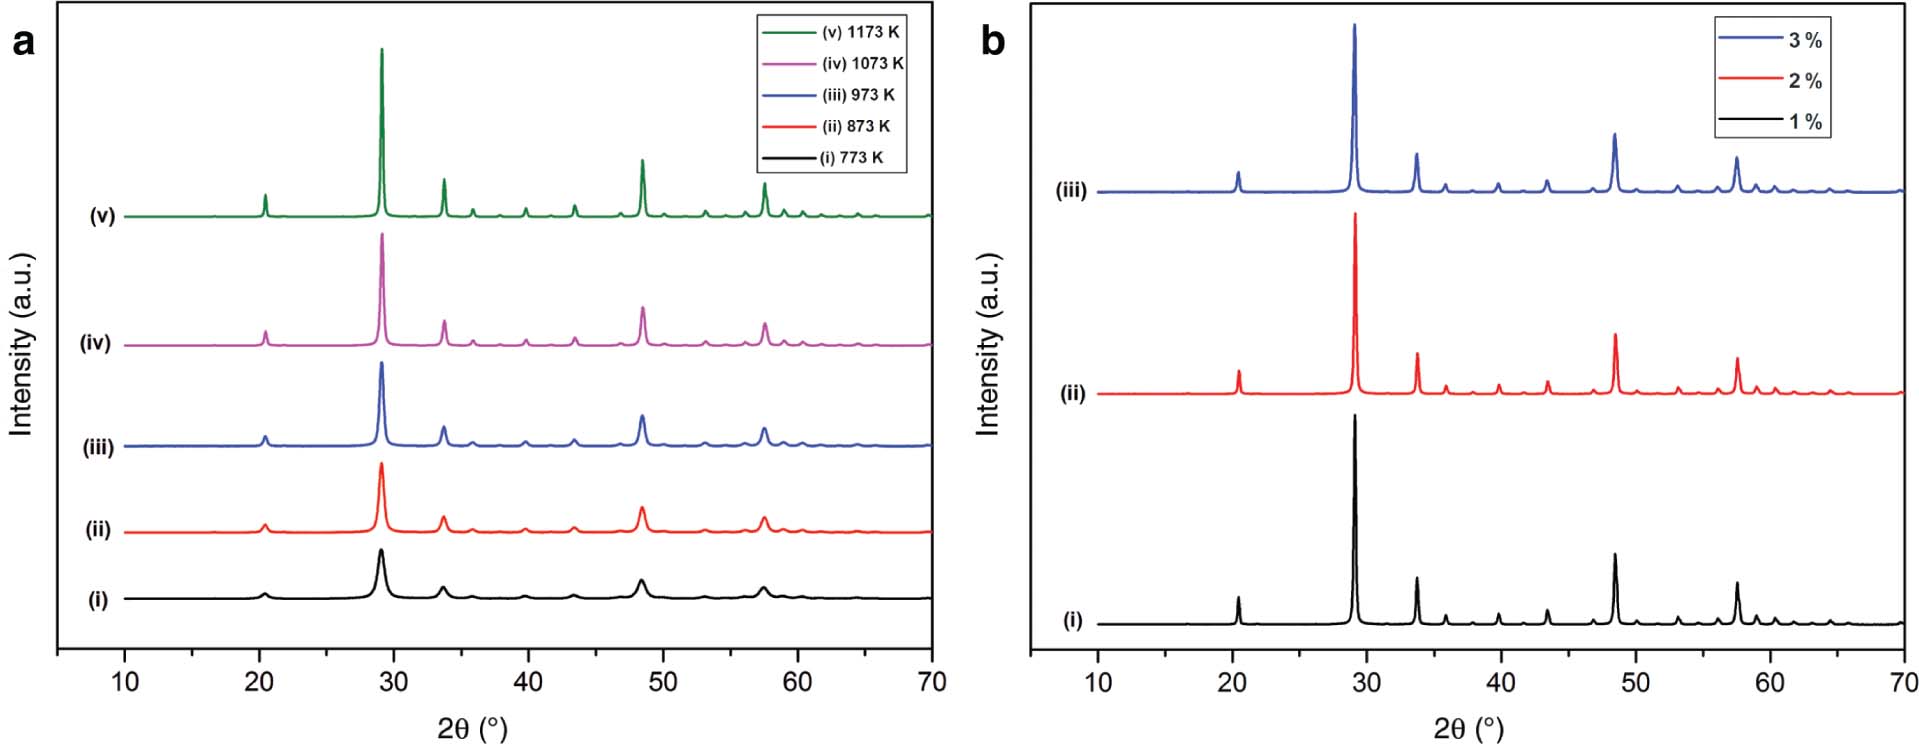
XRD spectra of co-doped samples. (a) Gd3+1 wt% at different annealing temperatures and (b) various concentrations annealed at 1173 K.
3.1.2 Fourier Transform Infrared Analysis
The FTIRs of undoped, Pr3+-doped, and Gd3+ co-doped yttrium nanophosphors in the range 400–4000 cm−1 are shown in Figure 4a and b [18]. This FTIR spectrum indicates a band at 3452 cm−1. The presence of OH− stretching vibrations of hydrogen-bonded hydroxyl group is responsible for this band [31], [32]. This band is found to be weak in the case of pure yttrium compound [15]. This –OH group induces the luminescence quenching, which in turn results in the reduction of luminescence efficiency [15]. Elimination of this problem can be done by incorporating the step of annealing process [17]. From the FTIR spectra, it has been found that when the annealing temperature increases, the presence of this hydroxyl group (–OH) decreases [15]. The low band at 1637 cm−1 was attributed to the presence of carbonate groups. This was formed due to CO2 molecules onto the surface of yttrium oxide [33], [34]. The C–O vibration bands are weak in the case of a pure Y2O3 nanophosphor. When the annealing temperature increases, vibration of C–O bond decreases. This confirms that the carbon content present in the sample decreases [15]. The band at 1385 cm−1 can be attributed to N–O stretching of NO3− group [35]. Here, annealing process also results in the reduction of NO3− residuals. The absorption peaks at 600 and 563 cm−1 can be assigned to stretching vibrations of Y–O bond in Y2O3 lattice. This band favours the formation of cubic phase yttria in the case of Pr3+-doped and Gd3+–co-doped Y2O3 samples [35]. Here, annealing also plays a significant role. Excellent change occurs when the sample is annealed further [36]. When the annealing temperature reaches 1173 K, the organic residues almost vanish. Meanwhile, Y–O stretching bond becomes much stronger, which in turn confirms the perfect crystallisation of Y2O3 phosphor [36]. All the above discussed peaks together ensure that the Y2O3 nanophosphor has been formed [31]. The FTIR spectra show that the prepared samples do not contain any organic residues that may result in the quenching of emission, as the same was confirmed by XRD studies [23], [32].
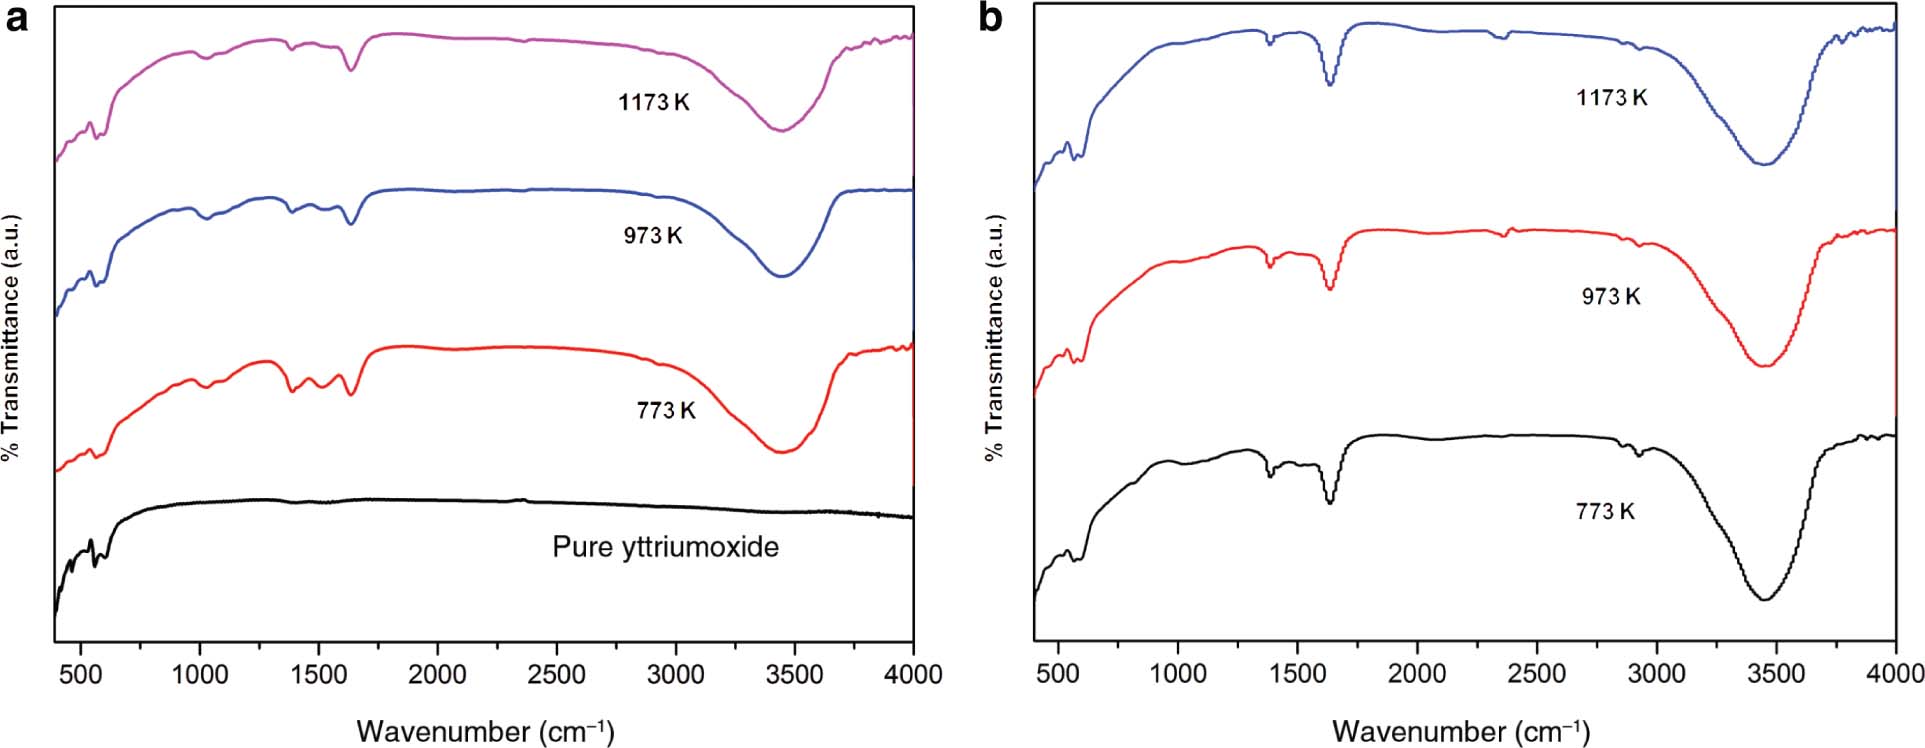
FTIR spectra of the prepared samples for different annealing temperatures (a) 2 wt% Pr3+-doped Y2O3, (b) 2 wt% Pr3+ and 1 wt% Gd3+–co-doped Y2O3.
3.2 Optical Properties
3.2.1 Diffuse Reflectance Spectra
To characterise thin films, the UV-Vis absorption spectroscopy is usually used. In the case of films, scattering of light is very low. Thus, bandgap (Eg) values can be obtained easily if we know the thickness. However, in colloidal samples, the scattering effect is enhanced since a more superficial area is exposed to the light beam. In the case of normal incidence mode, dispersed light is considered as the same as that of absorbed light, and spectrum will not distinguish the two phenomena. Moreover, powdered samples can be obtained frequently instead of colloids or thin films. In UV-Vis absorption technique, sample is dispersed in fluid media such as methanol, ethanol, or water. If the sample size is large, it will precipitate and will be very difficult for the absorption of spectrum to interpret. To avoid these difficulties, it is better to use DRS, which supports the calculation of Eg of unsupported materials [15].
The DRSs of doped and co-doped Y2O3 nanophosphor annealed at different temperatures are shown in Figure 5 [37]. Here, CdSO4 is taken as reference sample [15]. A band at 210 nm was obtained in the case of pure yttrium compound. This implies the absorption of this wavelength. Bandgap of the phosphor is responsible for this band [15]. For Pr3+-doped Y2O3 samples, broad absorption band shows minimum absorption at 212 and 211 nm for Gd3+ co-doped samples [18]. This can be assigned to the transition between conduction and valence band [37]. The metastable energy level that occurs between conduction and valence band, by the addition of dopants, is responsible for the presence of other bands [15]. Absorption in UV-Vis region can be due to transactions concerned with defects or surface impurities. It is quite natural that small particles exhibit a large surface-to-volume ratio, which in turn results in more defects. Thus, the small particles exhibit absorption band, which is broad and strong [37]. When we compare the absorption peak of as-prepared samples and annealed samples, a blue shift can be observed for as-prepared samples. This can be due to the smaller particle size of as-prepared samples when compared to annealed samples [17].
Bandgap determination is very important in solid-state physics [15]. The graph of [F(R8)hν]2 versus hν for pure, doped, and co-doped Y2O3 samples are shown in Figure 6 [17]. The energy difference between the top of the valence band, which is full of electrons, and bottom of the conduction band, which is free of electrons, is known as bandgap. Bandgap of semiconductors determines their application in the field of optoelectronics. Bandgap can be determined by making use of a method called Tauc-Plot. Using DRSs, bandgaps can be calculated by the Kubelka–Munk theory, which was proposed by two scientists named Kubelka and Munk [15].
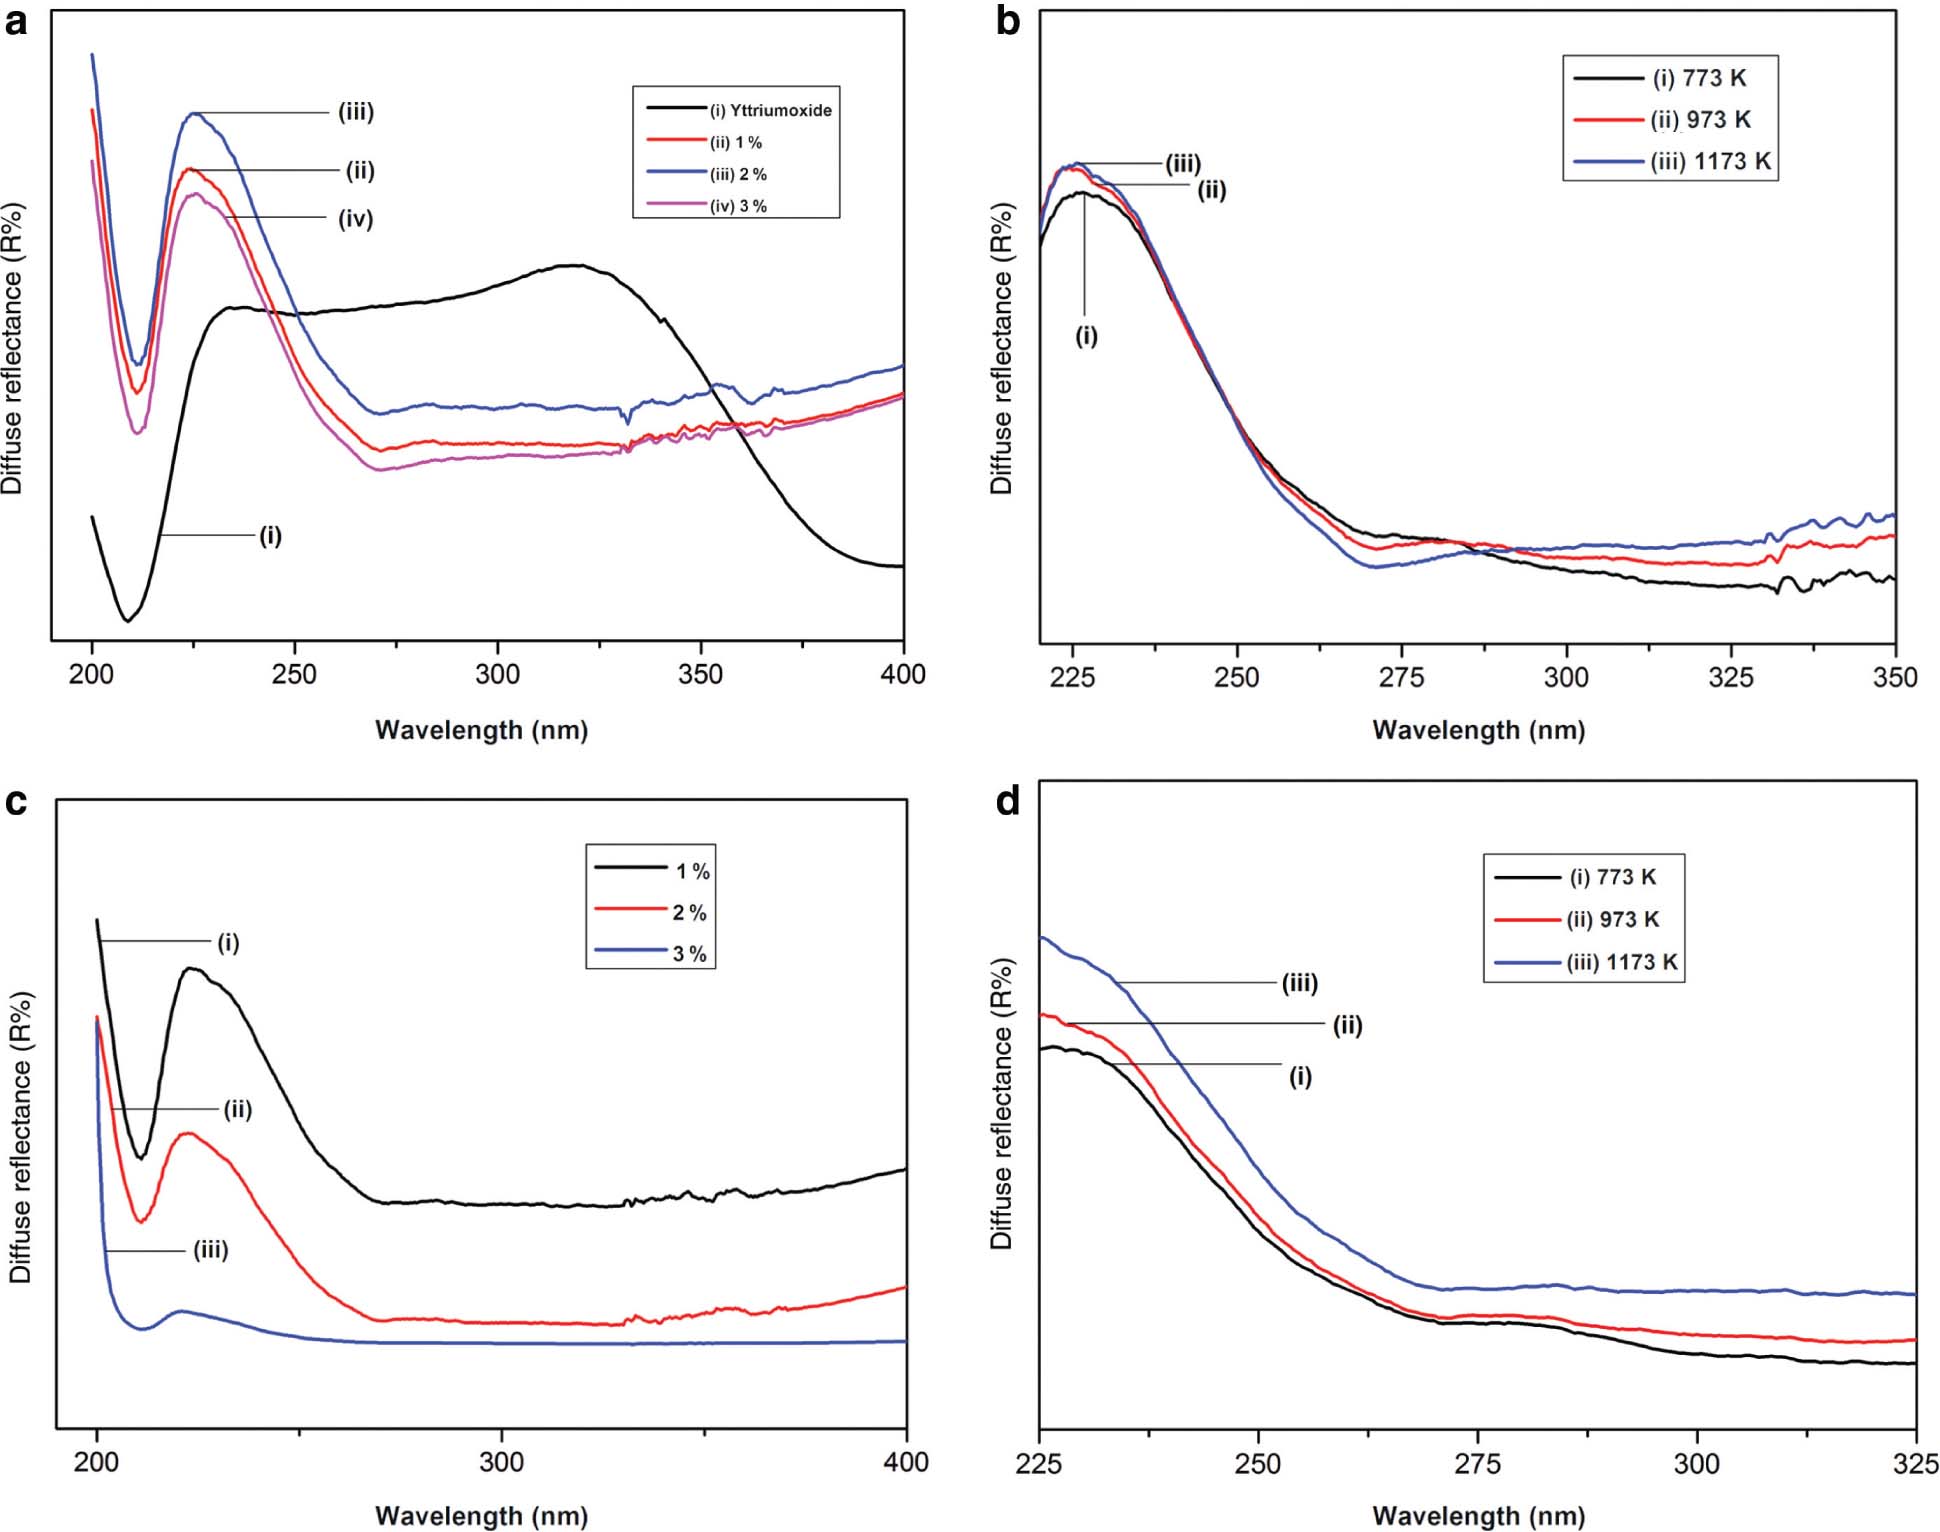
DR spectra of the doped samples as a (a) function of concentration and (b) function of temperature and spectra of co-doped samples as a (c) function of concentration and (d) function of temperature.
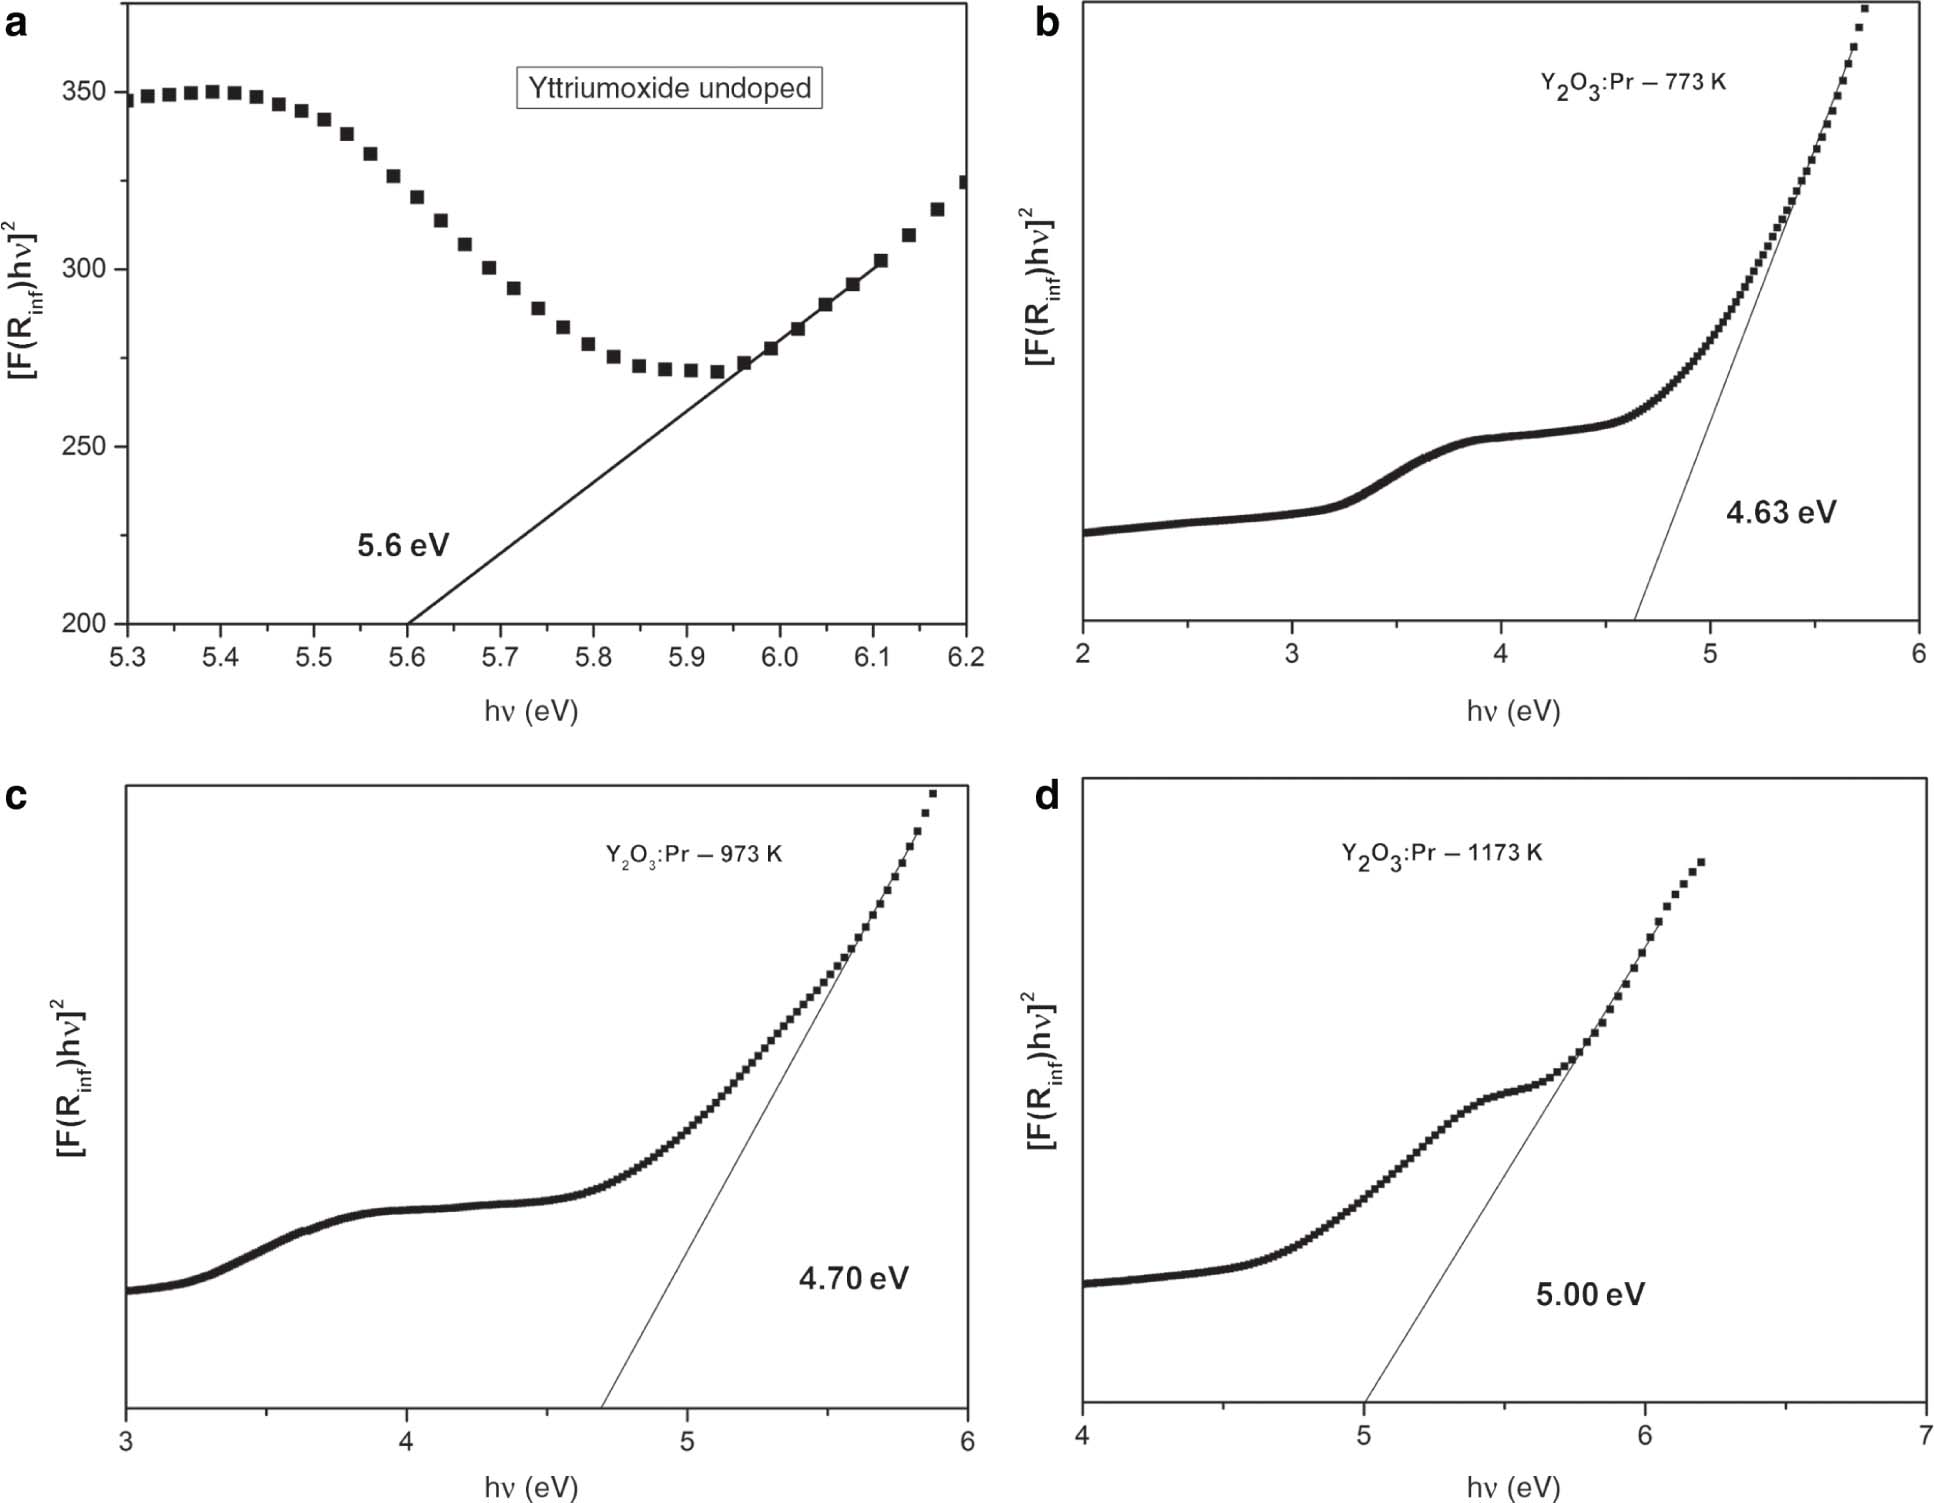
Bandgap calculation of the (a) undoped yttrium, (b–d) 2 wt% Pr3+-doped samples annealed at different temperature and
(e–g) 2 wt% Pr3+ 1 wt% Gd3+ co-doped samples annealed at different temperatures.
By making use of the Kubelka–Munk function, the [hνF(R8)]2 was plotted along y axis and hν along x axis. On the obtained curve, a line is drawn tangent to the point of inflection. The value obtained at the point of intersection of the tangent line along x axis is Eg (bandgap) [15]. The curve that we obtained exhibits both the linear and nonlinear portions. The linear part corresponds to the fundamental absorption, and the nonlinear part characterises absorption that contains impurity states [15]. The results that we obtained are in accordance with previous reports. This confirms the incorporation of Pr3+ into Y2O3 [17]. For doped samples, Eg values vary from 4.63 to 5.00 eV, and for co-doped samples, they vary from 3.99 to 4.42 eV. This bandgap difference can be because of size difference [15]. From the figure, it is clear that the Eg value is greater for annealed samples [37]. The lattice has certain degrees of structural order–disorder. This has influenced directly the distribution of intermediate energy level within the bandgap. There occurs the presence of structural defects in the case of as-prepared samples. Upon heat treatment, defects become less, and host matrix becomes ordered pattern. As a result, the minimisation of intermediate energy levels occurs within the bandgap, and finally Eg increases [37]. After co-doping with Gd3+, the Eg value again reduces. This is because of the presence of oxygen vacancies created due to co-doping of Gd3+ ions. It is clear that Gd3+ is entrenched in Y2O3 lattice and produced oxygen vacancies, which in turn reduce the bandgap of nanophosphors [18]. The decrease in bandgap after co-doping is due to the increase in crystallite size and crystal defects for the co-doped samples [38], [39].
3.2.2 Transmission Electron Microscopy
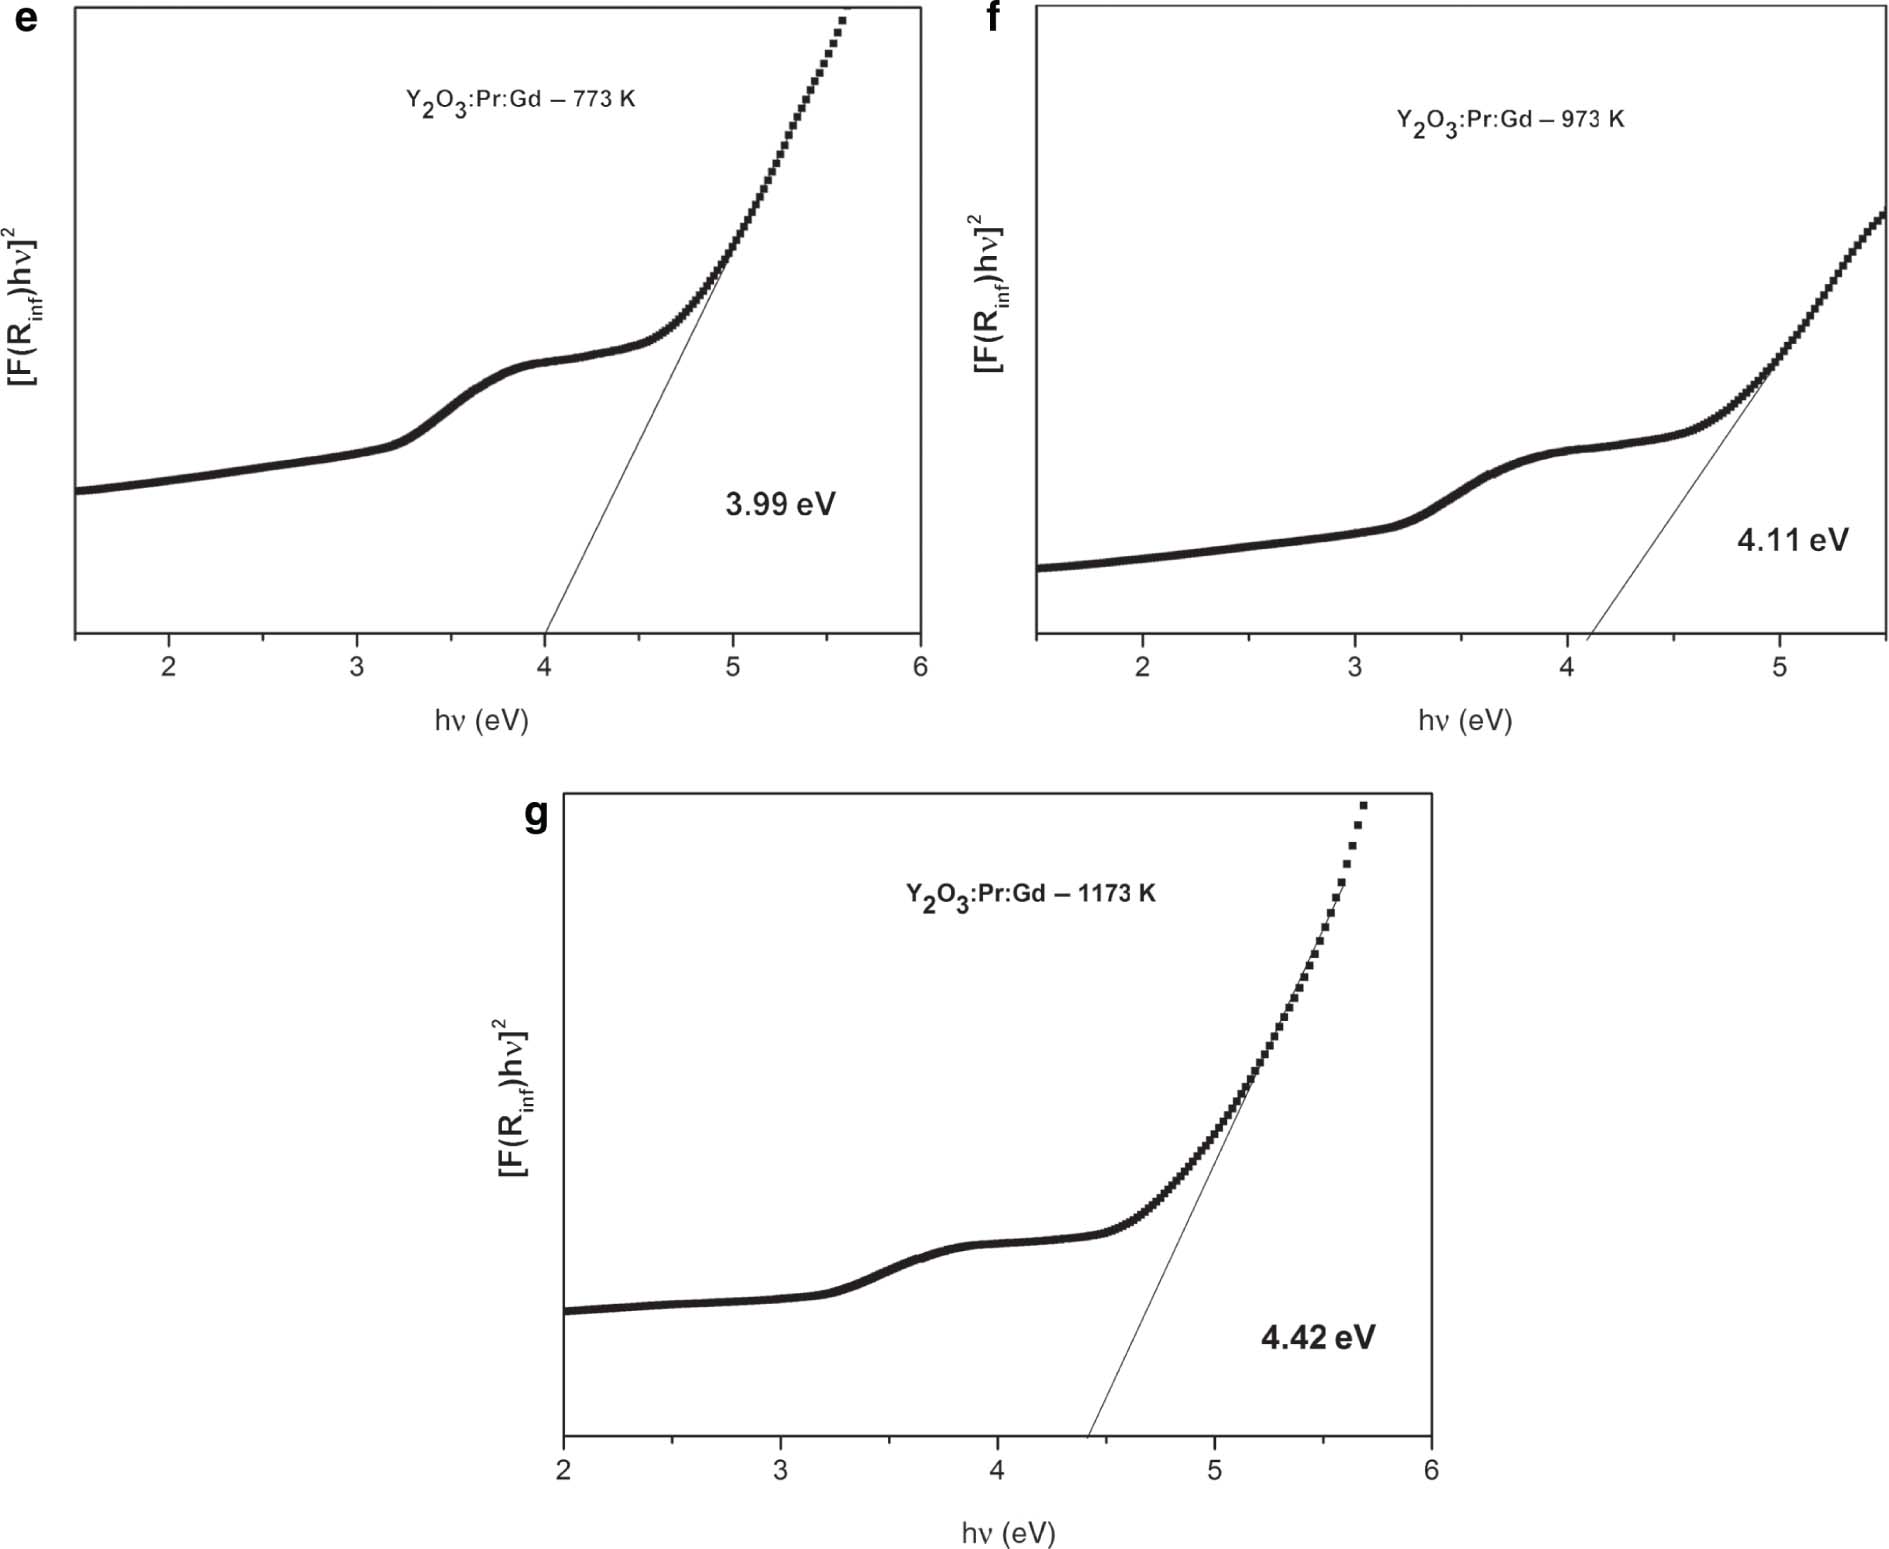
Transmission electron microscopy has been carried out to study the detailed structure of the particles and is shown in Figure 7. In order to obtain a good TEM image, the Pr-doped Y2O3 powder sample was dispersed in ethanol for around half an hour. Then, a drop is placed on the carbon-coated grid surface [12]. Field emission TEM (FE-TEM) image confirms that the obtained samples seem to be agglomerates that contain several crystallites with spherical shape [22]. This characterisation confirms the perfect crystalline nature of the nanophosphors. The obtained lattice fringe is found to be 0.306 nm. This is found to be in accordance with interplanar distance of (222) plane of Y2O3 nanophosphor [40]. The lattice fringes confirm that the nanophosphors that we obtained are of high quality. Moreover, the distortion of lattice fringes is minimum [12]. It is clear that the reduction of particle size results in enhancement of surface area, which in turn increases the surface defects and ultimately results in the reduction of luminescence intensity [12]. Our sample exhibits good luminescence intensity. Because of this, more and more holes and electrons from the excited state will move to ground state through optically radiative recombination routes [12]. The particle size calculated from TEM is found to be in agreement with the size calculated from XRD studies [22].
Field emission TEM of Y2O3:Pr3+ nanophosphor (a) annealed at 1173 K; (b) image of lattice fringes and (c) SAED pattern. Field emission TEM of Y2O3:Pr3+:Gd3+ nanophosphor (d) annealed at 1173 K; (e) image of lattice fringes and (f) SAED pattern.
The selected area electron diffraction (SAED) pattern of the sample heated at 1173 K is shown in Figure 7c and f. Studies reveal that the size and morphology of the Pr3+-doped Y2O3 nanophosphor depend on some distinct parameters such as reaction temperature and time [40]. In the case of samples annealed at 1173 K, each particle contains several nanocrystals. This is the phase transformation process from amorphous to crystalline [41]. Increase in temperature results in increase of particle size, decrease of surface-to-volume ratio, and scattering of light and finally results in increase of efficiency [41]. But at lower temperature, intensity is low. Imperfect incorporation of dopants into host lattice may be the reason for low luminescence intensity [41]. From FE-TEM, it was clear that Pr3+-doped nanophosphors exhibit crystalline nature with spherical shape. The sizes of the Pr3+-doped Y2O3 nanophosphors vary from 5 to 20 nm [42]. When we compare the particle size from TEM image and XRD line width, size is larger in the former case. The reason is that the line width depends on coherent domains, but TEM does not possess such requirement, and it measures the actual size [43]. Sintering plays an important role in size increment. The reason is the presence of hydrogen bonds that occurs between hydroxyl group results in oxygen bridge bonds [44]. The TEM image reveals the presence of some small pores in the prepared samples, which might be due to evolution of gases during combustion. These porous samples are easy to grind to obtain finer powders [45].
3.2.3 Influence of pH on Photoluminescence
In this work, we mainly focussed on the effect of three parameters, namely, the effect of pH, concentration effect of Pr3+ ions, and effect of annealing temperature on the luminescence studies of Y2O3 nanophosphors. The luminescence studies of Y2O3 doped with 2 wt% of Pr3+, which was prepared in different pH values, are shown in Figure 8a. The PL emissions of all the samples exhibit strong and maximum peaks corresponding to a wavelength of 605 nm. The peak intensity increases with increase in pH up to a value of 8. When we further increase pH value, no intensity change can be observed. Same result can be obtained in the case of other samples, which was synthesised under various Pr3+ concentrations. Our studies thus indicate that a pH value of 8 gives much better luminescence intensity in the present prepared samples.
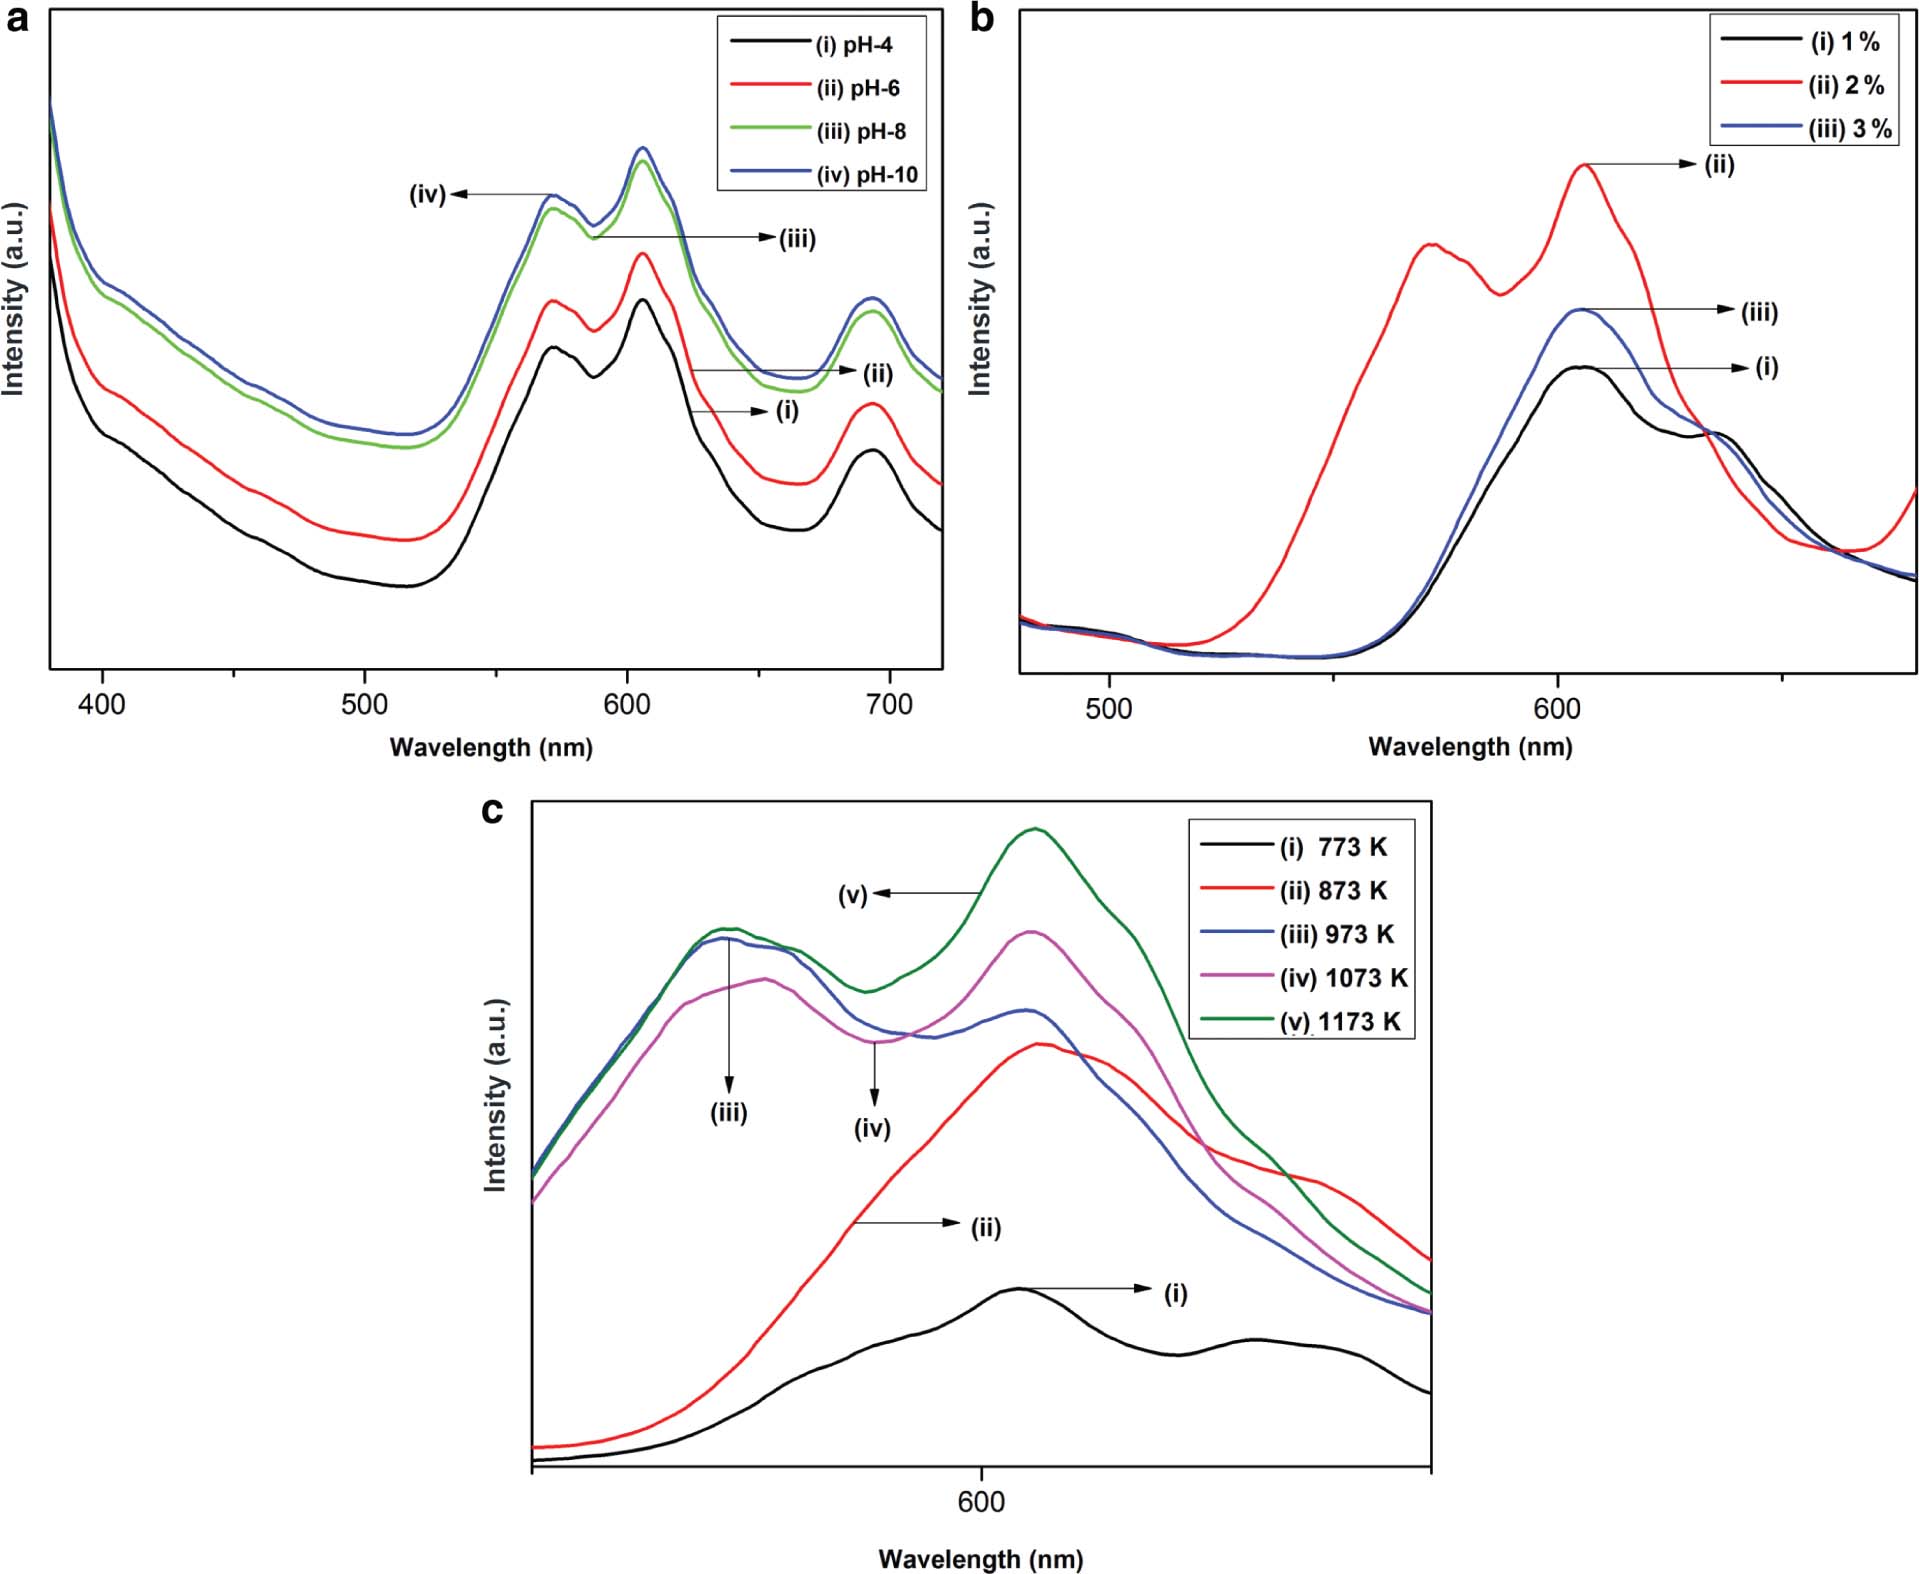
(a) PL emission spectra of 2 wt% Pr3+-doped Y2O3 prepared at different pH values. (b) PL emission spectra of 2 wt% Pr3+-doped Y2O3 prepared at different dopant values. (c) PL emission spectra of 2 wt% Pr3+-doped Y2O3 annealed at different temperatures.
3.2.4 Influence of Doping Concentration on Photoluminescence
Luminescence studies have become one of the growing fields in material science because of industrial demands for new applications [46]. Luminescence phenomenon has been modified after the incorporation of Pr3+ ions into Y2O3 host lattice. This is because a large number of emission centres, which are capable to generate red colour, have been formed. It is understandable that the luminescence process that originates from 4f level transitions is mainly because of magnetic dipole or electric dipole transitions. The strongest emission peak around 605 nm is due to electric dipole transition of 3P0 to 3H6, which is hypersensitive [46].
In order to verify the optimised dopant concentration, a series of Pr3+ concentrations of about 1 %–5 wt% were studied. The dependence of luminescence on the dopant concentration is shown in Figure 8b. When we change the concentration of Pr3+ dopant, the peak intensity changes, but there is no change in the peak position. As indicated in Figure 8b, initially, the luminescence intensity increases with increase in Pr3+ concentration. But then, the intensity of peak reduces when the concentration of Pr3+ exceeds the critical concentration value. In the case of Pr3+-doped Y2O3, the maximum peak intensity was observed when the concentration of dopant is 2 wt%. This trend of luminescence dependence on dopant concentration is found to be in accordance with earlier reported literature. Moreover, concentration of dopant is not the only factor on which the luminescence depends. It also depends on other features such as nature of the host, size of particle, synthesis process, and temperature. This is because the luminescence phenomenon is connected to a cross section, exact position of energy level, dielectric constant, and phonon energy of the host material. There occur a large number of centres that exhibit luminescence in the emitting level. In this case, the luminescence intensity will be higher. When we increase the concentration of Pr3+ dopant, more ions that are excited are transited to a corresponding emitting level (for example, 3P0 for Pr). Therefore, increasing the concentration of Pr3+ ions will increase the intensity of PL up to a critical concentration, of which the luminescence is maximum [40]. Further increase in dopant concentration results in a quenching process [35]. In our study, the quenching of luminescence occurs when the concentration exceeds 2 wt%. The reason for the luminescence quenching may be due to leaching out of Pr3+ when the dopant concentration is high in the reaction. For confirmation, we have done the calculation for cubic cell parameter in the case of all doped samples. From the result, we found lattice constant increases with increase in Pr3+ concentration. This increase can be assigned to the fact that the ionic radius of Pr3+ is slightly higher than Y3+ ions. This result suggests that there appears no leaching out of Pr3+ ions. Obviously, this unusual behaviour of luminescence can be due to some other reasons [35]. As the concentration quenching takes place in between the activators, the excessive incorporation of Pr3+ into Y2O3 results in the reduction of luminescence intensity [47]. The quenching process takes place only at a particular dopant concentration where the average distance between the centres that exhibit emission to support the transfer of energy reduces [48]. At very high Pr3+ concentrations, the interactions between the nearest neighbouring Pr3+ ions result in an output-limiting effect. The studies reveal that the quenching of luminescence can be due to transfer of energy between nearby luminescence centres through cross relaxation [40].
In detail, the distance between the impurity centres reduces with increase in Pr3+ concentration. In such cases, despite light emission, energy transfer takes place from one excited centre to another. The energy may lead to emission of light, but transfer enhances the probability of the occurrence of transition, which is nonradiative in nature [46]. Certain defects create localised levels, which are very deep with high ionisation energies. Electron–lattice interactions are usually strong in these levels. Thus, the nonradiative recombination occurs through these levels [49]. Also, if the size and valence of the activator are not a match with the site in which they are substituted, it will be tedious to incorporate a huge amount of impurity. Thus, the optimal doping levels depend on the nature of both luminescent centre and host matrix [46]. The luminescence quenching due to concentration occurs when the emitting state loses the energy that is excited through cross-relaxation mechanism. This type of relaxation takes place between two similar nearby centres by transfer of energy resonantly. That means, in the case of two adjacent similar centres, transfer of energy occurs resonantly through cross relaxation. In that case, one centre that acts as donor transfers part of the energy that was excited to the nearby centre that acts as an acceptor [48]. The excitation migration increases with increase in concentration. Thus, the surfaces behave as centres for quenching or the energy attains remote killers [49]. This results in transfer of energy to defects that relax to their ground state by infrared or multiphonon emission [48]. Earlier studies reported that when the concentration of dopant is high, there may occur aggregation or pairing of dopant ions in which a small amount of activators act as killers [35], [43].
The luminescence quenching process in our study can be assigned to one or both mechanisms. The excitation energy migrates nonradiatively from one Pr3+ ion to its nearby Pr3+ ion by exchange interaction, which involves several transfer steps and ultimately to quenching site. When the Pr3+ dopant concentration is less than 2 wt%, the adjacent Pr3+ ions are found to be isolated. Only very few Pr3+ ions that have defects will transfer their energy to the nearby traps. Thus, the quenching process does not play an important role. When the concentration of the dopant increases to 2 wt%, the adjacent Pr3+ ions become closer enough to transfer energy that are excited, resonantly. When the concentration of dopant exceeds 2 wt%, the nearby Pr3+ becomes much closer to lose the energy nonradiatively that supports quenching process and reduction in luminescent intensity.
In the luminescence phenomena, the excited photons must possess energy that is less than the bandgap of the host. Thus, electrohole pairs are not produced. The excitation of luminescent centre is done by making use of a wavelength that lies in the absorption band that relaxes nonradiatively to the 3P0 level. Then it radiatively relaxes to the ground state by emitting photons corresponding to specific transitions localized within the Pr3+ itself [48].
3.2.5 Influence of Annealing Temperature on Photoluminescence
The luminescence spectra of Pr3+-doped Y2O3 nanophosphors annealed at various temperatures from 773 to 1173 K are shown in Figure 8c. Here, we have taken the optimum concentration of dopant (2 wt%). This study reveals the dependence of luminescence on annealing temperature. From the graph, it is clear that the as-prepared samples exhibit weak luminescence intensity. Further, this intensity increases with increase in temperature [37]. The increased intensity indicates good crystallinity. It also indicates that the dopant materials are properly incorporated into host matrix. These results are in good agreement with the XRD results [15]. This is because the synthesis of samples at high temperature supplies high energy. This results in good crystallite size and crystallinity. Enhancement of red emission can be done by increasing the oxygen vacancies, as reported by T. Yan et al. These oxygen vacancies normally act as radiative centres in luminescence process [50]. The as-prepared samples exhibit low PL yield, which may be due to high surface-to-volume ratio of nanophosphors. The size increment with temperature results in the decrease of surface-to-volume ratio, which in turn enhances the luminescence intensity. The peak intensity and peak position give information regarding the nature of Pr3+ environment in Y2O3 nanophosphors. 3P0 to 3H6 transition is responsible for the red emission at 605 nm [37]. Other transitions of Pr3+ are also visible but found to be very weak. Moreover, our sample does not exhibit the presence of monoclinic phase. If the sample exhibits monoclinic phase, the maximum emission 3P0 to 3H6 will be at a wavelength of 623 nm. Thus, we confirmed that the combustion method results in the formation of single-phase cubic Pr-doped yttrium nanophosphors [43]. Peak intensity increases with increase in temperature as we discussed earlier. When we make a comparison between the samples in as-prepared condition and annealed at 973 K, quite interestingly, we obtained nearly 2.58 orders of intensity increment in the case of annealed samples. Attainment of good crystallinity may be the reason for this as indicated in XRD studies. Many authors reported the dependence of luminescence on particle size. In our case, we observed that the particle size increase with increasing temperature. X-ray diffraction studies also revealed the enhancement of crystallinity with temperature. Thus, we can confirm that increment of peak intensity with increase in temperature can be assigned to enhanced crystallinity of yttrium nanophosphors [35]. Even though the particle size varies with temperature, the peak position remains unchanged [16].
There is a direct dependence of luminescence on morphology of Pr3+-doped Y2O3 nanophosphors. It is clear that when we compare nanospheres and nanorods, intensity emission is more for nanospheres. This confirms that spherical-shaped samples exhibit good luminescence phenomena. This is because this particular spherical shape reduces the light-scattering effect and nonradiation. The Pr3+-doped Y2O3 nanophosphors that we obtained have spherical shape without agglomeration. This can be applied in various fields such as field emitters, laser materials, and optoelectronic devices [50].
3.2.6 Influence of Co-doping on Photoluminescence
The incorporation of gadolinium oxide into the Pr3+-doped Y2O3 nanophosphors results in the enhancement of luminescence. By keeping the value of Pr3+ as constant (2 wt%), we added different concentrations of Gd3+ and finally obtained 1 wt% of Gd3+ as the optimised co-doped value. Figure 9a shows the comparison graph of doped and co-doped samples. Gd3+ incorporation does not make any change in the position of the peak that corresponds to 3P0 to 3H6 transition, but it enhances the intensity peak, which indicates that Gd3+ sensitises the red emission perfectly through transferring the energy from Gd3+ to Pr3+ [29]. Intensity of 605-nm emission increases with Gd3+ addition linearly. The intensity of Y:Gd:Pr sample is 2.705 times that of the Y2O3:Pr sample. Addition of Gd3+ results in covalency increment. By considering the bond structure of Pr3+- O2−-Y3+/Gd3+, we found that electronegativity values of Y3+ and Gd3+ are 1.22 and 1.20, respectively. The electron–ion attraction takes place in the form Y3+ > Gd3+. Thus, in the same way, the energy that is required for electron transfer from O2− to Pr3+ increases. The replacement of Y3+ with Gd3+ makes transfer of charge easier, which in turn leads to luminescence enhancement. Energy transfer diagram is given in Figure 9b.
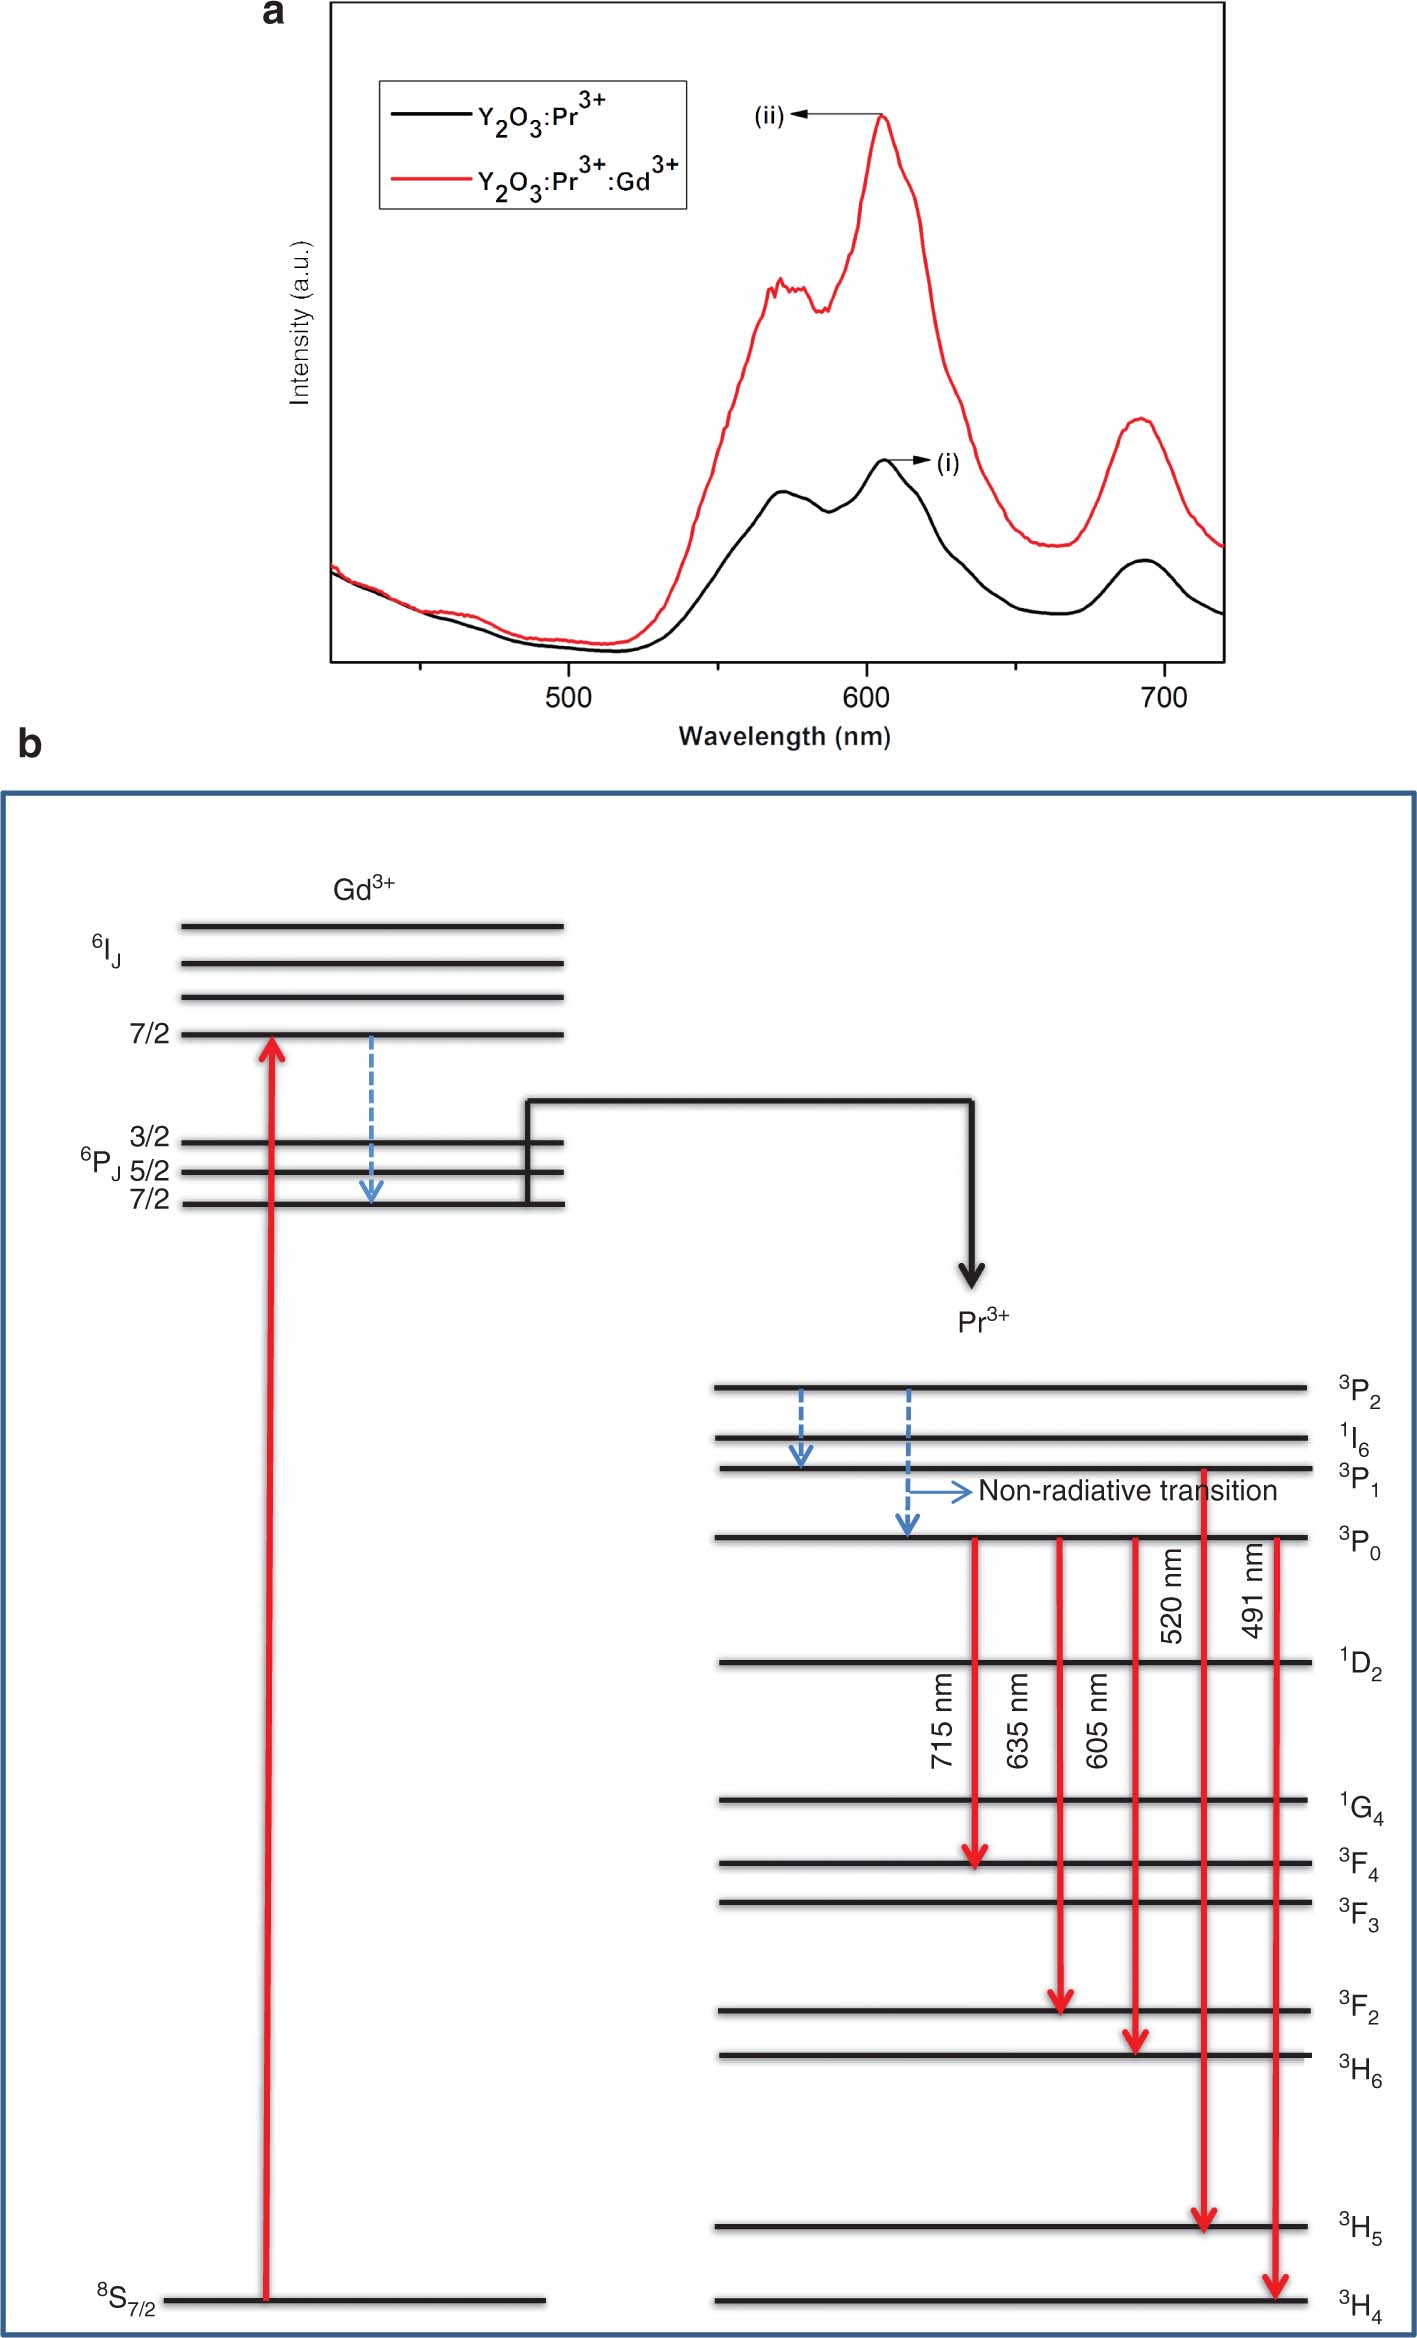
(a) Comparison of PL spectra of doped and co-doped samples. (b) Energy transfer diagram.
4 Conclusions
The XRD studies confirm that the incorporation of Pr3+ and Gd3+ ions does not make any change in the structure of the Y2O3. It has been found that when the annealing temperature increases, the particle size and crystallinity of the nanophosphors increase. The FTIR studies indicate that the presence of hydroxyl group (OHOH) and CO2 group in as-prepared samples vanishes when the temperature increases, which in turn results in the enhancement of luminescence properties. Eg values have been calculated from DRSs. For doped samples, Eg values vary from 4.63 to 5.00 eV, and for co-doped samples, it varies from 3.99 to 4.42 eV. This bandgap difference can be because of size difference. Analysis of PL emission has been done, and the emission peak was at 605 nm, which was due to 3P0-to-3H6 transition. The results show that when the concentration of dopant increases the luminescence intensity also increases up to optimised value. Moreover, the optimum concentration was obtained at 2 wt% Pr3+. The luminescence intensity has been enhanced after the addition of Gd3+ as co-dopant. The [Y:Pr:Gd] exhibits luminescence intensity of 2.705 times more than that of Y:Pr nanophosphors.
References
[1] A. Towata, M. Sivakumar, K. Yasui, T. Tuziuti, T. Kozuka, et al., J. Mater. Sci. 43, 1214 (2008).10.1007/s10853-007-2287-1Search in Google Scholar
[2] T.-Y. Hwang, Y. Choi, Y. Song, N. S. A. Eom, S. Kim, et al., J. Mater. Chem. C 6, 972 (2018).10.1039/C7TC03576DSearch in Google Scholar
[3] X. Huang, Nat. Photonics 8, 748 (2014).10.1038/nphoton.2014.221Search in Google Scholar
[4] X. Huang, Sci. Bull. 64, 879 (2019).10.1016/j.scib.2019.06.003Search in Google Scholar
[5] J. Liang, P. Du, H. Guo, L. Sun, B. Li, et al., Dyes Pigments 157, 40 (2018).10.1016/j.dyepig.2018.04.039Search in Google Scholar
[6] X. Huang, S. Wang, B. Li, Q. Sun, and H. Guo, Opt. Lett. 43, 1307 (2018).10.1364/OL.43.001307Search in Google Scholar PubMed
[7] X. Li, Z. Yang, L. Guan, Q. Guo, C. Liu, et al., J. Alloys Compd. 464, 565 (2008).10.1016/j.jallcom.2007.10.069Search in Google Scholar
[8] N. Vu, T. Kim Anh, G.-C. Yi, and W. Strek, J. Lumin. 122, 776 (2007).10.1016/j.jlumin.2006.01.286Search in Google Scholar
[9] S. Zhou, Z. Fu, J. Zhang, and S. Zhang, J. Lumin. 118, 179 (2006).10.1016/j.jlumin.2005.08.011Search in Google Scholar
[10] N. Mohamed, J. Hassan, K. A. Matori, R. S. Azis, Z. A. Wahab, et al., Results Phys. 7, 1202 (2017).10.1016/j.rinp.2017.03.018Search in Google Scholar
[11] M. Okumura, M. Tamatani, A. K. Albessard, and N. Matsuda, Jpn. J. Appl. Phys. 36, 6411 (1997).10.1143/JJAP.36.6411Search in Google Scholar
[12] B. K. Gupta, D. Haranath, S. Saini, V. N. Singh, and V. Shanker, Nanotechnology 21, 055607 (2010).10.1088/0957-4484/21/5/055607Search in Google Scholar
[13] J. Hao, S. A. Studenikin, and M. Cocivera, J. Lumin. 93, 313 (2001).10.1016/S0022-2313(01)00207-1Search in Google Scholar
[14] K. M. Nissamudeen and K. G. Gopchandran, J. Optoelectron. Adv. M. 10, 2719 (2008).Search in Google Scholar
[15] S. Som, S. K. Sharma, and T. Shripathi, J. Fluoresc. 23, 439 (2013).10.1007/s10895-013-1160-7Search in Google Scholar PubMed
[16] L. Robindro Singh, R. S. Ningthoujam, V. Sudarsan, I. Srivastava, S. Dorendrajit Singh, et al., Nanotechnology 19, 055201 (2008).10.1088/0957-4484/19/05/055201Search in Google Scholar PubMed
[17] R. Srinivasan, R. Yogamalar, A. Vinu, K. Ariga, and A. C. Bose, J. Nanosci. Nanotechnol. 9, 6747 (2009).10.1166/jnn.2009.1467Search in Google Scholar PubMed
[18] J. R. Jayaramaiah, K. R. Nagabhushana, and B. N. Lakshminarasappa, J. Anal. Appl. Pyrolysis 123, 229 (2017).10.1016/j.jaap.2016.11.023Search in Google Scholar
[19] S. P. Peddi, H. Mathlouthi, B. A. Sadeh, and Y. M. Abdelhaye, AUSEJ 4, 1 (2017).10.12816/0052380Search in Google Scholar
[20] K. M. Nissamudeen, R. G. A. Kumar, V. Ganesan, and K. G. Gopchandran, J. Alloys Compd. 484, 377 (2009).10.1016/j.jallcom.2009.04.136Search in Google Scholar
[21] T. Sh. Atabaev, H. H. Thi Vu, H.-K. Kim, and Y.-H. Hwang, J. Alloys Compd. 525, 8 (2012).10.1016/j.jallcom.2012.01.148Search in Google Scholar
[22] P. Packiyaraj and P. Thangadurai, J. Lumin. 145, 997 (2014).10.1016/j.jlumin.2013.07.074Search in Google Scholar
[23] D. Y. Medina Velazquez, L. A. Hernández Soto, Á. de J. Morales Ramirez, S. Carmona-Téllez, E. Garfias-Garcia, et al., Ceram. Int. 41, 8481 (2015).10.1016/j.ceramint.2015.03.054Search in Google Scholar
[24] A. Boukerika and L. Guerbous, J. Lumin. 145, 148 (2014).10.1016/j.jlumin.2013.07.037Search in Google Scholar
[25] F. Voicu, C. Gheorghe, and C. Florica, Ann. West Univ. Timisoara Phys. 56, 76 (2012).10.1515/awutp-2015-0011Search in Google Scholar
[26] R. Priya and O. P. Pandey, J. Lumin. 212, 342 (2019).10.1016/j.jlumin.2019.04.043Search in Google Scholar
[27] J. Li, Y. Wang, and B. Liu, J. Lumin. 130, 981 (2010).10.1016/j.jlumin.2010.01.009Search in Google Scholar
[28] T. Verma and S. Agrawal, J. Mater. Sci. Mater. El. 29, 13397 (2018).10.1007/s10854-018-9465-6Search in Google Scholar
[29] J.-G. Li, X. Li, X. Sun, and T. Ishigaki, J. Phys. Chem. C 112, 11707 (2008).10.1021/jp802383aSearch in Google Scholar
[30] J. R. Jayaramaiah, B. N. Lakshminarasappa, and K. R. Nagabhushana, J. Lumin. 157, 63 (2015).10.1016/j.jlumin.2014.08.003Search in Google Scholar
[31] V. Dubey, S. Agrawal, and J. Kaur, Indian J. Mater. Sci. 2014, 1 (2014).10.1155/2014/367378Search in Google Scholar
[32] S. Ćulubrk, V. Lojpur, Ž. Antić, and M. D. Dramićanin, J. Res. Phys. 37, 39 (2013).10.2478/jrp-2013-0004Search in Google Scholar
[33] C. A. Kodaira, R. Stefani, A. S. Maia, M. C. F. C. Felinto, and H. F. Brito, J. Lumin. 127, 616 (2007).10.1016/j.jlumin.2007.03.016Search in Google Scholar
[34] M. K. Devaraju, S. Yin, and T. Sato, J. Nanosci. Nanotechnol. 10, 731 (2010).10.1166/jnn.2010.1814Search in Google Scholar
[35] G. Siddaramana Gowd, M. K. Patra, S. Songara, A. Shukla, M. Mathew, et al., J. Lumin. 132, 2023 (2012).10.1016/j.jlumin.2012.03.004Search in Google Scholar
[36] J. Zhang, Z. Zhang, Z. Tang, Y. Lin, and Z. Zheng, J. Mater. Process. Technol. 121, 265 (2002).10.1016/S0924-0136(01)01263-8Search in Google Scholar
[37] R. Hari Krishna, B. M. Nagabhushana, H. Nagabhushana, N. Suriya Murthy, S. C. Sharma, et al., J. Phys. Chem. C 117, 1915 (2013).10.1021/jp309684bSearch in Google Scholar
[38] R. Priya and O. P. Pandey, Vacuum 156, 283 (2018).10.1016/j.vacuum.2018.07.038Search in Google Scholar
[39] R. A. Mir, P. Sharma, and O. P. Pandey, Sci. Rep. 7, 3518 (2017).10.1038/s41598-017-03197-8Search in Google Scholar PubMed PubMed Central
[40] H. Huang, H. Zhang, W. Zhang, S. Lian, Z. Kang, et al., J. Lumin. 132, 2155 (2012).10.1016/j.jlumin.2012.03.060Search in Google Scholar
[41] Y. D. Jiang, Z. L. Wang, F. Zhang, H. G. Paris, and C. J. Summers, J. Mater. Res. 13, 2950 (1998).10.1557/JMR.1998.0403Search in Google Scholar
[42] X. Jing, J. Electrochem. Soc. 146, 4654 (1999).10.1149/1.1392689Search in Google Scholar
[43] A. Gupta, N. Brahme, and D. Prasad Bisen, J. Lumin. 155, 112 (2014).10.1016/j.jlumin.2014.06.003Search in Google Scholar
[44] C. He, Y. Guan, L. Yao, W. Cai, X. Li, et al., Mater. Res. Bull. 38, 973 (2003).10.1016/S0025-5408(03)00089-8Search in Google Scholar
[45] Y.-P. Fu, J. Mater. Sci. 42, 5165 (2007).10.1007/s10853-006-1289-8Search in Google Scholar
[46] M. Nazarov and D. Noh, New Generation of Europium- and Terbium-Activated Phosphors: From Syntheses to Applications, Pan Stanford Pub, USA 2011.10.1201/b11172Search in Google Scholar
[47] G. Y. Hong, B. S. Jeon, Y. K. Yoo, and J. S. Yoo, J. Electrochem. Soc. 148, H161 (2001).10.1149/1.1406496Search in Google Scholar
[48] G. H. Mhlongo, M. S. Dhlamini, H. C. Swart, O. M. Ntwaeaborwa, and K. T. Hillie, Opt. Mater. 33, 1495 (2011).10.1016/j.optmat.2011.03.009Search in Google Scholar
[49] W. M. Yen, S. Shionoya, and H. Yamamoto, Practical Applications of Phosphors, Taylor and Francis Group, Abington, Oxford, United Kingdom 2007.10.1201/9781420043709Search in Google Scholar
[50] T. Yan, D. Zhang, L. Shi, H. Yang, H. Mai, et al., Mater. Chem. Phys. 117, 234 (2009).10.1016/j.matchemphys.2009.05.047Search in Google Scholar
© 2020 Walter de Gruyter GmbH, Berlin/Boston
Articles in the same Issue
- Frontmatter
- Atomic, Molecular & Chemical Physics
- The Reaction and Microscopic Electron Properties from Dynamic Evolutions of Condensed-Phase RDX Under Shock Loading
- Trace Hydrogen Sulphide Gas Sensor Based on Cu/rGO Membrane-Coated Photonic Crystal Fibre Michelson Interferometer
- Dynamical Systems & Nonlinear Phenomena
- A General Viscous Model for Some Aspects of Tropical Cyclonic Winds
- Nonlinear Pull-in Instability of Rectangular Nanoplates Based on the Positive and Negative Second-Order Strain Gradient Theories with Various Edge Supports
- Hydrodynamics
- On the Heat Flow Through a Porous Tube Filled with Incompressible Viscous Fluid
- Effect of Magnetic Field on the Unsteady Boundary Layer Flows Induced by an Impulsive Motion of a Plane Surface
- Solid State Physics & Materials Science
- Facile Combustion Synthesis of (Y,Pr)2O3 Red Phosphor: Study of Luminescence Dependence on Dopant Concentration and Enhancement by the Effect of Co-dopant
- Size-Dependent Ultrasonic and Thermophysical Properties of Indium Phosphide Nanowires