
When Public Information Backfires: Heterogeneous Groups (Un)coordinate on a Fairness Norm
-
Katharina Luckner
 ,
Amalia Álvarez-Benjumea
,
Lars Freund
,
Amalia Álvarez-Benjumea
,
Lars Freund

Abstract
Experiments on social norm interventions suggest that public dissemination of normative information, which creates common knowledge on a social norm, increases conformity to the social norm more effectively than privately disseminated information, regardless of other factors affecting norm conformity, such as group identity and heterogeneous endowments. We present an experimental test of the effect that the channel of dissemination – public versus private – has on norm conformity at different levels of group identity in a public-goods setting with heterogeneously endowed actors. Participants receive a normative message about the behavior that participants of a previous experiment identified as the “fairest.” We vary between strong and weak group identity, and public and private information, and record participants’ compliance with the norm. Our results suggest that the effect of public normative information depends on the salience of group identity and the initial endowment of individuals. At best, it has no effect on norm conformity. However, in the heterogeneous setting, it reduces norm conformity among those with lower initial endowments. This poses challenges for eliciting a behavioral change using normative information since providing public information may backfire.
Funding source: Max-Planck-Gesellschaft
Award Identifier / Grant number: Max Planck Research Group “Mechanisms of Normative Change”
-
Conflict of interest: None.
-
Research funding: This work was funded by Max-Planck-Gesellschaft, Max Planck Research Group “Mechanisms of Normative Change”.
-
Data availability: Experimental data and code for statistical analysis is available here: https://doi.org/10.17605/OSF.IO/JZ6WP
-
Code availability: See above.
Appendix A: Theory
A.1 The Environment
We choose a classical environment for the experimental investigation of cooperation: the public-goods game (PGG).[14] The one-shot PGG
We now introduce identity theory, as proposed by Akerlof and Kranton (2000), into our model by expanding the monetary payoff by identity preferences of the players. A player’s utility no longer depends on monetary concerns alone; they also derive utility from behaving according to certain norms that are perceived to be prevalent in their group. For simplicity in our analysis, we restrict identity utility to be based on a match between one’s own behavior (action chosen) and the other players’ behavior. A player’s utility function u i (a, c−i) thus consists of the monetary payoff π i (a) and the identity utility I i (a, c−i). We assume that these utilities are additive, where the latter is weighted by γ ≥ 0. The correspondence c−i: A i → A−i is player i’s normative expectations, i.e., applied fairness norm, towards other players given action a i .
We consider two potential fairness norms: equal relative contribution (for all j ∈ N\{i}:
Before entering the PGG, each player receives a correlated signal δ
i
∈ Δ
i
which recommends an action by stressing one of the fairness norms, i.e., f: Δ → A with Δ = ∏i∈NΔ
i
. The set of all possible signal combinations is denoted by F = F
i
× F−i. The signal transforms the PGG into the sequential game
We use the correlated equilibrium concept by Aumann (1974, 1987) to analyze
Definition 1.
A correlated equilibrium in
for each player i ∈ N and every g i : Δ → A i that has the same support as f i .
In other words, the equilibrium concept demands that every player prefers to follow the signal over deviating from it, given that all other players also follow their respective signal.
| Parameter/variable | Explanation |
|---|---|
| a i | Action vector |
| A | Set of all possible action vectors |
| θ i | Initial endowment, may take values θ L or θ H with θ L < θ H |
| c i | Normatively expected action |
| q i (a−i) | Belief that a−i will be played |
| δ i | Correlated signal |
| π i (a) | Monetary utility |
| I i (a, c−i) | Identity utility |
| γ | Weight factors assigned to identity utility, γ ≥ 0 |
A.2 Analysis
For the theoretical analysis, we focus on the existence of a full-contribution correlated equilibrium, i.e., the correlated signal recommends that everyone contribute an equal percentage of their endowment, in this case 100 %. The equilibrium hypothesis assumes that all players but i follow their signals, so that their respective signals are equivalent to the action played (f−i = a−i). A second necessity for the existence of the equilibrium is that indeed each player i ∈ N receives the signal to contribute the full endowment to the public good. For an arbitrary player i, we can then focus on the behavior after the full-contribution signal f i = θ i has been received.
In the analysis, we first introduce public knowledge on signals. In a second step, we add identity preferences to the utility function. Finally, we investigate interactive effects of identity preferences and signal announcement.
A.2.1 The Effect of Privately and Publicly Announced Signals
As a benchmark for our analysis, we first assume that each player receives a private signal and has no common identity with the group, i.e., γ = 0. In that case, the expected utility reflects only preferences over monetary outcomes is given by
As the unique equilibrium in the public-goods game with preferences over monetary payoffs is in dominant strategies, beliefs over other players’ actions do not affect behavior. Therefore, whether or not player i knows the content of other players’ signals does not influence the optimal strategy plan g i . The best response in either scenario is therefore a contribution of zero to the public good. It is impossible to implement the full-contribution correlated equilibrium by a pure change of signal structures. We summarize that
Hypothesis 1.
With preferences over monetary payoffs only (γ = 0), there is no difference in the likelihood of the existence of a full-contribution correlated equilibrium between privately and publicly announced signals.
This hypothesis reflects the expectation that the collective action problem holds. Without mitigating circumstances such as group identity or public information, players will free-ride and not contribute to the public good.
A.2.2 The Effect of Group Identity with Privately Announced Signals
Next, we modify the weight of identity utility, setting it strictly positively (γ > 0), i.e., players have a common group identity of at least some strength. This modification expands the expected utility of player i
Again, we assume an arbitrary probability mass function over signals received by other players. Assuming γ > 0, however, means that the probability mass function affects the best response under two conditions.
First, it is necessary that player i believes that at least one of the other players received a signal f j ≠ 0, because only then is a i = 0 not necessarily a dominant strategy anymore. If that is not the case, contributing nothing remains the unique best response, because in comparison to all other strategies, contributing zero increases (1) the monetary payoff and (2) the identity utility under both potential normative expectations, the fairness norms specified above.
Secondly, it is a necessary condition for the existence of a full contribution-correlated equilibrium that each player believes that full contribution leads to the largest expected identity utility. Consider the case where at least one arbitrary player’s probability mass function is such that there exists a strategy that leads to an identity utility at least as high as the one under full contribution. As before, the deviation from the strategy to follow the signal to this strategy is preferred in (1) monetary and (2) identity terms. In that case, following the full-contribution signal would not be a best response.
For the rest of the analysis we therefore assume that player i receives the strictly largest expected identity utility from the strategy to follow the signal. We continue with the effect of increasing the weighting parameter γ on the existence of the full-contribution correlated equilibrium.[16] With expected identity utility being highest for full contribution and expected monetary utility lowest in that case, this shifting of expected utility from one source to another increases the likelihood that full contribution becomes the unique best response.
Hypothesis 2.
An increase in γ increases the likelihood of the existence of a full-contribution correlated equilibrium.[17]
The intuition for this hypothesis says that there is a trade-off between monetary and identity utility. In order to ensure the existence of the full-contribution correlated equilibrium, preferences for identity need to outweigh those for money. This also means that, independent of contributions from other players, for every additional contribution to the public good player i looses (1 − α) in monetary terms. If there is more endowment at player i’s disposal this monetary loss due to full contribution increases. Hence, for a constant identity utility of full contribution, the full-contribution strategy is less likely to be played by players with higher endowments. We summarize that
Hypothesis 3.
Given the same γ and the same I(a i , a−i, c−i), an increase in θ i decreases the likelihood of the existence of a full-contribution correlated equilibrium.
This reflects the heterogeneity of society, where some people have more to lose from following a new norm. In the public-goods game, this is given by the fact that, under the full-contribution norm, players with higher endowments are individually worse off under the socially optimum, while players with lower endowments are individually better off under the socially optimal conditions.
A.2.3 The Effect of Public Signals with Group Identity
Finally, we investigate the effect of certainty over other players’ signals in comparison to uncertainty within a framework of common group identity, i.e., we look at the effect of public information given an established group identity. Since our main interest is in the implementation of full contribution, we again limit the analysis to a signal of full contribution. Intuitively, establishing certainty over signals increases the loss of identity utility if player i deviates from following the signal. We assume the identity utility weighting to be fixed. Given the equilibrium hypothesis, player i knows that all other players in equilibrium contribute their full endowment, and a deviation leads to a mismatch between normatively expected and actual behavior. Uncertainty over other players’ signals decreases the certainty of such a mismatch.
Hypothesis 4.
Certainty over other players’ full contribution increases the likelihood of the existence of a full-contribution correlated equilibrium in comparison to uncertainty over signals.
Appendix B: Experimental Procedure
B.1 Instructions
B.1.1 Teil 1 des Experiments
In diesem Teil des Experiments können Sie Taler für sich und für andere Teilnehmer verdienen. Sie bilden eine Gruppe mit drei weiteren Teilnehmern in dem Experiment. Das sind die gleichen Teilnehmer, mit denen Sie das Puzzle gelöst haben.[18] Ihre Anfangsausstattung (in Talern) in diesem Teil beträgt entweder 10 Taler oder 20 Taler. Die Zuteilung ist zufällig. In jeder Gruppe besitzen zwei Mitglieder eine Anfangsausstattung von 10 Talern und zwei Mitglieder eine von 20 Talern. Ihre Anfangsausstattung erfahren Sie auf dem Bildschirm. Von Ihrer Anfangsausstattung können Sie Taler in ein gemeinsames Konto einzahlen. Die restlichen Taler behalten Sie. Die Einzahlung aller Teilnehmer in das gemeinsame Konto wird am Ende um 20 % erhöht und gleichmäßig auf alle vier Gruppenmitglieder aufgeteilt. Das heißt, jedes Gruppenmitglied erhält 30 % aller Einzahlung (120 % für 4 Gruppenmitglieder entspricht 30 % für 1 Gruppenmitglied). Die Auszahlung jedes Gruppenmitgliedes hängt daher von der eigenen Anfangsausstattung, der eigenen Einzahlung sowie der Einzahlung aller anderen Gruppenmitglieder ab. Die folgende Formel veranschaulicht diesen Zusammenhang:
Ein paar Beispiele zur Veranschaulichung der Auszahlung, je für die Anfangsausstattung von entweder 10 oder 20 Talern.
Beispiel 1:
Keines der Gruppenmitglieder zahlt in das gemeinsame Konto ein:
Auszahlung = 10 – 0 + 0.3 × 0 = 10 Taler
Auszahlung = 20 – 0 + 0.3 × 0 = 20 Taler
Beispiel 2:
Alle Gruppenmitglieder zahlen 10 Taler in das gemeinsame Konto ein:
Auszahlung = 10 – 10 + 0.3 × 40 = 12 Taler
Auszahlung = 20 – 10 + 0.3 × 40 = 22 Taler
Beispiel 3:
Alle Gruppenmitglieder zahlen ihre gesamte Anfangsausstattung in das gemeinsame Konto ein:
Auszahlung = 10 – 10 + 0.3 × 60 = 18 Taler
Auszahlung = 20 – 20 + 0.3 × 60 = 18 Taler
Jeder Teilnehmer erhält zusätzlich noch eine Empfehlung. Diese befindet sich auf Ihren Instruktionen.[19]
B.1.2 Empfehlung
Wir haben Teilnehmer in einem Experiment gefragt, welches Verhalten Sie am fairsten in dieser Situation empfinden. Die am meisten gewählte Antwort auf die Frage war, dass es am fairsten ist, wenn alle Gruppenmitglieder Ihre gesamte Ausstattung in das gemeinsame Konto einzahlen.
B.1.3 Instructions – Translation
In this part of the experiment you can earn points for yourself and other participants. These are the same participants with whom you completed the puzzle.[20] Your initial endowment is either 10 or 20 points. The endowment is randomly assigned. Each group has two members with 10 points and two members with 20 points. You can see your endowment on your screen.
Your endowment is 20 (10) points.
In the following you and the other people can contribute to a common pool. The amount that you have contributed to the common pool will be added to the amounts that the other three participants have contributed to the common pool. The total amount of all people in the common pool will be multiplied by a factor of 1.2 and split among the group members. That means that each member of the group receives 30 % of the common pool (120 % for 4 group members means 30 % per member). The final payoff therefore depends on the initial endowment, one’s own contribution, and the contributions of all other group members. The following examples show this:
To illustrate further what you have to do, please consider the following example scenarios:
“Scenario 1”
If no player contributes anything from their endowment:
Payoff = 10 − 0 + 0.3 ⋅ 0 = 10
Payoff = 20 − 0 + 0.3 ⋅ 0 = 20
“Scenario 2”
If you and all other participants contribute an equal amount of 10 points from their endowment:
Payoff = 10 − 10 + 0.3 ⋅ 40 = 12
Payoff = 20 − 10 + 0.3 ⋅ 40 = 22
“Scenario 3”
If all players contribute in proportion to their endowment 10 points or 20 points, you and all other participants will receive 24 points:
Payoff = 10 − 10 + 0.3 ⋅ 60 = 18
Payoff = 20 − 20 + 0.3 ⋅ 60 = 18
Each participant also receives a recommendation. You find the recommendation on your instructions.[21]
B.1.4 Recommendation
In a past experiment, we asked participants what they thought was the fairest contribution scenario. Most of them responded that they found that an equal payoff scenario, where everyone receives the same final payoff, is the fairest.
Please decide how much of your endowment you want to keep, and how much you want to contribute to the common pool.
B.2 The Puzzle
In order to increase participants’ time spent in their respective group and thus foster group identity, we altered the puzzle treatment of Eckel and Grossman (2005). To the physical puzzle that the group members have to assemble, we added a decoding task. For each group there is one puzzle containing instructions, one with a symbol-to-letter conversion table, and two with symbols (all in the respective group color). Participants assemble the puzzles, decode the words, put them together to form the composite German word FEUERWERK, and enter this word once they are back at their respective work stations. The puzzles are shown in Figure 3.
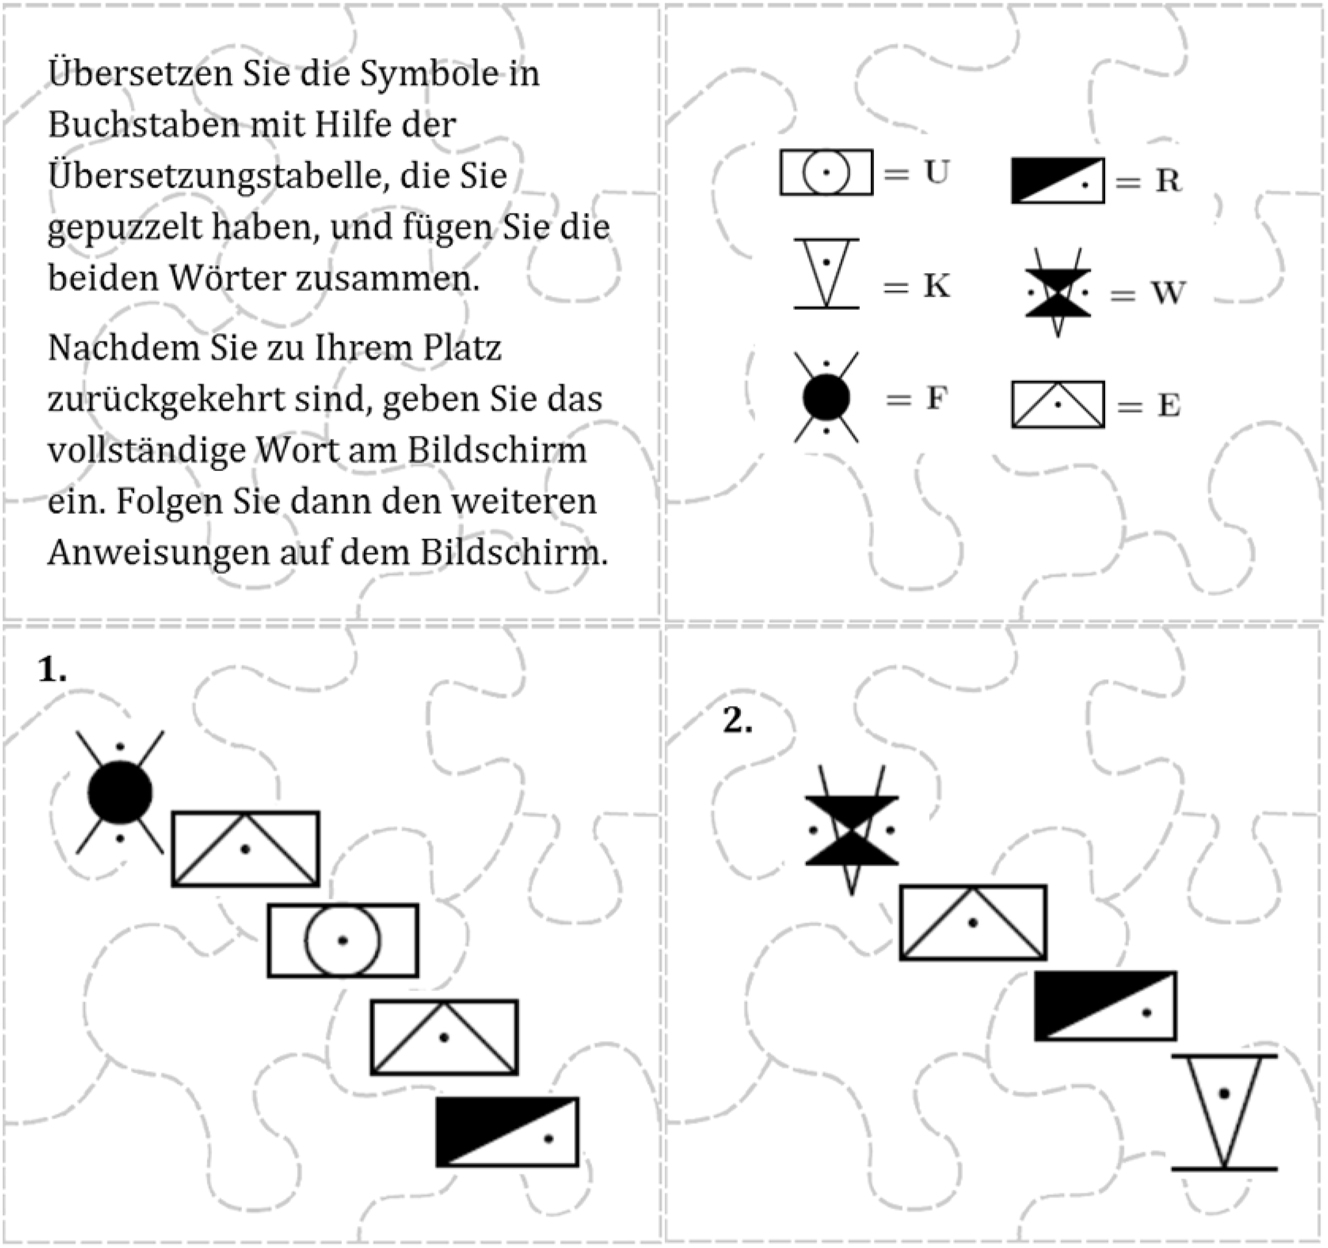
Puzzles for the group identity formation task.
B.3 Belief Elicitation
We asked participants the following questions to gauge their beliefs about other participants’ contribution behavior and also in order to check the effectiveness of private and public information. In the case of public information, the answers to 1) and 2) should be the same. When there is only private information, the answers to 1) and 2) may differ depending on how sure the participant is that their recommendation is the same as everyone else’s.
Question 1: Please indicate what you believe is the probability with which all your group members contributed their entire endowment.
“Frage 1: Bitte geben Sie an, mit welcher Wahrscheinlichkeit (0 bis 100) Sie glauben, dass alle anderen Gruppenmitglieder ihre gesamte Anfangsausstattung beigetragen haben.”
Question 2: Please indicate what you believe is the probability with which all your group members followed their recommendation.
“Frage 2: Bitte geben Sie an mit welcher Wahrscheinlichkeit (0 bis 100) Sie glauben, dass alle anderen Gruppenmitglieder ihrer Empfehlung gefolgt sind.”
Question 3: Please indicate what you believe is the probability with which all your group members with an initial endowment of 10 contributed their entire endowment.
“Frage 3: Bitte geben Sie an, mit welcher Wahrscheinlichkeit (0 bis 100) Sie glauben, dass alle anderen Gruppenmitglieder mit einer Anfangsausstattung von 10 ihre gesamte Anfangsaussattung beigetragen haben.”
Question 4: Please indicate what you believe is the probability with which all your group members with an initial endowment of 20 contributed their entire endowment.
“Frage 4: Bitte geben Sie an, mit welcher Wahrscheinlichkeit (0 bis 100) Sie glauben, dass alle anderen Gruppenmitglieder mit einer Anfangsausstattung von 20 ihre gesamte Anfangsausstattung beigetragen haben.”
B.4 NS-5 Scale
Participants are asked to distribute a total budget of 100 points between themselves and a second person with whom they have not interacted with before. This version of the dictator game is meant to gauge the fairness of the participant’s behavior and their moral convictions. At random, either the participant’s own answers to the questions or their partner’s answers are chosen and paid out with a conversion rate of 1:100.
Question 1: Out of 100 – what do you believe is the morally right amount to give to the other person?
“Frage 1: Ich halte es für moralisch geboten, dass von der 100 Punkten der folgende Betrag an die andere Person abgegeben wird.”
Question 2: What do you think did your partner answer in Question 1?
“Frage 2: was hat die andere Person auf Frage 1 geantwortet?”
Question 3: I give the following amount to the other person:
“Frage 3: Ich gebe den folgenden Betrag an die andere Person:”
Question 4: What was the other person’s answer to Question 3?
“Frage 4: Was hat die andere Person auf Frage 3 geantwortet?”
Question 5: How did the other person answer Question 4?
“Was hat die andere Person auf Frage 4 geantwortet?”
Questions are repeated on the screen, so that the participant need not be able to remember the first question when answering the second, etc. However, answers are recorded in sequence and cannot be altered after they have been given.
B.5 SVO Measure
Social Value Orientation (SVO), i.e., the magnitude of concern that participants have for others, is measured according to the method developed in Murphy et al. (2011). The participant becomes a decision-maker in an allocation situation, deciding which payoffs they would like to see realized between themselves and another randomly chosen participant. We thus obtain the complete ranking of participants’ social preferences in order to understand their decision-making behavior during the public-goods game more fully.
Figure 4 shows the six primary SVO sliders as seen by the participants. Each slider gives participants the choice of different allocations between them and the other participant and asks them to repeat the chosen allocation in the end. Each slider measures a different social preference. Figure 5 shows the underlying SVO Ring measure. Each slider in Figure 4 represents the allocation choice that a participant can make on each of the blue lines in the SVO Ring measure, showing their social preferences in terms of competitiveness, altruism, prosociality and individualism.
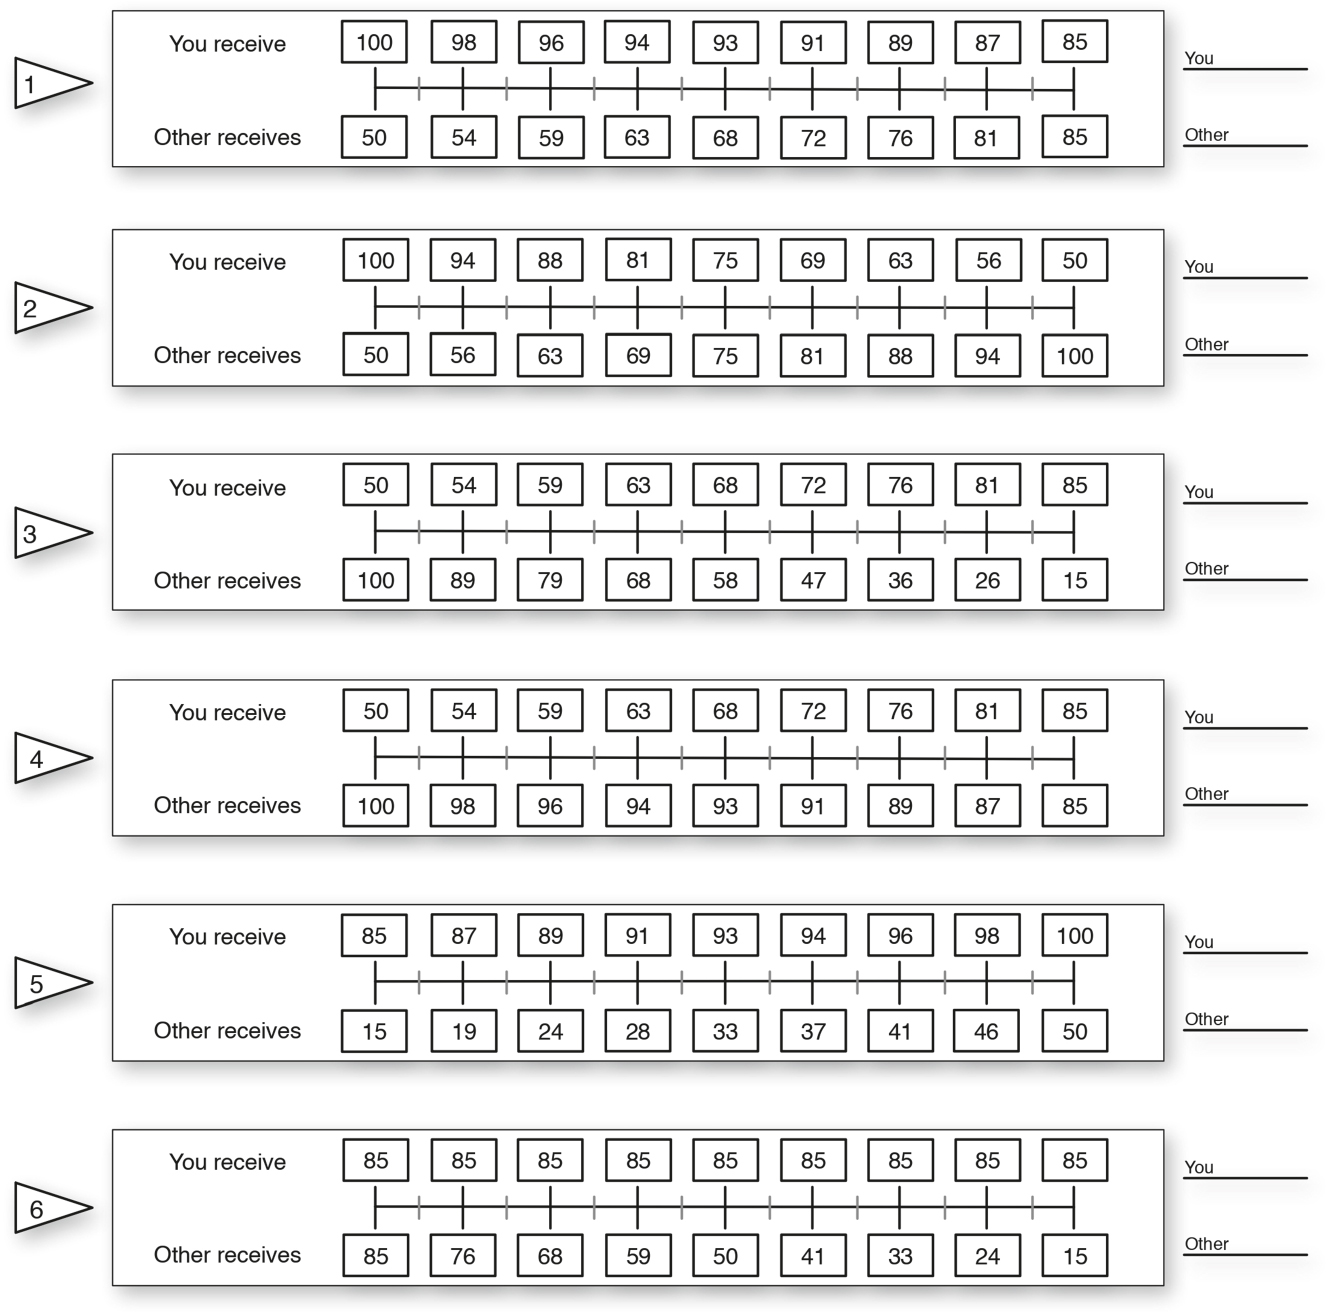
SVO measurement sliders as seen by the participants (Murphy et al. 2011, p.772).
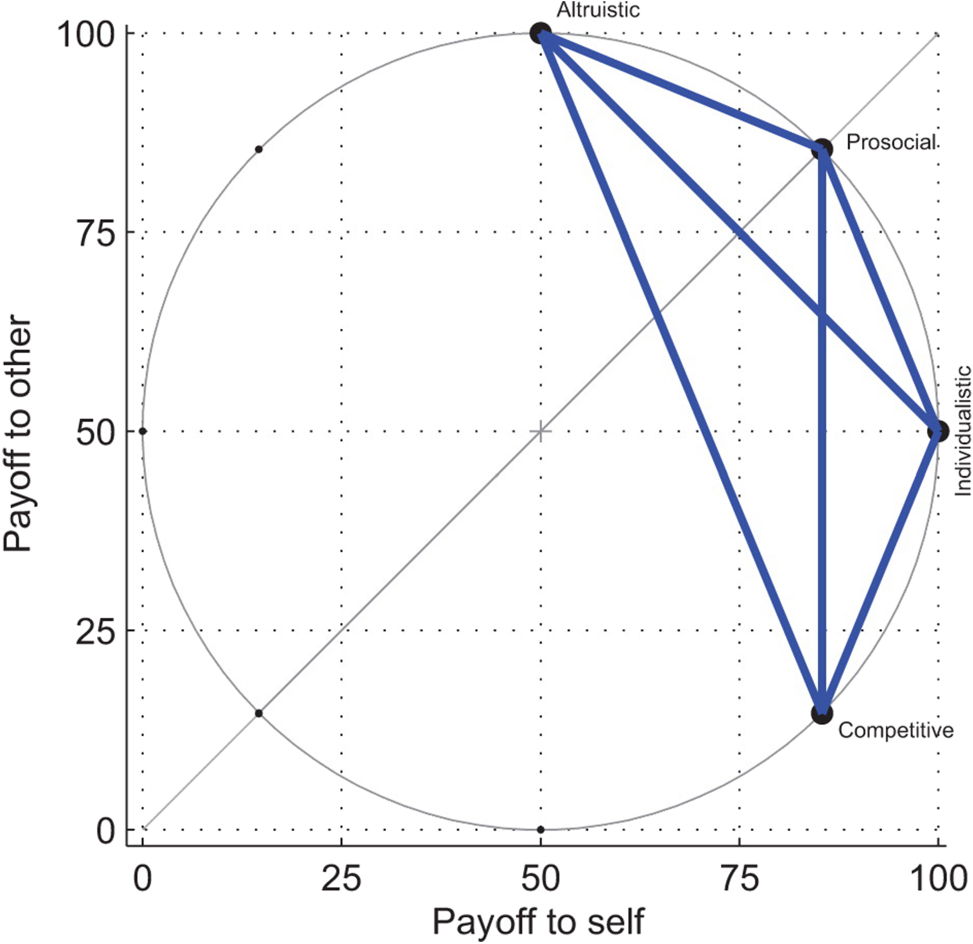
Underlying SVO ring-measure (Murphy et al. 2011, p.773).
The individual measures can be compiled into a single index of SVO containing the mean allocation to self,
This SVO measure is also incentivized with one round of allocation decisions randomly chosen and paid out to both participants.
B.6 Group Manipulation Check
In order to check whether the group manipulation prior to the public-goods game was successful, we administered a manipulation check that is based on Aron et al. (1992). Their Inclusion of Other in the Self (IOS) Scale is a single item, pictorial measure of closeness between the participant and their group, which has been shown to be test-retest reliable and compatible with a range of other closeness tests between individuals and between individuals and groups. We ask participants to circle the image that best represents their relationship to their group from Figure 6. This measure has proven inconclusive in the experiment.
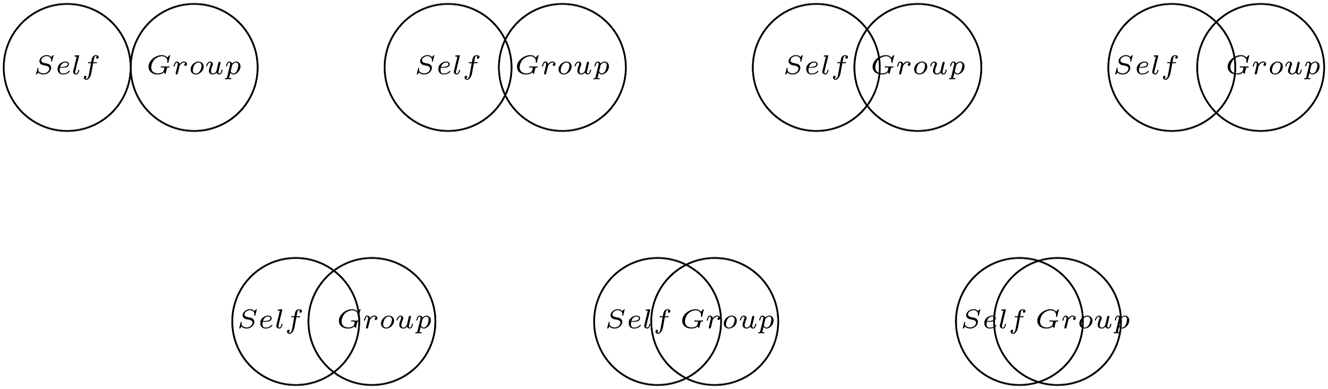
Closeness measure adapted from Aron et al. (1992).
Table 3 displays the frequency distribution of responses (on a 7-point scale) for the Inclusion of Others in the Self (IOS) scale across the four treatment conditions. In all conditions, option 5 is the most frequently chosen, indicating high closeness within the groups. Notably, in the treatment with group identity and public information, option 6 is the most common response, suggesting increased closeness. However, the overall distribution is not significantly different (χ2 = 17.54, df = 18, p = 0.48).
Distribution of responses by treatment and IOS levels, ranging from 1 (least closeness reported) to 7 (greatest closeness reported).
| 1 | 2 | 3 | 4 | 5 | 6 | 7 | |
|---|---|---|---|---|---|---|---|
| Group, private | 4 | 5 | 5 | 5 | 16 | 7 | 6 |
| Group, public | 5 | 7 | 6 | 8 | 6 | 12 | 4 |
| No group, private | 4 | 1 | 6 | 6 | 15 | 8 | 4 |
| No group, public | 6 | 7 | 4 | 6 | 12 | 3 | 6 |
B.7 Questionnaire
The questionnaire consists of six demographic questions that ask participants for the (1) age, (2) gender, (3) level of education, (4) parents’ level of education, as well as (5) their field of study if they are students.
Answers are recorded in free form, except for question 2, about the participants’ gender, where they may choose from male, female, or may choose not to answer.
Appendix C: Robustness
Linear probability models of the effect of the treatments on norm-following with controls.
| (1) | (2) | (3) | (4) | |
|---|---|---|---|---|
| All types | Low types | High types | All types | |
| Dep. variable: norm-following | ||||
| Low identity public | −0.0635 | −0.336* | 0.225 | −0.354** |
| (−0.81) | (−2.46) | (1.97) | (−2.70) | |
| High identity, private | 0.229** | 0.0541 | 0.419** | 0.0270 |
| (3.17) | (0.43) | (3.44) | (0.22) | |
| High identity, public | 0.259** | 0.0864 | 0.410*** | 0.0999 |
| (3.40) | (0.63) | (3.63) | (0.75) | |
| High-type endowment | −0.552*** | |||
| (−4.10) | ||||
| High identity, private × high-type (20) | 0.406* | |||
| (2.18) | ||||
| Low identity, public × high-type (20) | 0.576** | |||
| (3.01) | ||||
| High identity, public × high-type (20) | 0.320 | |||
| (1.70) | ||||
| SVO angle | 0.00849*** | 0.00473 | 0.0113*** | 0.00823*** |
| (4.42) | (1.60) | (3.95) | (4.07) | |
| Gender | 0.101 | 0.169 | 0.0219 | 0.0801 |
| (1.37) | (1.87) | (0.25) | (1.23) | |
| Age | 0.00485 | 0.0107 | 0.00344 | 0.00591 |
| (0.79) | (1.17) | (0.44) | (0.91) | |
| Constant | 0.103 | 0.301 | −0.161 | 0.372 |
| (0.62) | (1.10) | (−0.89) | (1.78) | |
| N | 184 | 92 | 92 | 184 |
| N. clusters | 46 | 46 | 46 | 46 |
| R 2 | 0.19 | 0.21 | 0.30 | 0.28 |
-
Notes: t statistics in parentheses. Linear regression with clustered standard errors on group level. The dependent variable takes value 1 if the participant followed the given recommendation, and value 0 for every transfer that did not match the recommendation. The reference category is the baseline treatment with no group identity and private information (LowId/Priv). Column 1 and 4 use all observations. Column 2 uses only observations from low-endowment participants. Column 3 uses observations only from high-endowment participants. Stars indicate significance difference at the conventional levels: ***p < 0.001, **p < 0.01, *p < 0.05, for a two-sided test.
Logistic regression estimates of the treatments on norm-following behavior.
| (1) | (2) | (3) | (4) | |
|---|---|---|---|---|
| All types | Low types | High types | All types | |
| Dependent variable: norm-following | ||||
| Low identity, public | −0.277 | −1.592* | 1.136 | −1.592* |
| (−0.75) | (−2.36) | (1.51) | (−2.36) | |
| High identity, private | 1.190*** | 0.386 | 2.197** | 0.386 |
| (3.75) | (0.51) | (3.02) | (0.51) | |
| High identity, public | 1.190*** | 0.386 | 2.197** | 0.386 |
| (3.35) | (0.51) | (3.02) | (0.51) | |
| High-type endowment (20) | −2.728** | |||
| (−3.08) | ||||
| Low identity, public × high-type (20) | 2.728** | |||
| (2.63) | ||||
| High identity, private × high-type (20) | 1.812 | |||
| (1.58) | ||||
| High identity, public × high-type (20) | 1.812 | |||
| (1.65) | ||||
| Constant | −0.0910 | 1.224* | −1.504* | 1.224* |
| (−0.33) | (2.15) | (−2.28) | (2.15) | |
| N | 184 | 92 | 92 | 184 |
| N. clusters | 46 | 46 | 46 | 46 |
| Pseudo-R2 | 0.0759 | 0.1182 | 0.1236 | 0.1571 |
-
Notes: t statistics in parentheses. Logistic regression with clustered standard errors on group level. The dependent variable takes value 1 if the participant followed the given recommendation, and value 0 for every transfer that did not match the recommendation. The reference category is the baseline treatment with no group identity and private information (LowId/Priv). Column 1 and 4 use all observations. Column 2 uses only observations from low-endowment participants. Column 3 uses observations only from high-endowment participants. Stars indicate significance difference at the conventional levels: ***p < 0.001, **p < 0.01, *p < 0.05, for a two-sided test.
Regression analysis with belief elicitation.
| (1) | (2) | (3) | |
|---|---|---|---|
| All types | Low type | High type | |
| Belief: All group members contributed their entire endowment | |||
| High identity, private | 21.51*** | 14.38 | 28.63*** |
| (3.81) | (1.73) | (3.71) | |
| Low identity, public | 6.045 | −2.909 | 15.00 |
| (1.05) | (−0.34) | (1.90) | |
| High identity, public | 22.09*** | 16.59* | 27.59*** |
| (3.91) | (2.00) | (3.57) | |
| Constant | 44.16*** | 50.91*** | 37.41*** |
| (10.82) | (8.50) | (6.71) | |
| Belief: All group members followed the recommendation | |||
| High identity, private | 11.64* | −1.205 | 24.49** |
| (2.10) | (−0.15) | (3.20) | |
| Low identity, public | −3.068 | −14.95 | 8.818 |
| (−0.54) | (−1.86) | (1.13) | |
| High identity, public | 9.705 | 5.379 | 14.03 |
| (1.75) | (0.68) | (1.83) | |
| Constant | 55.30*** | 62.95*** | 47.64*** |
| (13.80) | (11.06) | (8.61) | |
| Belief: All low-endowment group members contributed their entire endowment | |||
| High identity, private | 20.33** | 8.432 | 32.23*** |
| (3.19) | (0.95) | (3.59) | |
| Low identity, public | 2.068 | −14.91 | 19.05* |
| (0.32) | (−1.65) | (2.07) | |
| High identity, public | 19.40** | 4.682 | 34.11*** |
| (3.04) | (0.53) | (3.80) | |
| Constant | 60.75*** | 70.82*** | 50.68*** |
| (13.18) | (11.10) | (7.81) | |
| Belief: All high-endowment group members contributed their entire endowment | |||
| High identity, private | 23.14*** | 12.36 | 33.92*** |
| (4.07) | (1.53) | (4.24) | |
| Low identity, public | 5.159 | −0.818 | 11.14 |
| (0.89) | (−0.10) | (1.36) | |
| High identity, public | 21.79*** | 18.61* | 24.96** |
| (3.83) | (2.30) | (3.12) | |
| Constant | 32.80*** | 37.64*** | 27.95*** |
| (7.99) | (6.44) | (4.84) | |
| Observations | 184 | 92 | 92 |
-
Notes: t statistics in parentheses. *p < 0.05, **p < 0.01, ***p < 0.001.
Robustness check with SVO angle, uncertainty score and NS5-scale on norm-following. Random effects probit model.
| Overall | Low type | High type | |
|---|---|---|---|
| Dep. variable: norm-following | |||
| (High group identity) | 0.706* | −0.0292 | 2.204*** |
| (2.34) | (−0.06) | (3.34) | |
| (Public information) | −0.307 | −0.986* | 0.252 |
| (−0.99) | (−2.08) | (0.43) | |
| Uncertainty score | −0.0232** | −0.0154 | −0.0834*** |
| (−2.92) | (−1.49) | (−3.39) | |
| SVO angle | 0.0110 | −0.00510 | 0.0300* |
| (1.36) | (−0.37) | (2.03) | |
| NS1 | −0.0105 | 0.0124 | −0.0138 |
| (−1.03) | (0.63) | (−0.83) | |
| NS2 | 0.00590 | −0.0288 | 0.0414* |
| (0.66) | (−1.62) | (2.32) | |
| NS3 | 0.0179 | 0.0294 | 0.0284 |
| (1.90) | (1.57) | (1.73) | |
| NS4 | 0.00298 | −0.0227 | 0.00783 |
| (0.32) | (−0.93) | (0.45) | |
| NS5 | 0.00540 | 0.0300 | 0.000732 |
| (0.68) | (1.60) | (0.04) | |
| Constant | −0.823* | 0.532 | −4.127*** |
| (−2.30) | (0.97) | (−4.17) | |
| N | 184 | 92 | 92 |
-
t statistics in parentheses. *p < 0.05, **p < 0.01, ***p < 0.001.
To see whether our overall results also hold if we control for different characteristics of the participants, we conducted the post-experimental tests that are detailed in Appendices B.3–B.7: the SVO angle and the NS5-scale questions, as well as the Uncertainty Score. The latter refers to the difference between Question 1 and Question 2 of the belief elicitation questions detailed in Appendix B.3 and is calculated as follows:
It measures the participants’ certainty of their recommendation being the recommendation given to everyone on a scale from 0 to 100, with 0 being absolute certainty that the recommendations match. The lower the Uncertainty Score, the surer the participant is that the recommendations are the same. This score follows the same rationale as Figure 7.
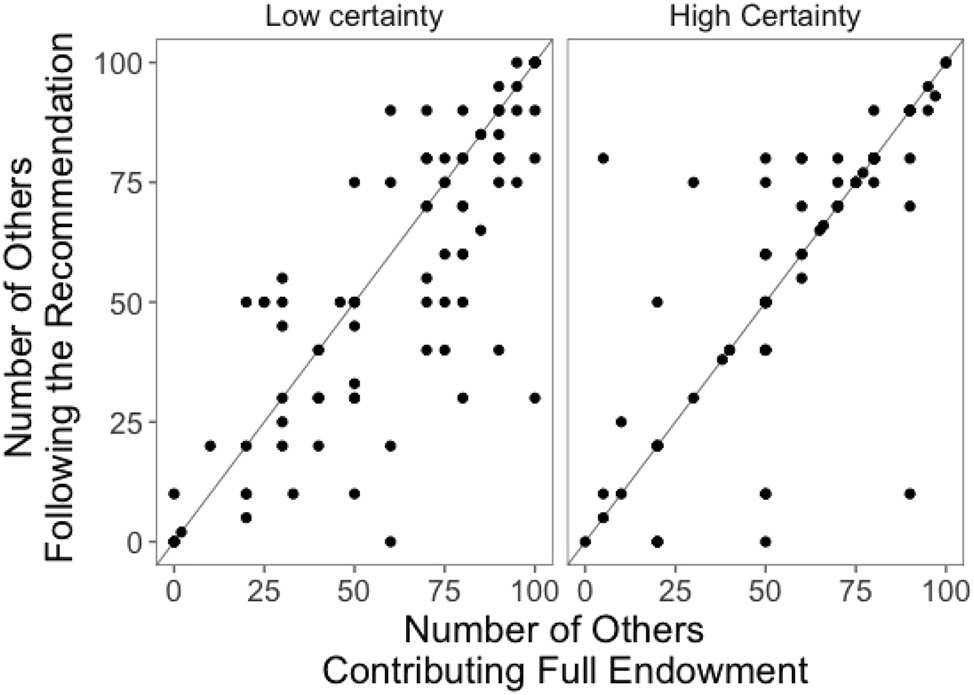
Plot of answers to Question 1 and Question 3 in the case of low certainty (private information) and high certainty (public information).
We see from Table 7 (recommendation-following, random effects probit model) that most of the effect of the group manipulation and the information manipulation mostly still go in the right direction. An exception is the norm-following of low types under group manipulation (high group identity), which is not significant. The effect of the group manipulation on recommendation-following and contribution level of the high types remains significant (p < 0.001 for recommendation-following and contribution) and the negative effect of the information manipulation (public information) on the recommendation-following of the low types remains significant as well (p < 0.05 for both). We can further see that the Uncertainty Score explains a portion of the high types’ behavior, as they contribute less and follow the norm less when they are more uncertain about the prevalent norm (p < 0.001 for recommendation-following; p < 0.05 for contribution).
Additionally, we see that the increased contribution of high types can be attributed to the kind of person they are according to their behavior in the SVO post-test. The higher the SVO angle, the more pro-social the participants, who contribute more to the public good and follow the norm more often (p < 0.01 for contribution; p < 0.05 for recommendation-following). Answers given to the NS5-scale questions do not account for the manipulation effects in general, with the exception that high types who expected their partners in the dictator game to be more generous were more likely to follow the recommendation (p < 0.05 for recommendation-following).
Thus, our results are robust against controlling for SVO-types and generosity of the participants. Controlling for the participants’ Uncertainty Score supports the thesis that the high types increased contribution and norm-following is based on an increased belief that others will also give more.
References
Akerlof, G. A., and R. E. Kranton. 2000. “Economics and Identity.” The Quarterly Journal of Economics 115 (3): 715–53. https://doi.org/10.1162/003355300554881.Search in Google Scholar
Andreoni, J., and R. Croson. 2008. “Partners Versus Strangers: Random Rematching in Public Goods Experiments.” Handbook of Experimental Economics Results 1: 776–83.10.1016/S1574-0722(07)00082-0Search in Google Scholar
Arias, E. 2019. “How Does Media Influence Social Norms? Experimental Evidence on the Role of Common Knowledge.” Political Science Research and Methods 7 (3): 561–78. https://doi.org/10.1017/psrm.2018.1.Search in Google Scholar
Aron, A., E. N. Aron, and D. Smollan. 1992. “Inclusion of Other in the Self Scale and the Structure of Interpersonal Closeness.” Journal of Personality and Social Psychology 63 (4): 596. https://doi.org/10.1037/0022-3514.63.4.596.Search in Google Scholar
Aumann, R. J. 1974. “Subjectivity and Correlation in Randomized Strategies.” Journal of Mathematical Economics 1 (1): 67–96. https://doi.org/10.1016/0304-4068(74)90037-8.Search in Google Scholar
Aumann, R. J. 1987. “Correlated Equilibrium as an Expression of Bayesian Rationality.” Econometrica 55 (1): 1–18. https://doi.org/10.2307/1911154.Search in Google Scholar
Bicchieri, C. 2005. The Grammar of Society: The Nature and Dynamics of Social Norms. Cambridge: Cambridge University Press.10.1017/CBO9780511616037Search in Google Scholar
Bicchieri, C. 2016. Norms in the Wild: How to Diagnose, Measure, and Change Social Norms. Oxford University Press.10.1093/acprof:oso/9780190622046.001.0001Search in Google Scholar
Bicchieri, C., and E. Dimant. 2022. “Nudging with Care: The Risks and Benefits of Social Information.” Public Choice 191: 443–464, https://doi.org/10.1007/s11127-019-00684-6.Search in Google Scholar
Bicchieri, C., E. Dimant, S. Gächter, and D. Nosenzo. 2022. “Social Proximity and the Erosion of Norm Compliance.” Games and Economic Behavior 132: 59–72. https://doi.org/10.1016/j.geb.2021.11.012.Search in Google Scholar
Bicchieri, C., R. Muldoon, and A. Sontuoso. 2018. “Social Norms.” In The Stanford Encyclopedia of Philosophy, edited by E. N. Zalta. Metaphysics Research Lab, Stanford University, winter 2018 edition.Search in Google Scholar
Brekke, K. A., J. Konow, and K. Nyborg. 2017. “Framing in a Threshold Public Goods Experiment with Heterogeneous Endowments.” Journal of Economic Behavior & Organization 138: 99–110. https://doi.org/10.1016/j.jebo.2017.04.006.Search in Google Scholar
Brewer, M. B., and R. M. Kramer. 1986. “Choice Behavior in Social Dilemmas: Effects of Social Identity, Group Size, and Decision Framing.” Journal of Personality and Social Psychology 50 (3): 543. https://doi.org/10.1037//0022-3514.50.3.543.Search in Google Scholar
Charness, G., L. Rigotti, and A. Rustichini. 2007. “Individual Behavior and Group Membership.” The American Economic Review 97 (4): 1340–52. https://doi.org/10.1257/aer.97.4.1340.Search in Google Scholar
Chen, Y., and S. X. Li. 2009. “Group Identity and Social Preferences.” The American Economic Review 99 (1): 431–57. https://doi.org/10.1257/aer.99.1.431.Search in Google Scholar
Chwe, M. S.-Y. 1998a. “Believe the Hype: Solving Coordination Problems with Television Advertising.” Unpublished Article. http://chwe.net/michael/papers.html (accessed January 3, 2020).Search in Google Scholar
Chwe, M. S.-Y. 1998b. “Culture, Circles, and Commercials Publicity, Common Knowledge, and Social Coordination.” Rationality and Society 10 (1): 47–75. https://doi.org/10.1177/104346398010001002.Search in Google Scholar
Croson, R. T. 1996. “Partners and Strangers Revisited.” Economics Letters 53 (1): 25–32. https://doi.org/10.1016/s0165-1765(97)82136-2.Search in Google Scholar
Dal Bó, E., and P. Dal Bó. 2014. ““Do the Right Thing”: The Effects of Moral Suasion on Cooperation.” Journal of Public Economics 117: 28–38. https://doi.org/10.1016/j.jpubeco.2014.05.002.Search in Google Scholar
Delmas, M. A., and N. Lessem. 2014. “Saving Power to Conserve Your Reputation? The Effectiveness of Private Versus Public Information.” Journal of Environmental Economics and Management 67 (3): 353–70. https://doi.org/10.1016/j.jeem.2013.12.009.Search in Google Scholar
Eckel, C. C., and P. J. Grossman. 2005. “Managing Diversity by Creating Team Identity.” Journal of Economic Behavior & Organization 58 (3): 371–92. https://doi.org/10.1016/j.jebo.2004.01.003.Search in Google Scholar
Fischbacher, U. 2007. “z-tree: Zurich Toolbox for Ready-Made Economic Experiments.” Experimental Economics 10 (2): 171–8. https://doi.org/10.1007/s10683-006-9159-4.Search in Google Scholar
Fischbacher, U., S. Gächter, and E. Fehr. 2001. “Are People Conditionally Cooperative? Evidence from a Public Goods Experiment.” Economics Letters 71 (3): 397–404. https://doi.org/10.1016/s0165-1765(01)00394-9.Search in Google Scholar
Gintis, H. 2010. “Social Norms as Choreography.” Politics, Philosophy & Economics 9 (3): 251–64. https://doi.org/10.1177/1470594x09345474.Search in Google Scholar
Greiner, B. 2015. “Subject Pool Recruitment Procedures: Organizing Experiments with ORSEE.” Journal of the Economic Science Association 1 (1): 114–25. https://doi.org/10.1007/s40881-015-0004-4.Search in Google Scholar
Güth, W., R. Schmittberger, and B. Schwarze. 1982. “An Experimental Analysis of Ultimatum Bargaining.” Journal of Economic Behavior & Organization 3 (4): 367–88. https://doi.org/10.1016/0167-2681(82)90011-7.Search in Google Scholar
Haines, M., and S. F. Spear. 1996. “Changing the Perception of the Norm: A Strategy to Decrease Binge Drinking Among College Students.” Journal of American College Health 45 (3): 134–40. https://doi.org/10.1080/07448481.1996.9936873.Search in Google Scholar
Jasso, G., and K.-D. Opp. 1997. “Probing the Character of Norms: A Factorial Survey Analysis of the Norms of Political Action.” American Sociological Review 62: 947–64. https://doi.org/10.2307/2657349.Search in Google Scholar
Kahneman, D., J. L. Knetsch, and R. H. Thaler. 1986. “Fairness and the Assumptions of Economics.” Journal of Business 59 (4): 285–300. https://doi.org/10.1086/296367.Search in Google Scholar
Keser, C., and F. Van Winden. 2000. “Conditional Cooperation and Voluntary Contributions to Public Goods.” The Scandinavian Journal of Economics 102 (1): 23–39. https://doi.org/10.1111/1467-9442.00182.Search in Google Scholar
Kölle, F., and S. Quercia. 2021. “The Influence of Empirical and Normative Expectations on Cooperation.” Journal of Economic Behavior & Organization 190: 691–703. https://doi.org/10.1016/j.jebo.2021.08.018.Search in Google Scholar
Kramer, R. M., and M. B. Brewer. 1984. “Effects of Group Identity on Resource Use in a Simulated Commons Dilemma.” Journal of Personality and Social Psychology 46 (5): 1044. https://doi.org/10.1037/0022-3514.46.5.1044.Search in Google Scholar
Lederman, H. 2017. “Common Knowledge.” In Handbook of Social Intentionality, edited by M. Jankovic, and K. Ludwig. London: Routledge.10.4324/9781315768571-18Search in Google Scholar
Morris, S., and H. S. Shin. 2002. “Social Value of Public Information.” The American Economic Review 92 (5): 1521–34. https://doi.org/10.1257/000282802762024610.Search in Google Scholar
Murphy, R. O., K. A. Ackermann, and M. J. Handgraaf. 2011. “Measuring Social Value Orientation.” Judgment and Decision Making 6 (8): 771–81. https://doi.org/10.1017/s1930297500004204.Search in Google Scholar
Oyebode, B., and N. Nicholls. 2023. “Social Norms as Anchor Points for Trust.” The Social Science Journal 60 (4): 744–54. https://doi.org/10.1080/03623319.2020.1753429.Search in Google Scholar
Prentice, D., and E. L. Paluck. 2020. “Engineering Social Change Using Social Norms: Lessons from the Study of Collective Action.” Current Opinion in Psychology 35: 138–42. https://doi.org/10.1016/j.copsyc.2020.06.012.Search in Google Scholar
Schultz, P. W., J. M. Nolan, R. B. Cialdini, N. J. Goldstein, and V. Griskevicius. 2007. “The Constructive, Destructive, and Reconstructive Power of Social Norms.” Psychological Science 18 (5): 429–34. https://doi.org/10.1111/j.1467-9280.2007.01917.x.Search in Google Scholar
Sonderegger, S. 2010. “Centralized or Decentralized Information: Which is Better for Providing Incentives?” Economic Inquiry 48 (2): 290–305. https://doi.org/10.1111/j.1465-7295.2008.00204.x.Search in Google Scholar
Tajfel, H., and J. C. Turner. 1979. “An Integrative Theory of Intergroup Conflict.” The Social Psychology of Intergroup Relations 33 (47): 74.Search in Google Scholar
Tajfel, H., M. G. Billig, R. P. Bundy, and C. Flament. 1971. “Social Categorization and Intergroup Behaviour.” European Journal of Social Psychology 1 (2): 149–78. https://doi.org/10.1002/ejsp.2420010202.Search in Google Scholar
Ullman-Margalit, E. 1977. “Coordination Norms and Social Choice.” Erkenntnis 11 (1): 143–55. https://doi.org/10.1007/bf00169850.Search in Google Scholar
Winter, F., H. Rauhut, and D. Helbing. 2012. “How Norms can Generate Conflict: An Experiment on the Failure of Cooperative Micro-Motives on the Macro-Level.” Social Forces 90 (3): 919–46. https://doi.org/10.1093/sf/sor028.Search in Google Scholar
© 2025 Walter de Gruyter GmbH, Berlin/Boston