
Salivary gamma-glutamyltransferase activity as an indicator of redox homeostasis in breast cancer
-
Elena I. Dyachenko
 ,
Elena A. Sarf
,
Elena A. Sarf


Abstract
Objectives
One of the main participants in maintaining the redox balance is glutathione (GSH), the metabolism of which directly depends on the activity of gamma-glutamyltransferase (GGT), and the content of amino acids cysteine (Cys), methionine (Met), glutamine (Gln), glutamic acid (Glu), and glycine (Gly). This work aimed to investigate the relationship between salivary GGT activity in patients with breast cancer and the state of redox homeostasis.
Methods
The case-control study included volunteers with breast cancer (n=660), non-malignant breast pathologies (n=134), and a control group (n=127). Analysis of GGT activity and amino acid content in saliva was performed in all patients strictly before treatment, and in 139 patients, the study was repeated 4 weeks after surgical treatment. GGT activity was determined by the Zaits-Persin kinetic method. The concentration of amino acids (Cys, Met, Gln, Glu, and Gly) was determined using high-performance liquid chromatography.
Results
In breast cancer and fibroadenomas, antioxidant protection was activated and salivary GGT levels increased (+5.6 % in fibroadenomas, +11.3 % in breast cancer, p<0.0001). The highest salivary GGT activity was observed in the luminal hormone-negative breast cancer subgroups (+19.7 %, p<0.0001). This may indicate the sufficiency of metabolic resources to activate the antioxidant system in less aggressive luminal subtypes. In the non-luminal (+12.4 %, р=0.0054) and TNBC (+17.1 %, p<0.0001) subgroups, salivary GGT activity was close to normal values. Probably, in a more aggressive process, with depletion of biological resources, and more pronounced metabolic reprogramming of cancer cells, GSH synthesis is sharply reduced, which is expressed in a change in the amino acid balance. After surgery, salivary GGT activity decreased with the preservation of the residual metabolic pattern of the corresponding breast cancer phenotype.
Conclusion
The analysis of salivary GGT activity serves as a valuable tool for elucidating metabolic changes associated with breast cancer, including its potential application in post-treatment monitoring.
Introduction
Gamma-glutamyltransferase (GGT) performs a variety of functions in the human body: it participates in maintaining and regulating the amino acid pool, and protein metabolism, determines membrane permeability, participates in the regulation of immune responses at the cellular level, counteracts oxidative stress by breaking down extracellular glutathione (GSH) and provides cells with amino acids that are part of GSH [1].
GGT plays a key role in GSH homeostasis as the main component of antioxidant protection. The enzyme is located on the outer surface of the plasma membrane of cells and breaks down extracellular GSH. This releases cysteine (Cys) for intracellular de novo GSH synthesis [2]. GSH synthesis occurs in two stages. In the first stage, free Cys binds to glutamic acid (Glu) under the action of γ-glutamylcysteine ligase (γGCL), resulting in the formation of γ-glutamylcysteine. If there is not enough free Cys during the first stage of GSH synthesis, GSH synthesis does not occur, since cysteine is present in small quantities in a physiologically healthy organism. Any pathological process that leads to a decrease in Cys content primarily affects the synthesis of GSH. Cys deficiency causes its compensatory synthesis through methionine (Met) [2]. In the second stage, γ-glutamylcysteine binds to glycine (Gly) under the action of GSH synthetase (GS). Thus, the state of oxidation-reduction homeostasis can be assessed directly by measuring GSH or indirectly through the content of certain amino acids included in its composition and GGT. The amino acids that directly support GSH metabolism include Cys, Gly, Glu, and indirectly Met, and glutamine (Gln) [3].
In cancer, GGT is expressed at high levels [4]. GGT activity influences the rate of cell growth and increases tumor resistance to chemotherapy [5].
The study of GGT activity in saliva in breast cancer is a promising direction since this enzyme is widely used in clinical practice. Saliva is a preferred biomaterial for primary diagnostics and continuous monitoring of the patient’s condition. Saliva contains biochemical enzymes, metabolites, cytokines, and antibodies [6]. Such a wide range of biochemical components in saliva reflects changes occurring not only in the oral cavity but also throughout the body as a whole [7], [8], [9]. This makes saliva a promising biological material for the diagnosis of diseases, including oncological ones [10], [11], [12].
The aim of this work was to study the activity of GGT in the saliva of patients with breast cancer as a marker of GSH, which serves as an indicator of the state of redox homeostasis in cancer. The state of antioxidant protection in this work was assessed by the level of GGT and the metabolism of key amino acids that are directly related to the cycle of GSH synthesis Cys, Glu, Gly and associated with this cycle Gln, Met.
Materials and Methods
Study design
The study included 921 people, including 660 patients with breast cancer (age 54.6 ± 1.9 years), 134 patients with fibroadenomas (age 48.7 ± 2.2 years), and 127 healthy volunteers (49.3 ± 1.5 years). Inclusion criteria were age 30–70 years, histologically confirmed invasive breast carcinoma or fibroadenoma, and no signs of active infection in the oral cavity. Saliva samples were collected from all patients before treatment, and GGT activity was determined. In 139 patients who received adjuvant chemotherapy after mastectomy, saliva samples were collected again and GGT activity was determined. The interval between the first and second GGT activity determination was 4 weeks (Figure 1).
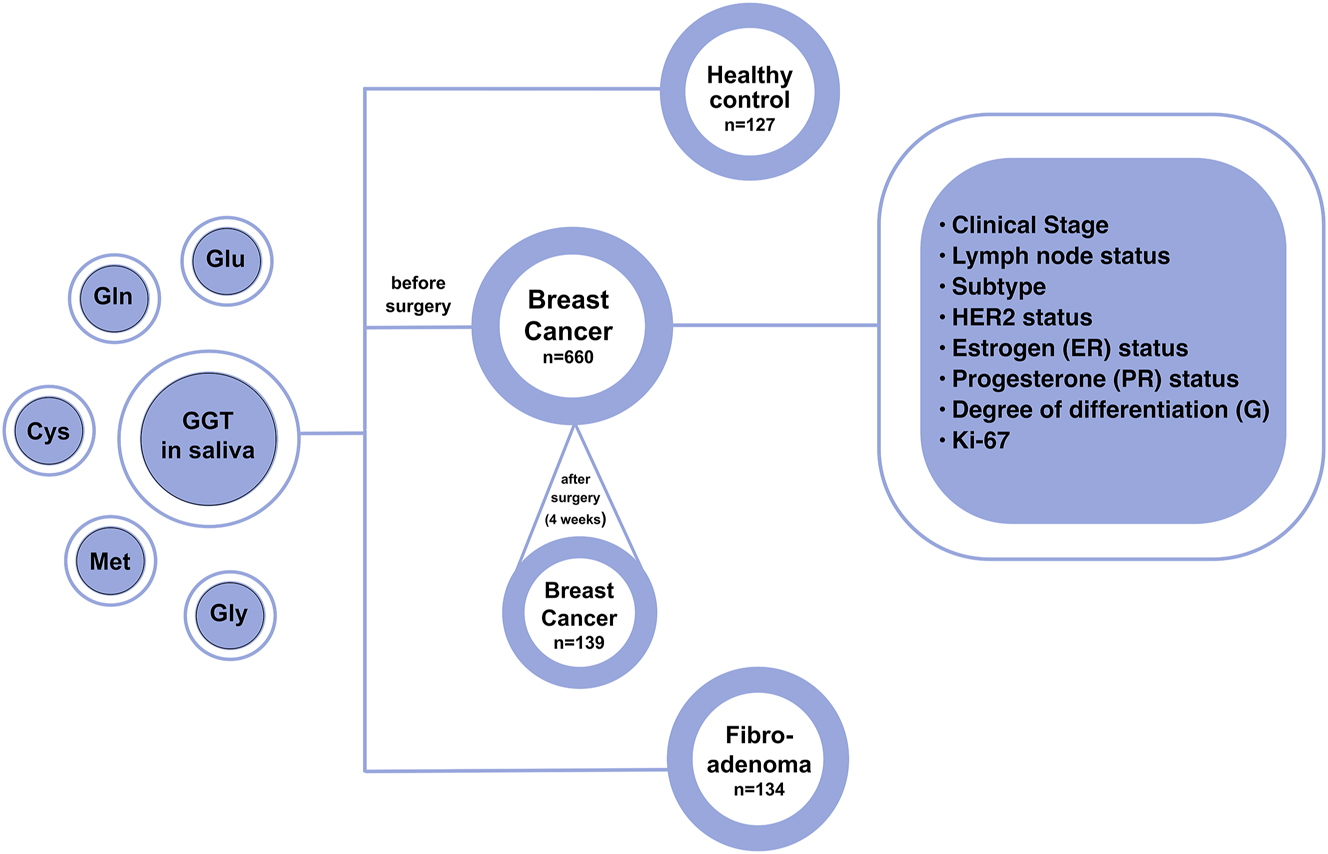
Research design.
This study was conducted in accordance with the Declaration of Helsinki (as revised in 2013). The study was approved by the Ethics Committee of Omsk State Pedagogical University (20 March 2024, protocol code 46-04/2). Informed consent was obtained from all individuals included in this study, or their legal guardians or wards.
A detailed description of the study group is given in Table 1.
Characteristics of the study group.
| Feature | Breast cancer | ||
|---|---|---|---|
| Before surgery, n=660 | After surgery, n=139 | ||
| Clinical stage | |||
|
|
|||
| Stage IA + IB | 228 (34.5 %) | 40 (28.8 %) | |
| Stage IIA + IIB | 272 (41.2 %) | 72 (51.8 %) | |
| Stage IIIA + IIIB + IIIC | 97 (14.7 %) | 27 (19.4 %) | |
| Stage IV | 63 (9.6 %) | – | |
|
|
|||
| Lymph node status | |||
|
|
|||
| N0 | 404 (61.2 %) | 77 (55.4 %) | |
| N1-3 | 256 (38.8 %) | 62 (44.6 %) | |
|
|
|||
| Subtype | |||
|
|
|||
| Luminal A-like | 234 (35.4 %) | 27 (19.4 %) | |
| Luminal B-like (HER2+) | 60 (9.1 %) | 10 (7.2 %) | |
| Luminal B-like (HER2-) | 200 (30.3 %) | 74 (53.2 %) | |
| HER2-enriched (non-Lum) | 44 (6.7 %) | 6 (4.3 %) | |
| Triple-negative | 122 (18.5 %) | 22 (15.9 %) | |
|
|
|||
| HER2 status | |||
|
|
|||
| HER2-negative | 556 (84.2 %) | 123 (88.5 %) | |
| HER2-positive | 104 (15.8 %) | 16 (11.5 %) | |
|
|
|||
| Estrogen (ER) status | |||
|
|
|||
| ER-negative | 166 (25.2 %) | 28 (20.1 %) | |
| ER-positive | 494 (74.8 %) | 111 (79.9 %) | |
|
|
|||
| Progesterone (PR) status | |||
|
|
|||
| PR-negative | 238 (36.1 %) | 43 (30.9 %) | |
| PR-positive | 422 (63.9 %) | 96 (69.1 %) | |
|
|
|||
| Degree of differentiation, G | |||
|
|
|||
| G I + II | 403 (61.1 %) | 78 (56.1 %) | |
| G III | 175 (26.5 %) | 48 (34.5 %) | |
| No data | 82 (12.4 %) | 13 (9.4 %) | |
|
|
|||
| Ki-67 | |||
|
|
|||
| <20 % | 272 (41.2 %) | 40 (28.8 %) | |
| >20 % | 361 (54.7 %) | 97 (69.8 %) | |
| No data | 27 (4.1 %) | 2 (1.4 %) | |
Collection and storage of saliva samples
Saliva was collected on an empty stomach between 8 and 10 a.m. to minimize possible circadian changes in saliva composition. Immediately before saliva collection, volunteers rinsed their mouths with deionized water. Saliva samples were collected without any stimulation of its secretion. Sterile 10 mL polypropylene centrifuge tubes were used to collect saliva samples. Immediately after collection, saliva samples were centrifuged at 7,000 rpm to remove cellular debris (CLb-16, Moscow, Russia), and GGT activity was determined. To determine the salivary amino acid content, a 0.5 mL aliquot was taken, transferred to Eppendorf tubes, and frozen at −80 °C until the study was performed.
Determination of GGT activity and amino acid composition of saliva
GGT activity was determined kinetically using L-gamma-glutamyl-3-carboxy-4-nitroanilide as a substrate according to Seitz-Persin using the StatFax 3,300 semi-automatic biochemical analyzer (Awareness Technology, Palm City, FL, USA). High-performance liquid chromatography was used to determine the concentration of amino acids (Cys, Met, Gln, Glu, and Gly) using a 1,260 Infinity II chromatograph with selected reaction monitoring detection on a 6,460 Triple Quad mass spectrometer (Agilent, Santa Clara, CA, USA). The internal standard was Alanine-d4 (sc-480386, Santa Cruz Biotechnology Inc., Dallas, Texas, USA). At least six samples of the Amino Acids in Plasma/Urine LC-MS/MS Analysis Kit (Jasem, Turkey) were used to construct the calibration scale. Automatic integration of chromatograms was used using the Quantitative Quant-my-way software (MassHunter Workstation Quantitative Analysis B.09.00, Agilent, Santa Clara, CA, USA).
Determining the molecular biological characteristics of breast cancer
According to the Allred Scoring Guideline [13] and ASCO/CAP recommendations [14], the expression level of estrogen receptors (ER), progesterone receptors (PR), and HER2 was determined and classified into one of four categories (0, 1+, 2+, 3+). HER2 expression values (0) or (1+) were interpreted as HER2-negative, and (3+) were considered HER2-positive. In case of an uncertain HER2 expression value (2+), in situ hybridization (ISH) was performed. For the Ki-67 expression, the cutoff value was defined as 20 % (<20 % − low Ki-67; >20 % − high Ki-67) [15]. Five breast cancer phenotypes were identified: triple-negative breast cancer (TNBC), luminal A, luminal B HER2(−), luminal B HER2(+), and HER2-enriched (non-luminal).
Statistical analysis
The Mann-Whitney and Kruskal-Wallis tests were used to compare the groups using a nonparametric method (Statistica 10.0, StatSoft, Hamburg, Germany). The results are presented as the median (Me) and interquartile range in the form of the 25th and 75th percentiles [lower quartile (LQ); upper quartile (UQ)].
Results
GGT activity in saliva in mammary gland pathologies and in healthy controls
The salivary GGT activity increased in breast pathologies compared to the healthy control (+5.6 % in fibroadenomas, +11.3 % in breast cancer, p<0.0001) (Figure 2A). The increase in GGT activity in breast cancer compared to healthy controls is statistically significant regardless of stage, degree of differentiation and proliferative activity (Figure 2B), expression of estrogen and progesterone receptors, HER2 (Figure 2C) and molecular biological subtype (Figure 2D). It was found that the GGT activity in saliva increased at the first stage (+21.2 %, p<0.0001) compared to the healthy control, then decreased evenly up to the fourth stage of breast cancer (+14.0 %, p=0.0059) (Figure 2B). The salivary GGT activity was higher in the presence of expression of estrogen (+4.5 %, p=0.0015) and progesterone (+3.6 %, p=0.0073) receptors, low proliferative activity Ki-67 (+1.8 %, p=0.0145), high and moderate tumor differentiation (+7.2 %, p=0.0001) (Figure 2B and C). The salivary GGT activity in luminal breast cancer subtypes was higher than in hormone-receptor-negative subtypes. Thus, the maximum GGT activity was noted in luminal A (+19.7 %) and luminal B HER2(−) (+18.1 %) breast cancer, while the minimum was in non-luminal (+12.4 %) breast cancer. Intermediate values of GGT activity were noted for TNBC (+17.1 %) (Figure 2D).
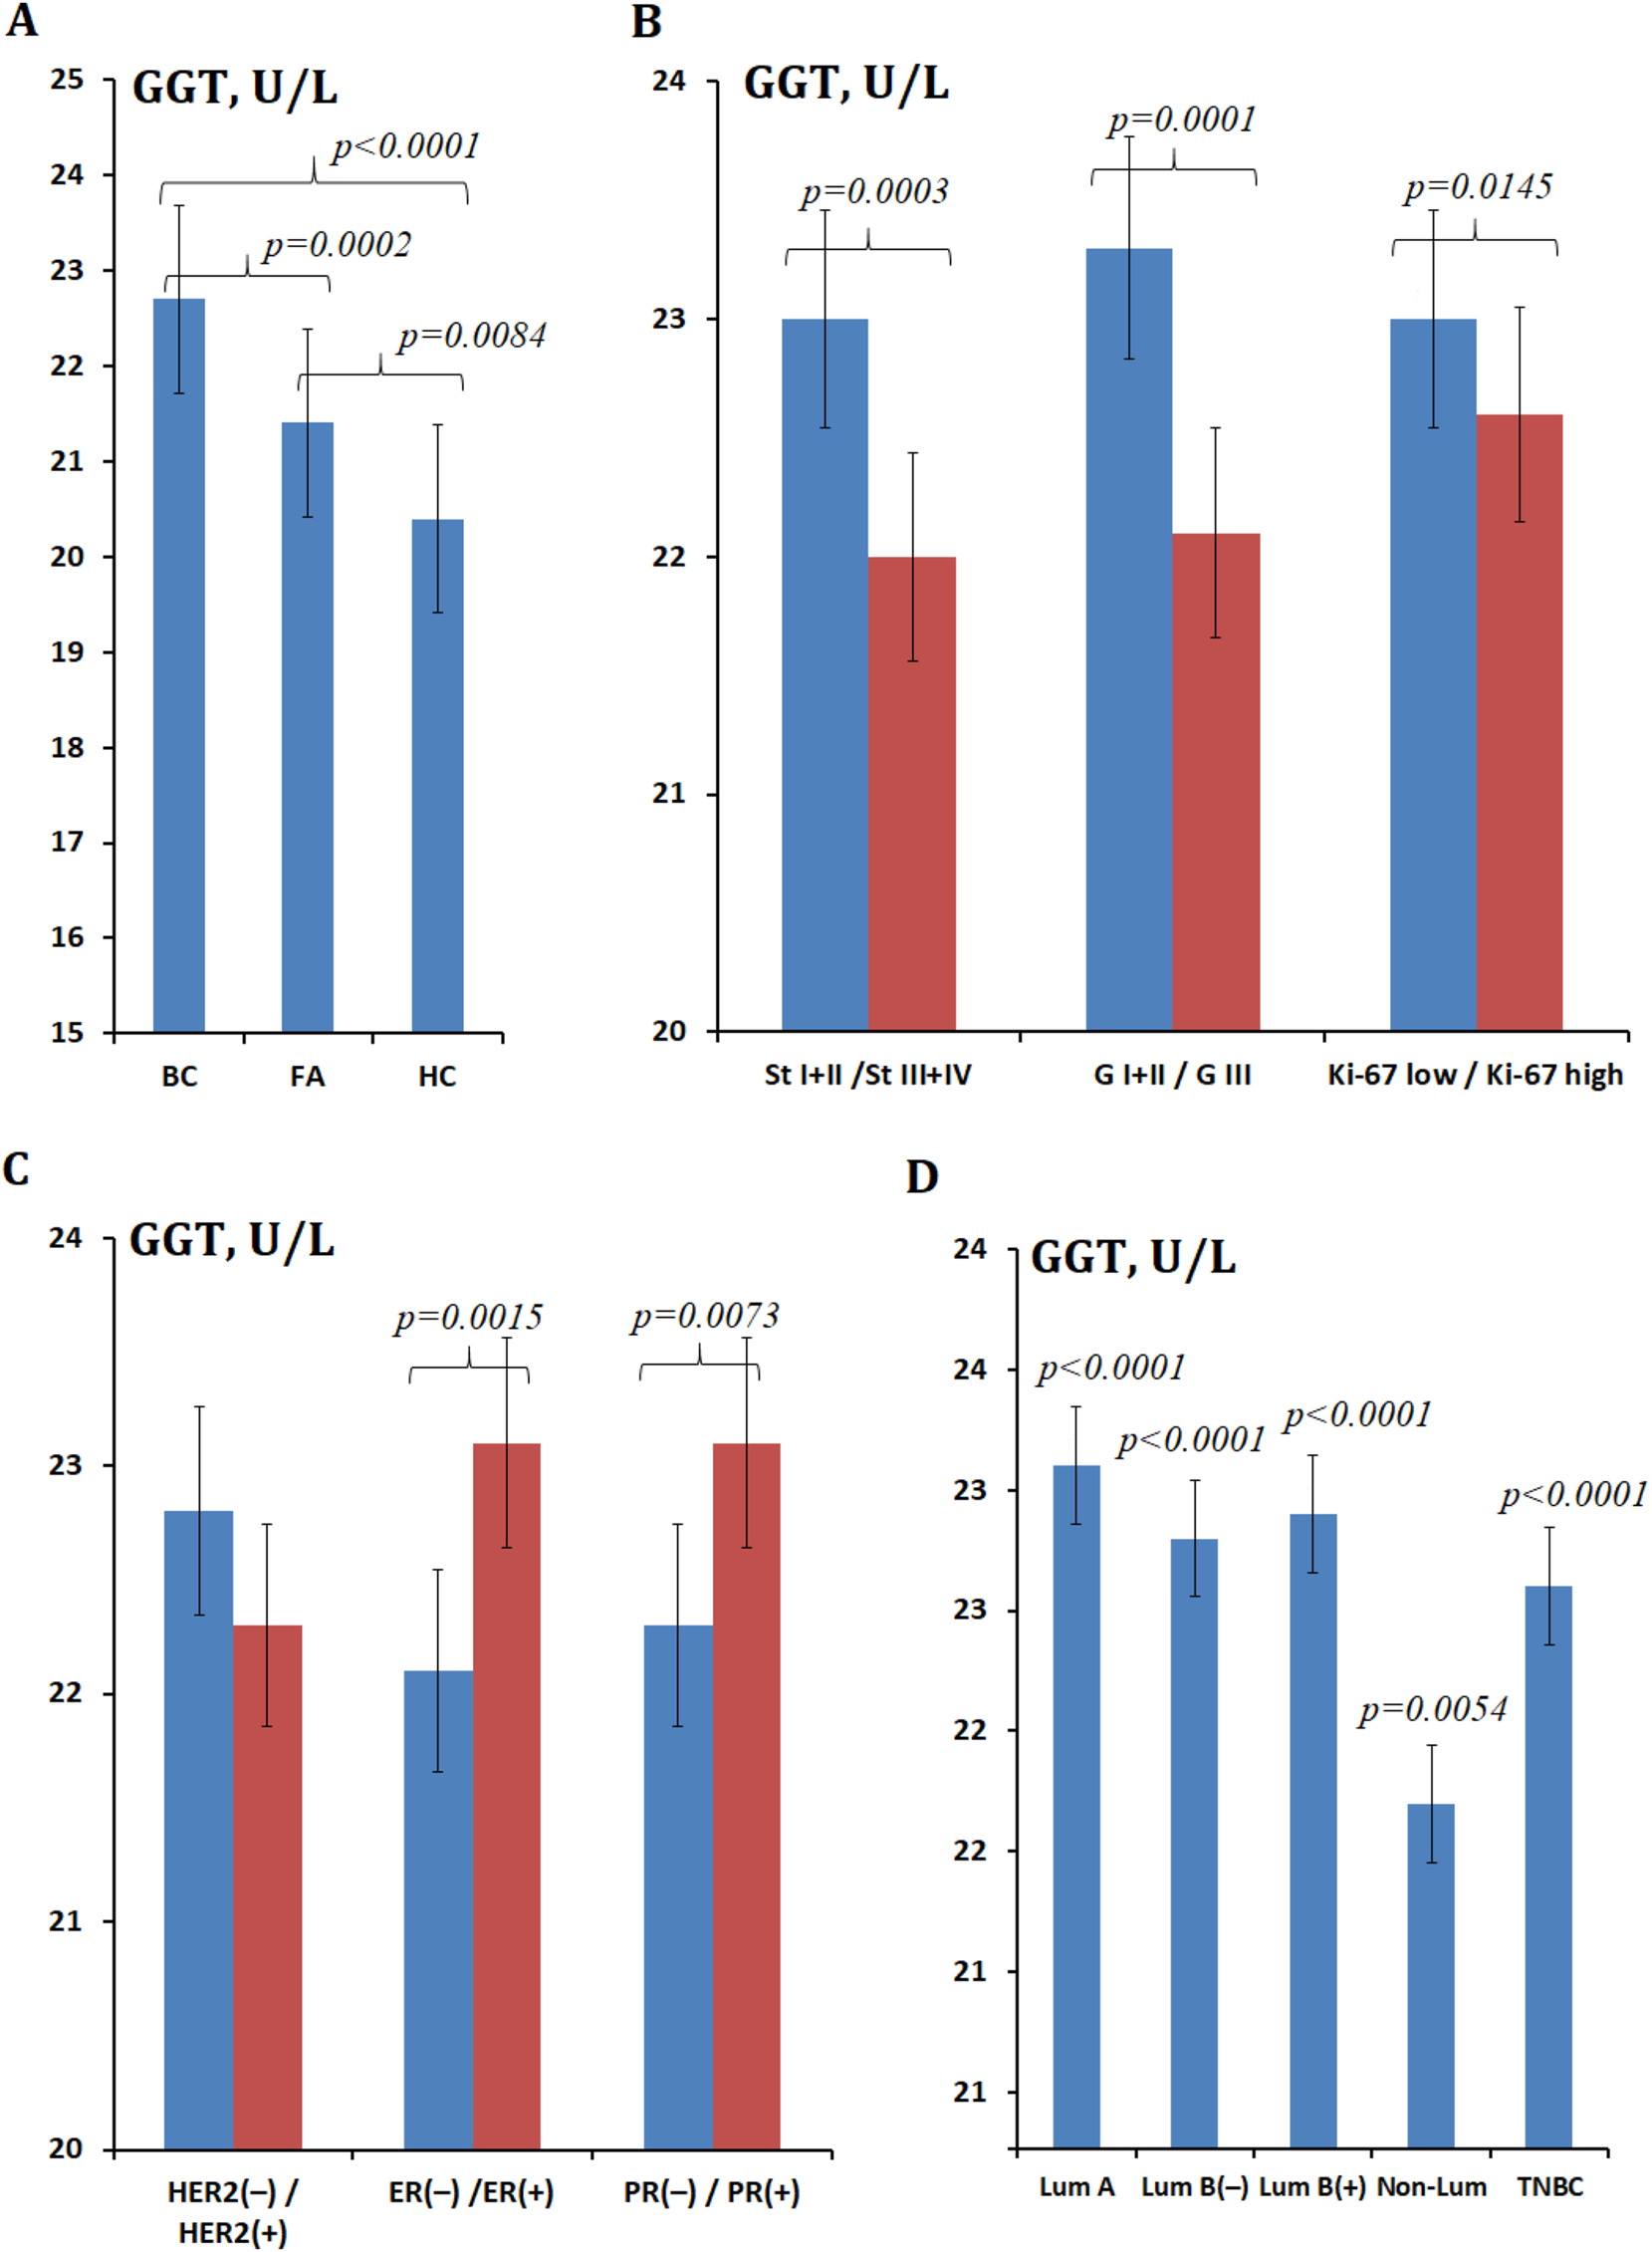
GGT activity (U/L) in saliva. (A) In breast cancer, FA, and healthy control; (B) GGT activity at different stages, degrees of differentiation, and proliferative activity; (C) GGT activity at different expression statuses of HER2, ER, and PR receptors; (D) GGT activity in different breast cancer phenotypes. Note: BC, breast cancer; FA, fibroadenomas; HC, healthy control; St, stage; G, differentiation; GGT, gamma-glutamyltransferase; ER, estrogen; PR, progesterone; Lum, luminal; TNBC, triple-negative breast cancer. In Figure 2B and C, the differences with the healthy control are statistically significant in all cases, p<0.0001; p-values are given for comparison of subgroups with each other. In Figure 2D, p-values are given relative to the healthy control.
Additionally, a comparison of salivary GGT activity depending on the stage was performed for each phenotype (Figure 3). For luminal A and B HER2(−) subtypes, GGT activity decreased uniformly with increasing breast cancer stage. For all luminal subtypes, GGT activity at stage I was approximately the same, whereas for TNBC, a significant increase in GGT activity was observed (Figure 3). For the non-luminal subtype, the subgroup of patients with stage I breast cancer included two people, so it was not included in the calculations. Minimal salivary GGT activity was observed at common stages of breast cancer in subgroups with HER2-positive status (Figure 3).
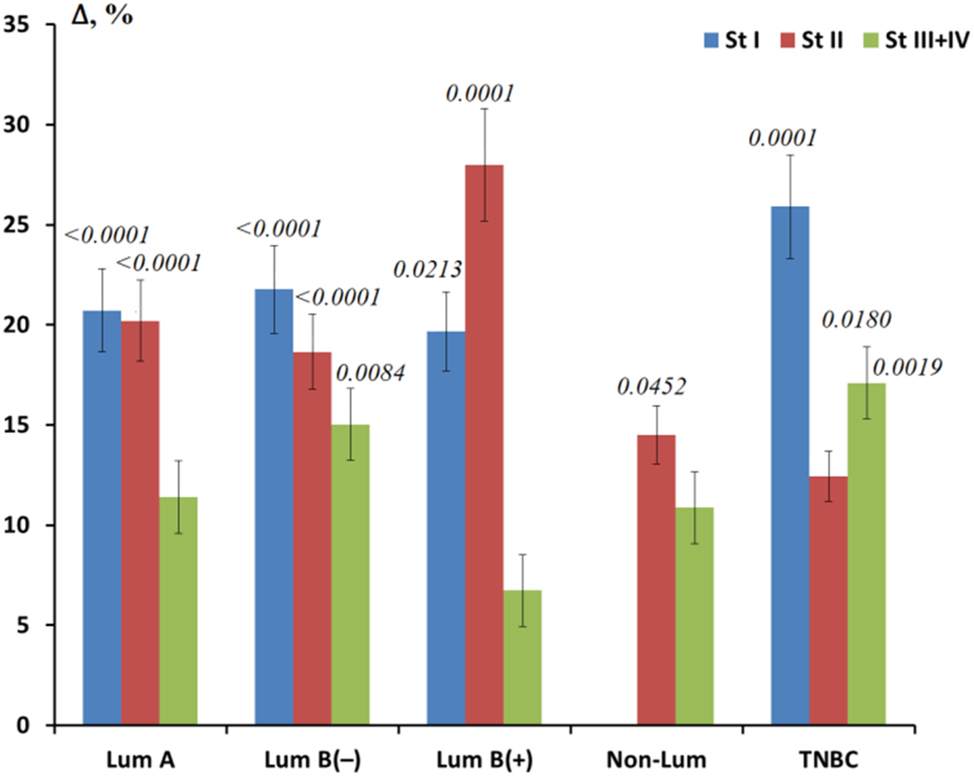
Relative change in GGT activity for different molecular biological subtypes of breast cancer depending on the tumor stage. Note: St, stage, Lum, luminal; TNBC, triple-negative breast cancer. The relative change is calculated as GGT activity in the studied subgroup minus GGT activity in the healthy control, divided by GGT activity in the healthy control, %. p-values are given for all cases where differences were found between the respective subgroups and healthy controls.
Amino acid content in saliva in mammary gland pathologies and in healthy controls
It was found that the concentrations of amino acids in saliva in breast cancer increased for Glu (+31.6 %), Gly (+37.9 %), and Met (+19.5 %) (Table 2). A decrease in the concentration of Cys (−39.0 %) and Gln (−45.6 %) was noted. For fibroadenomas, an intermediate content of Cys and Glu was shown; while the content of Met was significantly higher, and Gln and Gly were lower than for patients with breast cancer.
Amino acid content in saliva in breast cancer, FA, and healthy controls.
| AAs, nmol/L | BC, n=660 | FA, n=134 | HC, n=127 | Kruskal-Wallis test; р-Value |
|---|---|---|---|---|
| Cys | 1.33 [0.59; 2.63]* | 1.58 [1.10; 2.68] | 2.18 [1.04; 3.57] | 8.241; 0.0012 |
| Met | 4.97 [3.38; 7.12] | 6.61 [3.28; 10.4] | 4.16 [1.85; 5.30] | 6.809; 0.0671 |
| Glu | 77.92 [50.94; 102.9] | 74.53 [51.77; 121.3] | 59.18 [44.52; 80.64] | 4.323; 0.1151 |
| Gln | 238.8 [104.8; 412.8] | 180.6 [114.5; 439.6] | 438.8 [163.7; 638.4] | 4.319; 0.1154 |
| Gly | 257.7 [163.7; 378.7] | 160.1 [144.9; 206.4] | 186.9 [141.7; 305.6] | 7.174; 0.0277 |
-
BC, breast cancer; FA, fibroadenomas; HC, healthy control; AAs, amino acids; Cys, cysteine; Met, methionine; Glu, glutamiс acid; Gln, glutamine; Gly, glycine. *The results are presented as median and interquartile range.
The content of Cys (+32.7 %), Met (+22.2 %), and Gln (+51.8 %) increased with increasing breast cancer stage, while the content of Glu (−8.1 %) and Gly (−1.3 %) decreased. With a decrease in the degree of differentiation of cancer cells, the content of Cys (−15.1 %), Met (−26.5 %, p=0.0419), Glu (−21.7 %, p=0.0101), and Gly (−6.9 %) decreased, except for Gln (+52.0 %). With positive expression of estrogen and progesterone receptors, the content of Cys and Met increased, and the level of Gly decreased (Table 3). An ambiguous pattern of change was observed for Glu and Gln: with positive expression of estrogen receptors, the concentration of Glu increased, and Gln decreased, while for positive expression of progesterone receptors, an inverse relationship was observed. In the case of positive HER2 expression, only Gln and Gly had a high content in saliva compared to negative HER2 expression. In the case of high proliferative activity Ki-67 high compared to Ki-67 low, a high content in saliva was shown only for Gln (Table 3).
Amino acid content in saliva depending on the stage, degree of differentiation, expression of estrogen, progesterone, and HER2 receptors, and the level of proliferative activity Ki-67 in breast cancer.
| AAs, nmol/L | Cys | Met | Glu | Gln | Gly |
|---|---|---|---|---|---|
| Clinical stage | |||||
|
|
|||||
| St I + II (1) | 1.10 [0.59; 2.30] | 4.81 [2.76; 7.12] | 78.83 [53.85; 102.88] | 173.35 [89.42; 371.02] | 261.03 [156.97; 384.61] |
| St III + IV (2) | 1.46 [0.59; 4.06] | 5.88 [3.77; 7.13] | 72.42 [47.78; 103.77] | 263.19 [196.45; 661.24] | 257.70 [177.67; 327.74] |
| p-value | – | р2-HC=0.0091 | p1-HC=0.0280 | p1-HC=0.0155 | – |
|
|
|||||
| Degree of differentiation, G | |||||
|
|
|||||
| GI (1) | 1.46 [0.59; 2.31] | 5.93 [3.98; 7.13] | 85.19 [62.20; 112.12] | 173.26 [89.83; 394.18] | 265.71 [168.41; 394.72] |
| GIII (2) | 1.24 [0.59; 3.02] | 4.36 [2.96; 6.61] | 66.70 [47.54; 85.06] | 263.42 [125.05; 545.36] | 247.24 [140.85; 322.22] |
| p-value | – | р1-2=0.0419 р1-HC=0.0047 |
р1-2=0.0101 р1-HC=0.0102 |
р1-HC=0.0226 | – |
|
|
|||||
| Estrogen (ER) status | |||||
|
|
|||||
| ER (−) (1) | 0.95 [0.42; 2.45] | 4.83 [3.26; 6.97] | 76.19 [48.03; 98.87] | 255.13 [196.54; 466.36] | 289.66 [191.08; 358.93] |
| ER (+) (2) | 1.56 [0.98; 2.63] | 5.19 [3.71; 7.28] | 79.04 [53.70; 107.55] | 136.60 [86.82; 412.79] | 241.48 [153.58; 379.28] |
| p-value | – | р2-HC=0.0241 | p2-HC=0.0361 | p2-HC=0.0248 | – |
|
|
|||||
| Progesterone (PR) status | |||||
|
|
|||||
| PR (−) (1) | 1.05 [0.42; 2.34] | 4.88 [3.20; 7.02] | 79.92 [49.58; 102.88] | 222.94 [121.46; 354.78] | 267.58 [177.54; 407.94] |
| PR (+) (2) | 1.35 [0.92; 2.75] | 5.43 [3.80; 7.12] | 76.87 [57.67; 103.88] | 275.21 [86.82; 412.79] | 241.46 [156.97; 375.01] |
| p-value | – | р2-HC=0.0262 | – | – | – |
|
|
|||||
| HER2 status | |||||
|
|
|||||
| HER2(−) (1) | 1.56 [0.59; 5.27] | 6.14 [3.80; 8.06] | 78.56 [49.76; 107.10] | 209.79 [89.83; 394.18] | 239.10 [145.98; 370.94] |
| HER2(+) (2) | 1.05 [0.59; 2.02] | 4.49 [2.77; 6.32] | 77.23 [57.99; 100.85] | 255.13 [238.78; 611.84] | 299.30 [218.39; 395.03] |
| p-value | р2-HC=0.0452 | р1-2=0.0099 р1-HC=0.0023 |
– | p1-HC=0.0338 | р2-HC=0.0261 |
|
|
|||||
| Proliferative activity Ki-67 | |||||
|
|
|||||
| Ki-67 low (1) | 1.46 [0.72; 2.26] | 6.18 [4.81; 7.41] | 86.13 [64.98; 117.88] | 142.48 [86.41; 459.96] | 278.39 [166.92; 394.26] |
| Ki-67 high (2) | 1.14 [0.59; 2.89] | 4.62 [3.19; 6.79] | 68.26 [47.54; 89.22] | 263.19 [136.60; 375.56] | 256.35 [146.93; 352.41] |
| p-value | – | р1-2=0.0381 р1-HC=0.0025 |
р1-2=0.0052 р1-HC=0.0052 |
p1-HC=0.0234 | – |
|
|
|||||
| Molecular biological subtype | |||||
|
|
|||||
| Lum А | 1.59 [1.35; 2.99] | 6.96 [5.98; 8.62] | 86.00 [62.60; 122.41] | 127.9 [86.8; 507.1] | 232.0 [150.8; 392.3] |
| Lum В(−) | 1.67 [0.70; 2.62] | 6.21 [3.80; 8.81] | 68.35 [47.83; 106.7] | 179.8 [86.0; 354.8] | 225.1 [137.0; 320.3] |
| Lum В(+) | 1.14 [0.86; 2.26] | 4.00 [2.60; 5.79] | 79.04 [74.36; 102.08] | NA | 360.5 [285.0; 526.4] |
| Non-Lum | 0.95 [0.42; 1.91] | 5.19 [3.82; 7.12] | 63.69 [45.50; 102.26] | 246.2 [196.4; 256.6] | 246.7 [192.7; 306.2] |
| TNBC | 1.15 [0.33; 2.79] | 4.91 [3.32; 7.02] | 76.37 [48.03; 98.01] | 638.0 [229.9; 2280.6] | 323.8 [146.9; 468.8] |
-
NA, not applicable; AAs, amino acids; Cys, cysteine; Met, methionine; Glu, glutamic acid; Gln, glutamine; Gly, glycine; Lum A, luminal A; Lum B(−), luminal B HER2-negative; Lum B(+), luminal B HER2-positive; Non-Lum, non-luminal; TNBC, triple-negative breast cancer. The results are presented as median and interquartile range. Indexes 1 and 2 correspond to the numbers of the compared subgroups, which are given in column 1 in brackets. Index HC corresponds to comparison with healthy control.
In luminal A and luminal B HER2(−) subtypes of breast cancer, there was a decrease in the concentration of amino acids characteristic of GSH synthesis: Cys, Glu, Gly. In luminal B HER2(+), non-luminal, and TNBC, the maximum depletion of the concentration of Cys and Met was observed, while the increase in the concentration of Gln and Gly in luminal B HER2(+) and TNBC was at the highest level compared to other subtypes of breast cancer and normal values (Table 3).
Changes in GGT activity in saliva after tumor surgery
After surgical treatment, salivary GGT activity slightly decreased (−4.8 %), but did not reach the values characteristic of healthy volunteers. Differences between GGT activity before and after surgery were statistically significant (p=0.0017). It is interesting to note that the higher the stage of breast cancer before surgery, the more significant the decrease in GGT activity in this group after surgery: for stage I −1.7 %, for stage II −6.1 %, for stage III −7.7 % (Figure 4). After tumor removal, GGT activity remained elevated for luminal subtypes of breast cancer, while the maximum decrease in GGT activity was noted to the level of the control group for non-luminal breast cancer and below the healthy control for TNBC.
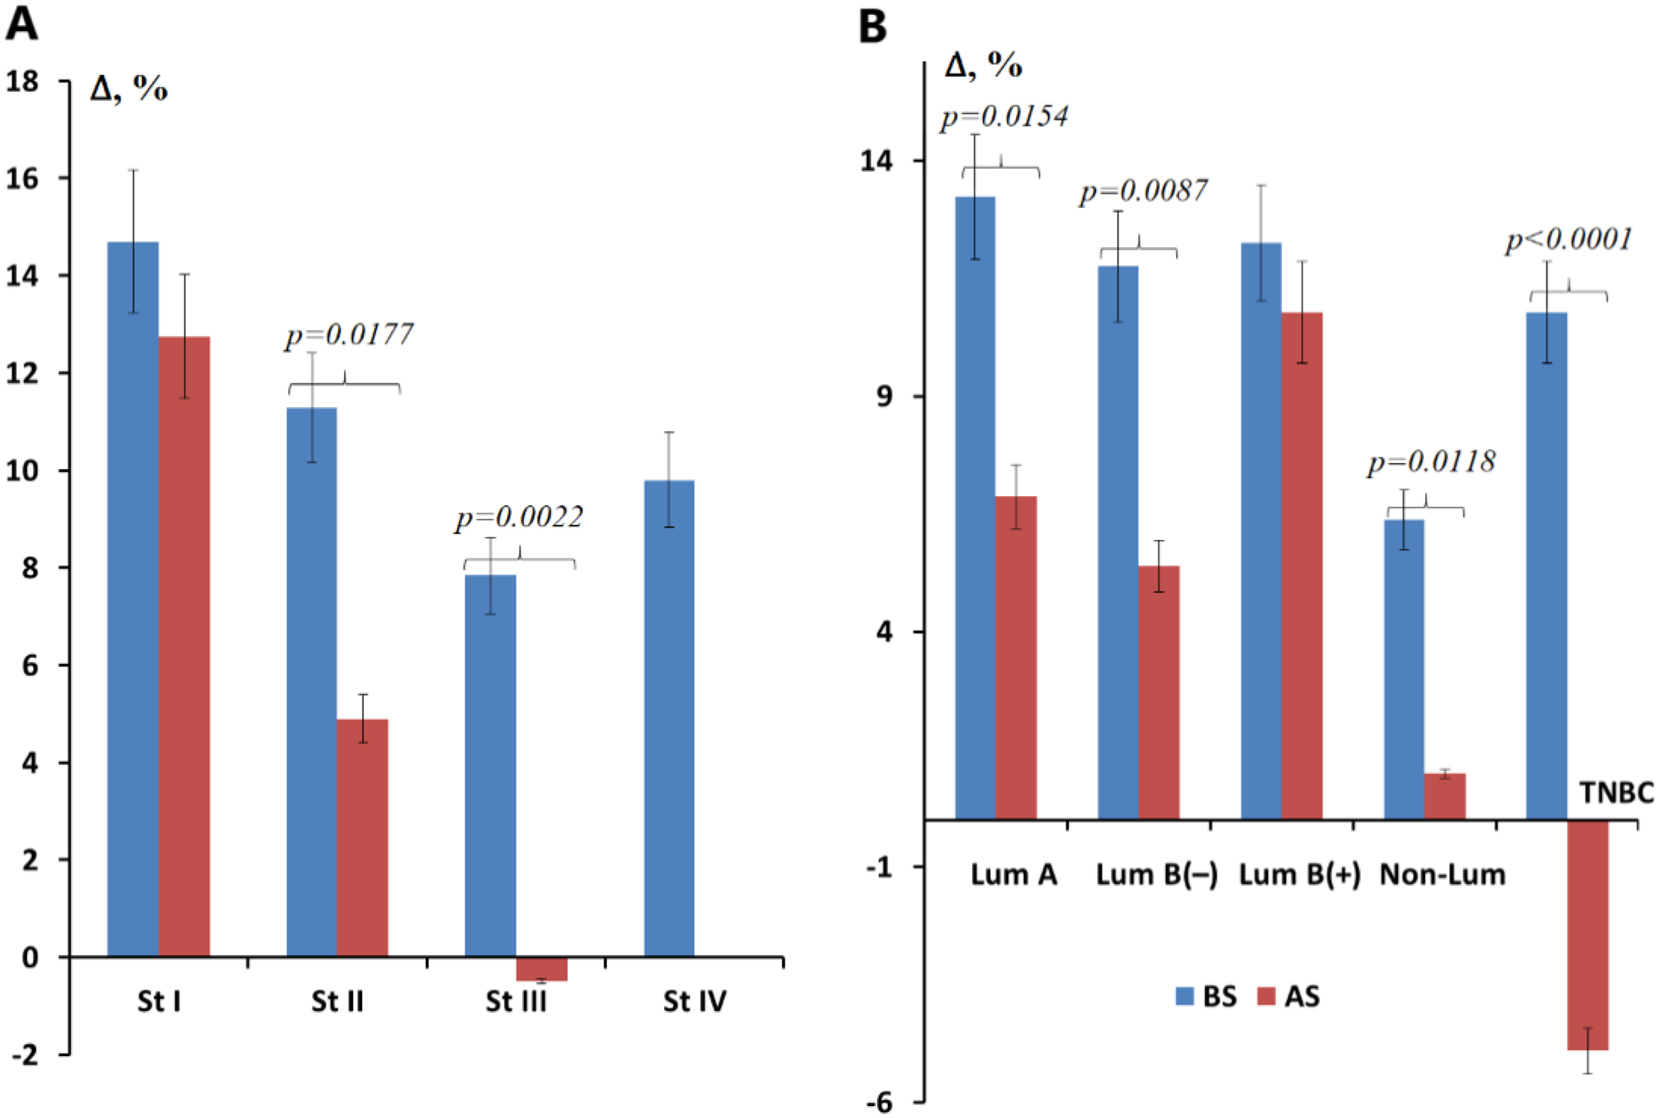
Relative change in GGT activity before and after surgical removal of the tumor. (A) Depending on the tumor stage; (B) depending on the molecular biological subtype of the tumor, %. Note: St, stage, Lum, luminal; TNBC, triple-negative breast cancer; BS, before surgery; AS, after surgery. The relative change is calculated as GGT activity in the studied subgroup minus GGT activity in the healthy control, divided by GGT activity in the healthy control, %.
Discussion
There is increasing evidence of the relationship between GGT activity, GSH content, and the risk of developing cancer, including breast cancer [16], [17], [18]. The functions of GSH are not limited to maintaining the redox balance. GSH affects cellular signaling, and gene expression, and potentiates the synthesis of eicosanoids [1], 19], 20]. Cancer cells and their microenvironment are characterized by a violation of the redox balance due to the activation of oncogenes, active aerobic glycolysis, and hypoxia. This leads to high production of reactive oxygen species (ROS) [21]. GSH is able to directly neutralize ROS and is also a cofactor for the synthesis of glutathione-S-transferase (GSTs), glutathione peroxidase (Gpxs), and glutoredoxin (Grxs) (Figure 5) [22]. GSTs affect cellular signaling, post-translational modification, and develop resistance to chemotherapeutic drugs [23]. Gpxs have eight isoforms, each of which performs its own separate role in maintaining the redox balance [24]. With aberrant expression and multiple polymorphisms of the Gpxs genes, the role of the enzyme becomes ambiguous and dual [25], 26]. Grxs reduces hydrocarbonates, peroxiredoxins, and methionine sulfoxyreductase [27], [28], [29]. High levels of GSH in cancer cells and their microenvironment are also maintained by the reduction of oxidized glutathione (GSSG). The enzyme glutathione reductase (GR) catalyzes the conversion of GSSG to GSH with NADPH [30]. Since cancer cells have an altered metabolic program, GSH formation occurs at an accelerated rate. This allows tumor cells to maintain their viability and evade attacks from the immune system [31].
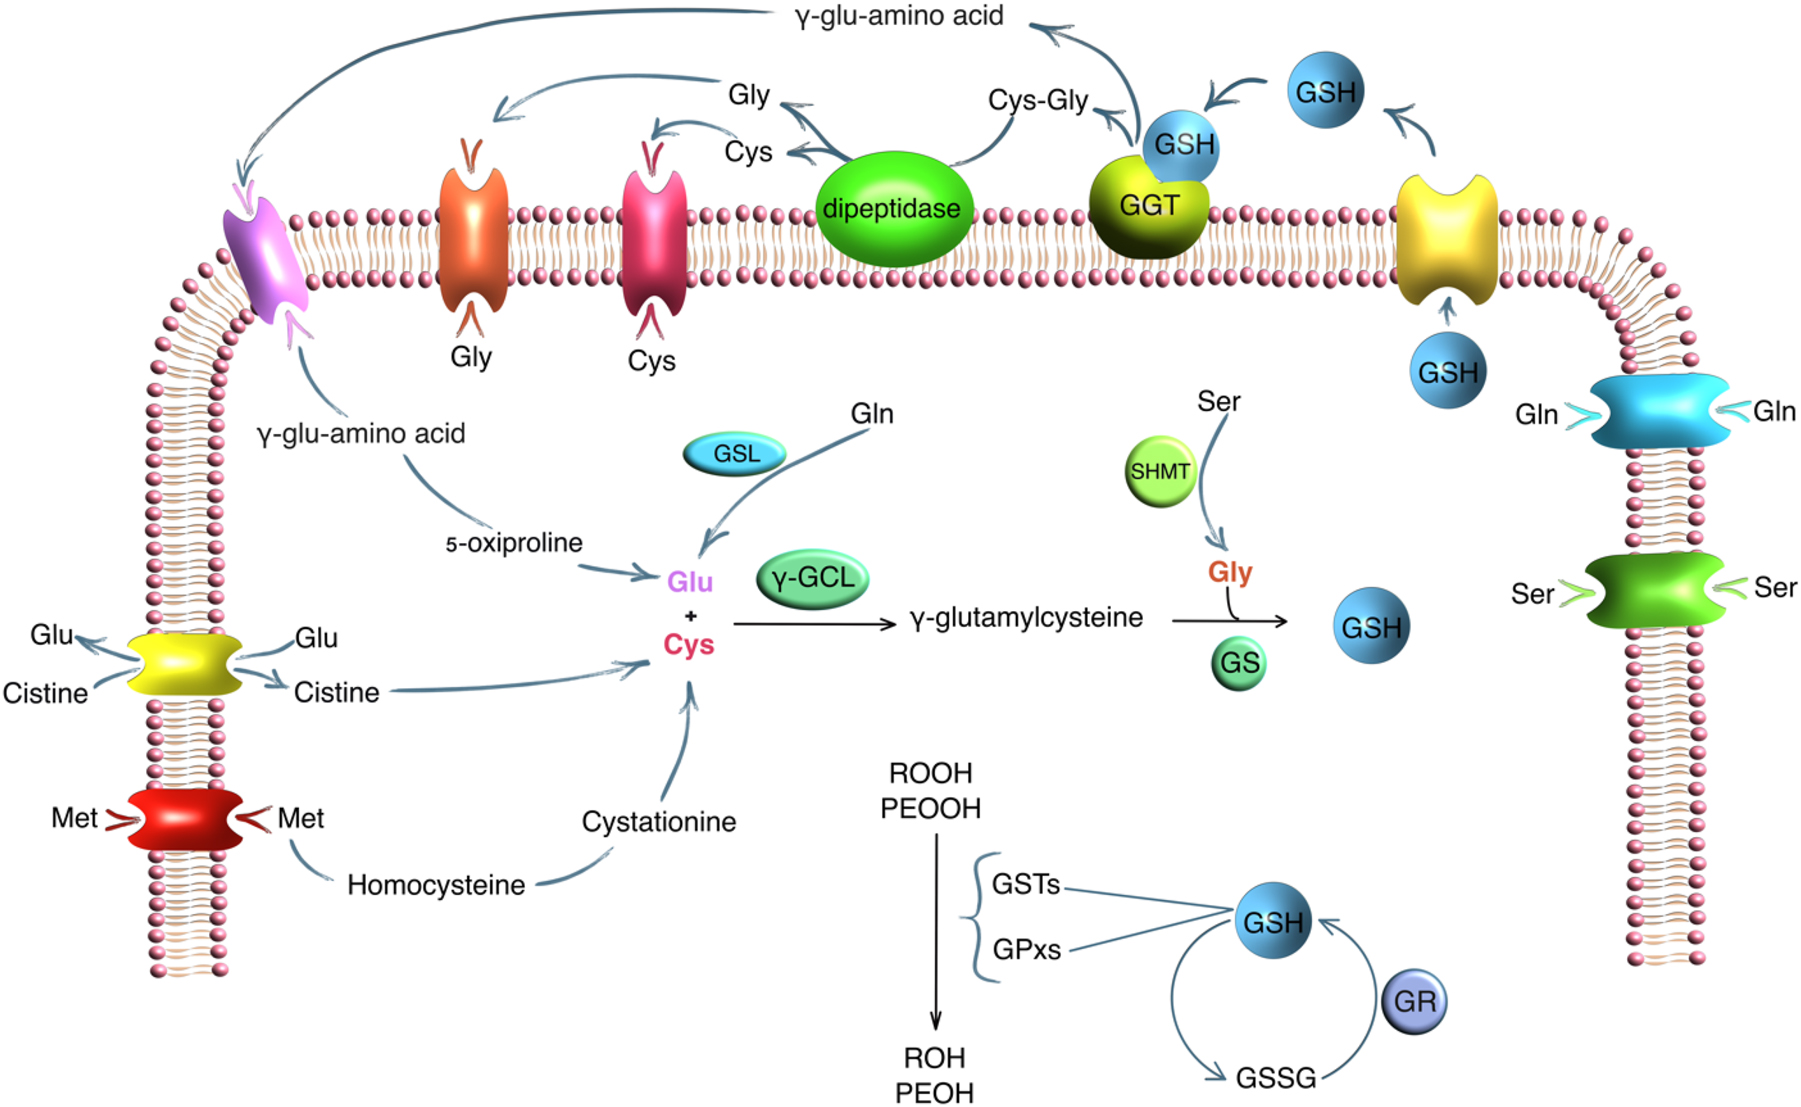
The role of GGT and amino acids in GSH metabolism. Note: GGT, γ-glutamyltransferase; GSH, glutathione; GSSH, oxidized glutathione; GSL, glutaminase; γ-GCL, γ-glutamylcysteine ligase; SHMT, serine hydroxymethyltransferase; GS, glutathione synthetase; GR, glutathione reductase; POOH, organic hydroperoxides; PEOOH, lipid hydroperoxides; GSTs, glutathione S-transferases; GPxs, glutathione peroxidases.
In this study, we show that salivary GGT activity was significantly increased in breast cancer and fibroadenomas compared to healthy volunteers. Interestingly, salivary GGT activity was closely associated with breast cancer phenotype.
In luminal A and B HER2(−) subtypes of breast cancer, there was a change in the homeostatic balance in the group of GGT metabolites, Cys, Gly, and Glu, responsible for the synthesis of GSH: the level of Cys decreased, and Gly, Glu increased. This leads to an increase in the level of GGT in saliva. The entry of amino acids into the cell occurs due to the activity of transmembrane amino acid carriers. Each subtype of breast cancer expresses the transmembrane carrier’s characteristic of it. In our case, we see compensation for the lack of Cys due to the active entry of Met into the cell and its metabolism. Met enters cancer cells of luminal subtypes of breast cancer via SLC6A14, SLC6A15, SLC7A5, SLC7A7, and SLC7A8 [32]. Met then converts through intermediate reactions into homocysteine, then into cystathionine, which is eventually formed into cysteine [33]. Low concentrations of free Gln in saliva in these groups are associated with its active entry into the cell via transmembrane amino acid carriers in luminal subtypes of breast cancer: SLC6A14, SLC7A8 [32]. Inside the cell, Gln is converted into Glu by the enzyme glutaminase, which is necessary for the synthesis of GSH [34]. In addition to GSH synthesis, Glu is necessary for the entry of cystine (Cys-S-S-Cys) into the cell. Under the influence of NADPH, the poorly soluble form of cystine is converted into highly soluble Cys. This exchange of intracellular Glu for extracellular Cys occurs due to the activity of transmembrane antiporter carriers SLC1A1, SLC1A2, SLC1A3, SLC1A5, SLC1A6, SLC1A7, SLC7A11. It has been shown that antiporters have the highest expression in luminal subtypes of breast cancer [32]. Gly transporters are expressed to the least extent in luminal subtypes of breast cancer [32]. Gly enters the second final stage of the GSH synthesis reaction and also plays a key role in the synthesis of nucleotide bases [35]. Apparently, the level of glycine that enters the cell is sufficient for GSH synthesis, but insufficient for the use of the amino acid in maintaining proliferative processes, as in other subtypes of breast cancer. Thus, in luminal A and B HER2(−) subtypes of breast cancer, an inversely directed, compared to the norm, change in the content of GGT, Cys, Gly, and Glu is noted, where an increase in Met and a decrease in Gln are compensatory.
Lower levels of Cys, Met, and Glu in saliva were obtained in luminal B HER2(+) and TNBC compared to luminal A and luminal B HER2(−) subtypes of breast cancer. These subtypes of breast cancer have a more aggressive course of the disease with a high index of proliferative activity. In this regard, the biological resources of the body are depleted [36]. This is manifested in a lower content of amino acids and depletion of the immune system [37]. The low content of Cys, Met, and Glu in saliva in this case occurs not due to active synthesis of GSH, but due to maintaining high proliferative activity. Thus, the activity of GGT in saliva in luminal B HER2(+) and TNBC is lower than in the luminal A subtype of breast cancer, while the concentrations of Gly and Gln are at the maximum level. It is known that cancer cells in TNBC have increased expression of SLC7A11, which actively transports cystine (Cys-S-S-Cys) into the cell [32]. Cystine is toxic to the cell due to its low solubility [38]. Therefore, cancer cells constantly reduce cystine to Cys with a large expenditure of NADPH. Thus, the formation of Cys not only affects the synthesis of GSH but also affects PPP and the synthesis of fatty acids [39]. Met in this case is spent on DNA methylation of actively dividing cells, and Glu, under the action of glutamate dehydrogenase (GDH), is converted into alpha-ketoglutaric acid (aKGA) and feeds the tricarboxylic acid (TCA) cycle [40]. High levels of free Gln and Gly indicate reprogramming of cancer cell metabolism, in which these amino acids must be in excess to enable active proliferation. It is known that Gln and Gly transporters are expressed in large quantities in TNBC and HER2(+) [32]. Gln is the main source of nitrogen, which is necessary for the synthesis of nucleotide bases [41]. High levels of Gly can be due to active glycolysis [42], 43]. In addition, Gly can accumulate during GSH degradation and failure of de novo GSH synthesis due to Cys deficiency [44]. As a result, excess Gly is used for the synthesis of nucleotide bases in highly proliferative cells [45].
In the study, patients with the non-luminal subtype of breast cancer have the lowest levels of GGT, Cys, and Glu. This indicates active suppression of antioxidant defense. The Met concentration in this group of patients was higher than in luminal B HER2(+) and TNBC, but lower than in the group of patients with luminal A and luminal B HER2(−) subtypes of breast cancer. There are several reasons for this change: replenishment of a deep Cys deficiency, as well as its participation in DNA methylation of actively dividing cells. The non-luminal subtype of breast cancer is a subgroup of HER2(+) breast cancer, which is characterized by active cell division, the presence of a tendency for cells to increase the metabolism of fatty acids and glycolysis. As has been shown, increased metabolism of fatty acids is a distinctive feature of HER2(+) breast cancer [46], 47]. Cys is involved in the oxidation of the cell overloaded with fatty acids and cholesterols, thereby reducing damage to the internal structure of the cell from ROS [48]. Glu can follow the metabolic pathway of providing the cell with the necessary intracellular energy for active division [49]. In the non-luminal subtype of breast cancer, the Gln level is higher than in the luminal A and luminal B HER2(−) subtypes, but below normal values. In this case, Gln is not spent on the formation of Glu and then GSH, but serves as a source of the necessary amount of nitrogen for rapidly dividing cells. This is confirmed by the low content of GGT, Cys, Glu and the high content of Gly. Gly, as is known, in large quantities is associated with active cell proliferation in oncological diseases, including breast cancer [50].
Then, GGT was measured in the same group of patients 4 weeks after surgery. In all groups of molecular biological subtypes of breast cancer, there was a decrease in the GGT content. The salivary GGT level was maximally close to normal values in the group of patients with TNBC and non-luminal subtypes of breast cancer. In patients with liminal A and luminal B HER2(−), the content of salivary GGT was at a level significantly higher than normal. In the luminal B HER2(+) subtype the decrease in salivary GGT was minimal. We suggest that 4 weeks is an insufficient period to restore metabolic balance and homeostatic equilibrium of antioxidant protection. Subgroups where the values are close to normal actually demonstrate suppressed GSH synthesis before surgery, as evidenced by a relatively low level of GGT compared to other subtypes of breast cancer.
The limitations of the study include the fact that we did not directly measure the GSH content in saliva. It also includes the fact that repeated determination of GGT activity was performed only in a portion of patients who subsequently received adjuvant chemotherapy. It is necessary to increase this group and to determine the concentration of amino acids after surgery in parallel with the GGT analysis. It is also necessary to analyze GGT activity over a longer period to understand the trend of its dynamics during treatment. In addition, the interpretation of the clinical and biological consequences of the observed patterns is not deep enough, which can be done after obtaining additional data in the continuation of the study.
Conclusions
In breast cancer, as in other malignant neoplasms, there is a violation of the oxidation-reduction balance with the formation of an excess of ROS. GSH plays a key role in maintaining antioxidant protection. The main enzyme that directly reflects the activity of GSH metabolism is GGT. The study showed and proved the informativeness of measuring salivary GGT in analyzing the state of antioxidant protection in all breast cancer phenotypes. For a more thorough analysis of GSH metabolism without direct measurement, we assessed the change in key Cys, Gly, Clu, and conjugated amino acids Met, Gln, which are necessary for the synthesis of GSH. We showed that in breast cancer and fibroadenomas, there is activation of antioxidant protection and an increase in the GGT level in saliva compared to normal values. In patients with luminal A and luminal B HER2(−) subtypes of breast cancer, the maximum content of GGT in saliva was shown. In a more aggressive process, with depletion of biological resources, and more pronounced metabolic reprogramming of cancer cells, GSH synthesis is sharply reduced. Thus, salivary GGT activity was slightly higher than normal values in the non-luminal subtype and TNBC. Changes in the level of amino acids Cys, Met, Glu, Gln, and Gly were more pronounced, which is mainly due to the activity of proliferative processes in these subtypes of breast cancer.
In patients in all breast cancer subgroups, 4 weeks after surgery, there is a decrease in GGT with preservation of the residual metabolic pattern of the corresponding breast cancer phenotypes. It is necessary to assess whether metabolic homeostasis is restored after radical therapy and, if so, from what time, and what is planned to be done in the continuation of the study.
Funding source: Russian Science Foundation
Award Identifier / Grant number: 23-15-00188
-
Research ethics: The authors are accountable for all aspects of the work in ensuring that questions related to the accuracy or integrity of any part of the work are appropriately investigated and resolved. The study was conducted in accordance with the Declaration of Helsinki (as revised in 2013). The study was approved by the Ethics Committee of Omsk State Pedagogical University (20 March 2024, protocol code 46-04/2).
-
Informed consent: Informed consent was obtained from all individuals included in this study, or their legal guardians or wards.
-
Author contributions: Conceptualization, Lyudmila V. Bel’skaya; methodology, Lyudmila V. Bel’skaya and Elena A. Sarf; software, Elena I. Dyachenko; validation, Lyudmila V. Bel’skaya, Elena I. Dyachenko and Elena A. Sarf; formal analysis, Lyudmila V. Bel’skaya; investigation, Elena I. Dyachenko and Elena A. Sarf; resources, Lyudmila V. Bel’skaya; data curation, Elena I. Dyachenko and Elena A. Sarf; writing – original draft preparation, Elena I. Dyachenko; writing – review and editing, Lyudmila V. Bel’skaya; visualization, Elena A. Sarf; supervision, Lyudmila V. Bel’skaya; project administration, Lyudmila V. Bel’skaya. All authors have read and agreed to the published version of the manuscript.
-
Use of Large Language Models, AI and Machine Learning Tools: None declared.
-
Conflict of interest: The authors state no conflict of interest.
-
Research funding: The Russian Science Foundation [grant number 23-15-00188] supported this work.
-
Data availability: The raw data can be obtained on request from the corresponding author.
References
1. Vázquez-Meza, H, Vilchis-Landeros, MM, Vázquez-Carrada, M, Uribe-Ramírez, D, Matuz-Mares, D. Cellular compartmentalization, glutathione transport and its relevance in some pathologies. Antioxidants 2023;12:834. https://doi.org/10.3390/antiox12040834.Search in Google Scholar PubMed PubMed Central
2. Mitrić, A, Castellano, I. Targeting gamma-glutamyl transpeptidase: a pleiotropic enzyme involved in glutathione metabolism and in the control of redox homeostasis. Free Radic Biol Med 2023;208:672–83. https://doi.org/10.1016/j.freeradbiomed.2023.09.020.Search in Google Scholar PubMed
3. Gould, RL, Pazdro, R. Impact of supplementary amino acids, micronutrients, and overall diet on glutathione homeostasis. Nutrients 2019;11:1056. https://doi.org/10.3390/nu11051056.Search in Google Scholar PubMed PubMed Central
4. Akaydın, SY, Salihoğlu, EM, Güngör, DG, Karanlık, H, Demokan, S. Correlation between gamma-glutamyl transferase activity and glutathione levels in molecular subgroups of breast cancer. Eur J Breast Health 2019;16:72–6. https://doi.org/10.5152/ejbh.2019.5147.Search in Google Scholar PubMed PubMed Central
5. King, JB, West, MB, Cook, PF, Hanigan, MH. A novel, species-specific class of uncompetitive inhibitors of gamma-glutamyl transpeptidase. J Biol Chem 2009;284:9059–65. https://doi.org/10.1074/jbc.m809608200.Search in Google Scholar PubMed PubMed Central
6. Nonaka, T, Wong, DTW. Saliva diagnostics. Annu Rev Anal Chem (Palo Alto, Calif) 2022;15:107–21. https://doi.org/10.1146/annurev-anchem-061020-123959.Search in Google Scholar PubMed PubMed Central
7. Ali, SA, Habib, S, Ali, A, Moinuddin, Haque, E. Role of salivary markers for diagnosis of systemic diseases. In: Ahmad, MI, Mahamood, M, Javed, M, Alhewairini, SS, editors. Toxicology and human health. Singapore: Springer; 2023.10.1007/978-981-99-2193-5_7Search in Google Scholar
8. Eftekhari, A, Maleki, DS, Sharifi, S, Salatin, S, Khalilov, R, Samiei, M, et al.. Salivary biomarkers in cancer. Adv Clin Chem 2022;110:171–92. https://doi.org/10.1016/bs.acc.2022.06.005.Search in Google Scholar PubMed
9. Song, M, Bai, H, Zhang, P, Zhou, X, Ying, B. Promising applications of human-derived saliva biomarker testing in clinical diagnostics. Int J Oral Sci 2023;15:2. https://doi.org/10.1038/s41368-022-00209-w.Search in Google Scholar PubMed PubMed Central
10. Lee, YH, Wong, DT. Saliva: an emerging biofluid for early detection of diseases. Am J Dentistry 2009;22:241–8.Search in Google Scholar
11. Koopaie, M, Kolahdooz, S, Fatahzadeh, M, Manifar, S. Salivary biomarkers in breast cancer diagnosis: a systematic review and diagnostic meta-analysis. Cancer Med 2022;11:2644–61. https://doi.org/10.1002/cam4.4640.Search in Google Scholar PubMed PubMed Central
12. Wan, HH, Zhu, H, Chiang, CC, Li, JS, Ren, F, Tsai, CT, et al.. High sensitivity saliva-based biosensor in detection of breast cancer biomarkers: HER2 and CA15-3. J Vac Sci Technol 2024;42:023202. https://doi.org/10.1116/6.0003370.Search in Google Scholar PubMed PubMed Central
13. Ilić, IR, Stojanović, NM, Radulović, NS, Živković, VV, Randjelović, PJ, Petrović, AS, et al.. The quantitative ER immunohistochemical analysis in breast cancer: detecting the 3 + 0, 4 + 0, and 5 + 0 allred score cases. Medicina 2019;55:461. https://doi.org/10.3390/medicina55080461.Search in Google Scholar PubMed PubMed Central
14. Wolff, AC, Hammond, MEH, Allison, KH, Harvey, BE, Mangu, PB, Bartlett, JMS, et al.. Human epidermal growth factor receptor 2 testing in breast cancer: American society of clinical oncology/college of American pathologists clinical practice guideline focused update. J Clin Oncol 2018;36:2105–22. https://doi.org/10.1200/jco.2018.77.8738.Search in Google Scholar PubMed
15. Stalhammar, G, Robertson, S, Wedlund, L, Lippert, M, Rantalainen, M, Bergh, J, et al.. Digital image analysis of Ki67 in hot spots is superior to both manual Ki67 and mitotic counts in breast cancer. Histopathology 2018;72:974–89. https://doi.org/10.1111/his.13452.Search in Google Scholar PubMed
16. Gamcsik, MP, Kasibhatla, MS, Teeter, SD, Colvin, OM. Glutathione levels in human tumors. Biomarkers 2012;17:671–91. https://doi.org/10.3109/1354750x.2012.715672.Search in Google Scholar PubMed PubMed Central
17. Dequanter, D, Dok, R, Nuyts, S. Basal oxidative stress ratio of head and neck squamous cell carcinomas correlates with nodal metastatic spread in patients under therapy. OncoTargets Ther 2017;10:259–63. https://doi.org/10.2147/ott.s118980.Search in Google Scholar
18. Estrela, JM, Ortega, A, Mena, S, Sirerol, A, Obrador, E. Glutathione in metastases: from mechanisms to clinical applications. Crit Rev Clin Lab Sci 2016;53:253–67. https://doi.org/10.3109/10408363.2015.1136259.JSearch in Google Scholar PubMed
19. Chen, TH, Wang, HC, Chang, CJ, Lee, SY. Mitochondrial glutathione in cellular redox homeostasis and disease manifestation. Int J Mol Sci 2024;25:1314. https://doi.org/10.3390/ijms25021314.Search in Google Scholar PubMed PubMed Central
20. Georgiou-Siafis, SK, Tsiftsoglou, AS. The key role of GSH in keeping the redox balance in mammalian cells: mechanisms and significance of GSH in detoxification via formation of conjugates. Antioxidants 2023;12:1953. https://doi.org/10.3390/antiox12111953.Search in Google Scholar PubMed PubMed Central
21. Hayes, JD, Dinkova-Kostova, AT, Tew, KD. Oxidative stress in cancer. Cancer Cell 2020;38:167–97. https://doi.org/10.1016/j.ccell.2020.06.001.Search in Google Scholar PubMed PubMed Central
22. Cassier-Chauvat, C, Marceau, F, Farci, S, Ouchane, S, Chauvat, F. The glutathione system: a journey from cyanobacteria to higher eukaryotes. Antioxidants 2023;12:199. https://doi.org/10.3390/antiox12061199.Search in Google Scholar PubMed PubMed Central
23. Townsend, DM, Shen, H, Staros, AL, Gaté, L, Tew, KD. Efficacy of a glutathione S-transferase π-activated prodrug in platinum-resistant ovarian cancer cells. Mol Cancer Therapeut 2002;1:1089–95.Search in Google Scholar
24. Pei, J, Pan, X, Wei, G, Hua, Y. Research progress of glutathione peroxidase family (GPX) in redoxidation. Front Pharmacol 2023;14:1147414. https://doi.org/10.3389/fphar.2023.1147414.Search in Google Scholar PubMed PubMed Central
25. Zhao, Y, Wang, H, Zhou, J, Shao, Q. Glutathione peroxidase GPX1 and its dichotomous roles in cancer. Cancers 2022;14:2560. https://doi.org/10.3390/cancers14102560.Search in Google Scholar PubMed PubMed Central
26. Ferreira, RR, Carvalho, RV, Coelho, LL, Gonzaga, BMDS, Bonecini-Almeida, MDG, Garzoni, LR, et al.. Current understanding of human polymorphism in selenoprotein genes: a review of its significance as a risk biomarker. Int J Mol Sci 2024;25:1402. https://doi.org/10.3390/ijms25031402.Search in Google Scholar PubMed PubMed Central
27. Li, TT, Zhao, DY, Liang, QL, Elsheikha, HM, Wang, M, Sun, LX, et al.. The antioxidant protein glutaredoxin 1 is essential for oxidative stress response and pathogenicity of Toxoplasma gondii. FASEB J 2023;37:e22932. https://doi.org/10.1096/fj.202201275r.Search in Google Scholar
28. Lou, MF. Glutathione and glutaredoxin in redox regulation and cell signaling of the lens. Antioxidants 2022;11:1973. https://doi.org/10.3390/antiox11101973.Search in Google Scholar PubMed PubMed Central
29. Shakhristova, EV, Stepovaya, EA, Nosareva, OL, Rudikov, EV, Novitsky, VV. Glutathione and glutaredoxin in roscovitine-mediated inhibition of breast cancer cell proliferation. Annal Russ Acad Med Sci 2017;72:261–7. https://doi.org/10.15690/vramn849.Search in Google Scholar
30. Kuehne, A, Emmert, H, Soehle, J, Winnefeld, M, Fischer, F, Wenck, H, et al.. Acute activation of oxidative pentose phosphate pathway as first-line response to oxidative stress in human skin cells. Mol Cell 2015;59:359–71. https://doi.org/10.1016/j.molcel.2015.06.017.Search in Google Scholar PubMed
31. Kennedy, L, Sandhu, JK, Harper, ME, Cuperlovic-Culf, M. Role of glutathione in cancer: from mechanisms to therapies. Biomolecules 2020;10:1429. https://doi.org/10.3390/biom10101429.Search in Google Scholar PubMed PubMed Central
32. Dyachenko, EI, Bel’skaya, LV. Transmembrane amino acid transporters in shaping the metabolic profile of breast cancer cell lines: the focus on molecular biological subtype. Curr Issues Mol Biol 2025;47:4.10.3390/cimb47010004Search in Google Scholar PubMed PubMed Central
33. Bonifácio, VDB, Pereira, SA, Serpa, J, Vicente, JB. Cysteine metabolic circuitries: druggable targets in cancer. Br J Cancer 2021;124:862–79. https://doi.org/10.1038/s41416-020-01156-1.Search in Google Scholar PubMed PubMed Central
34. Dornier, E, Rabas, N, Mitchell, L, Novo, D, Dhayade, S, Marco, S, et al.. Glutaminolysis drives membrane trafficking to promote invasiveness of breast cancer cells. Nat Commun 2017;8:2255. https://doi.org/10.1038/s41467-017-02101-2.Search in Google Scholar PubMed PubMed Central
35. Wang, Y, Qi, H, Liu, Y, Duan, C, Liu, X, Xia, T, et al.. The double-edged roles of ROS in cancer prevention and therapy. Theranostics 2021;11:4839–57. https://doi.org/10.7150/thno.56747.Search in Google Scholar PubMed PubMed Central
36. Wang, Z, Jiang, Q, Dong, C. Metabolic reprogramming in triple-negative breast cancer. Cancer Biol Med 2020;17:44–59. https://doi.org/10.20892/j.issn.2095-3941.2019.0210.Search in Google Scholar PubMed PubMed Central
37. Zheng, Y, Yao, Y, Ge, T, Ge, S, Jia, R, Song, X, et al.. Amino acid metabolism reprogramming: shedding new light on T cell anti-tumor immunity. J Exp Clin Cancer Res 2023;42:291. https://doi.org/10.1186/s13046-023-02845-4.Search in Google Scholar PubMed PubMed Central
38. Tang, X, Chen, W, Liu, H, Liu, N, Chen, D, Tian, D, et al.. Research progress on SLC7A11 in the regulation of cystine/cysteine metabolism in tumors. Oncol Lett 2022;23:47. https://doi.org/10.3892/ol.2021.13165.Search in Google Scholar PubMed PubMed Central
39. Liu, X, Olszewski, K, Zhang, Y, Lim, EW, Shi, J, Zhang, X, et al.. Cystine transporter regulation of pentose phosphate pathway dependency and disulfide stress exposes a targetable metabolic vulnerability in cancer. Nat Cel Biol 2020;22:476–86. https://doi.org/10.1038/s41556-020-0496-x.Search in Google Scholar PubMed PubMed Central
40. Atlante, S, Visintin, A, Marini, E, Savoia, M, Dianzani, C, Giorgis, M, et al.. α-ketoglutarate dehydrogenase inhibition counteracts breast cancer-associated lung metastasis. Cell Death Dis 2018;9:756. https://doi.org/10.1038/s41419-018-0802-8.Search in Google Scholar PubMed PubMed Central
41. Wang, B, Pei, J, Xu, S, Liu, J, Yu, J. A glutamine tug-of-war between cancer and immune cells: recent advances in unraveling the ongoing battle. J Exp Clin Cancer Res 2024;43:74. https://doi.org/10.1186/s13046-024-02994-0.Search in Google Scholar PubMed PubMed Central
42. Li, AM, Ye, J. Reprogramming of serine, glycine and one-carbon metabolism in cancer. Biochim Biophys Acta, Mol Basis Dis 2020;1866:165841. https://doi.org/10.1016/j.bbadis.2020.165841.Search in Google Scholar PubMed PubMed Central
43. Sánchez-Castillo, A, Kampen, KR. Understanding serine and glycine metabolism in cancer: a path towards precision medicine to improve patient’s outcomes. Discov Oncol 2024;15:652. https://doi.org/10.1007/s12672-024-01544-6.Search in Google Scholar PubMed PubMed Central
44. Amelio, I, Cutruzzolá, F, Antonov, A, Agostini, M, Melino, G. Serine and glycine metabolism in cancer. Trends Biochem Sci 2014;39:191–8. https://doi.org/10.1016/j.tibs.2014.02.004.Search in Google Scholar PubMed PubMed Central
45. Di Salvo, ML, Contestabile, R, Paiardini, A, Maras, B. Glycine consumption and mitochondrial serine hydroxymethyltransferase in cancer cells: the heme connection. Med Hypotheses 2013;80:633–6. https://doi.org/10.1016/j.mehy.2013.02.008.Search in Google Scholar PubMed
46. Wang, L, Zhang, S, Wang, X. The metabolic mechanisms of breast cancer metastasis. Front Oncol 2021;10:602416. https://doi.org/10.3389/fonc.2020.602416.Search in Google Scholar PubMed PubMed Central
47. Menendez, JA, Vellon, L, Mehmi, I, Oza, BP, Ropero, S, Colomer, R, et al.. Inhibition of fatty acid synthase (FAS) suppresses HER2/neu (erbB-2) oncogene overexpression in cancer cells. Proc Natl Acad Sci USA 2004;101:10715–20. https://doi.org/10.1073/pnas.0403390101.Search in Google Scholar PubMed PubMed Central
48. Wang, YJ, Bian, Y, Luo, J, Lu, M, Xiong, Y, Guo, SY, et al.. Cholesterol and fatty acids regulate cysteine ubiquitylation of ACAT2 through competitive oxidation. Nat Cel Biol 2017;19:808–19. https://doi.org/10.1038/ncb3551.Search in Google Scholar PubMed PubMed Central
49. Kim, SY. Cancer energy metabolism: shutting power off cancer factory. Biomol Ther (Seoul) 2018;26:39–44. https://doi.org/10.4062/biomolther.2017.184.Search in Google Scholar PubMed PubMed Central
50. Yang, X, Wang, Z, Li, X, Liu, B, Liu, M, Liu, L, et al.. SHMT2 desuccinylation by SIRT5 drives cancer cell proliferation. Cancer Res 2018;78:372–86. https://doi.org/10.1158/0008-5472.can-17-1912.Search in Google Scholar
© 2025 the author(s), published by De Gruyter on behalf of Tech Science Press (TSP)
This work is licensed under the Creative Commons Attribution 4.0 International License.
Articles in the same Issue
- Frontmatter
- Review Articles
- Unveiling the hidden role of tumor-educated platelets in cancer: a promising marker for early diagnosis and treatment
- Multiple roles of mitochondria in tumorigenesis and treatment: from mechanistic insights to emerging therapeutic strategies
- The impact of JMJD5 on tumorigenesis: a literature review
- Research Articles
- A case-matched comparison of ER-α and ER-β expression between malignant and benign cystic pancreatic lesions
- Salivary gamma-glutamyltransferase activity as an indicator of redox homeostasis in breast cancer
- Cancer can be suppressed by alkalizing the tumor microenvironment: the effectiveness of “alkalization therapy” in cancer treatment
- Percutaneous-assisted laparoscopic bilateral salpingo-oophorectomy in BRCA-mutated patients: a retrospective comparative study
- ACAT2 contributes to cervical cancer tumorigenesis by regulating the expression of the downstream gene LATS1
- Rapid Communication
- Efficacy of mild hyperthermia in cancer therapy: balancing temperature and duration
- Case Report
- Orbital marginal zone B-cell lymphoma of mucosa-associated lymphoid tissue with amyloidosis: a case series and review of the literature
- Commentary
- Palliative external beam radiotherapy for dysphagia management in advanced esophageal cancer: a narrative perspective
- Endometriosis and endometriosis-associated ovarian cancer, possible connection and early diagnosis by evaluation of plasma microRNAs