Declining but uneven: global evolution of maternal hemorrhage burden and its future trajectory
-
Hongqiao Wang


Abstract
Objectives
Maternal hemorrhage is a leading cause of maternal morbidity and mortality worldwide, with significant regional disparities. This study utilizes the most recent Global Burden of Disease (GBD) 2021 data to examine global and regional trends in maternal hemorrhage from 1990 to 2021.
Methods
We analyzed the incidence, mortality, and disability-adjusted life years (DALYs) attributable to maternal hemorrhage across 204 countries and territories. We calculated the Estimated Annual Percentage Change (EAPC) for key indicators and projected future trends using Bayesian age-period-cohort models.
Results
From 1990 to 2021, global maternal hemorrhage incidence declined from 14.17 million to 13.96 million cases, and age-standardized incidence rate (ASIR) decreased from 245.34 to 176.89 per 100,000 (EAPC: −0.835 %), with particularly high rates in Central and Western Sub-Saharan Africa. DALYs attributed to maternal hemorrhage dropped from 7.1 million to 2.96 million, with the age-standardized DALYs rate (ASDR) falling from 125.29 to 37.47 per 100,000 (EAPC: −3.975 %). Mortality also decreased from 114,112 to 46,874 deaths, and the age-standardized mortality rate (ASMR) declined from 2.04 to 0.59 per 100,000 (EAPC: −4.055 %), with the largest reductions in East Asia and South Asia. Regions with lower socio-demographic index experienced high incidence, DALYs, and mortality rates. Projections to 2050 suggest a continued global decline in all indicators.
Conclusions
Despite overall reductions in the global burden of maternal hemorrhage, significant regional disparities persist, particularly in low-resource settings. Targeted interventions in high-burden regions, such as Sub-Saharan Africa, are crucial to further reduce maternal morbidity and mortality.
Introduction
Maternal hemorrhage, one of the leading causes of maternal mortality and morbidity globally, including antepartum, intrapartum, and postpartum bleeding, represents a significant public health challenge [1], 2]. Despite substantial advancements in maternal healthcare over recent decades, this condition remains a key contributor to poor maternal outcomes, particularly in low-resource settings [3]. Globally, maternal hemorrhage accounts for a substantial proportion of maternal deaths, with its incidence and burden varying significantly across regions, influenced by a range of sociodemographic and healthcare factors [4].
The Global Burden of Disease (GBD) 2021 study provides the most recent and comprehensive data on the incidence, mortality, and disability-adjusted life years (DALYs) attributable to maternal hemorrhage across 204 countries and territories from 1990 to 2021 [5]. By leveraging robust Bayesian meta-regression methods, the GBD study integrates diverse sources of data, including surveys, cohort studies, and hospital records, to offer standardized estimates that reflect both regional differences and global trends. This large-scale analysis allows for a nuanced understanding of maternal hemorrhage trends, accounting for factors such as the Sociodemographic Index (SDI), which serves as a composite measure of a region’s development based on fertility rates, income, and educational attainment [6].
Despite overall reductions in maternal hemorrhage-related deaths and DALYs globally, significant regional disparities persist. Areas with lower SDI, such as Sub-Saharan Africa, continue to experience high incidence and mortality rates, reflecting broader challenges related to healthcare access, socioeconomic conditions, and the availability of skilled birth attendants [7], [8], [9]. On the other hand, high-income regions have seen greater reductions in maternal hemorrhage rates [10], 11]. These variations highlight the ongoing need for targeted interventions that address the specific health systems and socioeconomic barriers in high-burden regions.
To the best of our knowledge, the GBD 2021 data has not yet been used for a comprehensive analysis of maternal hemorrhage. This study aims to examine the global and regional trends in maternal hemorrhage from 1990 to 2021, with projections extending to 2050. By analyzing the incidence, mortality, and DALYs associated with maternal hemorrhage, we aim to assess progress made in reducing the burden of this condition while highlighting areas that still require attention to achieve further reductions in maternal morbidity and mortality worldwide.
Materials and methods
Overview and data collection
We obtained data on maternal hemorrhage from the Global Burden of Disease (GBD) 2021 study, which provides standardized estimates across 204 countries and territories between 1990 and 2021. Data were accessed via the Global Health Data Exchange platform (https://vizhub.healthdata.org/gbd-results/). Maternal hemorrhage was defined according to GBD criteria, encompassing bleeding occurring before, during, and after childbirth. All indicators, including incidence, mortality, and disability-adjusted life years (DALYs), were age-standardized to facilitate comparisons across regions and time periods. The data were derived using the DisMod-MR 2.1 Bayesian meta-regression model, which synthesizes multiple sources such as household surveys, cohort studies, and medical records [12]. Sociodemographic characteristics, including SDI, were used as covariates to improve regional estimates. Each estimate was accompanied by a 95 % uncertainty interval (UI) [13].
Calculation of estimated annual percentage change
To assess temporal trends in age-standardized rates (ASR), we calculated the Estimated Annual Percentage Change (EAPC) [14], 15]. This metric is derived from a log-linear regression model, where the natural logarithm of ASR is regressed against calendar year. The regression coefficient (β) from the model is used in the formula: EAPC=100 × (exp(β) −1). This calculation reflects the average annual rate of change over the study period. A negative EAPC indicates a decreasing trend, while a positive value indicates an increase [16]. The EAPC log-linear regression results and p-values of regression coefficients were shown in the Supplementary materials.
Sociodemographic index
The Sociodemographic Index (SDI) is a composite measure that reflects a country’s level of development based on fertility rates, average income per capita, and educational attainment. The SDI ranges from 0 to 1, with higher values denoting greater development. In this study, countries and regions were categorized into five groups based on SDI [17], listed from highest to lowest: high (>0.81), high-middle (0.70–0.81), middle (0.61–0.69), low-middle (0.46–0.60), and low (<0.46). This classification was used to assess disparities in maternal hemorrhage burden across different levels of development [17], [18], [19].
Statistical analysis
We analyzed global and regional patterns of maternal hemorrhage using measures of incidence, mortality, DALYs, and their corresponding age-standardized rates per 100,000 population. Each estimate was reported with 95 % UIs to account for statistical uncertainty [18]. In addition to trend analyses, we assessed the association between the Sociodemographic Index (SDI) and age-standardized indicators (ASIR, ASDR, and ASMR). Because SDI is an ordinal variable, Spearman rank correlation coefficients were calculated. All correlation coefficients were reported with the corresponding r value, 95 % confidence interval, and p-value. To forecast future trends up to 2050, we applied a Bayesian age-period-cohort (BAPC) model, which separates the effects of age, time period, and birth cohort [20], 21]. The model was implemented using Integrated Nested Laplace Approximation (INLA) for Bayesian inference [22], 23]. All statistical analyses were conducted in R software (version 4.2.1), and p-values <0.05 were considered statistically significant.
Results
Global and regional trends in maternal hemorrhage incidence, DALYs, and mortality
Incidence
Between 1990 and 2021, the global incidence of maternal hemorrhage exhibited significant heterogeneity (Table 1). The number of cases worldwide declined from 14,172,389 (95 % uncertainty interval [UI]: 10,815,094–18,802,300) in 1990 to 13,960,250 (UI: 10,898,097–17,749,443) in 2021. The age-standardized incidence rate (ASIR) decreased from 245.34 per 100,000 population (UI: 189.40–321.95) to 176.89 per 100,000 (UI: 138.25–225.83), with an EAPC of −0.835 % (UI: −0.898 % to −0.772 %).
Incidence of maternal hemorrhage between 1990 and 2021 at the global and regional level.
| Incidence | Number of cases, 1990 | Age-standardised rate per 100,000 population, 1990 | Number of cases, 2021 | Age-standardised rate per 100,000 population, 2021 | EAPCs |
|---|---|---|---|---|---|
| Global | 14,172,388.669 (10,815,094.048, 18,802,299.823) | 245.340 (189.400, 321.952) | 13,960,249.964 (10,898,097.092, 17,749,443.310) | 176.889 (138.252, 225.831) | −0.835 (−0.898, −0.772) |
| Low SDI | 2,765,259.339 (2,148,553.723, 3,614,594.128) | 596.022 (468.891, 767.924) | 4,243,113.832 (3,262,832.125, 5,529,648.857) | 376.007 (293.454, 484.006) | −1.511 (−1.633, −1.389) |
| Low-middle SDI | 3,925,078.284 (3,025,497.030, 5,128,124.469) | 336.863 (260.492, 432.832) | 3,726,062.018 (2,846,459.636, 4,882,641.080) | 176.550 (135.911, 230.525) | −2.070 (−2.160, −1.979) |
| Middle SDI | 4,286,746.722 (3,209,334.096, 5,734,836.210) | 215.463 (163.680, 284.939) | 3,515,030.679 (2,730,661.699, 4,519,075.530) | 141.811 (109.927, 182.552) | −0.836 (−1.046, −0.625) |
| High-middle SDI | 2,086,379.734 (1,516,507.502, 2,813,378.468) | 172.058 (125.413, 232.064) | 1,520,302.937 (1,177,794.892, 1,927,968.075) | 125.487 (96.766, 159.989) | −0.375 (−0.703, −0.046) |
| High SDI | 1,095,856.951 (839,961.155, 1,418,539.653) | 117.503 (90.373, 152.775) | 944,655.459 (748,244.666, 1,183,370.316) | 93.101 (73.449, 115.753) | −0.822 (−0.895, −0.750) |
| Andean Latin America | 197,053.741 (150,206.229, 257,486.575) | 494.871 (378.036, 644.093) | 216,714.920 (168,744.491, 272,524.804) | 301.283 (234.936, 378.441) | −1.420 (−1.493, −1.347) |
| Australasia | 38,991.299 (31,139.350, 48,055.465) | 179.006 (143.200, 220.866) | 47,255.627 (35,970.714, 61,855.316) | 158.414 (121.141, 206.018) | −0.220 (−0.514, 0.075) |
| Caribbean | 84,976.089 (64,835.753, 112,711.708) | 213.462 (164.066, 279.966) | 70,795.867 (54,649.168, 90,996.577) | 147.131 (113.625, 189.038) | −1.180 (−1.227, −1.133) |
| Central Asia | 141,154.143 (105,473.203, 194,055.122) | 186.558 (140.584, 253.588) | 129,849.922 (98,383.675, 173,662.730) | 131.116 (99.098, 176.346) | −0.755 (−0.934, −0.577) |
| Central Europe | 308,478.773 (219,940.936, 411,067.532) | 261.564 (186.098, 349.709) | 168,734.230 (134,045.167, 212,066.696) | 177.126 (140.055, 220.471) | −0.909 (−1.239, −0.577) |
| Central Latin America | 670,048.032 (511,170.087, 887,785.672) | 378.132 (289.952, 493.048) | 589,875.581 (462,860.379, 752,632.968) | 220.180 (172.850, 280.615) | −1.476 (−1.695, −1.256) |
| Central Sub-Saharan Africa | 382,670.894 (294,230.851, 500,884.351) | 752.429 (583.225, 977.414) | 593,644.545 (453,612.420, 770,869.494) | 445.477 (342.239, 575.200) | −1.532 (−1.732, −1.331) |
| East Asia | 2,366,513.093 (1,671,494.619, 3,304,268.290) | 151.824 (107.629, 211.018) | 1,453,429.543 (1,066,128.868, 1,874,864.106) | 111.575 (82.146, 143.517) | −0.049 (−0.673, 0.580) |
| Eastern Europe | 417,704.134 (298,064.553, 569,281.227) | 197.448 (139.273, 269.886) | 271,214.315 (203,158.094, 363,375.754) | 155.244 (114.891, 209.410) | 0.197 (−0.237, 0.632) |
| Eastern Sub-Saharan Africa | 1,179,108.064 (906,747.465, 1,556,186.099) | 654.849 (508.736, 848.407) | 1,751,590.341 (1,327,067.856, 2,329,102.368) | 394.655 (305.407, 516.338) | −1.638 (−1.729, −1.546) |
| High-income Asia Pacific | 76,378.937 (56,218.046, 102,573.185) | 43.611 (32.012, 58.734) | 57,594.604 (41,737.418, 77,516.403) | 37.755 (27.180, 50.271) | −0.327 (−0.458, −0.196) |
| High-income North America | 350,891.184 (266,882.882, 457,955.433) | 115.634 (89.058, 150.948) | 341,573.325 (280,780.879, 412,586.644) | 100.057 (82.168, 120.543) | −0.875 (−1.214, −0.534) |
| North Africa and Middle East | 1,061,436.462 (797,779.902, 1,431,028.495) | 306.452 (234.646, 408.210) | 970,427.291 (739,897.705, 1,291,553.095) | 144.798 (110.741, 192.555) | −2.066 (−2.204, −1.927) |
| Oceania | 21,653.933 (16,137.469, 28,755.868) | 320.674 (242.774, 420.007) | 35,964.870 (27,158.408, 47,401.857) | 244.386 (184.573, 321.791) | −0.881 (−0.932, −0.830) |
| South Asia | 3,392,057.223 (2,527,667.368, 4,449,732.411) | 303.223 (228.714, 392.647) | 2,886,167.328 (2,134,534.642, 3,865,090.844) | 137.713 (102.322, 183.585) | −2.661 (−2.835, −2.486) |
| Southeast Asia | 1,369,838.710 (1,047,358.190, 1,778,053.133) | 272.845 (210.284, 351.483) | 1,277,600.438 (988,744.581, 1,625,306.724) | 171.340 (133.000, 217.860) | −1.231 (−1.384, −1.079) |
| Southern Latin America | 144,556.642 (105,811.495, 192,376.916) | 287.858 (210.469, 382.583) | 131,609.912 (104,100.591, 170,413.581) | 189.243 (149.602, 244.644) | −1.245 (−1.317, −1.172) |
| Southern Sub-Saharan Africa | 103,934.685 (82,180.313, 134,723.690) | 189.880 (151.283, 241.906) | 118,796.917 (91,803.477, 154,782.650) | 132.871 (102.860, 172.691) | −0.669 (−0.861, −0.477) |
| Tropical Latin America | 129,476.552 (106,161.905, 154,967.812) | 75.676 (61.989, 90.114) | 219,949.606 (173,243.046, 279,819.361) | 94.763 (74.659, 120.565) | 1.281 (0.651, 1.916) |
| Western Europe | 505,241.416 (383,267.201, 657,514.182) | 128.218 (97.229, 166.690) | 418,081.514 (326,710.785, 530,674.281) | 112.701 (88.213, 142.926) | −0.446 (−0.511, −0.381) |
| Western Sub-Saharan Africa | 1,230,224.663 (955,852.620, 1,608,777.211) | 691.455 (536.672, 898.219) | 2,209,379.268 (1,699,190.798, 2,848,008.252) | 471.839 (364.181, 606.132) | −1.139 (−1.236, −1.042) |
In low SDI regions, the number of cases increased from 2,765,259 (UI: 2,148,554–3,614,594) to 4,243,114 (UI: 3,262,832–5,529,649), yet the ASIR declined from 596.02 per 100,000 (UI: 468.89–767.92) to 376.01 per 100,000 (UI: 293.45–484.01), yielding an EAPC of −1.511 % (UI: −1.633 % to −1.389 %). The largest ASIR reduction occurred in low-middle SDI regions (EAPC: −2.070 %; UI: −2.160 % to −1.979 %), while high SDI regions demonstrated a decrease from 117.50 per 100,000 (UI: 90.37–152.78) to 93.10 per 100,000 (UI: 73.45–115.75), with an EAPC of −0.822 % (UI: −0.895 % to −0.750 %).
In 2021, the ASIR of maternal hemorrhage showed significant regional variations, with the highest rates observed in Sub-Saharan Africa, particularly in Central Sub-Saharan Africa (445.477 per 100,000) and Western Sub-Saharan Africa (471.839 per 100,000). Conversely, the lowest ASIR was recorded in High-Income Asia Pacific (37.755 per 100,000) (Figure 1A). The EAPC indicated a general decline in ASIR across most regions, with the most substantial decreases in South Asia (−2.661) and North Africa and Middle East (−2.066). However, Tropical Latin America experienced an increase in ASIR (EAPC of 1.281), highlighting a concerning upward trend in this region (Figure 1B).
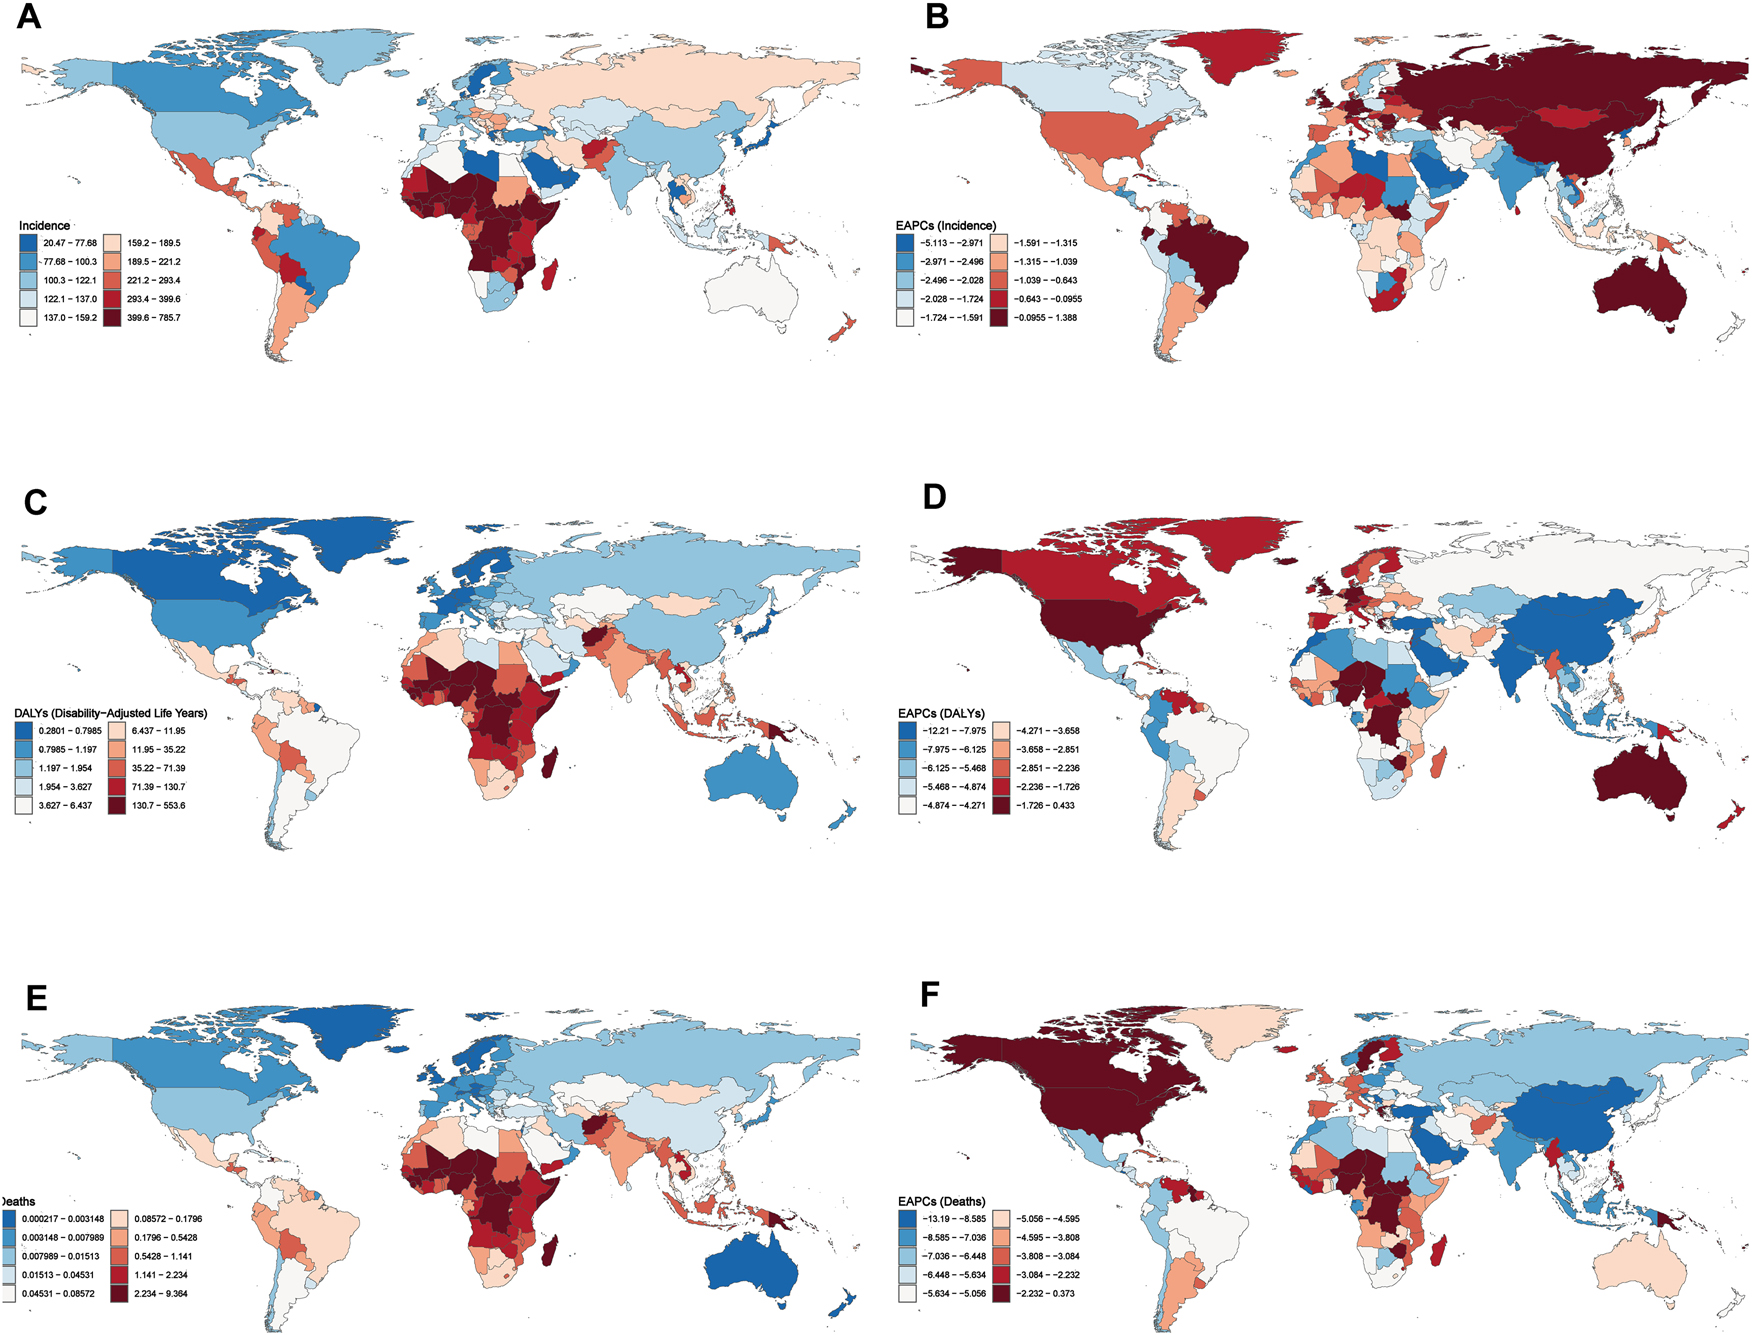
Global distribution of age-standardized rates and estimated annual percentage change (EAPC) for maternal hemorrhage in 2021. (A) Age-standardized incidence rate (ASIR) per 100,000 population. (B) EAPC in ASIR from 1990 to 2021. (C) Age-standardized disability-adjusted life years rate (ASDR) per 100,000 population. (D) EAPC in ASDR from 1990 to 2021. (E) Age-standardized mortality rate (ASMR) per 100,000 population. (F) EAPC in ASMR from 1990 to 2021.
Regional analyses highlighted persistent burdens in sub-Saharan Africa (Figure 2A). South Asia showed the most pronounced ASIR reduction (EAPC: −2.661 %; UI: −2.835 % to −2.486 %), achieving an ASIR of 137.71 per 100,000 (UI: 102.32–183.59) by 2021. Notably, Tropical Latin America was the sole region with an upward trend, as its ASIR increased from 75.68 per 100,000 (UI: 61.99–90.11) to 94.76 per 100,000 (UI: 74.66–120.57), corresponding to an EAPC of 1.281 % (UI: 0.651–1.916 %). Among high-income regions, North America reported a decline in ASIR from 115.63 per 100,000 (UI: 89.06–150.95) to 100.06 per 100,000 (UI: 82.17–120.54), with an EAPC of −0.875 % (UI: −1.214 % to −0.534 %). Similarly, the Asia Pacific high-income region reduced its ASIR from 43.61 per 100,000 (UI: 32.01–58.73) to 37.75 per 100,000 (UI: 27.18–50.27), reflecting an EAPC of −0.327 % (UI: −0.458 % to −0.196 %) (Figure 2A).
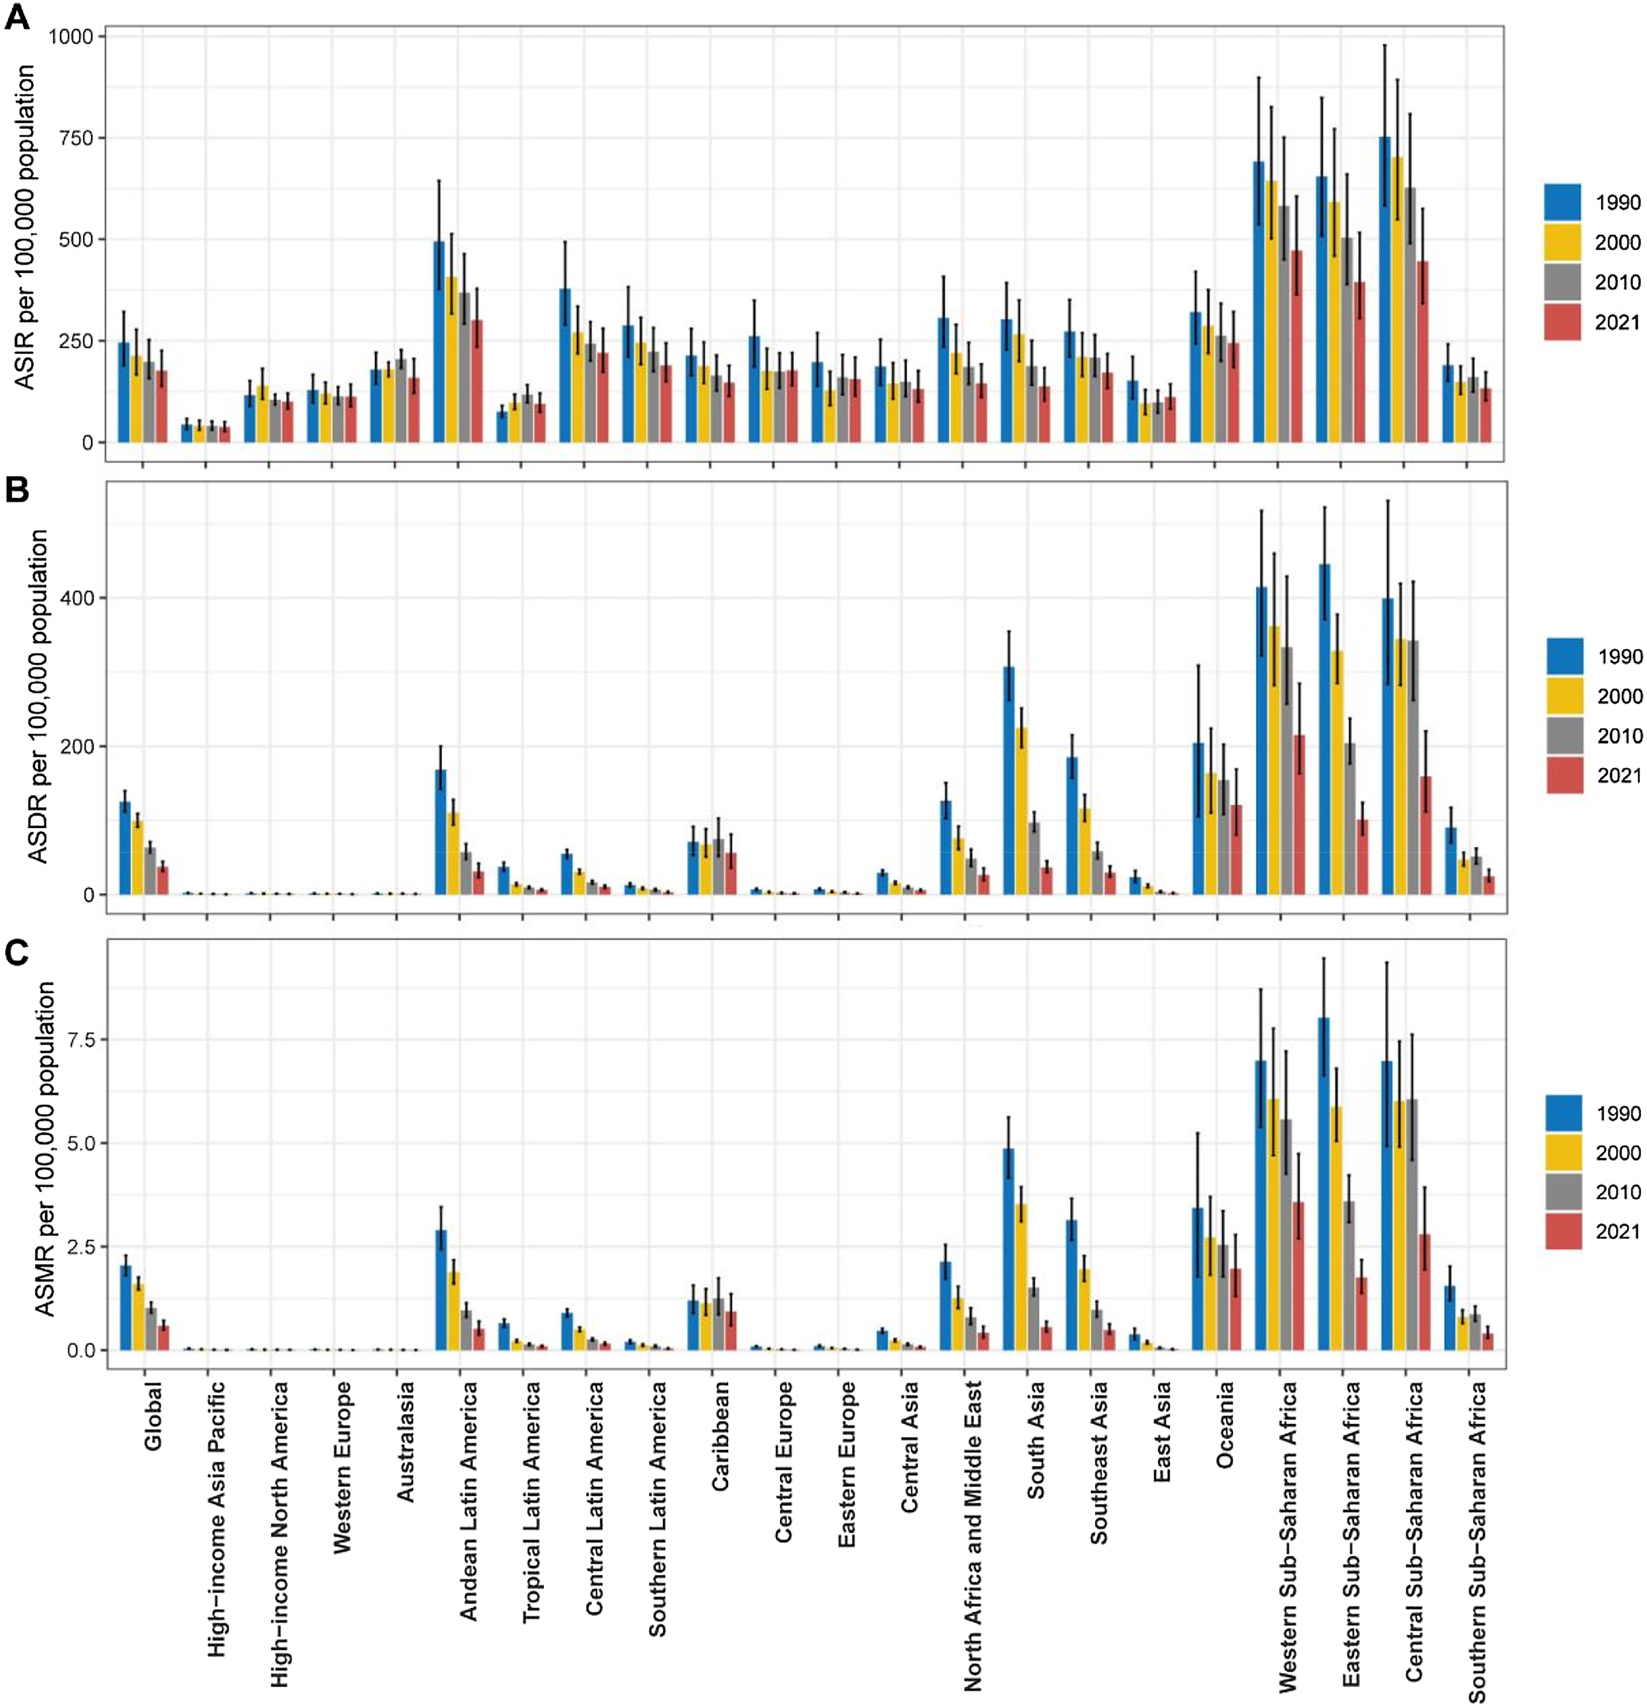
Temporal trends in the age-standardized incidence rate (ASIR), age-standardized DALYs rate (ASDR), and age-standardized mortality rate (ASMR) of maternal hemorrhage from 1990 to 2021 by region. (A) ASIR per 100,000 population, (B) ASDR per 100,000 population, and (C) ASMR per 100,000 population. Regions are grouped and color-coded for the years 1990, 2000, 2010, and 2021.
DALYs
The global DALYs attributed to maternal hemorrhage decreased from 7,113,588 (UI: 6,327,447–7,938,280) in 1990 to 2,955,463 (UI: 2,492,505–3,536,901) in 2021, with age-standardized DALYs rate (ASDR) declining from 125.286 per 100,000 (UI: 111.641–139.905) to 37.465 per 100,000 (UI: 31.586–44.817), and an EAPC of −3.975 % (UI: −4.177 % to −3.774 %) (Table 2).
Disability-adjusted life years (DALYs) of maternal hemorrhage between 1990 and 2021 at the global and regional level.
| Number of cases, 1990 | Age-standardised rate per 100,000 population, 1990 | Number of cases, 2021 | Age-standardised rate per 100,000 population, 2021 | EAPCs | |
|---|---|---|---|---|---|
| Global | 7,113,587.660 (6,327,446.665, 7,938,279.728) | 125.286 (111.641, 139.905) | 2,955,462.594 (2,492,505.011, 3,536,900.732) | 37.465 (31.586, 44.817) | −3.975 (−4.177, −3.774) |
| Low SDI | 2,050,655.926 (1,738,321.299, 2,346,703.709) | 462.093 (392.001, 528.944) | 1,656,339.902 (1,343,651.522, 2,010,275.859) | 151.377 (122.435, 183.840) | −3.501 (−3.748, −3.253) |
| Low-middle SDI | 3,261,985.303 (2,842,736.169, 3,655,581.135) | 278.982 (244.421, 312.312) | 926,002.486 (785,279.122, 1,108,291.653) | 44.073 (37.400, 52.684) | −6.065 (−6.394, −5.734) |
| Middle SDI | 1,561,528.060 (1,357,818.501, 1,814,535.926) | 81.375 (70.572, 94.581) | 331,977.593 (284,752.879, 395,179.015) | 13.438 (11.507, 15.999) | −5.884 (−6.076, −5.691) |
| High-middle SDI | 201,244.086 (164,710.733, 240,332.532) | 17.022 (13.918, 20.314) | 28,562.178 (23,199.504, 35,197.503) | 2.363 (1.904, 2.910) | −6.271 (−6.434, −6.108) |
| High SDI | 34,264.568 (26,148.550, 43,379.559) | 3.647 (2.783, 4.607) | 9,990.450 (7,708.944, 12,747.884) | 0.981 (0.758, 1.249) | −3.779 (−3.984, −3.573) |
| Andean Latin America | 61,239.761 (51,694.943, 72,915.462) | 168.426 (142.441, 200.007) | 22,279.184 (16,548.975, 30,124.322) | 31.258 (23.247, 42.214) | −5.891 (−6.177, −5.604) |
| Australasia | 363.938 (266.652, 487.164) | 1.670 (1.224, 2.232) | 266.040 (160.850, 399.374) | 0.896 (0.544, 1.329) | −1.794 (−2.096, −1.492) |
| Caribbean | 25,984.574 (19,616.918, 33,345.908) | 71.169 (53.453, 91.781) | 27,261.600 (17,462.303, 39,445.023) | 56.350 (36.111, 81.620) | −0.100 (−0.499, 0.300) |
| Central Asia | 21,062.316 (18,679.363, 23,559.517) | 29.528 (26.100, 33.048) | 5,901.637 (4,686.893, 7,112.042) | 5.844 (4.645, 7.031) | −5.165 (−5.389, −4.941) |
| Central Europe | 8,765.073 (7,361.795, 10,385.562) | 7.115 (5.936, 8.410) | 1,667.306 (1,177.091, 2,229.180) | 1.710 (1.215, 2.287) | −4.182 (−4.603, −3.759) |
| Central Latin America | 91,977.667 (82,047.820, 101,412.585) | 55.033 (49.355, 60.542) | 28,164.171 (23,165.549, 33,914.676) | 10.478 (8.616, 12.614) | −5.263 (−5.489, −5.038) |
| Central Sub-Saharan Africa | 185,898.072 (131,615.388, 244,861.666) | 399.303 (283.857, 531.187) | 197,100.439 (138,548.447, 269,517.379) | 159.261 (112.029, 220.199) | −2.245 (−2.777, −1.709) |
| East Asia | 343,722.625 (239,839.712, 466,401.053) | 23.678 (16.477, 32.225) | 26,359.523 (20,169.759, 34,210.921) | 1.982 (1.526, 2.583) | −7.899 (−8.194, −7.604) |
| Eastern Europe | 16,282.010 (13,748.027, 19,438.911) | 7.249 (6.118, 8.645) | 2,945.300 (2,159.041, 3,959.568) | 1.627 (1.176, 2.230) | −4.391 (−4.619, −4.162) |
| Eastern Sub-Saharan Africa | 679,824.048 (571,707.193, 791,355.291) | 445.199 (371.045, 522.081) | 405,742.651 (328,082.245, 494,980.421) | 101.235 (81.013, 124.004) | −4.790 (−5.073, −4.505) |
| High-income Asia Pacific | 4,175.616 (3,517.328, 4982.708) | 2.334 (1.960, 2.785) | 843.210 (656.722, 1,087.704) | 0.554 (0.434, 0.713) | −4.509 (−4.672, −4.346) |
| High-income North America | 5,588.456 (4,392.691, 6958.056) | 1.839 (1.444, 2.283) | 3,516.373 (2,738.944, 4,608.568) | 1.030 (0.803, 1.353) | −1.561 (−1.738, −1.385) |
| North Africa and Middle East | 411,098.019 (334,041.115, 488,278.628) | 126.825 (102.960, 150.720) | 178,055.561 (129,880.565, 240,286.627) | 26.519 (19.318, 35.769) | −4.717 (−4.811, −4.622) |
| Oceania | 13,332.523 (6,770.275, 20,140.826) | 204.480 (105.533, 308.849) | 17,766.005 (11,804.804, 24,767.747) | 120.980 (80.500, 169.193) | −1.512 (−1.652, −1.372) |
| South Asia | 3,516,781.723 (2,992,465.416, 4,075,472.678) | 307.135 (262.301, 354.975) | 769,146.251 (628,147.366, 951,582.474) | 36.514 (29.806, 45.181) | −7.239 (−7.704, −6.771) |
| Southeast Asia | 898,081.945 (760,946.508, 1,043,428.545) | 185.204 (157.264, 215.113) | 223,539.956 (180,152.509, 287,572.001) | 29.844 (24.060, 38.458) | −5.980 (−6.139, −5.821) |
| Southern Latin America | 6,365.108 (5,164.299, 7783.574) | 12.926 (10.505, 15.814) | 2,274.464 (1,749.364, 3,015.137) | 3.249 (2.495, 4.296) | −3.713 (−3.983, −3.443) |
| Southern Sub-Saharan Africa | 46,192.368 (35,592.260, 59,499.321) | 90.599 (70.082, 117.341) | 21,827.641 (15,743.849, 30,116.771) | 24.650 (17.761, 34.038) | −2.736 (−3.807, −1.653) |
| Tropical Latin America | 58,936.008 (50,141.054, 68,398.262) | 37.458 (31.970, 43.443) | 15,205.293 (12,667.195, 18,067.804) | 6.376 (5.300, 7.593) | −4.763 (−5.166, −4.358) |
| Western Europe | 6,481.608 (5,136.514, 7,884.490) | 1.641 (1.298, 1.994) | 2,873.947 (1,979.847, 3,937.787) | 0.771 (0.531, 1.053) | −2.097 (−2.261, −1.933) |
| Western Sub-Saharan Africa | 711,434.203 (553,641.742, 890,545.294) | 414.730 (322.641, 517.521) | 1,002,726.041 (759,852.486, 1,329,088.922) | 215.192 (163.465, 284.653) | −1.628 (−1.874, −1.383) |
Low SDI regions accounted for the highest DALY burden, with DALYs decreasing from 2,050,656 (UI: 1,738,321–2,346,704) to 1,656,340 (UI: 1,343,652–2,010,276), and ASDR declining from 462.093 per 100,000 (UI: 392.001–528.944) to 151.377 per 100,000 (UI: 122.435–183.840), with an EAPC of −3.501 % (UI: −3.748 % to −3.253 %). Low-middle SDI regions showed the largest ASDR reduction (EAPC: −6.065 %; UI: −6.394 % to −5.734 %), with ASDR falling from 278.982 per 100,000 (UI: 244.421–312.312) to 44.073 per 100,000 (UI: 37.400–52.684).
In 2021, the ASDR also exhibited significant regional disparities, with the highest burden observed in Sub-Saharan Africa, particularly in Central Sub-Saharan Africa (159.261 per 100,000) and Western Sub-Saharan Africa (215.192 per 100,000). In contrast, the lowest ASDR were recorded in High-Income Asia Pacific (0.554 per 100,000) and Western Europe (0.771 per 100,000) (Figure 1C). The EAPC indicated a substantial global decline in DALYs (−3.975), with the most pronounced reductions in South Asia (−7.239) and East Asia (−7.899). However, the Caribbean region showed minimal change (EAPC of −0.100), suggesting stagnation in reducing the burden of maternal hemorrhage (Figure 1D).
Regionally, sub-Saharan Africa reported the highest ASDR burden from 1990 to 2021 while South Asia demonstrated the most significant ASDR reduction with ASDR falling from 307.135 per 100,000 (UI: 262.301–354.975) to 36.514 per 100,000 (UI: 29.806–45.181) (Figure 2B).
Mortality
Globally, maternal hemorrhage deaths decreased from 114,112 (95 % uncertainty interval [UI]: 101,092–127,762) in 1990 to 46,874 (UI: 39,076–56,596) in 2021, with the age-standardized mortality rate (ASMR) declining from 2.040 per 100,000 population (UI: 1.804–2.285) to 0.591 per 100,000 (UI: 0.493–0.713). The estimated annual percentage change (EAPC) was −4.055 % (UI: −4.256 % to −3.853 %) (Table 3).
Deaths of maternal hemorrhage between 1990 and 2021 at the global and regional level.
| Number of cases, 1990 | Age-standardised rate per 100,000 population, 1990 | Number of cases, 2021 | Age-standardised rate per 100,000 population, 2021 | EAPCs | |
|---|---|---|---|---|---|
| Global | 114,112.590 (101,092.062, 127,761.742) | 2.040 (1.804, 2.285) | 46,874.438 (39,076.093, 56,596.011) | 0.591 (0.493, 0.713) | −4.055 (−4.256, −3.853) |
| Low SDI | 33,791.116 (28,513.391, 38,750.612) | 7.859 (6.618, 9.052) | 26,853.807 (21,570.785, 33,051.321) | 2.531 (2.029, 3.131) | −3.542 (−3.790, −3.292) |
| Low-middle SDI | 51,834.422 (45,459.819, 58,213.683) | 4.526 (3.975, 5.085) | 14,527.797 (12,230.542, 17,471.057) | 0.698 (0.588, 0.839) | −6.117 (−6.451, −5.782) |
| Middle SDI | 24,864.846 (21,434.165, 29,021.492) | 1.325 (1.140, 1.548) | 5,054.550 (4,263.028, 6,170.492) | 0.202 (0.171, 0.247) | −6.131 (−6.338, −5.923) |
| High-middle SDI | 3,088.950 (2,471.796, 3,702.654) | 0.263 (0.211, 0.316) | 312.378 (259.562, 385.779) | 0.025 (0.021, 0.032) | −7.413 (−7.675, −7.151) |
| High SDI | 469.248 (353.301, 609.268) | 0.050 (0.037, 0.064) | 83.864 (68.099, 104.125) | 0.008 (0.007, 0.010) | −5.101 (−5.373, −4.829) |
| Andean Latin America | 1,021.127 (861.363, 1,216.075) | 2.891 (2.436, 3.456) | 364.003 (261.820, 495.765) | 0.513 (0.370, 0.698) | −6.064 (−6.365, −5.763) |
| Australasia | 2.867 (2.126, 3.733) | 0.013 (0.010, 0.017) | 0.692 (0.507, 0.905) | 0.002 (0.002, 0.003) | −4.956 (−5.594, −4.313) |
| Caribbean | 427.557 (320.577, 556.651) | 1.197 (0.889, 1.565) | 451.904 (286.735, 655.118) | 0.933 (0.592, 1.357) | −0.145 (−0.538, 0.249) |
| Central Asia | 326.427 (288.092, 363.892) | 0.468 (0.411, 0.523) | 76.843 (61.569, 94.526) | 0.075 (0.060, 0.092) | −5.832 (−6.054, −5.609) |
| Central Europe | 109.930 (93.574, 128.692) | 0.087 (0.074, 0.103) | 8.732 (7.308, 10.395) | 0.008 (0.007, 0.010) | −6.884 (−7.176, −6.592) |
| Central Latin America | 1,458.042 (1,313.051, 1,606.245) | 0.898 (0.807, 0.987) | 417.084 (340.044, 512.830) | 0.155 (0.126, 0.191) | −5.586 (−5.832, −5.338) |
| Central Sub-Saharan Africa | 3,110.656 (2,195.939, 4,134.920) | 6.977 (4.923, 9.356) | 3,340.843 (2,323.494, 4,667.998) | 2.796 (1.944, 3.932) | −2.204 (−2.751, −1.655) |
| East Asia | 5,382.356 (3,652.116, 7,400.395) | 0.378 (0.256, 0.521) | 300.615 (214.394, 414.082) | 0.022 (0.016, 0.030) | −8.977 (−9.358, −8.595) |
| Eastern Europe | 222.888 (186.205, 270.295) | 0.097 (0.081, 0.117) | 19.950 (15.760, 24.963) | 0.010 (0.008, 0.013) | −6.718 (−7.177, −6.256) |
| Eastern Sub-Saharan Africa | 11,720.661 (9,812.807, 13,780.765) | 8.027 (6.628, 9.461) | 6,727.704 (5,347.024, 8,282.793) | 1.749 (1.380, 2.182) | −4.929 (−5.217, −4.641) |
| High-income Asia Pacific | 63.441 (53.318, 76.179) | 0.035 (0.029, 0.042) | 9.035 (6.999, 11.361) | 0.006 (0.005, 0.007) | −5.586 (−5.741, −5.432) |
| High-income North America | 61.623 (48.243, 78.579) | 0.020 (0.016, 0.026) | 29.697 (22.960, 38.312) | 0.009 (0.007, 0.011) | −1.935 (−2.264, −1.605) |
| North Africa and Middle East | 6,688.515 (5,405.086, 7,954.875) | 2.130 (1.722, 2.544) | 2,816.121 (2,019.288, 3,865.862) | 0.417 (0.299, 0.572) | −4.911 (−5.022, −4.801) |
| Oceania | 217.300 (109.955, 331.711) | 3.432 (1.774, 5.238) | 285.186 (188.631, 402.177) | 1.965 (1.299, 2.783) | −1.608 (−1.750, −1.466) |
| South Asia | 54,936.424 (46,929.844, 63,598.844) | 4.867 (4.158, 5.623) | 11,592.434 (9,404.424, 14,555.531) | 0.553 (0.446, 0.695) | −7.364 (−7.838, −6.887) |
| Southeast Asia | 14,813.058 (12,563.168, 17,258.525) | 3.140 (2.655, 3.662) | 3,679.526 (2,943.912, 4,756.202) | 0.488 (0.390, 0.633) | −6.103 (−6.273, −5.933) |
| Southern Latin America | 96.894 (78.203, 119.338) | 0.198 (0.160, 0.244) | 26.535 (19.715, 34.801) | 0.038 (0.028, 0.049) | −4.400 (−4.754, −4.046) |
| Southern Sub-Saharan Africa | 765.744 (588.210, 998.212) | 1.548 (1.197, 2.020) | 357.514 (253.194, 500.210) | 0.405 (0.287, 0.567) | −2.827 (−3.915, −1.726) |
| Tropical Latin America | 991.558 (841.630, 1,150.604) | 0.645 (0.551, 0.743) | 222.700 (180.938 ,266.193) | 0.092 (0.075, 0.110) | −5.350 (−5.800, −4.898) |
| Western Europe | 67.482 (59.700, 75.783) | 0.017 (0.015, 0.019) | 15.319 (13.431, 17.329) | 0.004 (0.004, 0.005) | −3.854 (−4.201, −3.506) |
| Western Sub-Saharan Africa | 11,628.043 (8,951.016, 14,497.192) | 6.987 (5.381, 8.711) | 16,132.004 (12,165.613, 21,530.919) | 3.573 (2.690, 4.740) | −1.666 (−1.912, −1.420) |
Low SDI regions experienced the highest burden, with deaths decreasing from 33,791 (UI: 28,513–38,751) to 26,854 (UI: 21,571–33,051), and ASMR declining from 7.859 per 100,000 (UI: 6.618–9.052) to 2.531 per 100,000 (UI: 2.029–3.131), with an EAPC of −3.542 % (UI: −3.790 % to −3.292 %). The largest ASMR reduction occurred in middle SDI regions (EAPC: −6.131 %; UI: −6.338 % to −5.923 %), where ASMR fell from 1.325 per 100,000 (UI: 1.140–1.548) to 0.202 per 100,000 (UI: 0.171–0.247). High-middle SDI regions showed the steepest decline (EAPC: −7.413 %; UI: −7.675 % to −7.151 %), with ASMR decreasing from 0.263 per 100,000 (UI: 0.211–0.316) to 0.025 per 100,000 (UI: 0.021–0.032).
In 2021, the region with the highest ASMR is Central Sub-Saharan Africa, with a rate of 3.573 per 100,000 population. In contrast, the region with the lowest ASMR is Australasia, with a remarkably low rate of 0.002 per 100,000. Other regions like Western Europe and High-income Asia Pacific also have relatively low mortality rates, reflecting more developed healthcare systems and lower overall death rates (Figure 1E). When considering EAPC, the Caribbean has the smallest EAPC at −0.145, indicating almost no significant decrease in mortality rates. On the other hand, East Asia shows the largest EAPC at −8.977, marking the most substantial decline in mortality rates (Figure 1F).
Regionally, sub-Saharan Africa remained the most affected. For example, Eastern sub-Saharan Africa saw deaths decline from 11,721 (UI: 9,813–13,781) to 6,728 (UI: 5,347–8,283), with ASMR decreasing from 8.027 per 100,000 (UI: 6.628–9.461) to 1.749 per 100,000 (UI: 1.380–2.182), and an EAPC of −4.929 % (UI: −5.217 % to −4.641 %). South Asia demonstrated the most significant ASMR reduction (EAPC: −7.364 %; UI: −7.838 % to −6.887 %), with ASMR falling from 4.867 per 100,000 (UI: 4.158–5.623) to 0.553 per 100,000 (UI: 0.446–0.695) (Figure 2C).
Age group-specific trends in ASIR, ASDR, and ASMR for maternal hemorrhage by SDI
From 1990 to 2021, the ASIR (Figure 3A), ASDR (Figure 3B), and ASMR (Figure 3C) of maternal hemorrhage exhibited declining trends across all age groups globally and in regions with varying SDI. The highest age-standardized rates were observed among women of reproductive age, particularly in the 20–24 years and 25–29 years groups, while older age groups had the lowest. Notably, for ASIR in the high SDI region, there is a gradual upward trend in the 30–34 and 35–39 age groups (Figure 3A).
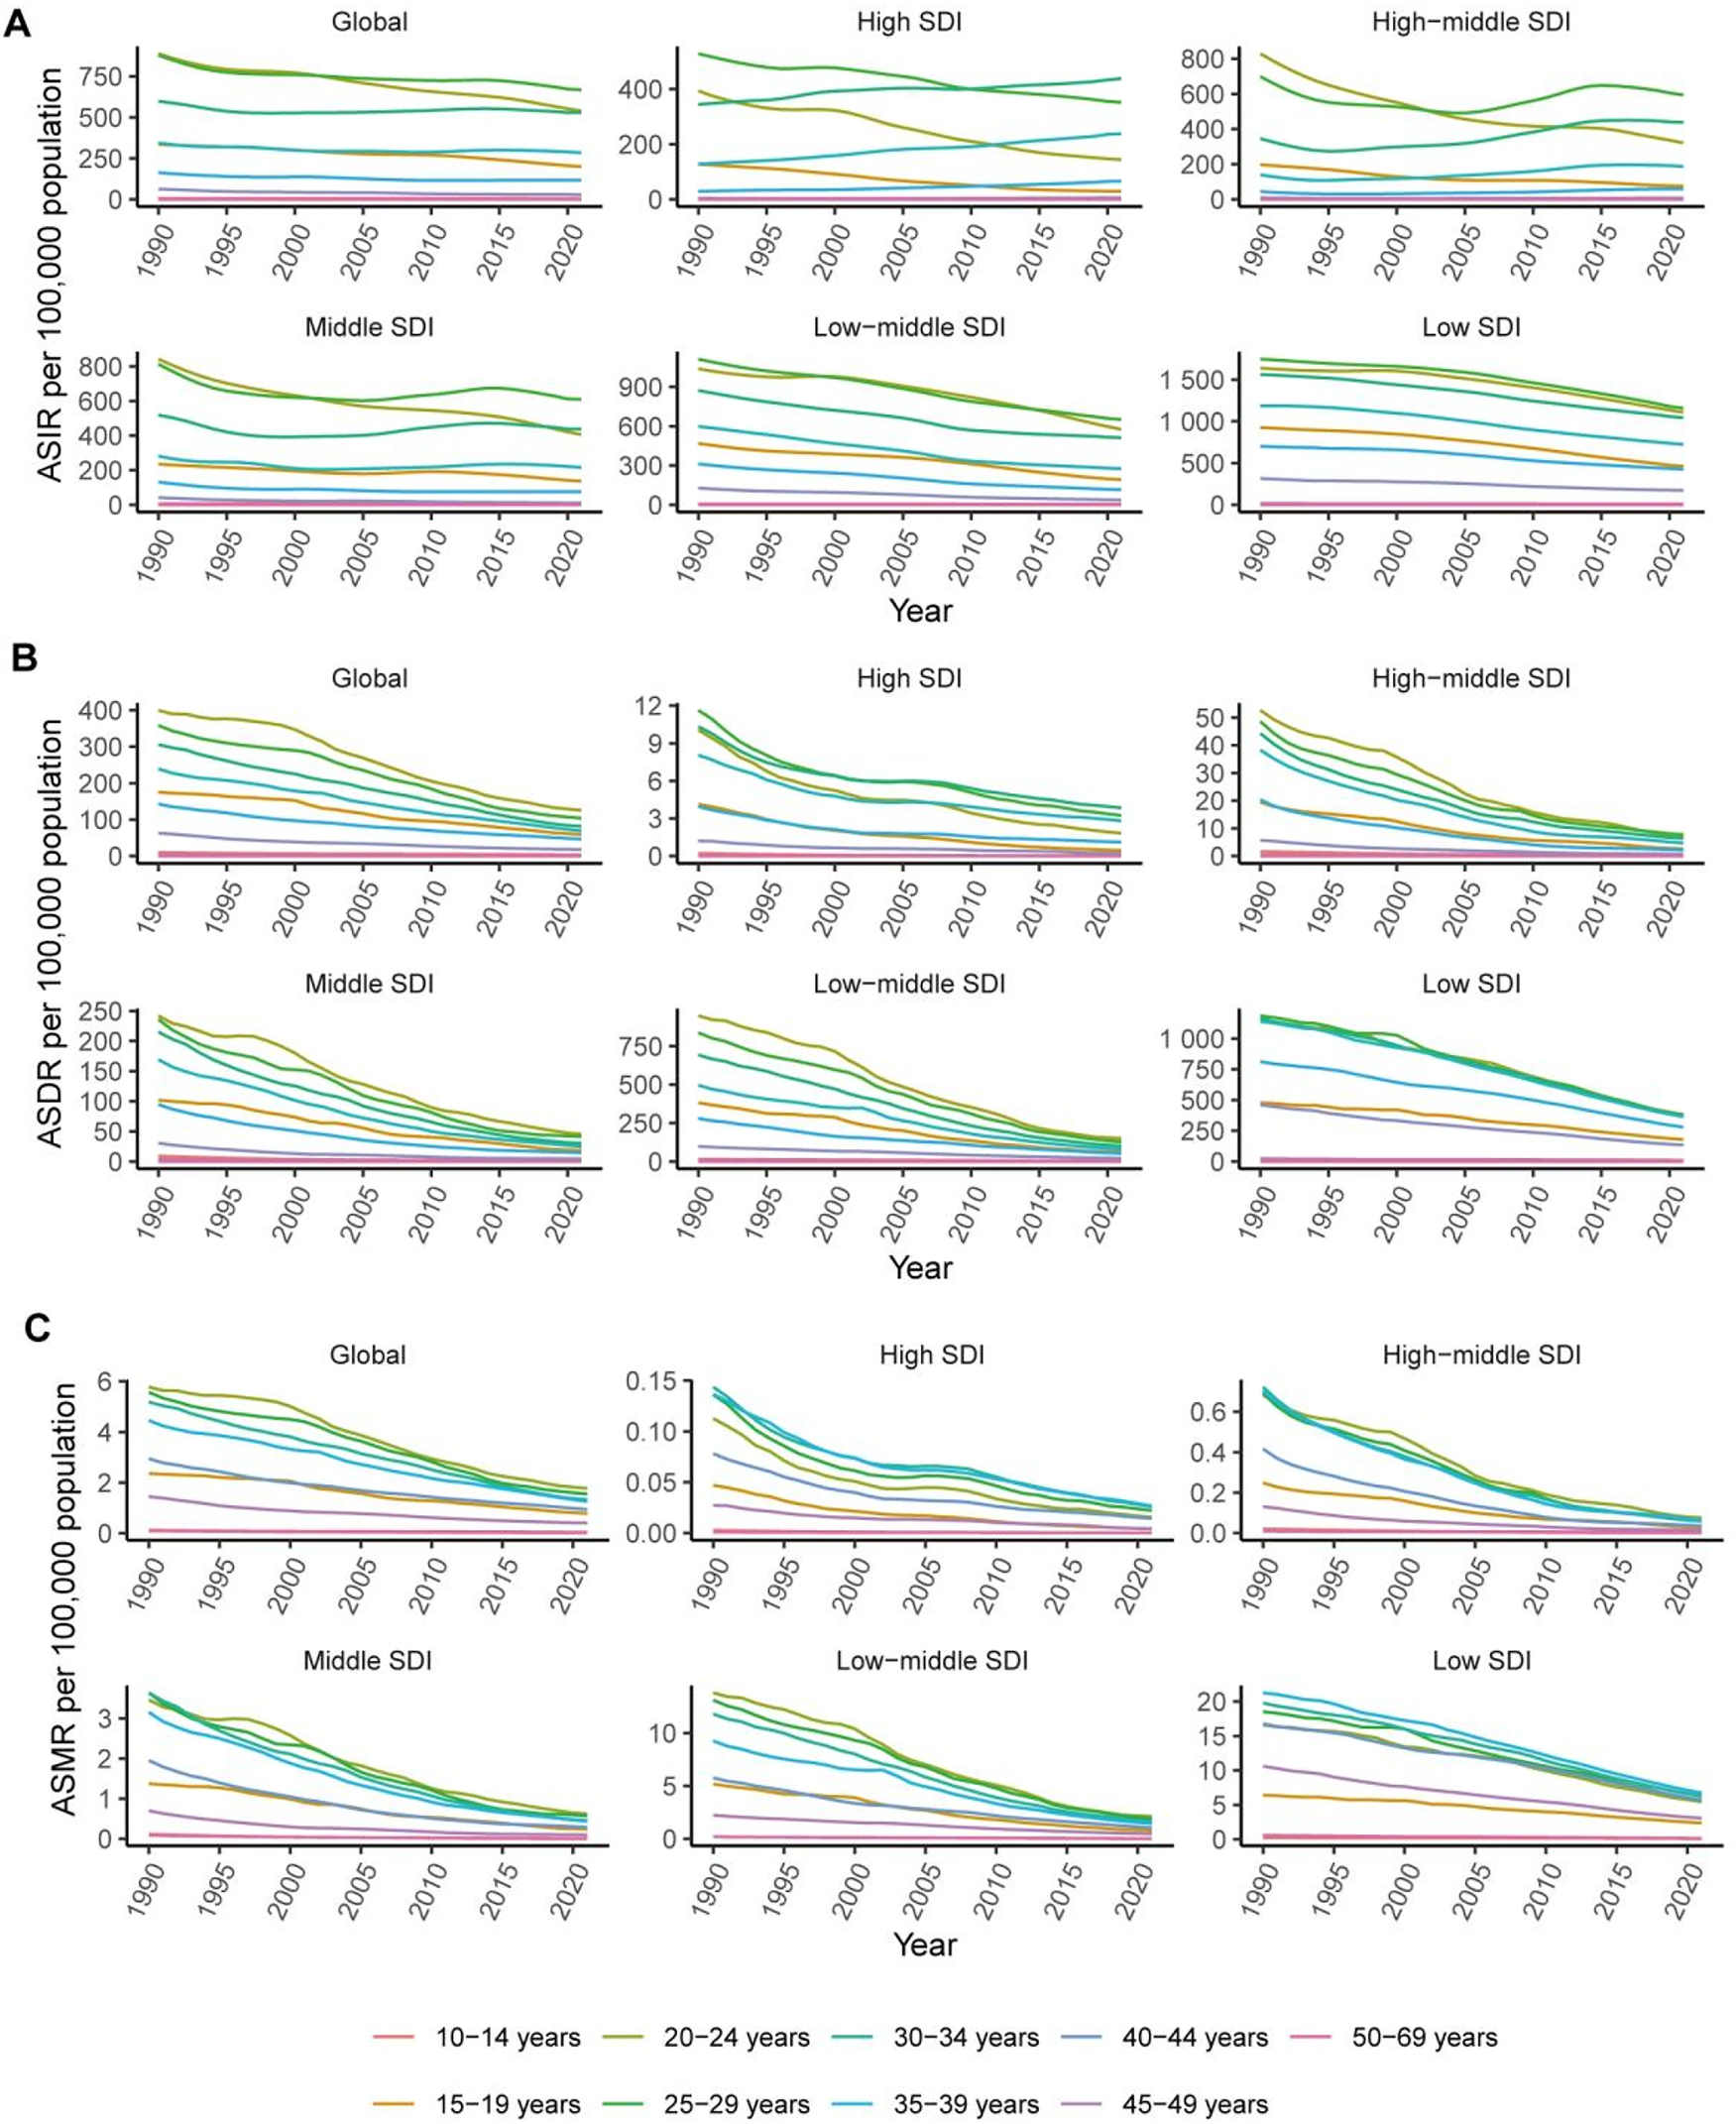
Trends in age-standardized incidence rate (ASIR), age-standardized DALYs rate (ASDR), and age-standardized mortality rate (ASMR) of maternal hemorrhage by different age group across global and five SDI regions (1990–2021). (A) ASIR per 100,000 population, (B) ASDR per 100,000 population, and (C) ASMR per 100,000 population. Different colors represent various age group.
SDI-related differences in maternal hemorrhage burden
The correlation between maternal hemorrhage rates and the SDI was assessed using the ASIR (Figure 4A), ASDR (Figure 4B), and ASMR (Figure 4C). The results showed a strong negative correlation for all three metrics: ASIR (r=−0.7247, 95 % CI: −0.7655 to −0.6781, p<0.001), ASMR (r=−0.9409, 95 % CI: −0.9528 to −0.9266, p<0.001), and ASDR (r=−0.9438, 95 % CI: −0.9567 to −0.9287, p<0.001). Overall, regions with lower SDI experience greater incidence, DALYs, and mortality rates for maternal hemorrhage.
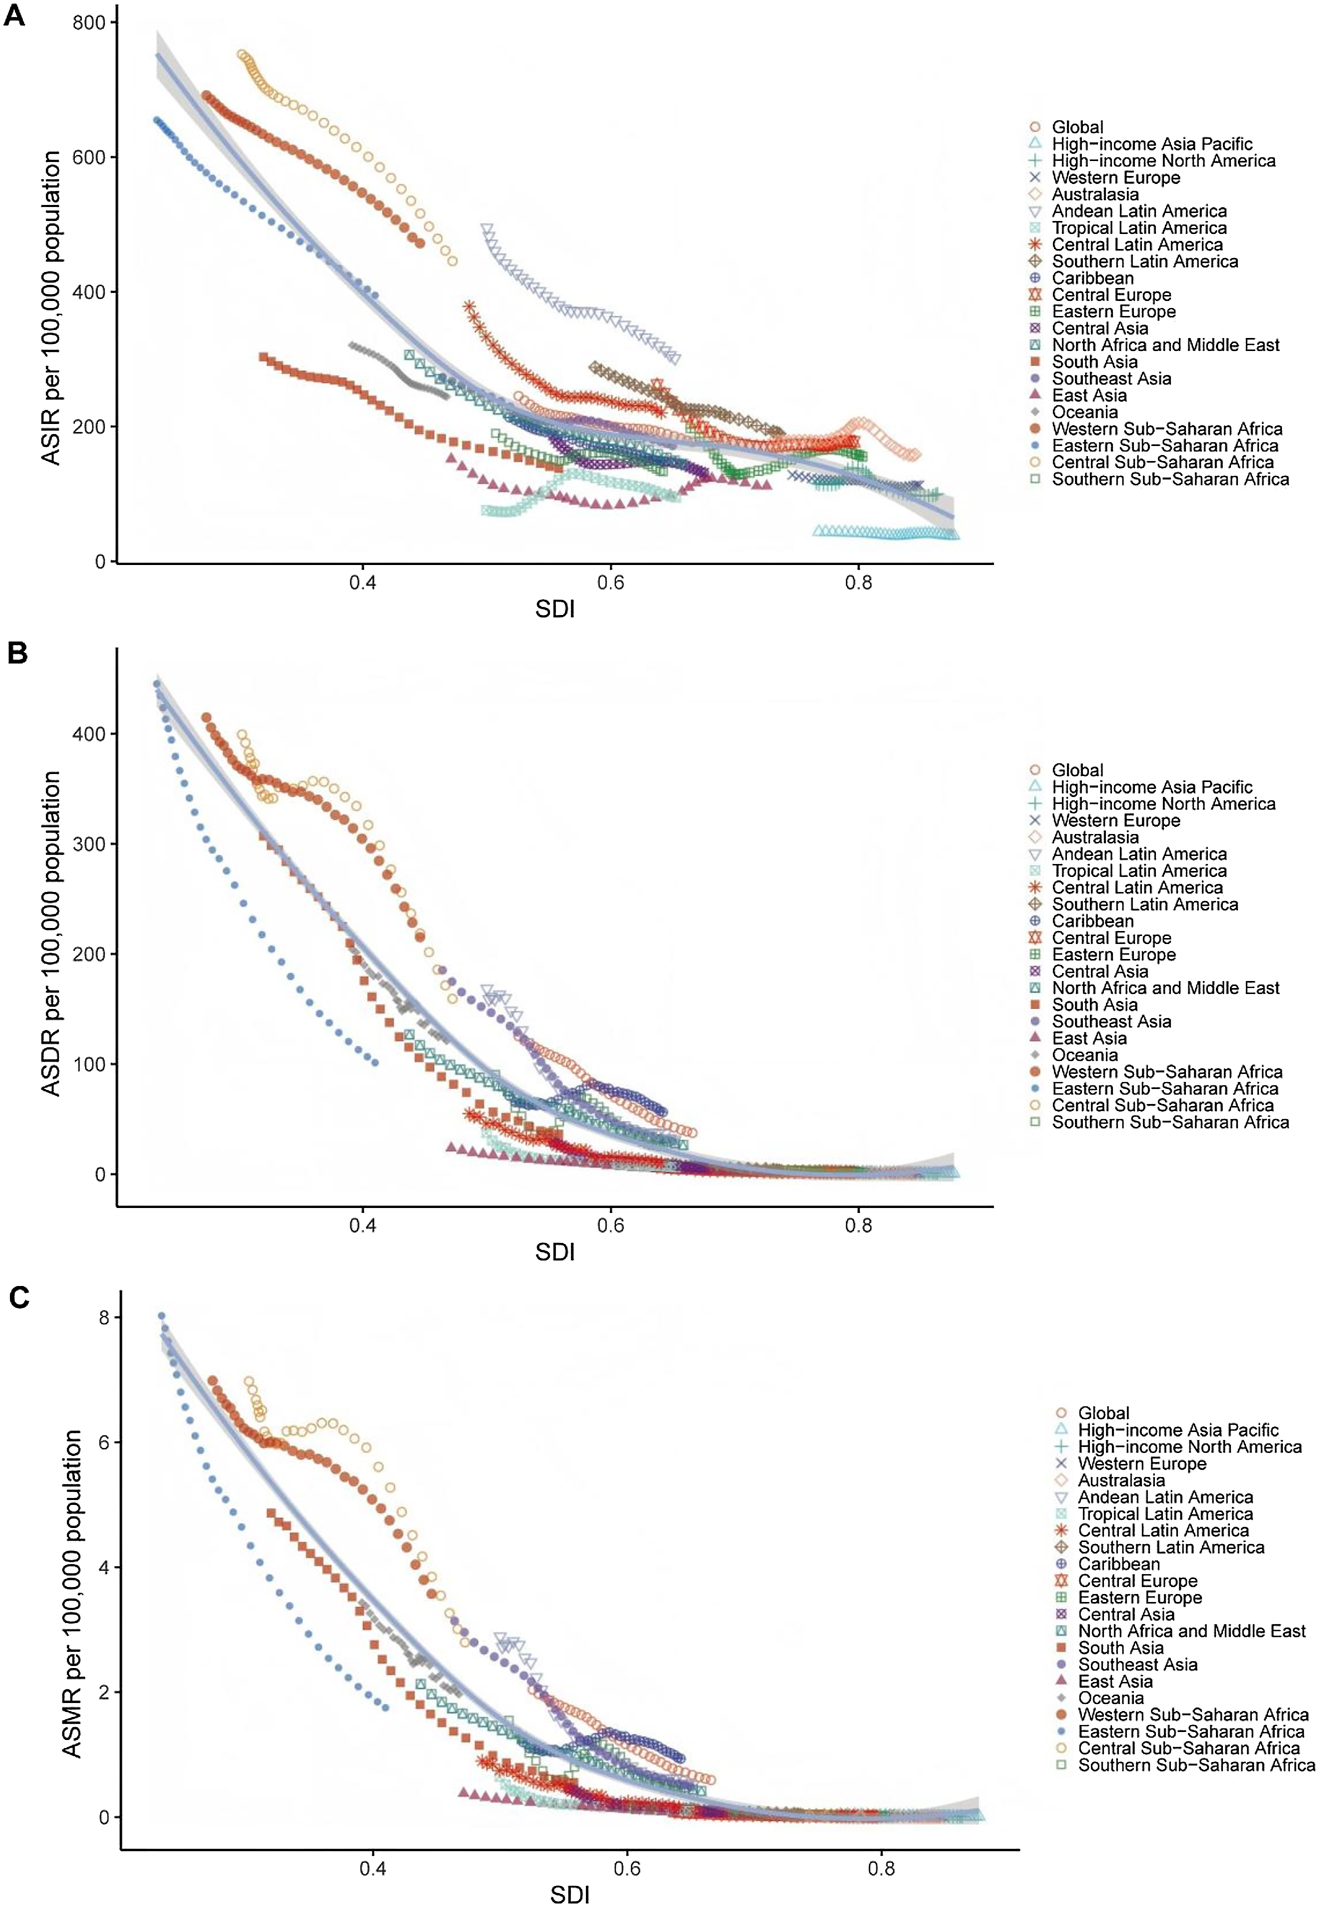
Relationship between the socio-demographic index (SDI) and maternal hemorrhage burden in terms of (A) age-standardized incidence rate (ASIR), (B) age-standardized DALYs rate (ASDR), and (C) age-standardized mortality rate (ASMR) in 2021. Each point represents a region, with trends illustrating the correlation between SDI and the respective rates. The shaded bands around the curves represent the 95 % confidence intervals, indicating the uncertainty in the estimated relationships.
Projected trends in maternal hemorrhage indicators (1990–2050)
We also present the projected trends for ASIR, ASDR, and ASMR from 1990 to 2050, including observed data up to 2021 and forecasts for the following years. The projected trends for maternal hemorrhage indicators from 2021 to 2050 show a consistent decline globally. Figure 5A shows that the ASIR decreases from approximately 387.854 per 100,000 population in 1990 to 279.544 per 100,000 by 2020, with a continued reduction expected to 189.388 per 100,000 by 2050. Figure 5B illustrates the decline in ASDR, which drops from 197.925 per 100,000 in 1990 to 59.194 per 100,000 by 2021, and is projected to decrease further to 20.878 per 100,000 by 2050. Figure 5C displays the trend for ASMR, which falls from 3.222 per 100,000 in 1990 to 0.934 per 100,000 by 2021, with further reduction expected to 0.385 per 100,000 by 2050.

Projected trends in the age-standardized incidence rate (ASIR), age-standardized DALYs rate (ASDR), and age-standardized mortality rate (ASMR) of maternal hemorrhage from 2022 to 2050. (A) ASIR per 100,000 population, (B) ASDR per 100,000 population, and (C) ASMR per 100,000 population. Shaded areas represent the 95 % uncertainty intervals for the projections.
Discussion
This study provides a comprehensive analysis of global, regional, and national trends in maternal hemorrhage from 1990 to 2021, based on the most recent GBD 2021 data. Globally, maternal hemorrhage has seen notable reductions in both incidence and mortality. From 1990 to 2021, the global ASIR decreased by 0.835 % annually, and ASMR declined by 4.055 % annually. These trends suggest significant progress in global maternal health, likely driven by improvements in healthcare infrastructure, the availability of skilled birth attendants, and the widespread implementation of interventions such as timely transfusions and postpartum hemorrhage management protocols [24], 25].
However, the reduction in maternal hemorrhage burden has not been uniform. Sub-Saharan Africa continues to bear the heaviest burden, particularly in Central and Western Sub-Saharan Africa, where the rates of maternal hemorrhage remain the highest globally. This phenomenon is driven by multiple factors. First, these regions are marked by widespread poverty, low education levels, and limited access to healthcare resources [26], resulting in inadequate or delayed obstetric care for women. In many low-income countries, there is a shortage of skilled birth attendants, obstetricians, and emergency medical facilities, severely restricting the ability to effectively manage and treat postpartum hemorrhage [27], 28]. Additionally, the health infrastructure in Sub-Saharan Africa is often underdeveloped, and public health interventions are difficult to implement on a large scale, leading to insufficient early prevention and intervention measures for postpartum hemorrhage. Cultural and social factors, such as the lower status of women in society, limited reproductive health education, and gender inequalities, further exacerbate the risks faced by women in these regions. Conversely, high-income regions such as High-Income Asia Pacific and Western Europe report significantly lower rates. These regional disparities are reflective of differences in healthcare systems, socioeconomic development, and the availability of skilled maternal care. The lower burden in high-income regions can be attributed to their more robust healthcare systems, which facilitate early detection and management of obstetric complications [29], 30].
The strong correlation between maternal hemorrhage burden and the SDI is a central finding in this study. Regions with lower SDI, such as Sub-Saharan Africa and South Asia, continue to experience disproportionately high incidence, DALYs, and mortality rates of maternal hemorrhage. While high-SDI regions have seen significant reductions in maternal hemorrhage rates due to stronger healthcare infrastructure and improved access to emergency obstetric care, low-SDI regions remain at a disadvantage due to healthcare system weaknesses, including limited access to trained healthcare workers and life-saving interventions. These disparities emphasize the need for targeted, context-specific interventions in high-burden regions to further reduce maternal morbidity and mortality. In summary, SDI remains a key determinant of maternal hemorrhage burden, underscoring the importance of addressing broader socioeconomic and healthcare challenges in the most affected regions.
In many low-income countries, gender inequality and cultural norms significantly worsen the maternal hemorrhage burden. Women often have limited autonomy in seeking medical care, face restricted access to reproductive health services, and may delay treatment due to family or community pressures. These sociocultural barriers reduce timely recognition and management of obstetric complications, underscoring the need for policies that promote women’s health awareness, empower decision-making, and strengthen community support systems.
We also project the trends of maternal hemorrhage-related indicators through 2050. Globally, all indicators are expected to continue declining. By 2050, the global ASIR is projected to decrease from 176.89 per 100,000 in 2021 to 189.39 per 100,000, the ASDR will decline to 20.88 per 100,000, and the ASMR is expected to drop to 0.39 per 100,000. These trends reflect continued global efforts to reduce maternal mortality and improve maternal health outcomes. While global trends are positive, ongoing targeted interventions in low-income regions remain crucial, especially focusing on improving healthcare access and addressing socioeconomic barriers.
In low-SDI and other resource-limited settings, our findings highlight the need for context-appropriate strategies to reduce the burden of maternal hemorrhage. Strengthening primary healthcare capacity, expanding mid-level obstetric training, and improving access to essential uterotonics and basic transfusion services represent feasible interventions even in constrained environments. In addition, community-based health education may help increase early care-seeking and awareness of postpartum hemorrhage warning signs. Tailoring these measures to local healthcare resources and social contexts could help high-burden regions achieve substantial reductions in maternal morbidity and mortality.
Our findings reflect the current state of maternal hemorrhage epidemiology, offering a valuable resource for public health planning and policy-making. However, there are several limitations that must be considered. First, the GBD data is reliant on available health statistics, which can be sparse or inaccurate, particularly in low-income countries. In these regions, maternal hemorrhage deaths may be underreported due to inadequate vital registration systems and a lack of data on obstetric complications. Second, while maternal hemorrhage includes antepartum, intrapartum, and postpartum bleeding, the GBD database does not provide a detailed breakdown of these subcategories. This lack of granularity makes it difficult to fully understand the specific dynamics of each type of hemorrhage and its unique burden in different regions. Finally, while the study provides global projections, the future trends in low-resource settings may be influenced by factors not fully captured by the existing data, such as political instability, changes in healthcare policies, and emerging health crises.
In summary, while global maternal hemorrhage rates have declined, significant regional disparities persist, particularly in low-resource settings. Sub-Saharan Africa and South Asia continue to bear a disproportionate share of the burden, highlighting the need for focused interventions that address both healthcare access and broader socioeconomic challenges. The findings underscore the importance of strengthening health systems, improving obstetric care, and tailoring strategies to regional contexts to reduce maternal morbidity and mortality in high-burden areas.
-
Research ethics: The local Institutional Review Board deemed the study exempt from review.
-
Informed consent: Not applicable.
-
Author contributions: WHQ designed this study, collected the data, performed statistical analysis, and drafted the original manuscript. The author read and approved the final version of the manuscript.
-
Use of Large Language Models, AI and Machine Learning Tools: None declared.
-
Conflict of interest: The author states no conflict of interest.
-
Research funding: None declared.
-
Data availability: The datasets analyzed during the current study are publicly available from the Global Health Data Exchange (GHDx) website, which hosts the Global Burden of Disease (GBD) 2021 study data. These can be accessed at https://vizhub.healthdata.org/gbd-results/. All estimates used in the analysis – including incidence, mortality, DALYs, and SDI values – were obtained from this repository. Additional data files with extracted results are available upon reasonable request from the corresponding author.
References
1. Walfish, M, Neuman, A, Wlody, D. Maternal haemorrhage. BJA Br J Anaesth 2009;103:i47–56. https://doi.org/10.1093/bja/aep303.Search in Google Scholar PubMed
2. Goffman, D, Nathan, L, Chazotte, C. Obstetric hemorrhage: a global review. Semin Perinatol 2016;40:96–8. https://doi.org/10.1053/j.semperi.2015.11.014.Search in Google Scholar PubMed
3. Haeri, S, Dildy, GA. Maternal mortality from hemorrhage. Semin Perinatol 2012;36:48–55. https://doi.org/10.1053/j.semperi.2011.09.010.Search in Google Scholar PubMed
4. Lockhart, E. Postpartum hemorrhage: a continuing challenge. Hematol Am Soc Hematol Educ Program 2015;2015:132–7. https://doi.org/10.1182/asheducation-2015.1.132.Search in Google Scholar PubMed
5. GDaI, C, Santomauro, DF, Aali, A, Abate, YH, Abbafati, C, Abbastabar, H, et al.. Global incidence, prevalence, years lived with disability (YLDs), disability-adjusted life-years (DALYs), and healthy life expectancy (HALE) for 371 diseases and injuries in 204 countries and territories and 811 subnational locations, 1990–2021: a systematic analysis for the global burden of disease study 2021. Lancet 2024;403:2133–61. https://doi.org/10.1016/s0140-6736(24)00757-8.Search in Google Scholar
6. Sun, P, Yu, C, Yin, L, Chen, Y, Sun, Z, Zhang, T, et al.. Global, regional, and national burden of female cancers in women of child-bearing age, 1990–2021: analysis of data from the global burden of disease study 2021. eClinicalMedicine 2024;74:102713. https://doi.org/10.1016/j.eclinm.2024.102713.Search in Google Scholar PubMed PubMed Central
7. Abdullahi, HM, Aliyu, LD, Yusuf, M, Miko, MA. Obstetric hemorrhage: effective methods for addressing the menace in Sub-Saharan Africa. J Perinat Med 2022;50:1157–62. https://doi.org/10.1515/jpm-2022-0054.Search in Google Scholar PubMed
8. Wakili, AA, Aswat, A, Timms, R, Beeson, L, Mammoliti, K-M, Devall, A, et al.. Differences in obstetric practices and outcomes of postpartum hemorrhage across Nigerian health facilities. Int J Gynaecol Obstet 2022;158:23–30. https://doi.org/10.1002/ijgo.14198.Search in Google Scholar PubMed PubMed Central
9. Glenzer, MM, Correia, M, Nhantumbo, V, Barnes, RF, Luis, E, Boaventura, I, et al.. Postpartum hemorrhage in Sub-Saharan Africa-a prospective study in metropolitan Mozambique. J Thromb Haemostasis 2023;21:3463–76. https://doi.org/10.1016/j.jtha.2023.09.002.Search in Google Scholar PubMed
10. Chazotte, C, D’Alton, ME. Maternal mortality in New York–Looking back, looking forward. Semin Perinatol 2016;40:132–5. https://doi.org/10.1053/j.semperi.2015.11.020.Search in Google Scholar PubMed
11. Gulumser, C, Engin-Ustun, Y, Keskin, L, Celen, S, Sanisoglu, S, Karaahmetoglu, S, et al.. Maternal mortality due to hemorrhage: population-based study in Turkey. J Matern Fetal Neona. 2019;32:3998–4004. https://doi.org/10.1080/14767058.2018.1481029.Search in Google Scholar PubMed
12. GBD 2021 Neck Pain Collaborators. Global, regional, and national burden of neck pain, 1990–2020, and projections to 2050: a systematic analysis of the global burden of disease study 2021. Lancet Rheumatol 2024;6:e142–55. https://doi.org/10.1016/S2665-9913(23)00321-1.Search in Google Scholar PubMed PubMed Central
13. Li, T, Qin, C, Zhao, B, Li, Z, Zhao, Y, Lin, C, et al.. Global and regional burden of pancreatitis: epidemiological trends, risk factors, and projections to 2050 from the global burden of disease study 2021. BMC Gastroenterol 2024;24:398. https://doi.org/10.1186/s12876-024-03481-8.Search in Google Scholar PubMed PubMed Central
14. Wang, R, Li, Z, Liu, S, Zhang, D. Global, regional and national burden of inflammatory bowel disease in 204 countries and territories from 1990 to 2019: a systematic analysis based on the global burden of disease study 2019. BMJ Open 2023;13:e065186. https://doi.org/10.1136/bmjopen-2022-065186.Search in Google Scholar PubMed PubMed Central
15. Cen, J, Wang, Q, Cheng, L, Gao, Q, Wang, H, Sun, F. Global, regional, and national burden and trends of migraine among women of childbearing age from 1990 to 2021: insights from the global burden of disease study 2021. J Headache Pain 2024;25:96. https://doi.org/10.1186/s10194-024-01798-z.Search in Google Scholar PubMed PubMed Central
16. Chen, Y, Chen, W, Cheng, Z, Chen, Y, Li, M, Ma, L, et al.. Global burden of HIV-negative multidrug- and extensively drug-resistant tuberculosis based on global burden of disease study 2021. Sci One Health 2024;3:100072. https://doi.org/10.1016/j.soh.2024.100072.Search in Google Scholar PubMed PubMed Central
17. Zhang, J, Ma, B, Han, X, Ding, S, Li, Y. Global, regional, and national burdens of HIV and other sexually transmitted infections in adolescents and young adults aged 10–24 years from 1990 to 2019: a trend analysis based on the global burden of disease study 2019. Lancet Child Adolesc Health 2022;6:763–76. https://doi.org/10.1016/s2352-4642(22)00219-x.Search in Google Scholar
18. Li, T, Lin, C, Wang, W. Global, regional, and national burden of pancreatic cancer from 1990 to 2021, its attributable risk factors, and projections to 2050: a systematic analysis of the global burden of disease study 2021. BMC Cancer 2025;25:189. https://doi.org/10.1186/s12885-025-13597-z.Search in Google Scholar PubMed PubMed Central
19. Zhu, Z, Zhong, X, Luo, Z, Liu, M, Zhang, H, Zheng, H, et al.. Global, regional and national burdens of acne vulgaris in adolescents and young adults aged 10–24 years from 1990 to 2021: a trend analysis. Br J Dermatol 2025;192:228–37. https://doi.org/10.1093/bjd/ljae352.Search in Google Scholar PubMed
20. Knoll, M, Furkel, J, Debus, J, Abdollahi, A, Karch, A, Stock, C. An R package for an integrated evaluation of statistical approaches to cancer incidence projection. BMC Med Res Methodol 2020;20:257. https://doi.org/10.1186/s12874-020-01133-5.Search in Google Scholar PubMed PubMed Central
21. Zhang, T, Sun, L, Yin, X, Chen, H, Yang, L, Yang, X. Burden of drug use disorders in the United States from 1990 to 2021 and its projection until 2035: results from the GBD study. BMC Public Health 2024;24:1639. https://doi.org/10.1186/s12889-024-19142-0.Search in Google Scholar PubMed PubMed Central
22. Riebler, A, Held, L. Projecting the future burden of cancer: bayesian age-period-cohort analysis with integrated nested Laplace approximations. Biom J 2017;59:531–49. https://doi.org/10.1002/bimj.201500263.Search in Google Scholar PubMed
23. Zhang, S-X, Wang, J-C, Yang, J, Lv, S, Duan, L, Lu, Y, et al.. Epidemiological features and temporal trends of the co-infection between HIV and tuberculosis, 1990–2021: findings from the global burden of disease study 2021. Infect Dis Poverty 2024;13:59. https://doi.org/10.1186/s40249-024-01230-3.Search in Google Scholar PubMed PubMed Central
24. Souza, JP, Day, LT, Rezende-Gomes, AC, Zhang, J, Mori, R, Baguiya, A, et al.. A global analysis of the determinants of maternal health and transitions in maternal mortality. Lancet Global Health 2024;12:e306–16. https://doi.org/10.1016/s2214-109x(23)00468-0.Search in Google Scholar
25. Azugbene, EA. Maternal health experiences and health care utilization of African immigrant women: a review of the literature. Matern Child Health J 2023;27:1324–34. https://doi.org/10.1007/s10995-023-03644-1.Search in Google Scholar PubMed
26. Eze, P, Lawani, LO, Agu, UJ, Acharya, Y. Catastrophic health expenditure in Sub-Saharan Africa: systematic review and meta-analysis. Bull World Health Organ 2022;100. https://doi.org/10.2471/blt.21.287673.Search in Google Scholar
27. Ng’ang’a, J, Chitimbe, T, Mburu, R, Rushwan, S, Ntirushwa, D, Chinery, L, et al.. Challenges in updating national guidelines and essential medicines lists in Sub-Saharan African countries to include WHO-recommended postpartum hemorrhage medicines. Int J Gynaecol Obstet 2022;158:11–3. https://doi.org/10.1002/ijgo.14269.Search in Google Scholar PubMed PubMed Central
28. Mpemba, F, Kampo, S, Zhang, X. Towards 2015: post-partum haemorrhage in Sub-Saharan Africa still on the rise. J Clin Nurs 2014;23:774–83. https://doi.org/10.1111/jocn.12126.Search in Google Scholar PubMed
29. Burgess, APH, Dongarwar, D, Spigel, Z, Salihu, HM, Moaddab, A, Clark, SL, et al.. Pregnancy-related mortality in the United States, 2003–2016: age, race, and place of death. Am J Obstet Gynecol 2020;222:489.e1-.e8. https://doi.org/10.1016/j.ajog.2020.02.020.Search in Google Scholar PubMed
30. Mitta, K, Tsakiridis, I, Dagklis, T, Grigoriadou, R, Mamopoulos, A, Athanasiadis, A, et al.. Incidence and risk factors for postpartum hemorrhage: a case-control study in a tertiary hospital in Greece. Medicina (Kaunas) 2023;59. https://doi.org/10.3390/medicina59061151.Search in Google Scholar PubMed PubMed Central
Supplementary Material
This article contains supplementary material (https://doi.org/10.1515/jpm-2025-0601).
© 2026 the author(s), published by De Gruyter, Berlin/Boston
This work is licensed under the Creative Commons Attribution 4.0 International License.