
Asymmetric Pass-Through of Wholesale Price Shocks to Retail Prices: The Case of the Greek Fruits and Vegetables Market
-
Athanasios Dimas


Abstract
The objective of this study is to examine the dynamic adjustment of retail prices following changes in input prices within an oligopolistic and vertically non-integrated market. Data are weekly retail and wholesale prices between February 2010 and August 2013. The methodology employed is the Nonlinear Autoregressive Distributed Lag (NARDL) model, which captures both short- and long-run price dynamics. The empirical findings reveal evidence of the “rockets and feathers” hypothesis for more than half of the products examined, indicating an inflationary impact on retail prices, thus a temporal or permanent decrease in consumer welfare. This result is in contrast with the perishable nature of fruits and vegetables.
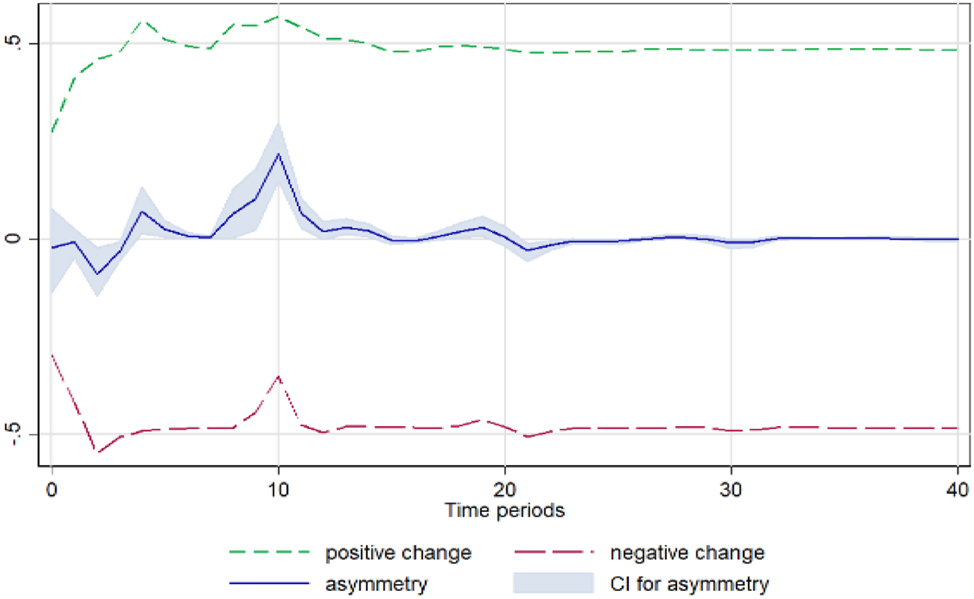
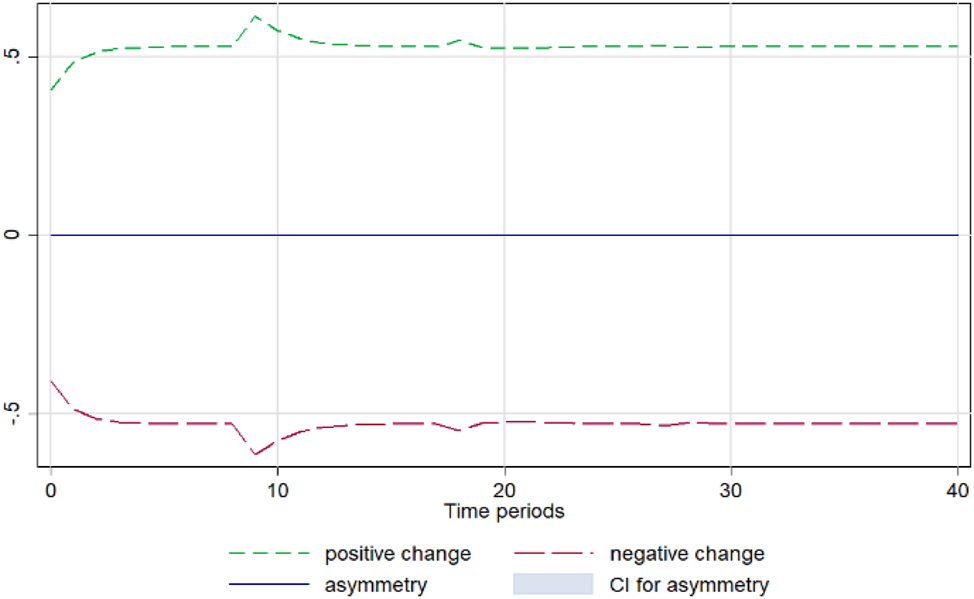
This Appendix presents the wholesale-retail prices dynamic multipliers for each product.
Wholesale-Retail Prices Dynamic Multipliers
See Figures A1, A2, A3, A4, A5, A6, A7, A8, A9, A10, A11, A12, A13, and A14.
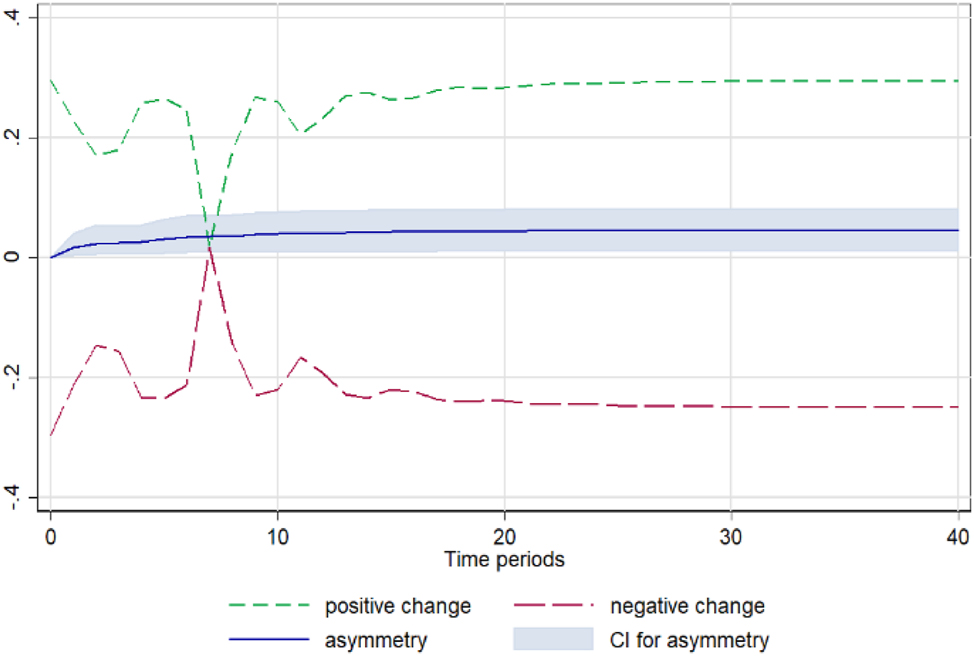
Apple. Notes: 90 % bootstrap Confidence Interval is based on 200 replications. Source: Author’s calculations based on data from the Greek Ministry of Development and the Central Market.
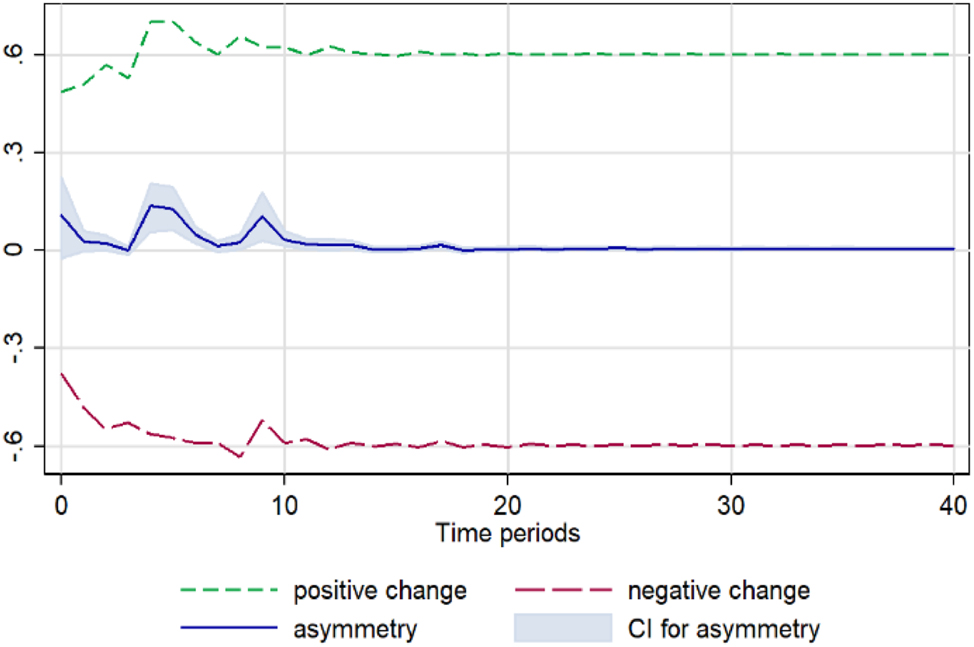
Cucumber. Notes: 90 % bootstrap Confidence Interval is based on 200 replications. Source: Author’s calculations based on data from the Greek Ministry of Development and the Central Market.
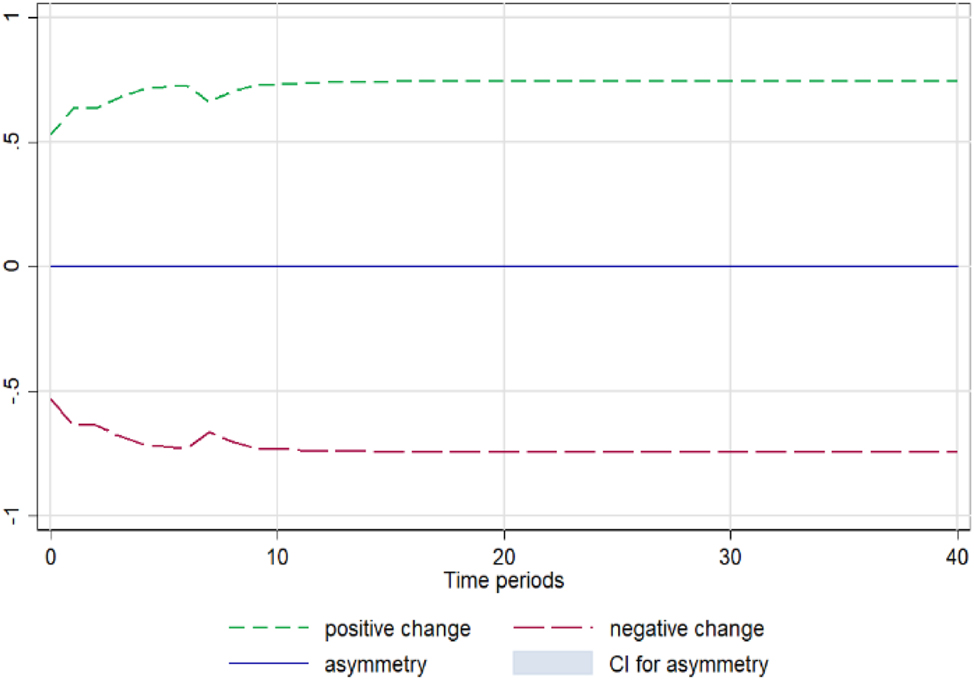
Eggplant. Notes: 90 % bootstrap Confidence Interval is based on 200 replications. Source: Author’s calculations based on data from the Greek Ministry of Development and the Central Market.
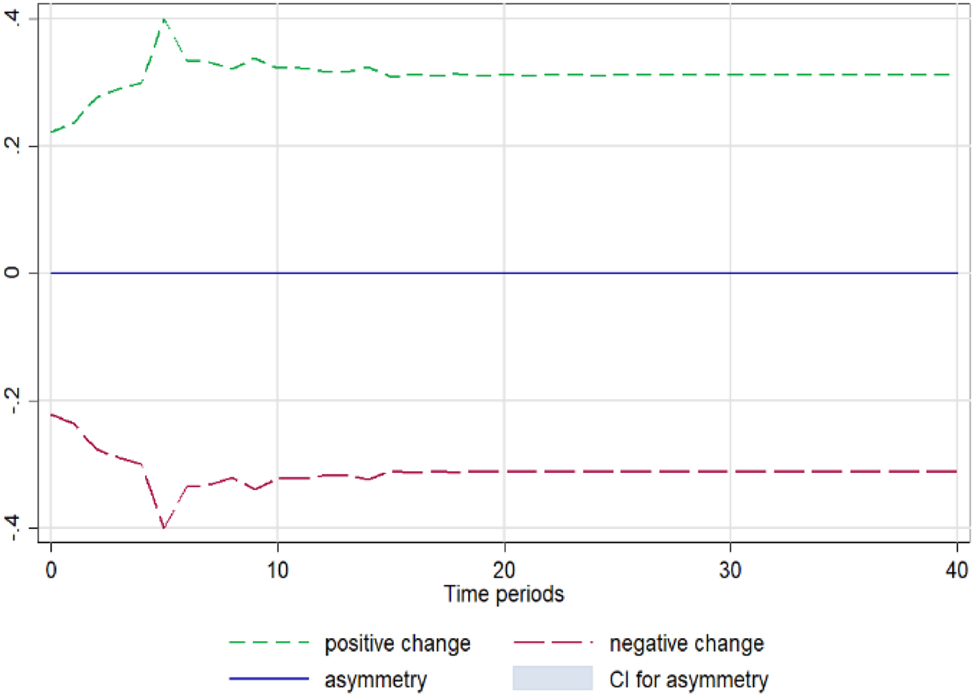
Fresh onion. Notes: 90 % bootstrap Confidence Interval is based on 200 replications. Source: Author’s calculations based on data from the Greek Ministry of Development and the Central Market.
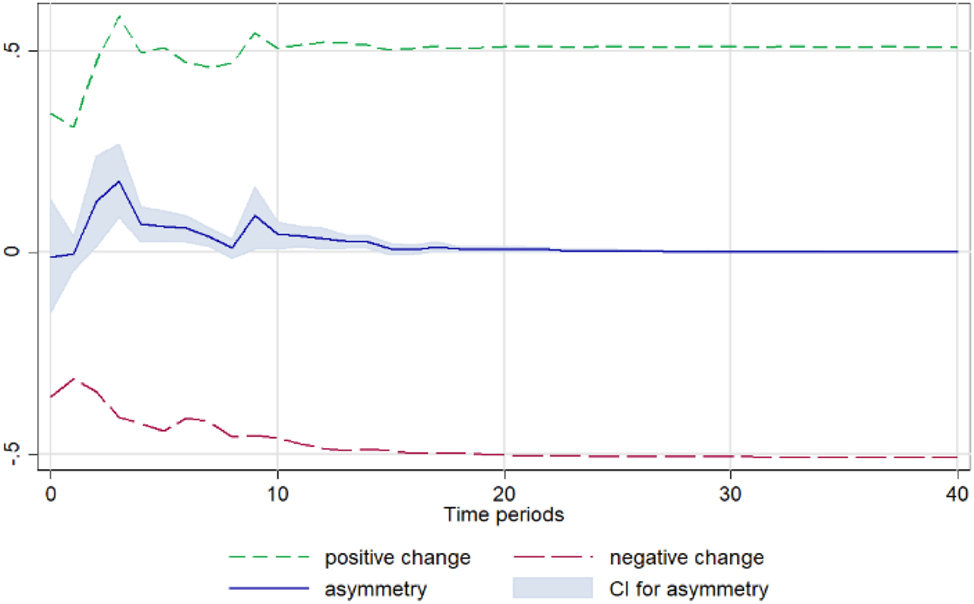
Greens. Notes: 90 % bootstrap Confidence Interval is based on 200 replications. Source: Author’s calculations based on data from the Greek Ministry of Development and the Central Market.
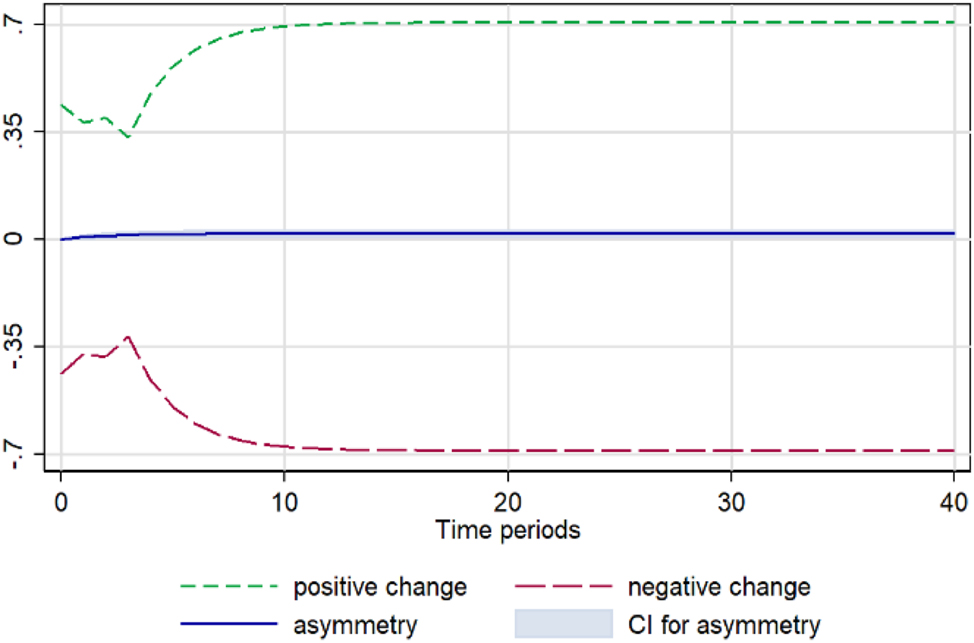
Lemon. Notes: 90 % bootstrap Confidence Interval is based on 200 replications. Source: Author’s calculations based on data from the Greek Ministry of Development and the Central Market.
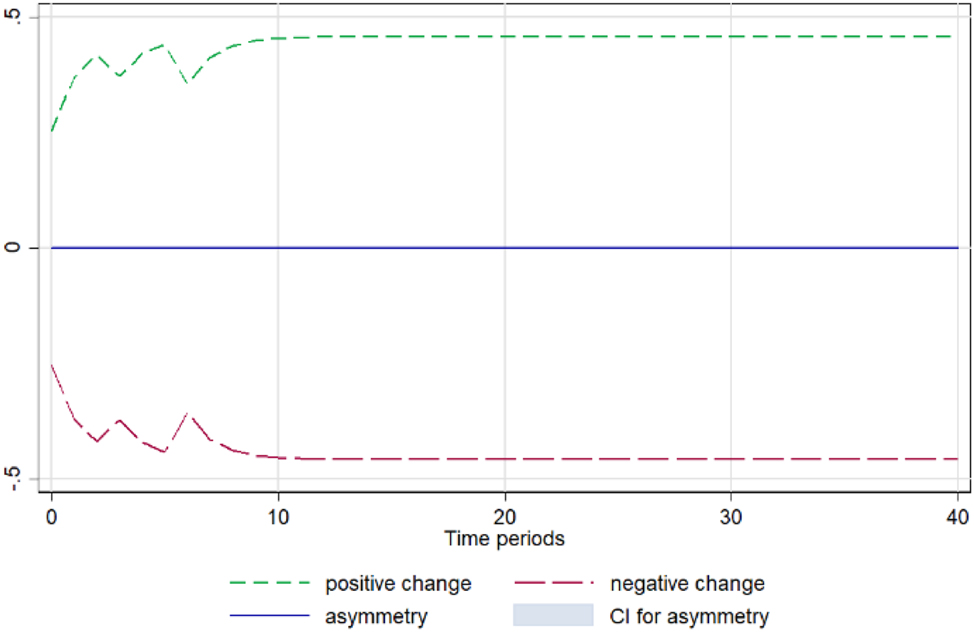
Lettuce. Notes: 90 % bootstrap Confidence Interval is based on 200 replications. Source: Author’s calculations based on data from the Greek Ministry of Development and the Central Market.
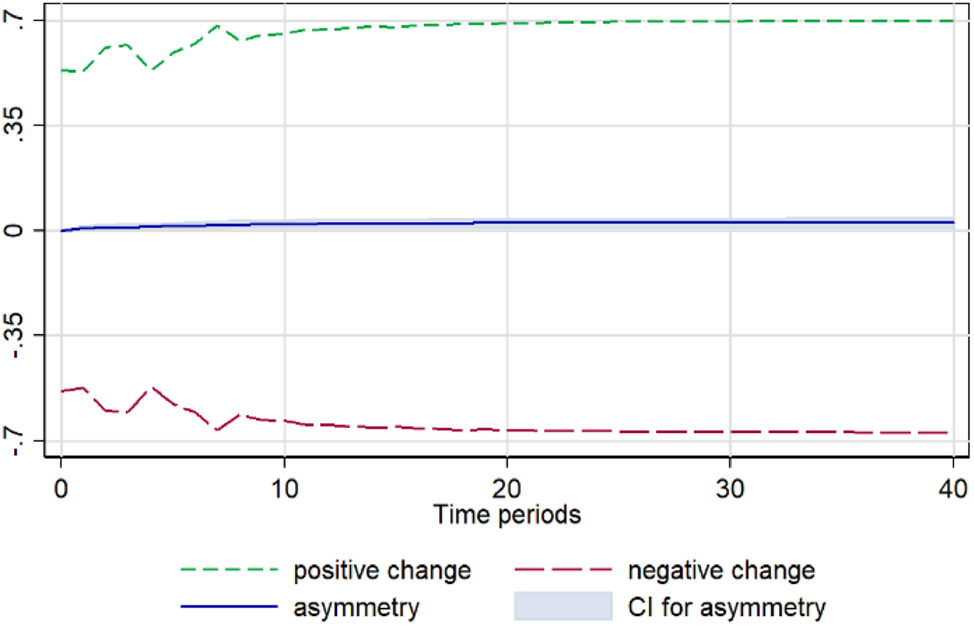
Onion. Notes: 90 % bootstrap Confidence Interval is based on 200 replications. Source: Author’s calculations based on data from the Greek Ministry of Development and the Central Market.
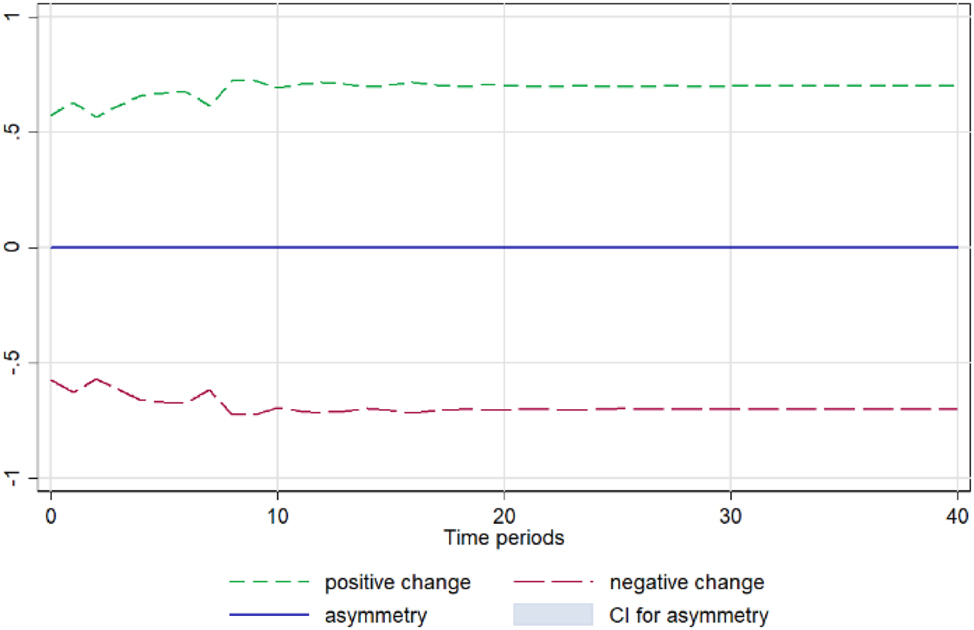
Orange. Notes: 90 % bootstrap Confidence Interval is based on 200 replications. Source: Author’s calculations based on data from the Greek Ministry of Development and the Central Market.
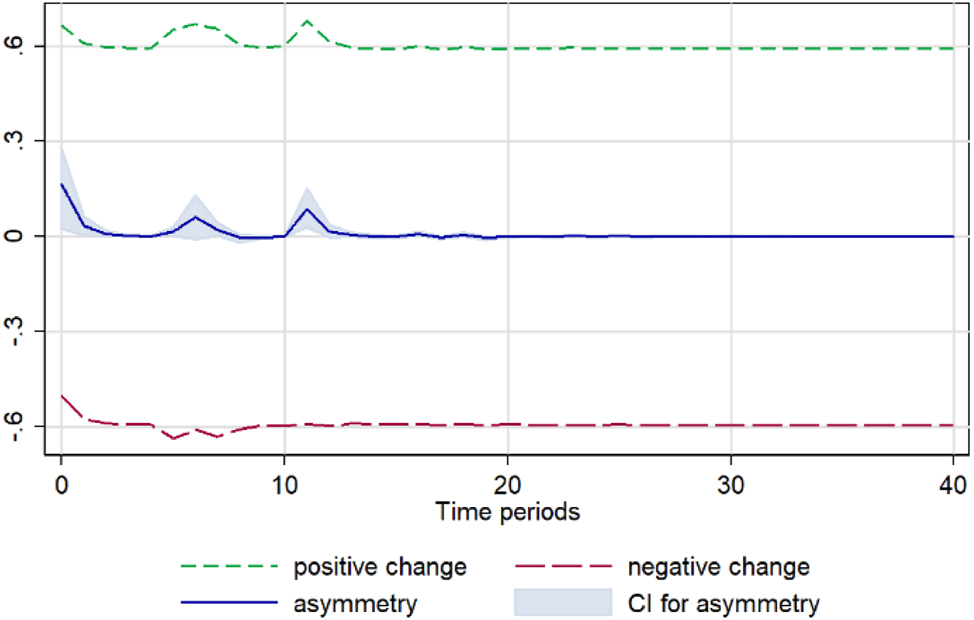
Pepper. Notes: 90 % bootstrap Confidence Interval is based on 200 replications. Source: Author’s calculations based on data from the Greek Ministry of Development and the Central Market.
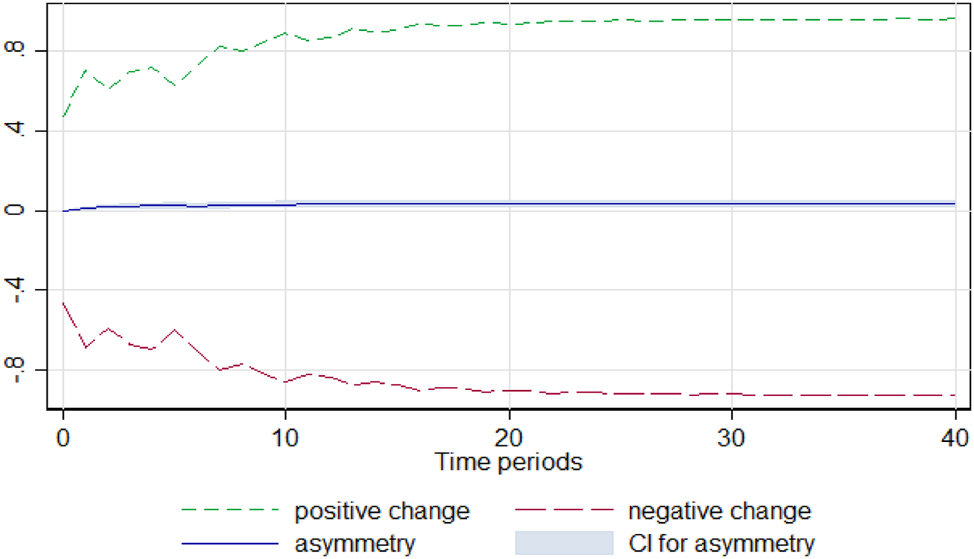
Potato. Notes: 90 % bootstrap Confidence Interval is based on 200 replications. Source: Author’s calculations based on data from the Greek Ministry of Development and the Central Market.
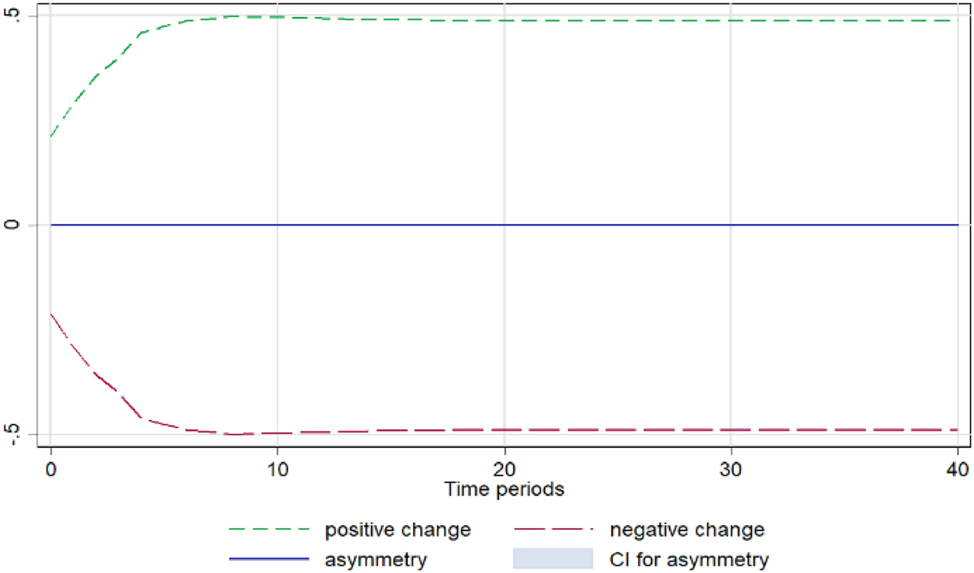
Spinach. Notes: 90 % bootstrap Confidence Interval is based on 200 replications. Source: Author’s calculations based on data from the Greek Ministry of Development and the Central Market.
Tomato. Notes: 90 % bootstrap Confidence Interval is based on 200 replications. Source: Author’s calculations based on data from the Greek Ministry of Development and the Central Market.
Zucchini. Notes: 90 % bootstrap Confidence Interval is based on 200 replications. Source: Author’s calculations based on data from the Greek Ministry of Development and the Central Market.
Acknowledgements
This paper is based on Chapter 2 of my Ph.D. thesis at the Department of Economics of the Athens University of Economics and Business. I am indebted to Christos Genakos for helpful discussions and constructive criticism. I am also grateful to colleagues at the Hellenic Competition Commission, and especially to Ioannis Lianos and Ioannis Kalozymis for fruitful discussions and valuable comments. All errors are mine.
References
Apergis, N., and G. Vouzavalis. 2018. “Asymmetric Pass-Through of Oil Prices to Gasoline Prices: Evidence from a New Country Sample.” Energy Policy 114: 519–28. https://doi.org/10.1016/j.enpol.2017.12.046.Search in Google Scholar
Atil, A., A. Lahiani, and D. K. Nguyen. 2014. “Asymmetric and Nonlinear Pass-Through of Crude Oil Prices to Gasoline and Natural Gas Prices.” Energy Policy 65: 567–73. https://doi.org/10.1016/j.enpol.2013.09.064.Search in Google Scholar
Bachmeier, J. L., and M. J. Griffin. 2003. “New Evidence on Asymmetric Gasoline Price Responses.” The Review of Economics and Statistics 85 (3): 772–6. https://doi.org/10.1162/003465303322369902.Search in Google Scholar
Bacon, R. W. 1991. “Rockets and Feathers: The Asymmetric Speed of Adjustment of U.K. Retail Gasoline Prices to Cost Changes.” Energy Economics 13 (3): 211–8. https://doi.org/10.1016/0140-9883(91)90022-R.Search in Google Scholar
Bajo-Buenestado, R., and M. Á. Borrella-Mas. 2022. “The Heterogeneous Tax Pass-Through Under Different Vertical Relationships.” The Economic Journal 132: 1684–708. https://doi.org/10.1093/ej/ueac007.Search in Google Scholar
Banerjee, A., J. Dolado, and R. Mestre. 1998. “Error‐Correction Mechanism Tests for Cointegration in a Single‐Equation Framework.” Journal of Time Series Analysis 19 (3): 267–83. https://doi.org/10.1111/1467-9892.00091.Search in Google Scholar
Bareith, T., I. Fertő, and S. Podruzsik. 2025. “Price Transmission in the Hungarian Pork Market.” Agriciltural and Food Economics 13: 11. https://doi.org/10.1186/s40100-025-00353-x.Search in Google Scholar
Borenstein, S., Cameron A. Colin, and R. Gilbert. 1997. “Do Gasoline Prices Respond Asymmetrically to Crude Oil Price Changes?” The Quarterly Journal of Economics 112 (1): 305–39. https://doi.org/10.1162/003355397555118.Search in Google Scholar
Chavas, J.-P., and F. Pan. 2020. “The Dynamics and Volatility of Prices in a Vertical Sector.” American Journal of Agricultural Economics 102: 353–69. https://doi.org/10.1093/ajae/aaz038.Search in Google Scholar
Delatte, A. L., and A. Lopez-Villavicencio. 2012. “Asymmetric Exchange Pass-Through: Evidence from Major Countries.” Journal of Macroeconomics 34 (3): 833–44. https://doi.org/10.1016/j.jmacro.2012.03.003.Search in Google Scholar
Deltas, George. 2008. “Retail Gasoline Price Dynamics and Local Market Power.” The Journal of Industrial Economics LVI (3): 613–28. https://doi.org/10.1111/j.1467-6451.2008.00350.x.Search in Google Scholar
European Competition Network. 2012. ECN Activities in the Food Sector.Search in Google Scholar
Fousekis, P., C. Katrakilidis, and E. Trachanas. 2016. “Vertical Price Transmission in the US Beef Sector: Evidence from the Nonlinear ARDL Model.” Economic Modelling 52 (2): 499–506. https://doi.org/10.1016/j.econmod.2015.09.030.Search in Google Scholar
Frey, G., and M. Manera. 2007. “Econometric Models of Asymmetric Price Transmission.” Journal of Economic Surveys 21 (2): 349–415. https://doi.org/10.1111/j.1467-6419.2007.00507.x.Search in Google Scholar
Gopinath, G., R. Rigobon, and O. Itskhoki. 2010. “Currency Choice and Exchange Rate Pass-Through.” American Economic Review 100 (1): 304–36. https://doi.org/10.1257/aer.100.1.304.Search in Google Scholar
Granger, Clive W. J., and G. Yoon. 2002. “Hidden Cointegration.” University of California. Economics Working Paper No. 2002-02, Available at SSRN: https://ssrn.com/abstract=313831 (accessed April 23, 2025).10.2139/ssrn.313831Search in Google Scholar
Greenwood-Nimmo, M., Y. Shin, T. van Treeck, and B. Yu. 2013. “The Decoupling of Monetary Policy from long-term Rates in the U.S. During the Great Moderation.” Working paper, Available at SSRN: https://ssrn.com/abstract=1894621 (accessed April 22, 2025).10.2139/ssrn.1894621Search in Google Scholar
Hellenic Competition Commission. Fruits and Vegetables Sectorial Study. 2013. Summary available at (in Greek): https://www.taxheaven.gr/pagesdata/EKTHESI/PERILIPSI.pdf, and Appendix1 available at (in Greek): https://www.taxheaven.gr/pagesdata/EKTHESI/PARARTHMAi.pdf (accessed April 7, 2025).Search in Google Scholar
Hellenic Statistical, Authority. 2013. Household Budget Survey. Available at (in Greek): https://www.statistics.gr/el/statistics/-/publication/SFA05/2013 (accessed April 7, 2025).Search in Google Scholar
Lundberg, C., T. Skolrud, B. Adrangi, and A. Chatrath. 2021. “Oil Price Pass Through to Agricultural Commodities.” American Journal of Agricultural Economics 103: 721–42. https://doi.org/10.1002/ajae.12088.Search in Google Scholar
Meyer, J., and S. von Cramon-Taubadel. 2004. “Asymmetric Price Transmission: A Survey.” Journal of Agricultural Economics 55 (3): 581–611, https://doi.org/10.1111/j.1477-9552.2004.tb00116.x.Search in Google Scholar
Nakamura, E. and D. Zerom. 2010. “Accounting for Incomplete Pass-Through.” Review of Economic Studies 77 (3): 1192–230. https://doi.org/10.1111/j.1467-937X.2009.589.x.Search in Google Scholar
Panagiotou, D. 2021. “Asymmetric Price Responses of the US Pork Retail Prices to Farm and Wholesale Price Shocks: A Nonlinear ARDL Approach.” The Journal of Economic Asymmetries 23: e00185. https://doi.org/10.1016/j.jeca.2020.e00185.Search in Google Scholar
Peltzman, Sam. 2000. “Prices Rise Faster Than They Fall.” Journal of Political Economy 108 (3): 462–502. https://doi.org/10.1086/262126.Search in Google Scholar
Pesaran, M. H., and Y. Shin. 1998. “An Autoregressive Distributed Lag Modelling Approach to Cointegration Analysis.” In Econometrics and Economic Theory: The Ragnar Frisch Centennial Symposium, edited by S. Strom. Cambridge: Cambridge University Press.Search in Google Scholar
Pesaran, M. H., Y. Shin, and J. R. Smith. 2001. “Bounds Testing Approaches to the Analysis of Level Relationships.” Journal of Applied Econometrics 16 (3): 289–326. https://doi.org/10.1002/jae.616.Search in Google Scholar
Polemis, M., and M. Tsionas. 2016. “An Alternative Semiparametric Approach to the Modelling of Asymmetric Gasoline Price Adjustment.” Energy Economics 56 (3): 384–8. https://doi.org/10.1016/j.eneco.2016.04.004.Search in Google Scholar
Rahman, M. C., V. O. Pede, and J. Balié. 2022. “Welfare Impact of Asymmetric Price Transmission on Rice Consumers in Bangladesh.” Review of Development Economics 26: 1600–17. https://doi.org/10.1111/rode.12882.Search in Google Scholar
Remer, M. 2015. “An Empirical Investigation of the Determinants of Asymmetric Pricing.” International Journal of Industrial Organization 42 (3): 46–56. https://doi.org/10.1016/j.ijindorg.2015.07.002.Search in Google Scholar
Rezitis, N. A.. 2019. “Investigating Price Transmission in the Finnish Dairy Sector: An Asymmetric NARDL Approach.” Empirical Economics 57 (3): 861–900. https://doi.org/10.1007/s00181-018-1482-z.Search in Google Scholar
Shin, Y., B. Yu, and M. Greenwood-Nimmo. 2014. “Modelling Asymmetric Cointegration and Dynamic Multipliers in a Nonlinear ARDL Framework.” In Festschrift in Honor of Peter Schmidt, edited by R. Sickles, and W. Horrace, 281–314. New York: Springer.10.1007/978-1-4899-8008-3_9Search in Google Scholar
Tripathi, A. K. 2024. “Price Support Policy and Market Price Dynamics: The Case of Indian Wheat.” Agricultural Economics 55: 412–27. https://doi.org/10.1111/agec.12825.Search in Google Scholar
Verheyen, F. 2013. “Exchange Rate Nonlinearities in EMU Exports to the U.S.” Economic Modelling 32 (1): 66–76. https://doi.org/10.1016/j.econmod.2013.01.039.Search in Google Scholar
Ward, R. W. 1982. “Asymmetry in Retail, Wholesale, and Shipping Point Pricing for Fresh Vegetables.” American Journal of Agricultural Economics 64 (2): 205–12. https://doi.org/10.2307/1241124.Search in Google Scholar
Yang, J. 2007. “Is Exchange Rate Pass-Through Symmetric? Evidence from US Imports.” Applied Economics 39 (2): 169–78. https://doi.org/10.1080/00036840500427320.Search in Google Scholar
© 2025 Walter de Gruyter GmbH, Berlin/Boston