How Effective is Population-Based Cancer Screening? Regression Discontinuity Estimates from the US Guideline Screening Initiation Ages
-
Srikanth Kadiyala


Abstract
We estimate the marginal benefits of population-based cancer screening by comparing cancer test and detection rates on either side of US guideline-recommended initiation ages (age 40 for breast cancer and age 50 for colorectal cancer during the study period). Using a regression discontinuity design and self-reported test data from national health surveys, we find test rates for breast and colorectal cancer increase at the guideline age thresholds by 109% and 78%, respectively. Data from cancer registries in twelve US states indicate that cancer detection rates increase at the same thresholds by 50% and 49%, respectively. We estimate significant effects of screening on earlier breast cancer detection (1.2 cases/1000 screened) at age 40 and colorectal cancer detection (1.1 cases/1000 individuals screened) at age 50. Forty-eight and 73% of the increases in breast and colorectal case detection occur among middle-stage cancers (localized and regional) with most of the remainder among early-stage (in-situ). Our analysis suggests that the cost of detecting an asymptomatic case of breast cancer at age 40 via population-based screening is $107,000–134,000 and that the cost of detecting an asymptomatic case of colorectal cancer at age 50 is $473,000–485,000.
Acknowledgments
We thank Michael Anderson, Marianne Bitler, Tom Chang, David Cutler, Christopher Carpenter, Ruth Etzioni, Eduardo Franco, Roman Gulati, James Hanley, Sam Harper, Jay Kaufman, Sendhil Mullainathan, Carolyn Rutter, 4 anonymous referees, the editor and participants in several seminars for helpful comments, and Zhijin Chai and Sam Masters for excellent research assistance. Erin Strumpf was supported by a Chercheur Boursier Junior 1 from the Fonds de la Recherche du Québec-Santé and the Ministère de la Santé et des Services sociaux du Québec.
Appendix 1: Additional Mortality Analyses
US Mortality Data (Vital Statistics 2000–2006)
Figures A1 and A2 plot age-specific breast and colorectal cancer mortality rates, respectively, compared with predicted mortality rates based on ages where guidelines were not in effect. We ran a linear regression of log mortality on age for ages at which the higher screening rates should not affect mortality (ages 40–44 for breast cancer, ages 45–49 for colorectal) and used the resulting coefficients to predict age-specific mortality at all ages. As expected, there are no visually identifiable discontinuities in observed breast cancer mortality at age 40 or colorectal cancer mortality at age 50, but we see a clear divergence between the actual and predicted breast cancer mortality rates. For 5-year age groups, we flexibly test to see if the relative cancer mortality rate differs from the predicted relative rate using the following regression model:
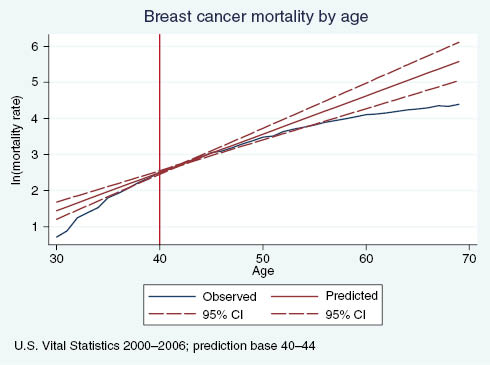
Observed vs. predicted breast cancer mortality rates, by age.
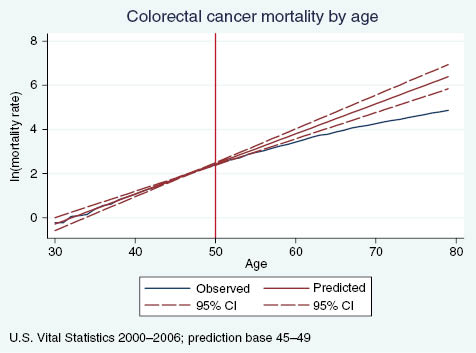
Observed vs. predicted colorectal cancer mortality rates, by age.
where the dependent variable is the log of the age-cancer-specific mortality rate, AgeGroup is a set of 5-year age group indicators, and Observed is an indicator for observed data. The set of λ3 parameters indicates whether the relative mortality rates in the observed data are statistically different from the predicted values.
Columns a and b in Table A1 present results for breast and colorectal cancer mortality. Beginning at ages 50–54, about 10 years after the sharp increase in screening rates, we observe that breast cancer mortality rates relative to ages 40–44 are significantly lower in the observed data than the predicted. The gap remains statistically significant and grows in magnitude as age increases. Similarly, beginning at ages 55–59, about 5 years after the sharp increase in colorectal cancer screening rates, mortality rates relative to ages 45–49 are significantly lower in the observed data than what we predicted. This evidence supports the hypothesis that the discontinuous increase in screening rates for breast and colorectal cancer impact mortality. Specifically, we observe a significant decrease in the growth of the mortality rate that increases with age and does not appear contemporaneously with the change in screening rates, but rather after a sufficient lag to allow screening to causally impact mortality.
Relative Cancer Mortality.
| US observed mortality vs. Predicted mortality | US observed mortality vs. Canadian observed mortality | ||||
|---|---|---|---|---|---|
| Breast cancer | Colorectal cancer | Breast cancer | Colorectal cancer | ||
| a | b | c | d | ||
| 30–34 | –1.0602*** | –2.0637*** | |||
| 0.0447 | 0.0558 | ||||
| 35–39 | –0.5301*** | –1.3758*** | 35–39 | –0.6426*** | –1.3680*** |
| 0.0447 | 0.0558 | 0.0407 | 0.0485 | ||
| 40–44 | Ref | –0.6879*** | 40–44 | Ref | –0.6947*** |
| 0.0558 | 0.0485 | ||||
| 45–49 | 0.5301*** | Ref | 45–49 | 0.4797*** | Ref |
| 0.0447 | 0.0407 | ||||
| 50–54 | 1.0602*** | 0.6879*** | 50–54 | 0.9020*** | 0.6008*** |
| 0.0447 | 0.0558 | 0.0407 | 0.0485 | ||
| 55–59 | 1.5904*** | 1.3758*** | 55–59 | 1.2129*** | 1.1172*** |
| 0.0447 | 0.0558 | 0.0407 | 0.0485 | ||
| 60–64 | 2.1205*** | 2.0637*** | 60–64 | 1.4349*** | 1.6055*** |
| 0.0447 | 0.0558 | 0.0407 | 0.0485 | ||
| 65–69 | 2.6506*** | 2.7516*** | 65–69 | 1.6031*** | 2.0267*** |
| 0.0447 | 0.0558 | 0.0407 | 0.0485 | ||
| 70–74 | 3.1807*** | 3.4395*** | 70–74 | 1.8038*** | 2.3882*** |
| 0.0447 | 0.0558 | 0.0407 | 0.0485 | ||
| 75+ | 4.0289*** | 4.5402*** | 75+ | 2.0032*** | 2.7188*** |
| 0.0381 | 0.0476 | 0.0407 | 0.0485 | ||
| Observed | 0.0000 | 0.0014 | Canada | –0.1236** | –0.1037* |
| 0.0447 | 0.0558 | 0.0407 | 0.0485 | ||
| 30–34*obs | –0.5055*** | –0.0020 | |||
| 0.0632 | 0.0789 | ||||
| 35–39*obs | –0.1075 | 0.0128 | 35–39*Can | 0.0476 | –0.1223 |
| 0.0632 | 0.0789 | 0.0575 | 0.0686 | ||
| 40–44*obs | Ref | –0.0027 | 40–44*Can | Ref | –0.1469* |
| 0.0789 | 0.0686 | ||||
| 45–49*obs | –0.0450 | ref | 45–49*Can | 0.1061 | ref |
| 0.0632 | 0.0575 | ||||
| 50–54*obs | –0.1592* | –0.090 | 50–54*Can | 0.1887*** | 0.1157 |
| 0.0632 | 0.079 | 0.0575 | 0.0686 | ||
| 55–59*obs | –0.3709*** | –0.2658*** | 55–59*Can | 0.1157* | 0.2447*** |
| 0.0632 | 0.0789 | 0.0575 | 0.0686 | ||
| 60–64*obs | –0.6720*** | –0.4674*** | 60–64*Can | 0.2113*** | 0.2425*** |
| 0.0632 | 0.0789 | 0.0575 | 0.0686 | ||
| 65–69*obs | –1.0397*** | –0.7356*** | 65–69*Can | 0.1701** | 0.2655*** |
| 0.0632 | 0.0789 | 0.0575 | 0.0686 | ||
| 70–74*obs | –1.3718*** | –1.0636*** | 70–74*Can | 0.1832** | 0.2667*** |
| 0.0632 | 0.0789 | 0.0575 | 0.0686 | ||
| 75+*obs | –1.8748*** | –1.6154*** | 75+*Can | 0.2143*** | 0.3080*** |
| 0.0539 | 0.0673 | 0.0575 | 0.0686 | ||
| Constant | 2.7163*** | 2.0252*** | Constant | 2.7341*** | 2.0324*** |
| 0.0316 | 0.0394 | 0.0288 | 0.0343 | ||
| N | 784 | 784 | N | 540 | 540 |
Predicted mortality calculated using a linear model based on ages 40–44 for breast cancer and ages 45–49 for colorectal cancer. Ref=reference group.
Results are robust to adding year fixed effects, year*agegroup and year*canada interactions.
Data source: colum ns a and b – US Vital Statistics 2000–2006 ages 30–85; columns c and d – US and Canadian Vital Statistics 2000–2005 ages 35–79.
US-Canada Comparison of Cancer Mortality
Figures A3 and A4 illustrate log age-specific cancer mortality rates from breast and colorectal cancer in Canada and the US, with only the case of colorectal cancer demonstrating support for our initial hypotheses based on a visual assessment. Estimating the following regression allows us to examine whether the relative mortality rates for various five-year age groups are significantly different in Canada relative to the US, after controlling for fixed differences across countries and shared age trends:
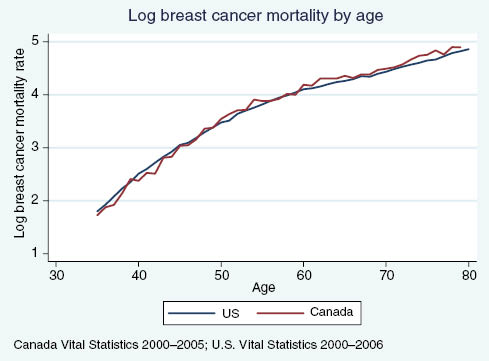
US vs. Canadian breast cancer mortality rates, by age.
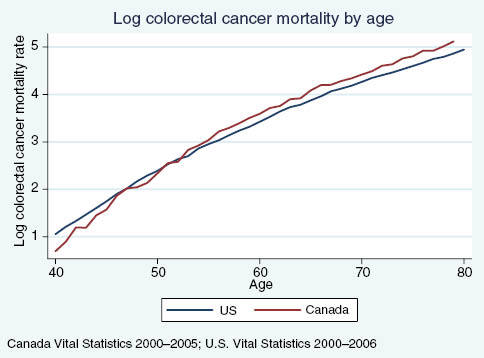
US vs. Canadian colorectal cancer mortality rates, by age.
Column c in Table A1 shows that the relative breast cancer mortality rates in the two countries are similar in the 35–39 and 45–59 age groups, but among the 50–54 year olds Canadian relative mortality is higher than in the US. This supports the hypothesis that screening affects mortality, since the screening rate has been effective for 10 years of age in the US, while the screening rate among Canadian women increases sharply only at age 50 (Strumpf et al. 2010). From ages 55–59, relative mortality rates are closer, which could indicate an impact of the change in Canadian screening patterns at age 50. However, we see that by ages 60 and 70 Canada is not “catching up,” but rather that the relative mortality rate remains significantly higher than in the US. While this could be interpreted as evidence against population-based screening impacting mortality, it could also be the result of differences in treatment conditional on screening and detection. Furthermore, we have documented that, while we do observe a discontinuous increase in mammography rates at the Canadian recommended initiation age of 50, Canadian breast cancer screening rates are close to those observed in the US only for a short span of ages, approximately 55–65 (Kadiyala and Strumpf 2011). Other explanations for the observation that Canadian breast cancer mortality rates remain higher than in the US is that the screening initiation age of 50 is “too late” or that Canadian mammography rates are not high enough over a long enough age range to significantly impact relative mortality.
The results for colorectal cancer in Column d also show support for a mortality effect due to increased screening at age 50. Canadian colorectal cancer screening rates do not exhibit a discontinuity at age 50 and remain 5–10 percentage points below US rates from age 50–80. In ages 40–44, US colorectal cancer mortality is higher than in Canada but mortality rates between the two countries converge soon after. From ages 55 on, about 5 years after the increase in screening at age 50 in the US, we again begin to see a divergence in colorectal cancer mortality patterns between these two countries. Canadian colorectal cancer mortality rates surpass US mortality and are approximately 25% higher than US rates.
Appendix 2: Additional Tables and Figures
Covariate Comparison Just Above and Below the Guideline-Recommended Initiation Age.
| Age | p | N | ||
|---|---|---|---|---|
| 35–39 | 41–44 | |||
| Breast cancer sample | ||||
| Non-white | 0.403 | 0.350 | 0.000 | 39,153 |
| Less than high school | 0.119 | 0.107 | 0.132 | 39,250 |
| High school | 0.237 | 0.260 | 0.006 | |
| Some college | 0.272 | 0.291 | 0.028 | |
| College grad | 0.372 | 0.342 | 0.001 | |
| Income quartile 1 | 0.131 | 0.119 | 0.129 | 35,607 |
| Income quartile 2 | 0.149 | 0.138 | 0.117 | |
| Income quartile 3 | 0.120 | 0.121 | 0.924 | |
| Income quartile 4 | 0.599 | 0.622 | 0.027 | |
| Married | 0.696 | 0.704 | 0.387 | 38,931 |
| Divorced | 0.140 | 0.171 | 0.000 | |
| Never married | 0.121 | 0.084 | 0.000 | |
| Widowed | 0.008 | 0.015 | 0.000 | |
| Couple | 0.043 | 0.031 | 0.022 | 29,967 |
| Health insurance | 0.841 | 0.860 | 0.012 | 39,322 |
| Age | p | N | ||
| 45–49 | 51–54 | |||
| Colorectal cancer sample | ||||
| Non-white | 0.178 | 0.165 | 0.041 | 18,868 |
| Less than high school | 0.120 | 0.120 | 0.990 | 18,635 |
| High school | 0.299 | 0.284 | 0.063 | |
| Some college | 0.294 | 0.304 | 0.214 | |
| College grad | 0.290 | 0.294 | 0.565 | |
| Married | 0.680 | 0.693 | 0.090 | 18,771 |
| Divorced | 0.158 | 0.171 | 0.020 | |
| Never married | 0.100 | 0.070 | 0.000 | |
| Widowed | 0.015 | 0.029 | 0.000 | |
| Couple | 0.048 | 0.037 | 0.003 | |
| Health insurance | 0.851 | 0.876 | 0.000 | 18,822 |
| Male | 0.489 | 0.494 | 0.540 | 18,868 |
Weighted means to account for survey sample designs. Breast cancer sample: BRFSS 2000, 2002, 2004, 2006, 2008. Colorectal cancer sample: NHIS 2000, 2003, 2005, 2008.
Screening Test Use According Risk Factor Characteristics.
| Breast cancer screening: BRFSS data Estimated discontinuity in test rate | Colorectal cancer screening: NHIS data Estimated discontinuity in test rate | |||||||
|---|---|---|---|---|---|---|---|---|
| Percent with risk factor at age 39 | With risk factor | Without risk factor | Overall average | Percent with risk factor at age | With risk factor | Without risk factor | Overall average | |
| 1 | 2 | 3 | 4 | 1 | 2 | 3 | 4 | |
| Smokes every day | 15.1% | 18.4 (2.9) | 25.3 (1.5) | 24 (1.3) | 21.0% | 2.9 (1.9) | 8.5 (1.1) | 7.4 (1.0) |
| Average 2 or more drinks day | 3.2% | 13.1 (7.4) | 25.4 (1.5) | 24 (1.3) | 5.0% | 4.9 (3.7) | 7.6 (1.0) | 7.4 (1.0) |
| Average 3 or more drinks day | 2.6% | 8.8 (8.5) | 25.4 (1.5) | 24 (1.3) | 3.0% | 1.6 (4.2) | 7.6 (1.0) | 7.4 (1.0) |
| Obese (BMI>30) | 24.0% | 18.8 (1.5) | 21.1 (0.9) | 24 (1.3) | 32.0% | 6.7 (1.2) | 8.9 (1.8) | 7.4 (1.0) |
| Self reported health (Good/Fair/Poor) | 38.0% | 24.9 (2.2) | 23.5 (1.7) | 24 (1.3) | 44.0% | 7.1 (1.3) | 7.7 (1.6) | 7.4 (1.0) |
| No exercise | 19.7% | 23.6 (1.6) | 26.3 (1.6) | 24 (1.3) | 65.4% | 5.2 (0.014) | 8.7 (1.4) | 7.4 (1.0) |
BRFSS data: SEER states 2000, 2002, 2004, 2006, 2008, except for alcohol use and exercise, where the questions are not asked of everyone in 2000. NHIS data: all states 2000, 2003, 2005, 2008. Individual-level data used in regressions. Standard errors are parentheses and adjust for heteroskedasticity. All regressions drop the GRIA observations (age 40 for brest, 50 for colorectal), include linear age trends on either side of the GRIA, and use a 10-year bandwidth to maximize samples for the low-incidence risk factors. Weighted averages of discontinuities for individuals with and without risk factors (columns 2 and 3) will sum approximately to the figures in column 4. The time frames for questions regarding alcohol use and exercise are the past 30 days in the BRFSS and one year in the NHIS.
Breast and Colorectal Cancer Stage Distributions Detected Clinically (1970s) and via Screening (2000s).
| Stage distributions | Breast cancer | Colorectal cancer | ||
|---|---|---|---|---|
| 1975–1979 (%) | 2000–2008 (%) | 1975–1979 (%) | 2000–2008 (%) | |
| In Situ | 6.9 | 50.2 | 4.9 | 20.6 |
| Localized | 48.7 | 37.6 | 34.2 | 70.3 |
| Regional | 39.4 | 10.6 | 38.0 | 2.3 |
| Distant | 5.0 | 1.6 | 23.0 | 6.8 |
Data: SEER for various years; ages 40–45 for breast cancer and 50–55 for colorectal cancer. 1975–1979 stage distributions reflect clinical detection before screening was widespread. The 2000–2008 distributions reflect cases detected via increased screening at the guideline recommended ages.
Stage-Specific Survival Probabilities, 1975–1979.
| Years since diagnosis | Breast cancer | Colorectal cancer | |||||
|---|---|---|---|---|---|---|---|
| Localized | Regional | Distant | In-Situ | Localized | Regional | Distant | |
| 1 | 0.995 | 0.970 | 0.698 | 0.995 | 0.983 | 0.918 | 0.482 |
| 2 | 0.978 | 0.899 | 0.496 | 0.983 | 0.953 | 0.784 | 0.244 |
| 3 | 0.949 | 0.819 | 0.373 | 0.981 | 0.917 | 0.678 | 0.151 |
| 4 | 0.925 | 0.759 | 0.299 | 0.975 | 0.890 | 0.609 | 0.111 |
| 5 | 0.906 | 0.705 | 0.235 | 0.972 | 0.863 | 0.569 | 0.093 |
| 6 | 0.888 | 0.669 | 0.205 | 0.960 | 0.845 | 0.537 | 0.081 |
| 7 | 0.874 | 0.639 | 0.189 | 0.957 | 0.830 | 0.516 | 0.078 |
| 8 | 0.862 | 0.614 | 0.179 | 0.954 | 0.823 | 0.506 | 0.073 |
| 9 | 0.846 | 0.588 | 0.159 | 0.954 | 0.814 | 0.501 | 0.070 |
| 10 | 0.835 | 0.571 | 0.152 | 0.951 | 0.809 | 0.496 | 0.068 |
| 11 | 0.825 | 0.556 | 0.137 | 0.948 | 0.807 | 0.490 | 0.066 |
| 12 | 0.814 | 0.542 | 0.127 | 0.948 | 0.802 | 0.486 | 0.066 |
| 13 | 0.808 | 0.529 | 0.119 | 0.948 | 0.798 | 0.484 | 0.065 |
| 14 | 0.803 | 0.521 | 0.119 | 0.944 | 0.795 | 0.480 | 0.065 |
| 15 | 0.798 | 0.512 | 0.119 | 0.944 | 0.790 | 0.477 | 0.065 |
| 16 | 0.793 | 0.502 | 0.119 | 0.944 | 0.786 | 0.475 | 0.065 |
| 17 | 0.787 | 0.497 | 0.119 | 0.940 | 0.783 | 0.473 | 0.064 |
| 18 | 0.781 | 0.487 | 0.115 | 0.936 | 0.782 | 0.471 | 0.064 |
| 19 | 0.777 | 0.481 | 0.108 | 0.928 | 0.778 | 0.469 | 0.062 |
| 20 | 0.772 | 0.477 | 0.104 | 0.928 | 0.776 | 0.469 | 0.061 |
| 21 | 0.764 | 0.473 | 0.104 | 0.928 | 0.772 | 0.468 | 0.061 |
| 22 | 0.759 | 0.469 | 0.104 | 0.928 | 0.770 | 0.466 | 0.059 |
| 23 | 0.755 | 0.465 | 0.104 | 0.923 | 0.767 | 0.463 | 0.059 |
| 24 | 0.752 | 0.459 | 0.104 | 0.923 | 0.765 | 0.461 | 0.059 |
| 25 | 0.748 | 0.454 | 0.104 | 0.923 | 0.764 | 0.458 | 0.059 |
Data: US SEER 1975–1979.
We assume 100% survival for breast cancers detected in the in-situ stage.
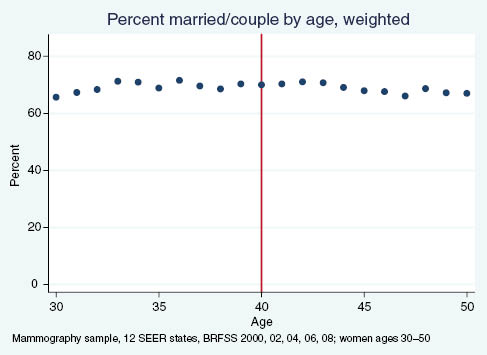
Percent of women reporting being married or in a couple, by age.
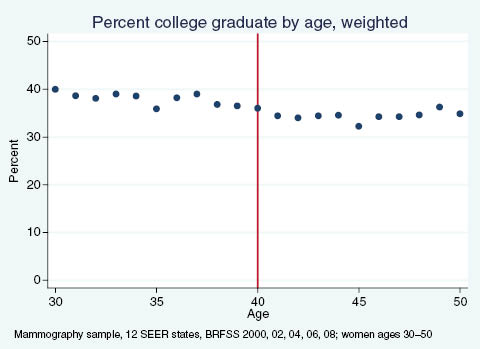
Percent of women reporting having graduated college, by age.
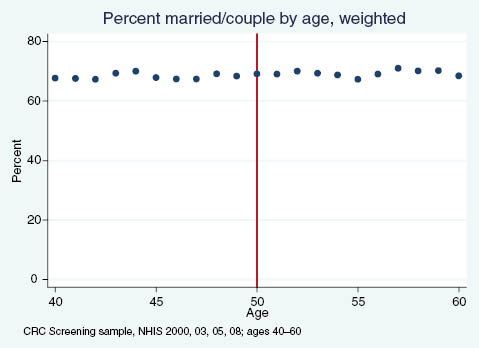
Percent of adults reporting being married or in a couple, by age.
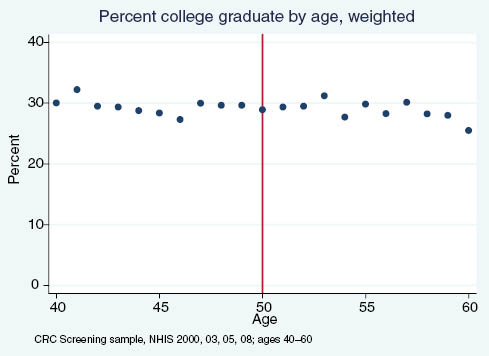
Percent of adults reporting having graduated college, by age.
References
American Cancer Society (1980) “Cancer of the Colon and Rectum,” CA Cancer Journal for Clinicians, 30(4):208–215.10.3322/canjclin.30.4.208Search in Google Scholar
American Cancer Society (1983) “Mammography Guidelines 1983: Background Statement and Update of Cancer-Related Checkup Guidelines for Breast Cancer Detection in Asymptomatic Women Age 40 to 49,” CA Cancer Journal for Clinicians, 33(4):255.10.3322/canjclin.33.4.255Search in Google Scholar
American Cancer Society (1990) “1989 Survey of Physicians’ Attitudes and Practices in Early Cancer Detection,” CA Cancer Journal for Clinicians, 40(2):77–101.10.3322/canjclin.40.2.77Search in Google Scholar
Andriole, G. L., E. D. Crawford, R. L. Grubb 3rd, S. S. Buys, D. Chia, T. R. Church, M. N. Fouad, E. P. Gelmann, P. A. Kvale, D. J. Reding, J. L. Weissfeld, L. A. Yokochi, B. O’Brien, J. D. Clapp, J. M. Rathmell, T. L. Riley, R. B. Hayes, B. S. Kramer, G. Izmirlian, A. B. Miller, P. F. Pinsky, P. C. Prorok, J. K. Gohagan and C. D. Berg, PLCO Project Team (2009) “Mortality Results from a Randomized Prostate-Cancer Screening Trial,” New England Journal of Medicine, 360(13):1310–1319.10.1056/NEJMoa0810696Search in Google Scholar
Berry, D. A., K. A. Cronin, S. K. Plevritis, D. G. Fryback, L. Clarke, M. Zelen, J. S. Mandelblatt, A. Y. Yakovlev, J. D. Habbema and E. J. Feuer, Cancer Intervention and Surveillance Modeling Network (CISNET) Collaborators (2005) “Effect of Screening and Adjuvant Therapy on Mortality from Breast Cancer,” New England Journal of Medicine, 353(17):1784–1792.10.1056/NEJMoa050518Search in Google Scholar
Bitler, Marianne P. and Christopher Carpenter (2016) “Health Insurance Mandates, Mammography, and Breast Cancer Diagnoses,” American Economic Journal – Economic Policy, forthcoming.10.3386/w16669Search in Google Scholar
Brenner, H., M. Hoffmeister, C. Stegmaier, G. Brenner, L. Altenhofen and U. Haug (2007) “Risk of Progression of Advanced Adenomas to Colorectal Cancer by Age and Sex: Estimates based on 840 149 Screening Colonoscopies,” Gut 56:1585–1589.10.1136/gut.2007.122739Search in Google Scholar
Carney, P. A., D. L. Miglioretti, B. C. Yankaskas, K. Kerlikowske, R. Rosenberg, C. M. Rutter, B. M. Geller, L. A. Abraham, S. H. Taplin, M. Dignan, G. Cutter and R. Ballard-Barbash (2003) “Individual and Combined Effects of Age, Breast Density, and Hormone Replacement Therapy use on the Accuracy of Screening Mammography,” Annals of Internal Medicine, 138(3):168–175.10.7326/0003-4819-138-3-200302040-00008Search in Google Scholar
Centers for Disease Control and Prevention (2003) **NHIS (National Health Interview Survey) (Online database- http://www.cdc.gov/nchs/nhis.htm). Atlanta, GA.Search in Google Scholar
Centers for Disease Control and Prevention (2006) BRFSS (Behavioral Risk Factor Surveillance System). http://www.cdc.gov/brfss/technical_infodata/surveydata.htm.Search in Google Scholar
CISNET – Cancer Intervention and Surveillance Modeling Network, U.S. National Institutes of Health, http://cisnet.cancer.gov/.Search in Google Scholar
Cutler, David M. (2008) “Are We Finally Winning the War on Cancer?” Journal of Economic Perspectives, 22(4):3–26.10.1257/jep.22.4.3Search in Google Scholar
Edwards, B. K., E. Ward, B. A. Kohler, C. Eheman, A. G. Zauber, R. N. Anderson, A. Jemal, M. J. Schymura, I. Lansdorp-Vogelaar, L. C. Seeff, M. van Ballegooijen, S. L. Goede and L. A. Ries (2010) “Annual Report to the Nation on the Status of Cancer, 1975–2006, featuring Colorectal Cancer Trends and Impact of Interventions (Risk Factors, Screening, and Treatment) to Reduce Future Rates,” Cancer, 116(3):544–573.10.1002/cncr.24760Search in Google Scholar
Etzioni, R., A. Tsodikov, A. Mariotto, A. Szabo, S. Falcon, J. Wegelin, D. DiTommaso, K. Karnofski, R. Gulati, D. F. Penson and E. Feuer (2008) “Quantifying the Role of PSA Screening in the US Prostate Cancer Mortality Decline,” Cancer Causes and Control, 19(2):175–181.10.1007/s10552-007-9083-8Search in Google Scholar
Falun Meeting Report of the Organizing Committee and Collaborators (1996) “Breast Cancer Screening with Mammography in Women Aged 40–49 years,” International Journal of Cancer, 68:693–699.10.1002/(SICI)1097-0215(19961211)68:6<693::AID-IJC1>3.0.CO;2-ZSearch in Google Scholar
Freeman, J. L., C. N. Klabunde, N. Schussler, J. L. Warren, B. A. Virnig and G. S. Cooper (2002) “Measuring Breast, Colorectal, and Prostate Cancer Screening with Medicare Claims Data,” Medical Care, 40(8)Supplement (August):IV36–IV42.10.1097/00005650-200208001-00005Search in Google Scholar
Hanley, J. A. (2005) “Analysis of Mortality Data From Cancer Screening Studies: Looking in the Right Window,” Epidemiology, 16(6):786–790.10.1097/01.ede.0000181313.61948.76Search in Google Scholar
Hanley, J. A., M. McGregor, Z. Liu, E. C. Strumpf and N. Dendukuri (2013) “Measuring the Mortality Impact of Breast Cancer Screening,” Canadian Journal of Public Health, 104(7):e437–e442.10.17269/cjph.104.4099Search in Google Scholar
Hendrick, R. E., R. A. Smith, J. H. Rutledge 3rd and C. R. Smart (1997) “Benefit of Screening Mammography in Women Aged 40–49: A New Metaanalysis of Randomized Controlled Trials,” Journal of National Cancer Institute Monographs, 22:87–92.10.1093/jncimono/1997.22.87Search in Google Scholar
Hendrick, R. E., G. R. Cutter, E. A. Berna, C. Nakano, J. Egger, P. A. Carney, L. Abraham, S. H. Taplin, C. J. D’Orsi, W. Barlow and J. G. Elmore (2005) “Community-Based Mammography Practice: Services, Charges, and Interpretation Methods,” American Journal of Roentgenology, 184:433–438.10.2214/ajr.184.2.01840433Search in Google Scholar
Hewitson, P., P. P. Glasziou, L. Irwig, B. Towler and E. Watson (2007) Screening for Colorectal Cancer using the Faecal Occult Blood Test, Hemoccult. The Cochrane Library.10.1002/14651858.CD001216.pub2Search in Google Scholar
Humphrey, L. L., M. Helfand, B. K. Chan and S. H. Woolf (2002) “Breast Cancer Screening: A Summary of the Evidence for the U.S. Preventive Services Task Force,” Annals of Internal Medicine, 137(5):347–360.10.7326/0003-4819-137-5_Part_1-200209030-00012Search in Google Scholar
Imperiale, T. F., D. R. Wagner, C. Y. Lin, G. N. Larkin, J. D. Rogge and D. F. Ransohoff (2000) “Risk of Advanced Proximal Neoplasms in Asymptomatic Adults According to the Distal Colorectal Findings,” New England Journal of Medicine, 343:169–174.10.1056/NEJM200007203430302Search in Google Scholar
Jemal, A., R. Siegel, J. Xu and E. Ward (2010) “Cancer Statistics, 2010,” CA Cancer Journal for Clinicians, 60:277–300.10.3322/caac.20073Search in Google Scholar
Kadiyala, S. and E. Strumpf (2011) “Are U.S. and Canadian Cancer Screening Rates Consistent with Guideline Recommendations with Respect to the Age of Screening Initiation?” International Journal for Quality in Health Care, 23(6):611–620.10.1093/intqhc/mzr050Search in Google Scholar
Kalager, M., M. Zelen, F. Langmark and H. O. Adami (2010) “Effect of Screening Mammography on Breast-Cancer Mortality in Norway,” New England Journal of Medicine, 363(13):1203–1210.10.1056/NEJMoa1000727Search in Google Scholar
Kerlikowske, K., D. Grady, J. Barclay, E. A. Sickles, A. Eaton and V. Ernster (1993) “Positive Predictive Value of Screening Mammography by Age and Family History of Breast Cancer,” JAMA: The Journal of the American Medical Association, 270(20):2444–2450.10.1001/jama.1993.03510200050031Search in Google Scholar
Kerlikowske, K., D. Grady, S. M. Rubin, C. Sandrock and V. L. Ernster (1995). “Efficacy of screening mammography: a meta-analysis,” JAMA: The Journal of the American Medical Association, 273(2):149–154.10.1001/jama.1995.03520260071035Search in Google Scholar
Kerlikowske, K., D. Grady, J. Barclay, E. A. Sickles and V. Ernster (1996) “Likelihood Ratios for Modern Screening Mammography. Risk of Breast Cancer based on Age and Mammographic Interpretation,” JAMA, 276(1):39–43.10.1001/jama.276.1.39Search in Google Scholar
Knudsen, A. B. (2005) “Explaining Secular Trends in Colorectal Cancer Incidence and Mortality with an Empirically-Calibrated Microsimulation Model.” PhD dissertation, Harvard U.Search in Google Scholar
Kopans, Daniel B. (1994) “Screening for breast cancer and mortality reduction among women 40–49 years of age.” Cancer, 74(S1):311–322.10.1002/cncr.2820741316Search in Google Scholar
Lee, David S. and David Card (2008) “Regression Discontinuity Inference with Specification Error,” Journal of Econometrics, 142(2):655–674.10.3386/t0322Search in Google Scholar
Lee, David S. and Thomas Lemieux (2010) “Regression Discontinuity Designs in Economics,” Journal of Economic Literature, 48: 281–355.10.3386/w14723Search in Google Scholar
Lieberman, D. A., D. G. Weiss, J. H. Bond, D. J. Ahnen, H. Garewal and G. Chejfec (2000) “Use of Colonoscopy to Screen Asymptomatic Adults for Colorectal Cancer,” New England Journal of Medicine, 343:162–168.10.1056/NEJM200007203430301Search in Google Scholar
Mariotto, A. B., K. R. Yabroff, Y. Shao, E. J. Feuer and M. L. Brown (2011) “Projections of the Cost of Cancer Care in the United States: 2010–2020,” Journal of the National Cancer Institute, 103(2):117–128.10.1093/jnci/djq495Search in Google Scholar
McCrary, J. (2008). “Manipulation of the running variable in the regression discontinuity design: A density test,” Journal of Econometrics, 142:698–714.10.3386/t0334Search in Google Scholar
Miettinen, O. S., C. I. Henschke, M. W. Pasmantier, J. P. Smith, D. M. Libby and D. F. Yankelevitz (2002) “Mammographic Screening: No Reliable Supporting Evidence?” Lancet, 359(9304):404–405.10.1016/S0140-6736(02)07592-XSearch in Google Scholar
Moss, S. (2005a) “Overdiagnosis in Randomized Controlled Trials of Breast Cancer Screening,” Breast Cancer Research, 7(5):230–234.10.1186/bcr1314Search in Google Scholar
Moss, S., I. Thomas, A. Evans, B. Thomas and L. Johns, Trial Management Group (2005b) “Randomised Control Trial of Mammographic Screening in Women from Age 40: Results of Screening in the First 10 Years,” British Journal of Cancer, 92:949–954.10.1038/sj.bjc.6602396Search in Google Scholar
Moss, S. M., H. Cuckle, A. Evans, L. Johns, M. Waller and L. Bobrow, Trial Management Group (2006) “Effect of Mammographic Screening from Age 40 Years on Breast Cancer Mortality at 10 years’ Follow-Up: A Randomised Controlled Trial,” Lancet, 368(9552):2053–2060.10.1016/S0140-6736(06)69834-6Search in Google Scholar
National Cancer Institute (2007) “Costs of Cancer Care” Cancer Trends Progress Report – 2007 Update, NIH, DHHS, Bethesda, MD, http://progressreport.cancer.gov.Search in Google Scholar
National Cancer Institute, Surveillance, Epidemiology, and End Results Program, About SEER: Population Characteristics. (accessed May 14, 2015, at http://seer.cancer.gov/registries/characteristics.html).Search in Google Scholar
Nichols, Austin (2007) rd: Stata module for regression discontinuity estimation. http://ideas.repec.org/c/boc/bocode/s456888.html.Search in Google Scholar
Olivotto, I. A., L. Kan, Y. d’Yachkova, L. J. Burhenne, M. Hayes, T. G. Hislop, A. J. Worth, V. E. Basco and S. King (2000) “Ten years of breast screening in the Screening Mammography Program of British Columbia, 1988–97,” Journal of Medical Screening, 7(3):152–159.10.1136/jms.7.3.152Search in Google Scholar
Patz, E. F., Jr., P. Pinsky, C. Gatsonis, J. D. Sicks, B. S. Kramer, M. C. Tammemägi, C. Chiles, W. C. Black and D. R. Aberle, NLST Overdiagnosis Manuscript Writing Team (2014) “Overdiagnosis in Low-Dose Computed Tomography Screening for Lung Cancer,” JAMA Internal Medicine, 174(2):269–274.10.1001/jamainternmed.2013.12738Search in Google Scholar
Pignone, M., S. Saha, T. Hoerger and J. Mandelblatt (2002) “Cost-Effectiveness Analyses of Colorectal Cancer Screening: A Systematic Review for the U.S. Preventive Services Task Force,” Annals of Internal Medicine, 137(2):96–104.10.7326/0003-4819-137-2-200207160-00007Search in Google Scholar
Poplack, S. P., P. A. Carney, J. E. Weiss, L. Titus-Ernstoff, M. E. Goodrich and A. N. Tosteson (2005) “Screening Mammography: Costs and use of Screening-Related Services,” Radiology, 234(1):79–85.10.1148/radiol.2341040125Search in Google Scholar
Rathore, S. S., J. D. McGreevey 3rd, K. A. Schulman and D. Atkins (2000) “Mandated Coverage for Cancer-Screening Services: Whose Guidelines do States Follow?” American Journal of Preventive Medicine, 19(2):71–78.10.1016/S0749-3797(00)00179-3Search in Google Scholar
Salzmann, P., K. Kerlikowske and K. Phillips (1997) “Cost-effectiveness of extending screening mammography guidelines to include women 40 to 49 years of age,” Annals of Internal Medicine, 127(11):955–965.10.7326/0003-4819-127-11-199712010-00001Search in Google Scholar
Scholefield, J. H. (2000) “ABC of Colorectal Cancer Screening,” British Medical Journal 321:1004–1006.10.1136/bmj.321.7267.1004Search in Google Scholar
Skinner, J. and W. Zhou (2004) “The Measurement and Evolution of Health Inequality: Evidence from the U.S. Medicare Population,” NBER Working Paper No. 10842.10.3386/w10842Search in Google Scholar
Smart, C. R., E. R. Hendrick, J. H. Rutledge and R. A. Smith (1995) “Benefit of Mammography Screening in Women Ages 40 to 49 Years,” Cancer, 75(7):1619–1626.10.1002/1097-0142(19950401)75:7<1619::AID-CNCR2820750711>3.0.CO;2-TSearch in Google Scholar
Smith, R. A., V. Cokkinides and H. J. Eyre (2004) “CA CME – American Cancer Society Guidelines for the Early Detection of Cancer, 2004”. CA: A Cancer Journal for Clinicians, 54(1):41.Search in Google Scholar
Strumpf, E. C., Z. Chai and S. Kadiyala (2010) “Adherence to Cancer Screening Guidelines Across Canadian Provinces: An Observational Study” BMC Cancer, 10:304.10.1186/1471-2407-10-304Search in Google Scholar
USPSTF (United States Preventive Services Task Force) (2002a) “Screening for Colorectal Cancer: Recommendations and Rationale,” Annals of Internal Medicine, 137:129–131.10.7326/0003-4819-137-2-200207160-00014Search in Google Scholar
USPSTF (United States Preventive Services Task Force) (2002b) “Screening for Breast Cancer: Recommendations and Rationale,” Annals of Internal Medicine, 137:344–346.10.7326/0003-4819-137-5_Part_1-200209030-00011Search in Google Scholar
USPSTF (United States Preventive Services Task Force) (2008) “Screening for Prostate Cancer: U.S. Preventive Services Task Force Recommendation Statement,” Annals of Internal Medicine, 149:185–191.10.7326/0003-4819-149-3-200808050-00008Search in Google Scholar
USPSTF (United States Preventive Services Task Force) (2009a) “Screening for Breast Cancer: U.S. Preventive Services Task Force Recommendation Statement,” Annals of Internal Medicine, 151(10):716–726.10.7326/0003-4819-151-10-200911170-00008Search in Google Scholar
USPSTF (United States Preventive Services Task Force) (2009b) Diagnosis and Management of Ductal Carcinoma In Situ (DCIS). Evidence Report/Technology Assessment. Number 185.Search in Google Scholar
Vogelaar, I., M. van Ballegooijen, D. Schrag, R. Boer, S. J. Winawer, J. D. Habbema and A. G. Zauber (2006) “How Much Can Current Interventions Reduce Colorectal Cancer Mortality in the U.S.? Mortality Projections for Scenarios of Risk Factor Modification, Screening, and Treatment,” Cancer, 107(7):1624–1633.10.1002/cncr.22115Search in Google Scholar
Welch, H. Gilbert (2004) Should I Be Tested for Cancer? Maybe Not and Here’s Why. Berkeley: University of California Press.Search in Google Scholar
Wingo, P. A., L. A. G. Ries, H. M. Rosenberg, D. S. Miller and B. K. Edwards (1998) “Cancer Incidence and Mortality, 1973–1995: A report card for the U.S,” Cancer, 82(6):1197–1207.10.1002/(SICI)1097-0142(19980315)82:6<1197::AID-CNCR26>3.0.CO;2-0Search in Google Scholar
©2016 by De Gruyter
Articles in the same Issue
- Frontmatter
- Articles
- Salience and Health Campaigns
- Demand-Side Factors Associated with the Purchase of Long-Term Care Insurance
- Competitive Spillovers and Regulatory Exploitation by Skilled Nursing Facilities
- Returns to Society from Investment in Cancer Research and Development
- How Effective is Population-Based Cancer Screening? Regression Discontinuity Estimates from the US Guideline Screening Initiation Ages
- Quantifying Gains in the War on Cancer Due to Improved Treatment and Earlier Detection