
Shock Propagation in Dual-Circulation Production Networks: Characteristics and Simulation
-
Qunyong Wang
 and
Yan Xue
and
Yan Xue

Abstract
This article constructs a dual-circulation production network framework on the basis of integrating inter-country and China’s multi-regional input-output tables, identifies the propagation and attenuation of sectoral shocks in dual-circulation production networks, and measures the effects of US-China trade frictions on the networks. The research finds that: (1) The asymmetry between domestic- and international-circulation production networks has increased, and with a few sectors becoming key sectors to dual-circulation production networks, sectoral shocks grow increasingly critical for aggregate volatility. (2) Based on the above analytical framework, the global extraction method (GEM) is adopted to simulate the GDP losses in scenarios of China-US i ndustry-wide chain interruptions, certain sectoral frictions, and supply-side and demand-side chain interruptions. The simulation finds that increasing the domestic substitution rate will reduce the value losses caused by China-US chain interruptions, which is applied for both countries. However, even if full substitution can be achieved, the value losses cannot be avoided completely in the China-US decoupling. Whether it is the demand-side chain interruptions plus insufficient market substitution in China, or the supply-side chain interruptions plus insufficient supply substitution in the US, will cause great losses to their economy.
1 Introduction
The world economy has been in a period of profound changes and adjustments since the 2008 global financial crisis. Faced with a radical transformation unseen in a century, the internal endowments and external environment for China’s economic growth have undergone qualitative changes since the introduction of reform and opening up. The report of the 20th National Congress of the Communist Party of China (CPC) made it clear that “China has entered a period of development in which strategic opportunities, risks, and challenges are concurrent and uncertainties and unforeseen factors are rising. Various ‘black swan’ and ‘gray rhino’ events may occur at any time.” From a global perspective, global value chains (GVCs), as the driving force for economic growth in many countries/regions, have gradually waned under the crisis of trade protectionism and geopolitics; from the viewpoint of China’s economy, the factor endowments and dividends that once pushed its integration into GVCs are gradually exhausted. Under such circumstances, China would fall into a period of economic stagnation and the middle-income trap, if china do not adjust its pattern of economic growth as soon as possible. To this end, it is imperative to forge new growth momentum that conforms to the current era and China’s economic endowments. The 14th Five-Year Plan for Economic and Social Development has outlined for the first time that “China will quicken its pace in fostering a new development paradigm with the domestic economy as the mainstay and the domestic economy and international engagement providing mutual reinforcement”, which is a major strategic decision taken by the CPC Central Committee in light of the new development stage, new historical tasks and new environmental conditions (Liu, 2020) and points to the way of creating new impetus for China’s high-quality development under the profound changes unseen in a century.
Risk prevention is an issue that cannot be ignored in the midst of creating a new development paradigm for China’s economy. The current period is completely different from the hyper-globalization era in which China’s economy was driven by the embedded international circulation, but has seen anti-globalization accompanied by mounting uncertainties such as geopolitical conflicts. Therefore, as shaping a high-quality new paradigm for development, how to “prevent and defuse risks”, “improve the ability to prevent and resolve major risks”, and set up systems against shocks becomes a major issue in theoretical research and practical development.
Related literatures are mainly focused on the new development paradigm and the effects of shock on networks. The former category of literature works on creating a new development paradigm. The logic of evolution and the path of realization behind the dual circulation forms the foundation of this research interest. Throughout the current theoretical research concerning the new development paradigm, different logics are shared among several schools from political economy (Li et al., 2021; Pei and Liu, 2021; Qiao et al., 2023) to GVCs (Johnson and Noguera, 2017; Fan et al., 2019), and from the theory of economic integration (Huh and Park, 2020; ADB, 2021) to social network analysis (Li and Liu, 2022). The political economy, for instance, mostly examines from the perspective of Marxist capital circulation and social reproduction, and with the expansion of domestic demand as a point from which the logic of “taking the domestic economy as the mainstay” begins, it stresses the smooth circulation throughout production, distribution, exchange and consumption (Pei and Liu, 2021; Li et al., 2021). The theory of GVCs takes the inter-regional input-output theory as the logical starting point, emphasizes decomposition (Huang and Ni, 2021; Jiang and Meng, 2021; Ma et al., 2021; Liu et al, 2023), and judges the interactive relationship between domestic and international circulations by the interaction of added value and domestic and international demand. A logical starting point from which the theory of economic integration begins is the construction of integration indicators. This school of thought attempts to quantitatively measure intra-regional tightness of internal and external linkages by constructing comprehensive regional-economic-integration indexes that can reveal factor flows and price deviations in a given region (ADB, 2021), with a further effort to find out the respective contributions of internal and external linkages to the region’s economic growth (Huh and Park, 2020). In contrast, studies that analyze dual-circulation issues from the network perspective are rarely seen. The logic begins with locating the role and function of each node in network structures to examine the mutual support between the nodes and the law of evolution. Among them, Li and Liu (2022) analyzed the “domestic circulation” networks in China’s national economic circulation, while He and Yu (2022) analyzed the industrial linkages between China and the world market in the “international circulation”. Nevertheless, the analysis of networks constructing the dual circulation is not yet sufficient.
Another category of literature probes into the effects of shock on networks. In recent years, as the production process is disintegrated to interconnected activities and distributed to different economies, global production networks have taken shape and extended rapidly (Cheng, 2015; Los et al., 2015), and hence the “eff ects of shock on networks” has become a research frontier of the academic community. Studies by Acemoglu et al. (2012), Caliendo et al. (2014) and Carvalho (2014) proved that the asymmetric structure of production networks can enhance the effects of shock to cause greater macroeconomic volatility, which has also been verified by many empirical scholars (Tsekeris, 2017; Turco et al., 2019). Most of the above studies are based on intra-country input-output data. But in fact, what is more applicable to China’s dual-circulation issues should be based on a combination of inter-country and inter-provincial input-output tables, a kind of inter-regional input-output data. Now, the network analysis of external shocks on inter-regional input-output is still at an initial stage. Scholars including Dong and Ma (2020), Liu et al. (2020), Barauskaite and Nguyen (2021), and Gao et al. (2021) have made productive practices and accumulation, with studies either on inter-country input-output networks, or China’s inter-provincial input-output networks. However, the research on the shocks to dual-circulation production networks is still absent.
The marginal contributions of this article are as follows. (1) A dual-circulation production network framework based on input-output models is constructed as an attempt. By integrating inter-country and China’s multi-regional input-output tables, a composite input-output table covering China’s inter-provincial data and foreign countries/regions is formed. On this basis, the dual-circulation networks for intermediate goods trade and final goods are constructed as the basic analytical framework for this article. (2) The shock propagation of US-China trade frictions in domestic and international production networks, and the economic losses caused to different regions and industries are measured. For the first step, based on Pareto Distribution characteristics, the Bayesian Approach is employed to identify the propagation and attenuation of sectoral shocks in networks, and the shock attenuation differences between domestic and international circulation networks are compared; in the second step, the impact of short-term shock in dual-circulation production networks is measured quantitatively with the global extraction method (GEM), which examines the effects of chain interruption and substitution rate to varying levels on different industries of China and the US.
The rest of the article is presented as follows. Section 2 integrates inter-country and China’s multi-regional input-output tables and constructs a dual-circulation production network framework; Section 3 works on shock propagation and attenuation in production networks; Section 4 measures the effects of US-China trade frictions on domestic and international circulation networks and identifies regional and industrial risks; and Section 5 off ers the conclusions and policy insights.
2 Construction of Dual-Circulation Production Networks based on Input-output Tables
To depict the basic situation and linkages of China’s industrial and supply chains in domestic and international circulations more comprehensively from the supply side and the demand side, identify the weaknesses and risks in the dual circulation, and off er data support and policy arrangements, we construct the dual-circulation production networks based on inter-country and China’s multi-regional input-output tables as a foundation for subsequent research on the shock propagation in networks.
To this end, the underlying data and linkages required for dual circulation production networks need to be linked first. The input-output tables representing interregional flows of resources provide the fundamental linkages that make the network construction possible. As the inter-regional input-output tables within a country can show the economic ties among domestic regions and international input-output tables can show those among global economies, the two can be linked to demonstrate interregional input-output relationship at home and abroad for the study of cross-industry dependence and integration (Schweitzer et al., 2009; Yao et al., 2019).
This article attempts to integrate domestic and international input-output tables to serve data for the fundamental linkages between dual-circulation production networks. The OECD Inter-Country Input-Output (ICIO) table for 45 sectors in 67 economies is used for the international circulation, while the CEADs-compiled Multi-Regional Input-Output (MRIO) table containing 42 sectors in 31 provinces and cities of China is used for the domestic circulation. The two sets of data are new and comprehensive at industry classification. Since MRIO tables are not continuous, in this article, the three newest sets of data for 2012, 2015 and 2017 are selected for use. Given the inconsistent industry classification standards, ICIO and MRIO tables are consolidated to cover 21 sectors in this article by drawing on the approach of Gao and Wang (2020). [1]
Following the methodology of Dietzenbacher et al. (2013) and Ni and Xia (2016), the proportional factor is assumed to be constant for relevant data extrapolation. For example, the coefficient of intermediate inputs from abroad for each subregion in the ICIO-MRIO table is the same as that for China in ICIO tables; and the coefficient of distribution from each subregion abroad in the ICIO-MRIO table is the same as that from China to abroad in ICIO tables. The steps of consolidation are as follows. Firstly, ICIO and MRIO tables are consolidated to 21 sectors, and MRIO tables are converted into dollar-denominated tables by annual average rate of exchange. Secondly, the ICIO-MRIO table is constructed with direct inputs of data that need no extrapolation. Thirdly, based on the proportional factor as assumed, the distribution of intermediate and final goods imports and exports of mainland China’s 31 provinces and cities across global economies is extrapolated. Fourthly, the ICIO-MRIO table is adjusted to equilibrium according to the row-column balance in input-output tables. With a reference to Yao et al. (2019) and Lv et al. (2021), the international-domestic intermediate goods and final goods trade networks are constructed upon the ICIO-MRIO table, followed by an international-domestic industrial linkage network. Details of the methodology of integrating input-output tables, the consolidated data structure, and the descriptive statistical characteristics of networks are available upon request.
3 Short-Term Shock Propagation and Attenuation in Production Networks
The dual-circulation production networks have been constructed in the previous section, on the basis of which the dynamic feedback at the time when the networks are subjected to short-term shocks will be observed to see the scope of impact and evolution. Then, the direct consumption coefficient matrix will be generated upon intermediate goods and final goods trade networks, and the shock propagation and effects in the dual-circulation, domestic-circulation, international-circulation production networks are to be examined in the industrial-linkage dimension.
3.1 Model Setup for Shock Propagation and Attenuation in Production Networks
The input-output matrix, also called the direct consumption coefficient matrix, is taken as fundamental network data. With the total output matrix (X) and the intermediate goods trade matrix (Z), there is the direct consumption coefficient matrix (A=Z/X) as defined, and its first-order out-degree is as shown in Equation (1), which results in
Drawing on the model setup of Acemoglu et al. (2012), the volatility of total output is expressed as:
where the out-degree of sector n is denoted as
where the k-order out-degree of node i is denoted as
If the out-degree distribution follows a power law distribution, the aggregate volatility will be expressed as:
where the shape parameter β ∈[1, 2] represents the scaling form in the tails of the degree distribution and δ > 0 is a constant. If the economy exhibits fat-tailed distributions of inter-sectoral network out-degree sequence, the attenuation rate of aggregate volatility will be less than n(β −1)/β , and less than
3.2 Shock Propagation and Attenuation in Dual-Circulation Networks
As to verify the shock propagation in production networks, the Bayesian Approach is used to estimate the shape parameters of power-law out-degree distributions of domestic- and international-circulation industrial linkage networks. The estimation results are shown in Table 1. The Bayesian estimation and estimation results of dual-circulation industry linkage networks are available upon request. To highlight the shock attenuation in networks over time, the shape parameters are sequentially estimated from first- to tenth-order out-degree distributions. When the shape parameter estimate is βˆ, the aggregate volatility attenuates at a rate of
Estimation of Shape Parameter (β) of Dual-Circulation Industrial Linkage Network Out-Degree Distribution [1]
| Network type | International-circulation networks | Domestic-circulation networks | ||
|---|---|---|---|---|
| Order of correlation | 2012 | 2017 | 2012 | 2017 |
| 1 | 1.9622 | 1.8624 | 1.9116 | 1.8579 |
| (0.1168) | (0.1109) | (0.1181) | (0.1147) | |
| 2 | 1.5606 | 1.5620 | 1.4571 | 1.4373 |
| (0.0929) | (0.0930) | (0.0900) | (0.0888) | |
| 3 | 1.4521 | 1.4480 | 1.3167 | 1.2614 |
| (0.0865) | (0.0862) | (0.0813) | (0.0779) | |
| 4 | 1.4271 | 1.4084 | 1.2924 | 1.2229 |
| (0.0850) | (0.0839) | (0.0798) | (0.0755) | |
| 5 | 1.3551 | 1.3190 | 1.2541 | 1.1616 |
| (0.0807) | (0.0785) | (0.0775) | (0.0717) | |
| 6 | 1.2853 | 1.2947 | 1.2246 | 1.1431 |
| (0.0765) | (0.0771) | (0.0756) | (0.0706) | |
| 7 | 1.2251 | 1.2227 | 1.1946 | 1.1265 |
| (0.0730) | (0.0728) | (0.0738) | (0.0696) | |
| 8 | 1.1596 | 1.1594 | 1.1685 | 1.0946 |
| (0.0691) | (0.0690) | (0.0722) | (0.0676) | |
| 9 | 1.1332 | 1.1166 | 1.1531 | 1.0814 |
| (0.0675) | 0.0665) | (0.0712) | (0.0668) | |
| 10 | 1.0862 | 1.1224 | 1.1510 | 1.0900 |
| (0.0647) | (0.0668) | (0.0711) | (0.0673) | |
Note: In the estimation results for each order, the first rows are parameter estimates and the numbers in parentheses are standard errors.
The shock propagation and attenuation are shown in Table 1. First, the attenuation rates in the dual-circulation, domestic-circulation and international-circulation networks are all lower than the theoretical prediction. It implies the asymmetric distribution in three types of networks, i.e., the presence of a few important suppliers causes sectoral shocks to spread widely over the networks, generating larger aggregate volatility than that in the theoretical case. [1] In particular, for the attenuation rate (fi rstorder out-degree) of direct shocks, the average shape parameter of dual-circulation networks is 1.85. The average shape parameter and that of international-circulation networks is 1.90, which indicates that the attenuation rate of aggregate volatility in the international circulation is not more than n(1.90−1)/1.90 = n0.47 , while the average shape parameter of domestic-circulation networks is 1.91, which reveals that the attenuation rate of aggregate volatility in the domestic circulation is not more than n(1.91−1)/1.91 = n0.48 , implying that the lower bound of first-order average attenuation rate of volatility in the domestic circulation is slightly above the international level. It is proved that the asymmetry of the international circulation is higher than that of the domestic circulation. Sectoral shocks are easier to spread widely over international-circulation networks to cause aggregate volatility and can be dispersed and averaged out more quickly in domestic-circulation networks with little volatility, which, to a certain extent, reveals the fact that the domestic circulation is able to mitigate the shocks caused by external demand fluctuations to the domestic macro-economy. With regard to the attenuation rate of indirect shocks (second- and higher-order out-degrees), the average shape parameters of the second-order, fifth-order and tenth-order out-degrees, for example, are 1.55, 1.32, and 1.07, respectively, in international-circulation networks and 1.46, 1.19, and 1.10, respectively, in domestic-circulation networks, which remains consistent with the attenuation rate of aggregate volatility lower than the theoretical prediction.
Second, there are fat tails in the attenuation, indicating that the effects will persist in the networks for long once external shocks occur. This means that the higher the order of correlation, the lower the shape parameter estimator of dual-circulation networks, i.e., the attenuation of aggregate volatility slows down and sectoral shocks will persist in the networks. As it indicates, the attenuation of high-order linkages is slower than that of low-order linkages and the effects of direct shocks are dispersed faster than indirect shocks, and direct shocks will cause non-negligible aggregate volatility through high-order linkages when the effects are difficult to be dispersed, a law holds true for both domestic-and international-circulation networks. In 2012 dual-circulation networks, for example, the shape parameter estimator of first-order out-degree is 1.86, fifth-order 1.21, and tenth-order 1.09. This attenuation is consistent with the argument of Acemoglu et al. (2012) that high-order linkages imply cascading effects in the economy and that shocks propagate in production networks and produce a sustainable and huge impact on the macroeconomy.
Third, the shock performance in recent years has declined compared to earlier years, revealing the rising asymmetry of dual-circulation networks and difficulty for sectoral shocks to disperse, which may lead to greater economic fluctuations. The shape parameter estimates of first- to tenth-order out-degrees of domestic-circulation networks in 2017 generally decreased compared with 2012, meaning that the asymmetry of dual-circulation networks has risen. A few sectors in some provinces have become important suppliers; both direct and indirect shocks attenuate more slowly in domestic-circulation networks; and single sectoral shocks will spread widely nationwide and generate cascading effects through high-order linkages. The shape parameter of first-order out-degree of international-circulation production networks has shown a downward trend year by year, indicating a slower attenuation of direct shocks in international-circulation networks, and greater aggregate volatility will be caused. However, the shape parameters of high-order out-degrees have not shown evident rises, meaning that the attenuation rate of indirect shocks generated through high-order linkages has remained stable in international-circulation networks which had not been significantly impacted by cascading effects during 2012–2017.
4 Loss Measurement of Short-Term Shocks in Dual-Circulation Production Networks
It is found that single sectoral shocks can spread over dual-circulation production networks. That is, the impact of international shocks will spill over to domestic networks to form cascading effects. Here we intend to further analyze how the short-term shocks from US-China trade frictions impact on dual-circulation production networks on the basis of previous work.
4.1 Model Setup and Shock Measurement
This article draws on the way Gallegati et al. (2019) worked on the impact of Brexit on the UK production networks and the European Union, and uses the extraction method (Dietzenbacher et al., 2019; Los et al., 2016) to quantitatively simulate the economic losses caused by short-term shocks from inter-country industrial chain interruption. In particular, the hypothetical extraction method (HEM) of Los et al. (2016) directly sets interrupted inter-regional trade to zero. When it is applied to the issue of China-US chain interruption, the underlying assumption will be that there are no such substitutes globally, but it is far from reality. For this reason, here the global extraction method (GEM) proposed by Dietzenbacher et al. (2019) is extended from the extraction of intra-country single industry to inter-country industrial chain interruption as a solution to measure the value losses caused by China-US chain interruption with substitutes taken into account. The model is set up as follows.
In the ICIO-MRIO table, X is the total output matrix (2037×1) representing each sector’s output; A is the direct input coefficient matrix (2037×2037), where [row i, column j] represents the intermediate inputs from sector i required for the outputs of sector j. In the final demand matrix (2037×97), [row i, column r] denotes the flow of final goods from sector i to region r, and summing the columns yields Y (2037×1). From the row balance in the input-output table, there is Z1+Y=X, where intermediate goods are denoted as Z, final goods as Y, and outputs as X. By the definition of direct input coefficient matrix, we have Z=AX, so there is X=AX+Y, i.e., X=(I–A)–1Y. The GDP of each sector can be expressed as GDP = Vˆ (I − A) −1 Y , where Vˆ is a diagonalized matrix composed of a vector of value-added coefficients (1×2037).
Due to the termination of inter-regional trade caused by trade frictions, new direct input coefficient matrix A* and final demand matrix Y * are obtained. With A* and Y *, the GDP loss of each sector can be calculated by Equation (5):
In order to find out the impact of short-term shocks on dual-circulation production networks, this article applies the global extraction method (GEM) to industries directly affected by shocks for extraction, which allows for the identification of severely damaged regions and industries, namely the vulnerable nodes in response to risks.
To make measurement results close to the real level, we not only use the value-added coefficient and direct input coefficient in the ICIO-MRIO table, by the practice of Gao et al. (2021), but also update the final demand matrix using the GDP growth rates of economies and provinces in 2021 compared with 2017 released by the World Bank and China Statistical Yearbook:
4.2 Measurement of External Shock Effects from US-China Trade Frictions
Huang et al. (2018) decomposed in detail the effects of US-China trade frictions on the GVCs of the two countries and even major trading partners through GTAP, and simulated the impact at different trade-friction scales, with similar results to the GDP loss ratio simulated in this article, and their finding that US-China trade frictions might contribute to the US GDP growth is consistent with the simulation results here. Fan and Zhang (2018) constructed a heterogeneous firm model with variable profit markup for discussing the impact of tariff changes over imported intermediate and final goods on the welfare level of a country/region. In this article, trade frictions are analyzed from perspectives of chain-interruption scale, substitution status, and substitution ratio, and three scenarios are simulated as follows. Scenario 1: The China-US industry-wide chain interruption is simulated by simultaneously extracting the bilateral trade across all industries. Scenario 2: China-US trade frictions in certain industries are simulated by sequentially extracting the bilateral trade in sector i. Scenario 3: Supply-side and demand-side chain interruption are simulated for China. For the losses caused by chain interruption with substitutes taken into account, this article sets the substitution rate as 100%, 50% and 30% respectively to simulate the level of substitution of intermediate inputs and final good supplies in China and the US, following the practice of ADB (2021). There are three types of substitution, including: (1) The international-domestic co-substitution of intermediate inputs and final good supplies in chain-interrupted industries; (2) The full international substitution of intermediate inputs and final good supplies in chain-interrupted industries; and (3) The full domestic substitution of intermediate inputs and final good supplies in chain-interrupted industries.
(1) Scenario 1: The China-US industry-wide chain interruption. The ratio of China-US chain interruption in all industries is set at 10% and 50% respectively and the substitution rate at 100% and 50% respectively. [1] The GDP loss ratios of the US, China (along with its top five provinces/cities with the severest losses) and the rest of the world under different conditions are shown in Table 2. When the substitution rate is 100%, the US and the rest of the world’s GDP rises instead by occupying the Chinese market, which is similar to the losses from US-China frictions measured by Huang et al. (2018) using GTAP. China’s GDP loss ratio ranges from -0.16% to -0.81%, [2] with Guangdong, Zhejiang, and Jiangsu ranking the top. In reality, the US and the rest of the world will not be able to fully substitute China’s production capacity, and as the substitution rate falls, they will also suffer GDP losses from China-US chain interruption. Generally speaking, the loss ratio faced by China is higher than that of the US in the scenario of industry-wide chain interruption.
GDP Loss Ratio of China-US Industry-Wide Chain Interruption (%)
| Substitution rate | R=100% | R=50% | ||
|---|---|---|---|---|
| Chain interruption | F=10% | F=50% | F=10% | F=50% |
| US | 0.0624 | 0.3242 | −0.0315 | −0.1484 |
| Mainland China | −0.1601 | −0.8130 | −0.2230 | −1.1189 |
| Guangdong | −0.3838 | −1.9459 | −0.4780 | −2.3995 |
| Zhejiang | −0.3461 | −1.7493 | −0.4162 | −2.0863 |
| Jiangsu | −0.2504 | −1.2719 | −0.3224 | −1.6187 |
| Shandong | −0.1784 | −0.9038 | −0.2397 | −1.2013 |
| Tianjin | −0.1625 | −0.8308 | −0.3206 | −1.6098 |
| Others | 0.0018 | 0.0089 | −0.0002 | −0.0010 |
Note: The distribution coefficient is calculated by the proportion of inputs from each country/region.
(2) Scenario 2: Respective chain interruption of different industries in China and the US. In the agricultural chain interruption, for example, the US agriculture halts inputs to all industries across Chinese provinces, while Chinese agriculture does the same to all US industries. For each industry, the chain-interruption ratio is set at 100% and the substitution rate at 100%, and the distribution coefficient is different in the international-domestic co-substitution (by the proportion of inputs) and the full domestic substitution (ρ=1). The results in the case of full international substitution (ρ=0) are available upon request. For example, if the US agriculture stops inputs to China’s S sector, in the case of full international substitution, China will shore up S sector’s demand gap with agriculture of other countries/regions; and in the case of full domestic substitution, China will fill the gap with agriculture of domestic provinces. Table 3 reports the GDP loss ratios of China and the US in the two cases after the i-th sector in bilateral trade is extracted, respectively. [1] The findings are as follows: (1) The losses from chain interruption vary across industries in China and the US. For China, the GDP losses caused by manufacturing chain interruption (Communications Equipment, Computer and other Electronic Product Manufacturing, Apparel and Textiles, etc.) are large; and for the US, Services, Transportation Equipment Manufacturing, Transportation and Warehousing will cause huge losses from decoupling from China. (2) The losses vary in different cases of substitution. In the international-domestic co-substitution and the full domestic substitution, the extraction of Textiles, Electrical Machinery and Equipment Manufacturing, and Communications Equipment, Computer and other Electronic Product Manufacturing will drive up the US GDP, while the extraction of Agriculture, Extractive Industries, Transportation Equipment Manufacturing, Transportation and Warehousing can contribute to China’s GDP. However, both countries will face GDP losses with full international substitution. This suggests to a certain extent that the substitution by local supply chains can reduce more GDP losses from trade frictions.
Loss Ratio of China and the US after Respective Chain Interruption in Different Substitution Cases (%)
| Sector | International-domestic co-substitution | Full domestic substitution | ||
|---|---|---|---|---|
| US | Mainland China | US | Mainland China | |
| S1 | −0.0622 | 0.0639 | −0.0608 | 0.0796 |
| S2 | −0.0383 | 0.0164 | −0.0377 | 0.049 |
| S3 | 0.0091 | −0.0204 | 0.0118 | −0.0162 |
| S4 | 0.1326 | −0.389 | 0.3368 | −0.419 |
| S5 | 0.0805 | −0.1219 | 0.0937 | −0.1187 |
| S6 | 0.0836 | −0.1145 | 0.0917 | −0.1126 |
| S7 | −0.013 | 0.0122 | −0.0128 | 0.0168 |
| S8 | 0.0153 | −0.0521 | 0.0263 | −0.0465 |
| S9 | 0.0068 | −0.037 | 0.015 | −0.0174 |
| S10 | −0.002 | −0.0289 | 0.0089 | −0.0133 |
| S11 | −0.0612 | 0.0139 | −0.0445 | 0.0481 |
| S12 | 0.1062 | −0.1832 | 0.1605 | −0.1843 |
| S13 | 0.4032 | −0.5586 | 0.6876 | −0.5704 |
| S14 | −0.0002 | 0.0003 | −0.0002 | 0.0003 |
| S15 | 0 | 0 | 0 | 0 |
| S16 | 0.0139 | −0.087 | 0.0259 | −0.0348 |
| S17 | −0.065 | 0.0396 | −0.0616 | 0.0703 |
| S18 | −0.0199 | 0.0055 | −0.0178 | 0.0214 |
| S19 | −0.0043 | 0.001 | −0.0037 | 0.0049 |
| S20 | −0.1074 | 0.1155 | −0.1052 | 0.131 |
| S21 | 0.1676 | −0.2988 | 0.2425 | −0.287 |
Note: Both the chain-interruption rate and the substitution rate are set at 100%. In international-domestic co-substitution, the distribution coefficient is calculated by the proportion of inputs from each country/region.
Figure 1 shows a radar chart of provincial distribution of GDP losses that are caused by four extracted sectors which cause the highest GDP losses in China (including Apparel and Textiles, Electrical Machinery and Equipment Manufacturing, Communications Equipment, Computer and other Electronic Product Manufacturing, and other Manufacturing). The deeper the curve is, the more severe the GDP loss is. From inside to outside are other Manufacturing, Communications Equipment, Computer and other Electronic Product Manufacturing, Electrical Machinery and Equipment Manufacturing, and Apparel and Textiles. Guangdong, Zhejiang, Jiangsu and Tianjin suf er the most GDP losses.
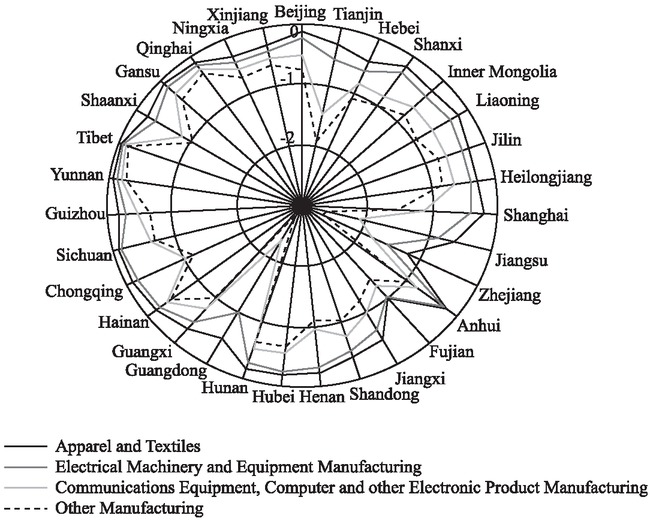
Provincial Distribution of GDP Losses Caused by Chain Interruption of Four Sectors in China and the US
(3) Scenario 3: Supply-side and demand-side chain interruption. The simulations in Scenario 1 and Scenario 2 are both two-way, i.e., the US stops exporting to China and China does the same to the US. As mentioned earlier, the China-US chain interruption as short-term shocks can be propagated in dual-circulation networks to both the supply side and the demand side to cause aggregate volatility. Gao et al. (2021) measured the impact of emergencies on supply and demand from the upstream and downstream perspectives. In this article, the impact of chain interruption on both China and the US is analyzed from the supply-side and demand-side perspectives. From the viewpoint of China, the supply-side chain interruption means that it has no access to US intermediate inputs as well as final goods and the demand-side chain interruption means that the US no longer buys intermediate and final goods from China. Here we assume 100% chain interruption in each sector, with a 50% substitution rate, and the substitution is borne domestically and internationally by 0.5 each. [1] For example, the supply-side chain interruption in agriculture represents that US agriculture stops exporting to China’s industries, while the supply-side chain interruption in agriculture indicates that China’s agriculture stops exporting to US industries. When assuming that each sector suffers chain interruption on the supply side and the demand side, respectively, the GDP losses of China and the US are shown in Figure 2. Clearly, there are large differences in the GDP loss ratio caused to China and the US by chain interruption on the supply side and the demand side in different industries. (1) For China, the loss ratio caused by the demand-side chain interruption is generally much higher than that caused by the supply-side chain interruption, which to some extent reveals China’s high dependence on the US market demand. If the demand-side chain interruption appears and adequate market substitution is not available in the short run, the economy will suffer great losses, especially in the Apparel and Textiles, the Communications Equipment, Computer and other Electronic Product Manufacturing, and Wholesale and Retail Trade. That is why China needs to forge a strong domestic market and make domestic demand a more powerful engine for economic growth. (2) For the US, the GDP loss ratio resulting from supply-side chain interruption is higher than that from demand-side chain interruption in some sectors, such as Transportation Equipment Manufacturing, and Services; but in some sectors, such as Metal Smelting and Product Manufacturing, Communications Equipment, and Computer and other Electronic Product Manufacturing, both GDP loss ratios are similar; and only agriculture shows a much higher GDP loss ratio due to demand-side chain interruption than supply-side chain interruption. Generally speaking, the majority of US sectors are highly dependent on China’s supply. If the supply-side chain interruption appears and adequate substitution is not available in the short run, the economy will suffer severe losses. This conclusion reveals the basic logic behind the “de-China” multi-supply chain system that the US has been working on all the time.
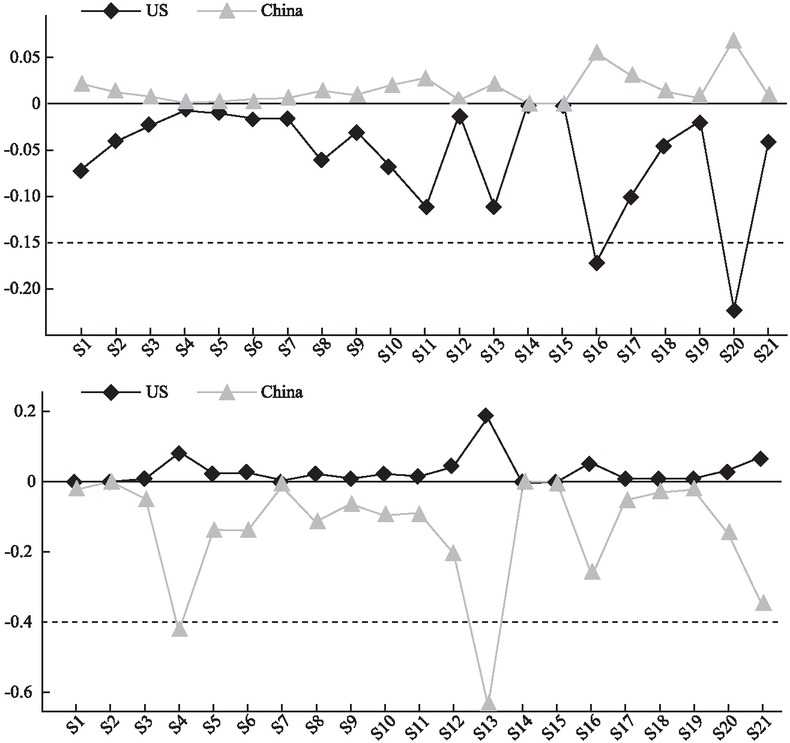
GDP Loss Ratio of China and the US due to Chain Interruption on the Supply Side (Top) and the Demand Side (Bottom)
Note: The chain-interruption rate is set as 100%, with a 50% substitution rate, and the substitution is borne domestically and internationally by 0.5 each.
5 Conclusion and Policy Implications
In this article, a dual-circulation production network framework for intermediate goods trade-final goods trade is constructed through integrating the Inter-Country Input-Output (ICIO) table published by OECD with the Multi-Regional Input-Output (MRIO) table compiled by CEADs, upon which the propagation and attenuation of sectoral shocks in dual-circulation production networks are probed, and the scope of impact and evolution are evaluated. Finally, the effects of China-US trade interruption on dual-circulation production networks are identified with the global extraction method (GEM), and risks are pinpointed from a regional-industry perspective to off er a policy focus for proactive risk prevention and resolution. The major conclusions are as follows: (1) The asymmetry is significant in dual-circulation production networks and key sectoral shocks will give rise to aggregate volatility. Moreover, the asymmetry has increased in recent years and key sectoral shocks will cause more drastic aggregate volatility. (2) The simulation finds that increasing the domestic substitution rate can lower the loss ratio resulting from sectoral chain interruption. However, even if full substitution can be achieved, sectoral chain interruption still cannot be avoided completely. The losses caused by supply-side and demand-side chain interruption are determined by external dependence and substitute capacity in supply and demand.
The findings of this article contribute important policy interruptions. First, the coordinated regional development strategy should be pushed forward in depth to improve the symmetry of domestic-circulation networks. Network asymmetry is a major problem causing long-term and persistent shocks and may cause huge losses to the economy. The key to symmetry rises in domestic-circulation networks, then, lies in better coordinated regional development, also a major strategy for regional development proposed in the report of the 20th National Congress of the Communist Party of China (CPC). At first, high-quality development need to be planned in light of regional resource endowments, which will help coordinate inter-regional advancement and narrow development gaps while avoiding a swarm of industrial layout and unhealthy competition with the differences in regional endowments taken into account. Next, a unified national market should be formed. It means to break down different forms of barriers to commodity and factor flows, such as regional blockades, industrial monopolies, and sectoral protectionism, and opening up institutional channels for the equal exchange and two-way flow of factors between regions. The establishment of a modern distribution system across China must also be accelerated so that inter-city connectivity and in-depth interaction and cooperation between eastern and western regions will increase to benefit the coordinated regional development.
Second, there is a need to set up systems for managing production network risks in the regional-industry dimension. The risks of dual-circulation production networks appear as evident regional heterogeneity and industrial heterogeneity. Some industries at the key nodes are the risk exposure and vulnerabilities of dual-circulation production networks, so once they are shocked, the entire networks will be affected due to cascading effects. For this reason, early warning systems for regional-industry production network risks should be set up as a way to monitor industrial chain risks involving key areas, links and importing countries. Furthermore, there should have a dynamic early warning list of regional-industry risks to make sure that appropriate measures are taken in a timely manner for risk avoidance. Also, for regional hubs, production and consumption should be diversified with accurate prejudgment and targeted prevention and control of risks.
Finally, the relationship between domestic and international markets and resources must be handled properly. The current risks are mainly manifested as supply-side and demand-side dependence on the international circulation. Nonetheless, in forging a new paradigm with “dual circulation”, the priority should be placed on how to take full advantage of both domestic and international markets and resources in addition to the share of domestic circulation in supply and demand. This requires a precise study of what resources and which markets should be utilized to what extent. Relying on the super-large domestic market in China, the imports of available resources, especially high-quality intermediate goods, can be enlarged for the domestic circulation. With the available international resources, areas of weakness and domestic manufacturing support will be both improved to realize economies of scale. Regarding which markets are available, as the domestic production capacity grows stronger, economies of scale and quality improvement will make Made in China further competitive and contribute to its global market share. As a result, the effective linkage of “domestic demand - local supply - global service” and its virtuous cycle will be realized.
References
Acemoglu, D., Carvalho V., & Ozdaglar A. (2012). The Network Origins of Aggregate Fluctuations. Econometrica, 80(5), 1977–2016.10.3982/ECTA9623Search in Google Scholar
ADB. (2021). Asian Economic Integration Report.Search in Google Scholar
Barauskaite, K., & Nguyen, A. (2021). Global Intersectoral Production Network and Aggregate Fluctuations. Economic Modelling, 102(C), 105577.10.1016/j.econmod.2021.105577Search in Google Scholar
Caliendo, L., Parro, F., Rossi, E., & Pierre, D. (2014). The Impact of Regional and Sectoral Productivity Changes on the U.S. Economy. CEPR Discussion Papers.10.3386/w20168Search in Google Scholar
Carvalho, V. (2014). From Micro to Macro via Production Networks. Economics Working Papers.10.1257/jep.28.4.23Search in Google Scholar
Cheng, D. (2015). China’s Integration into the Global Value Chains: A Transnational Input-output Analysis. Economic Research Journal (Jingji Yanjiu), 50(9), 4–16+99.Search in Google Scholar
Dietzenbacher, E., Guilhoto, J., & Imor, D. (2013). The Role of Brazilian Regions in the Global Value Chain. MPRA Working Paper.10.2139/ssrn.2402274Search in Google Scholar
Dietzenbacher, E., van Burken, B., & Kondo, Y. (2019). Hypothetical Extractions from a Global Perspective. Economic Systems Research, 31(4), 505–519.10.1080/09535314.2018.1564135Search in Google Scholar
Dong, Y., & Ma, Y. (2020). The COVID-19 Pandemic, Trade Frictions between China and U.S., and Supply Chain Restructuring in the Asia-Pacific: Analysis Based on the Hypothetical Extraction Method (HEM). Journal of South China Normal University (Social Science Edition) (Huanan Shifan Daxue Xuebao (Shehui Kexue Ban)), 4, 110–123+191.Search in Google Scholar
Fan, H., & Zhang, L. (2018). Intermediate Goods Trade and Sino-American Trade Frictions Effects on Welfare: Based on the Theoretical and Quantitative Perspective. China Industrial Economics (Zhongguo Gongye Jingji), 9, 41–59.Search in Google Scholar
Fan, Z., Zhang, Y., & Liao, C. (2019). Global or Regional Value Chains? Evidence from China. International Regional Science Review, 42(5–6), 459–494.10.1177/0160017619835900Search in Google Scholar
Gallegati, M., Giammetti, R., & Russo, A. (2019). Key Sectors in Input-Output Production Networks: An Application to Brexit. MPRA Working Paper.10.2139/ssrn.3347545Search in Google Scholar
Gao, J., & Wang, B. (2020). The Impact of the Quality of China’s Import Value Chain on the Embedded Interests of Global Value Chains. Commercial Research (Shangye Yanjiu), 5, 87–95.Search in Google Scholar
Gao, X., Xu, R., Zhu, K., Zhang, Y., & Yang, C. (2021). The Economic Impact of Major Event Outbreak from the Perspective of Global Production Networks. Journal of International Trade (Guoji Jingji Maoyi Wenti), 7, 1–20.Search in Google Scholar
He, C., & Yu, C. (2022). Multi-dimensional Proximity, Trade Barriers and the Dynamic Evolution of Industrial Linkages between China and the World Market. Acta Geographica Sinica (Dili Xuebao), 2, 275–294.Search in Google Scholar
Huang, P., Wang, J., & Meng, X. (2018). Rebalance of Economic Globalization and Trade Frictions between China and the U.S. China Industrial Economics (Zhongguo Gongye Jingji), 10, 156–174.Search in Google Scholar
Huang, Q., & Ni, H. (2021). Measurement and Analysis of China’s Dual Circulation and Essential Characteristics of the New Development Paradigm. Journal of Management World (Guanli Shijie), 12, 40–58.Search in Google Scholar
Huh, H., & Park, C. (2020). A New Index of Globalization: Measuring Impacts of Integration on Economic Growth and Income Inequality. World Economy, 44, 409– 443.10.1111/twec.12998Search in Google Scholar
Jiang, X., & Meng, L. (2021). A New Development Paradigm with the Domestic Economy as the Mainstay and the Domestic Economy and International Engagement Providing Mutual Reinforcement for Higher-level Dual Circulation: International Experiences and Chinese Practices. Journal of Management World (Guanli Shijie), 1, 1–19.Search in Google Scholar
Johnson, R., & Noguera, G. (2017). A Portrait of Trade in Value-Added over Four Decades. The Review of Economics and Statistics, 99(5), 896–911.10.1162/REST_a_00665Search in Google Scholar
Li, B., Zhao, Y., Feng, Z., & Zhao, F. (2021). Value Circulation, Economic Structure and New Development Paradigm: A Political Economy Theoretical Framework and International Comparison. Economic Research Journal (Jingji Yangjiu), 5, 4–19.Search in Google Scholar
Li, J., & Liu, Y. (2022). China’s National Economic Circulation: A Perspective of the Structural and Regional Network Relations. Economic Research Journal (Jingji Yangjiu), 2, 27–42.Search in Google Scholar
Liu, H. (2020). Accelerating the Deployment of the New Development Paradigm Featuring “Dual Circulation”. Western Finance and Accounting (Xibu Caikuai), 12, 2.Search in Google Scholar
Liu, S., Han, Y., & Wang, D. (2020). I/O Structure-based Analysis of the Impact Path of COVID-19 Pandemic and Response Policies. Journal of Management World (Guanli Shijie), 5, 1–12+51+263.Search in Google Scholar
Liu, W., Cheng, Q., & Yv, Y. (2023). The Network Effects of Technological Progress in China’s Industries from the Perspective of Technology Spillover under Dual Circulation: Measurement of Total Factor Productivity Growth and Transmission Based on Global Production Networks. Journal of Management World (Guanli Shijie), 5, 38–59.Search in Google Scholar
Los, B., Marcel, P., & Gaaitzen, J. (2015). How Global Are Global Value Chains? A New Approach to Measure International Fragmentation. Journal of Regional Science, 55(1), 66–92.10.1111/jors.12121Search in Google Scholar
Los, B., Marcel, P., & Gaaitzen, J. (2016). Tracing Value-Added and Double Counting in Gross Exports: Comment. American Economic Review, 106(7), 1958–66.10.1257/aer.20140883Search in Google Scholar
Lv, Y., Fang, R., & Wang, D. (2021). Analysis on the Topological Structure Characteristics and Influence Mechanism of Global Digital Service Trade Network. The Journal of Quantitative & Technical Economics (Shuliang Jingji Jishu Jingji Yanjiu), 10, 128–147.10.1515/cfer-2021-0003Search in Google Scholar
Ma, D., He, Y., & Yu, X. (2021). Dual Value Chain, Economic Uncertainty and Regional Trade Competitiveness—Perspective of the Construction of the Belt and Road. China Industrial Economics (Zhongguo Gongye Jingji), 4, 81–99.Search in Google Scholar
Ni, H., & Xia, J. (2016). The Role of China Regions and its Changes in the Global Value Chains—Based on World Input-Output Model Embedded with China Regions. Finance & Trade Economics (Caimao Jingji), 10, 87–101.Search in Google Scholar
Pei, C., & Liu, H. (2021). The Implications of Building a New Development Paradigm. China Industrial Economics (Zhongguo Gongye Jingji), 6, 5–22.Search in Google Scholar
Qiao, X., Li, X., & Pu, P. (2023). Common Prosperity and Reshaping China’s Economic Flows—Theoretical Logic and Empirical Evidence of Political Economy. China Industrial Economics (Zhongguo Gongye Jingji), 5, 5–23.Search in Google Scholar
Schweitzer, F., Fagiolo, G., Sornette, D., Vega-Redondo, F., Vespignani, A., & White, D. (2009). Economic Networks: The New Challenges. Science, 325, 422–425.10.1126/science.1173644Search in Google Scholar
Tsekeris, T. (2017). Global Value Chains: Building Blocks and Network Dynamics. Physica A: Statistical Mechanics and Its Applications, 488(C), 187–204.10.1016/j.physa.2017.06.019Search in Google Scholar
Turco, L., Daniela, M., & Alberto, Z. (2019). Financial Dependence and Growth: The Role of Input-Output Linkages. Journal of Economic Behavior & Organization, 162(C), 308–328.10.1016/j.jebo.2018.11.024Search in Google Scholar
Yao, X., Pu, Y., Wu, G., Wang, B., & Wang, L. (2019). China’s Level and Status of Industry Convergence in the Belt and Road Initiative: Industry Comparisons, Regional Gaps and Associated Factors. Economic Research Journal (Jingji Yanjiu), 9, 172–186.Search in Google Scholar
© 2023 Qunyong Wang, Yue Li, Yan Xue, Published by DeGryuter
This work is licensed under the Creative Commons Attribution 4.0 International License.
Articles in the same Issue
- Minimum Wages, Cost-Price Pass-Through and Real Welfare Effect of Households
- Shock Propagation in Dual-Circulation Production Networks: Characteristics and Simulation
- Study on Causes of Differences in Tax Burden of Value-Added Tax from the Perspective of Industrial Linkage
- Robot Application and Labor Force Employment: Substitution or Complementation? —An Empirical Analysis Based on the Data from 22 Economies
- China’s Economic Growth: The “Two-Dimensional Driving Effect” of Data Factors
- Input Trade Liberalization and Welfare Loss of Manufacturing Enterprises: Based on the Perspective of Efficient Market Power