Inhibition of heterogeneous nuclear ribonucleoproteins A1 and oxidative stress reduces glycolysis via pyruvate kinase M2 in chronic thromboembolic pulmonary hypertension
-
Lianhua Liu
 ,
Zhenguo Zhai
,
Zhenguo Zhai

Abstract
Background and Objective
Chronic thromboembolic pulmonary hypertension (CTEPH) is a lethal complication of pulmonary embolism involving pulmonary artery occlusion and microvascular disease. The glucose metabolism and reactive oxygen species (ROS) production may be perturbed in CTEPH, but the precise mechanisms are unclear. This study investigated glucose metabolism in CTEPH employing pulmonary endarterectomy (PEA)-derived pulmonary artery smooth muscle cells (PASMCs) and characterized the roles of pyruvate kinase M2 (PKM2) and its regulation by heterogeneous nuclear ribonucleoproteins A1 (hnRNPA1) and ROS in CTEPH.
Methods
PEA tissues and blood samples of CTEPH patients were collected to study the levels of PKM2. Primary PASMCs were isolated from PEA tissues. We used small interfering RNAs to knock down PKM2 and hnRNPAI, and applied antioxidant N-acetylcysteine (NAC) and mito-TEMPO to reduce ROS production. The expression of glucometabolic genes, ROS production, glycolysis rate and proliferative and migratory activities were analyzed in PEA-derived PASMCs.
Results
PKM2 levels in serum and PEA tissues of CTEPH patients were higher than that of the healthy controls. Compared to the control PASMCs, PEA-derived PASMCs showed increased PKM2 expression and ROS production. The rates of glycolysis, proliferation and migration were increased in PEA-PASMCs and could be mitigated by PKM2 downregulation through hnRNPA1 or ROS inhibition.
Conclusions
Increased glycolysis and PKM2 expression were found in PEA-PASMCs. Inhibition of hnRNPA1 or ROS corrected the aberrant glycolysis, cell proliferation and migration by downregulating PKM2. Regulation of the hnRNPA1/PKM2 axis represents a potential therapeutic target for the treatment of CTEPH.
Introduction
Chronic thromboembolic pulmonary hypertension (CTEPH) is a lethal disease initiated by pulmonary embolism, followed by pulmonary vascular occlusion and remodeling that results in pulmonary hypertension (PH) and eventually right heart failure.[1] Recent epidemiology analysis of CTEPH estimated 2–5/100,000 incidents in different countries.[2] Currently, although treatment strategies such as pulmonary endarterectomy (PEA) and balloon pulmonary angioplasty (BPA) are available for CTEPH, the issues of residual PH and complications remain unresolved.[3] Pulmonary artery obstruction and microvascular diseases, such as remodeling of small and peripheral pulmonary vessels, contributed to increased pulmonary vascular resistance (PVR).[4,5] To date, the pathological mechanisms of CTEPH are not entirely understood, hindering the development of effective targeted treatment for this condition.[6,7]
Enhanced proliferation and migration of pulmonary artery smooth muscle cells (PASMCs) and endothelial cell dysfunction are the main processes contributing to the pulmonary vascular remodeling in PH.[8] The metabolism status of the vascular cells is altered. Increased glycolysis has been found in endothelial cells,[9] fibroblasts[10] and PASMCs[11] in pulmonary arterial hypertension (PAH), in a manner reminiscent of the Warburg effect observed in tumor cells, which rely on glycolysis as their primary form of glucose metabolism under conditions even with sufficient oxygen.[12] In addition, increased glucose accumulation was found in pre-operative CTEPH patients.[13] Vascular remodeling and PASMC proliferation were also reported in CTEPH.[14] Increased glycolysis is regulated by many molecules and may manifest as increased pyruvate and lactate production. Pyruvate kinase M2 (PKM2), an isoform of pyruvate kinase which acts as an enzyme catalyzing the conversion of phosphoenolpyruvate to pyruvate and ATP, is considered to be a key factor controlling the metabolic changes in cancer cells and other hyper-proliferative cells,[15,16] in which an increase in PKM2 expression or an increased ratio of PKM2 with PKM1 is essential for maintaining cell growth.[17]
PKM2 and PKM1 are encoded by the PKM gene and matured through alternative splicing by three heterogeneous nuclear ribonucleoproteins (hnRNP) family, namely, hnRNPA1, hnRNPA2 and polypyrimidine tract binding protein 1 (PTBP1). These hnRNPs bind to and splice out exon 9 of the PKM mRNA, producing PKM2.[18] Previous studies showed that inhibiting PTBP1 reduced PKM2 and improved glycolysis in fibroblasts and endothelial cells inPAH.[9,10] In these studies, microRNA-124 was shown to regulate the expression of PTBP1 and in turn the relative abundance of PKM2. This regulatory axis was found to be responsible for the switch from oxidative phosphorylation to aerobic glycolysis. In addition to PTBP1, hnRNPA1 also plays a pivotal role in PKM2 regulation and promoted aerobic glycolysis.[19,20] HnRNPA1 can be induced by small nucleolar RNA host gene 6 (SNHG6) to specifically splice PKM mRNA, increasing the proportion of PKM2/PKM1 in colorectal cancer (CRC) cells.[21] In addition, miR-206 over-expression directly targeted hnRNPA1, attenuating the Warburg effect and cell proliferation of CRC by suppressing PKM2 expression.[22] While the role of the c-myc/hnRNPA1/PKM2 signaling pathway in glucose metabolism has been studied in glioma,[23] the regulatory effects of hnRNPA1 on PKM2 expression in CTEPH are still unclear.
In addition, the expression of PKM2 is also related to intracellular reactive oxygen species (ROS), which are highly reactive chemical molecules formed due to the electron receptivity of O2 and mainly produced by mitochondria and peroxisomes during the processes of respiration.[24,25,26] ROS plays a pivotal role in cellular signal transduction and homeostasis. The studies have shown that increased ROS promoted the proliferation of vascular smooth muscle cells.[27,28]
Herein, we propose to investigate the glucose metabolism in CTEPH employing PEA derived PASMCs, aiming to characterize the roles of PKM2, especially its regulation by hnRNPA1 and ROS in CTEPH.
Materials and methods
Patient selection and sample collection
This study was approved by the research ethical committee of China-Japan Friendship Hospital (Approval No. 2019-121-K83). Written informed consent was obtained from all participants.
Blood samples were collected from CTEPH patients who met the following diagnostic criteria: after three months of adequate anticoagulation, patients showed (1) mean pulmonary artery pressure (mPAP) ≥ 25 mmHg measured by right heart catheterization, pulmonary arteriole wedge pressure ≤ 15 mmHg and PVR > 2 woods units; (2) multiple, chronic/organized thrombi or emboli in the pulmonary artery detected by pulmonary angiography, CT pulmonary angiogram or pulmonary ventilation/ perfusion radionuclide imaging. Patients with malignant tumors, primary hypertension, cerebrovascular or other cardiovascular diseases were excluded. Control cases were collected at the physical examination center of the China-Japan Friendship Hospital. The gender and age distribution of the control group were adjusted to match with the CTEPH patients. Cases were excluded if they had liver or kidney dysfunction, cardiovascular diseases, diabetes and infectious diseases. In total, blood samples from 81 CTEPH patients and 78 controls were collected. Demographic and clinical information of CTEPH patients and the control group were listed in Supplementary Table 1.
PEA tissues were collected from CTEPH patients who underwent PEA surgery in China-Japan Friendship Hospital. In total, 10 cases of PEA tissue were collected in this study. The control tissue samples were pulmonary arteries from lung transplant donors. In total, 3 cases of control tissue were obtained. The demographic and clinical information of the PEA tissues from CTEPH patients and the control tissues used in this study was listed in Supplementary Table 2.
The primary cells used in this study were cultured from the PEA tissues. We set the criteria of cell isolation to include the cells derived from PEA tissue with thickened wall and prominent fibrosis. Cultured cells from PEA 2, PEA 3, PEA 6, PEA 7, PEA 8 and PEA 10 in Supplementary Table 2. were used. In addition, the control PASMCs were purchased from Lonza and Sciencell (Lonza, Gampel, Switzerland. Cat#: CC-2581; Sciencell, Santiago, USA. Cat#: 3110). In total, control PASMCs from three donors were purchased and used; the donor characteristics of these control PASMCs were listed in Supplementary Table 3. Cells from different patients and donors were used as independent biological replicates in the following experiments, where cells from at least three different donors were tested.
Cell culture and characterization
Primary cells were isolated from the PEA tissues described above. In brief, PEA tissue was aseptically collected and cut into small pieces. Then the PEA pieces were located into a pre-treated dish with attachment factor (Gibco, Grand Island, USA Cat#: S006100) and incubated at 37°C with 5% CO2. After cells crawling out from tissue, remove the cells and culture with a new dish. All cells were cultured with complete growth medium for smooth muscle cells in a humidified incubator at 37°C with 5% CO2. Cells at passages 3–6 were used for experiments.
For immunofluorescent characterization, cells were preplanted in chamber slides (Thermo, Cat#: 177402) and grown to 70%–80% confluence. Slides were fixed with 4% paraformaldehyde and incubated with 0.2% TritonX-100 in PBS, incubating with primary antibody against α-SMA (Abcam, Cat#: ab5694, RRID: AB_2223021), SM22 (Abcam, Bosten, USA. Cat#: ab14106, RRID: AB_443021) and calponin (Santa Cruz Biotechnology, Santa Cruz, USA. Cat#: sc-58707, RRID: AB_781770) at room temperature for 1 h, respectively. After washing, the slides were incubated with secondary antibody, counterstained with DAPI and cover-slipped. Fluorescent images were captured using a confocal microscope (Nikon, Tokyo, Japan. A1R).
Enzyme-linked immunosorbent assay (ELISA)
All blood samples were collected in tubes without anticoagulants. Blood samples were separated by centrifugation at 3000 rpm for 15 min. Serum levels of PKM2 were measured using an ELISA kit (MBbiology, Cat#: MB-4462A) according to the manufacturer’s instructions.
Hematoxylin and eosin (HE) staining and immunohistochemistry
Formalin-fixed, paraffin-embedded tissue sections were prepared and dewaxed. For HE staining, slides were stained with hematoxylin, counterstained with 0.5% eosin staining solution and cover-slipped with neutral resin.
For immunohistochemistry, slides were heated in EDTA solution at 95°C for antigen retrieval, then treated with0.3% hydrogen peroxide and blocked with goat serum. The slides were incubated with primary antibody against PKM2 (Cell Signaling Technology, Cat#: 4053, RRID: AB_1904096), followed by incubation with biotin-labeled secondary antibody and color development (Dako, Cat#: K5007). The slides were counterstained with hematoxylin and cover-slipped with neutral resin. Bright-field images were obtained with an Olympus microscope.
Inhibition and measurement of ROS Production
Antioxidant N-acetylcysteine (NAC) (10 μmol/L) (Selleckchem, Cat#: S1623) and mito-TEMPO (1 μmol/L) (Enzo, Cat#: ALX-430-150-M005) were used to reduce intracellular ROS production. For ROS measurement, cells were pre-planted in chamber slides and incubated with freshly prepared dihydroethidium (DHE) (2 μmol/L) (Sigma, Cat#: D7008). The slides were washed with Krebs/ HEPES buffer and cover-slipped. Fluorescent images were captured using a confocal microscope.
Small interference RNA transfection
Cells were pre-planted in a six-well plate and cultured to 70%–80% confluence. PKM2 siRNA (sense strand: AAUCGUCCUCACCAAGUCUGGCAGG; anti-sense strand: CCUGCCAGACUUGGUGAGGACGAUU, Hanheng biology), hnRNPA1 siRNA (Santa Cruz, Cat#: sc-270345) or control siRNA (sense strand: UUCUCCGAACGUGUCACGUTT, anti-sense strand: ACGUGACACGUUCGGAGAATT, Hanheng biology) were transfected into cells according to the manufacturer’s instructions. In brief, siRNA stock solution (20 μmol/L) was diluted in Opti-MEM (Gibco, Cat#: 31985062) and mixed with lipofectamine 3000 (Invitrogen, Cat#: L3000001) diluted in Opti-MEM. The mixture was incubated with the cells, and real-time polymerase chain reaction (RT-PCR) and Western blotting were used to detect the silencing effect of siRNA transfection after 24–72 h.
RT-PCR
Total mRNA from tissues or cells were extracted and purified using the Trizol reagent (Sigma, Cat#: T9424-200ML) following the manufacturer’s instructions. Furthermore, the extracted RNA was quantified using a NanoDrop Spectrophotometer (Thermo Fisher Scientific). Reverse transcription of mRNA was performed using a reverse transcription kit (Applied Biological Materials, Cat#: G490). A real-time quantitative PCR kit (Applied Biological Materials, Mastermix-LR) was used to measure the expression levels of target genes. Primers used in this study were listed in Supplementary Table 4.
Western blotting
Total protein isolation from tissues or cells was performed using RIPA lysis buffer (Solarbio, Cat#: R0010-100) with protease inhibitors. The protein concentration of samples was determined using a BCA assay kit (Cell Signaling Technology, Cat#: 7780). Samples were denatured by boiling with loading buffer (Cat#: 161-0747, Bio-Rad) containing 2-Mercaptoethanol. Twenty micrograms of protein per sample were separated by 10% SDS-PAGE gel and then transferred to a PVDF membrane. The membranes were blocked by 5% skim milk and incubated with primary antibodies against PKM2 (1:1000, Cell Signaling Technology, Cat#: 4053, RRID: AB_1904096), PKM1 (1:1000, Cell Signaling Technology, Cat#: 7067, RRID: AB_2715534), GLUT1 (1:1000, Cell Signaling Technology, Cat#: 12939, RRID: AB_2687899), HK2 (1:1000, Abcam, Cat#: ab209847), LDHA (1:1000, Abcam, Cat#: ab101562, RRID: AB_10860528), hnRNPA1 (Proteintech, Cat#: 11176-1-AP, RRID: AB_2117177), c-myc (Cell Signaling Technology, Cat#: 5605, RRID: AB_1903938) and β-actin (Cell Signaling Technology, Cat#: 8457, RRID: AB_10950489). The membranes were incubated with secondary antibody (rabbit or mouse: Cat#: 65-6120, Cat#: 62-6520, Thermo) and electrogenerated chemiluminescence (ECL) solution (Millipore, Cat#: WBKLS0500) was used for protein visualization. Quantitative analysis was carried out using the Image J software (NIH, Bethesda, Maryland, USA).
Glycolysis rate measurements
Measurements of the rate of glycolysis were performed using the Seahorse XF24 Analyzer (Agilent) and glycolysis reagent kits (Agilent, Cat#: 103344-100). In brief, cells were pre-plated on a plate and cultured to 80% confluence. The probe board was hydrated with calibration solution and incubated in advance. Before the test, the cell culture medium was replaced with Seahorse XF DMEM (pH = 7.4) containing 1 mol/L glucose, 100 mmol/L pyruvate and 200 mmol/L glutamine. Reagents rotenone/antimycin A (Rot/AA) and 2-deoxy-D-glucose (2-DG) solution were prepared and added to port A and port B (56 μL and 62 μL, respectively). The Seahorse XFe24 Analyzer was run following the manufacturer’s instructions.
Scratch cell migration assay
Cells were seeded in a bottom-marked six-well plate. When cell confluence was close to 100%, straight scratch lines were made using a pipette tip. The medium was replaced and the plate was incubated in a 37°C, 5% CO2 cell incubator. Bright-field images were captured at multiple time points (such as 0 h, 12 h, 16 h and 24 h). The scratch lines were measured and analyzed using Image J software.
Cell proliferation assay
Cells were pre-planted in 96-well plates with 5000 cells/ well. CCK-8 reagent (Dojindo, Kumamoto, Japan. Cat#: CK04-100T) diluted in culture medium at a ratio of 1:10 was added at different time points (0 h, 24 h, 48 h and 72 h). Cells were incubated for 1–2 h before the absorbance measurements at 450 nm on a microplate reader (BioTek, Vermont, USA).
Statistical analysis
The proportion of males in the patients and controls was presented as number (%) and compared using the Chi-square test. The age of these subjects was presented as median and ranges. Non-parametric tests were used to compare the continuous data. Data with normal distribution were presented as mean ± SD and analyzed by t-test for pairwise comparison. All data were processed and analyzed by SPSS 23.0 (IBM Corporation, Armonk, New York, USA) and Prism 7; two-tailed P value < 0.05 indicates statistical significance.
Results
PEA tissue and serum of CTEPH patients showed elevated PKM2 expression
PEA tissues from CTEPH patients showed morphological changes in pulmonary vasculature, where a thickened vessel wall, thrombus organization and neovascularization were observed (Figure 1A). Immunohistochemistry revealed increased PKM2 expression in neovascular luminal cells of the PEA tissue compared to the control group (pulmonary arterial tissues from lung transplant donors), while the expression of PKM1 showed no significant changes (Figure 1B).

PEA tissue and serum of CTEPH patients showed elevated PKM2 expression. (A) Hematoxylin and eosin staining of PEA tissue showed thickened vessel wall with narrowed lumen, thrombus organization and neovascularization. The red square and the line in the picture showed a zoomed in local area and displayed at below. Scale bar: 50 μm, n = 3–6. (B) Expression and localization of PKM2 and PKM1 in PEA tissues and control vessels are shown by immunohistochemistry. Expression of PKM2 was increased significantly in PEA tissue compared to the control group, while expression of PKM1 showed no significant changes. Scale bar: 50 μm, n = 3. (C) Serum PKM2 levels were significantly higher in CTEPH patients (n = 81) than in the control group (n = 78). (D) PKM2 mRNA expression in PEA tissue was higher than that of the control group, n = 3. (E, F) Expression of PKM2 protein was higher in PEA tissue than control tissue, n = 3. *P < 0.05. Scale bar: 50 μm. PKM: pyruvate kinase M; HE: hematoxylin and eosin staining; PEA: pulmonary endarterectomy; CTEPH: chronic thromboembolic pulmonary hypertension. N: control group.
In addition, the average serum level of PKM2 in CTEPH patients was 4169 ± 1724 pg/mL, which was higher than the control group with 3567 ± 1616 pg/mL, P < 0.05 (Figure 1C). The expression of PKM2 mRNA in PEA tissue was 3.6 times higher than that of the control group (3.65 ± 1.34 vs. 1.00 ± 0.84, P < 0.05) (Figure 1D). The expression of PKM2 protein was significantly increased in CTEPH tissue, 1.7 times higher than the control group (Figure 1E and 1F).
PEA-PASMC showed increased glycolysis, proliferative and migratory activities
To explore the glycolysis status of CTEPH, we cultured primary cells from PEA tissue (Figure 2A–2C). The primary cells isolated from PEA tissues showed smooth muscle cell-like morphology and expressed smooth muscle-related markers, which is similar to the control PASMCs from healthy donors (Figure 2D). The expression of α-SMA, SM22 and calponin in PEA-derived primary cells indicated distinctive PASMCs (PEA-PASMCs) characteristics (Figure 2D).

Isolation and characterization of cells from PEA tissues. (A) Specimen isolated from PEA patient. (B) Sketch map of PEA tissue culture. (C) Primary cells were cultured from PEA tissue. (D) Primary cells were found to express smooth muscle cell markers, including α-SMA, SM22 and calponin. PASMCs from healthy donors were also positive for these markers, as shown in the associated fluorescent images, indicating that the PEA-derived primary cells were pulmonary artery smooth muscle cells. Magnification: bright-field images: 100×, fluorescent images: 400×. Scale bar: 50 μm. PEA: pulmonary endarterectomy; α-SMA: alpha-smooth muscle actin; SM22: smooth muscle protein of 22 kDa; PASMCs: pulmonary artery smooth muscle cells.
Here the expression of glycolysis associated genes in PEA-PASMCs and the control PASMCs were analyzed. PKM2 expression in PEA-PASMC was approximately 2.5 times higher than control group significantly, and the PKM1 expression was also increased. Meanwhile, the glucose transporter 1 (GLUT 1) expression was significantly increased by more than 15 times. Hexokinase 2 (HK2), which catalyzes the conversion of glucose to glucose 6-phosphate, was also significantly increased to approximately 2.8 times higher than the control group. The overexpression of these glycolytic enzymes suggested PEA-PASMCs had an increased demand for glucose metabolism (Figure 3A).

PEA-PASMCs showed increased ROS production, increased glycolysis and enhanced cell proliferation and migration. (A) Compared to PASMCs from the healthy donors, the expression of PKM2 mRNA was significantly higher in PEA-PASMCs, while PKM1 mRNA expression was not significantly different. Expression of GLUT1 and HK2 mRNA was significantly increased, n = 3. (B) Western blotting analysis of glycolysis-related proteins. The expression of PKM1 and PKM2 in PEA-PASMCs was increased significantly; the ratio of PKM2/PKM1 was also significantly increased. Expression of GLUT1 and HK2 was significantly higher in PEA-PASMCs than in the control group, n = 3. (C) ROS production in PEA was significantly increased compared to the control group, n = 3. (D, E) The rates of glycolysis were compared between PEA-PASMCs and the control PASMCs. The oxygen consumption rate (D) and extracellular acidification rate (E) of PEA-PASMC were higher than those of the control cells. (F) The basal glycolysis rate of the PEA-PASMC group was significantly higher than the control cells. (G) PEA-PASMCs showed a significantly higher rate of proliferation than normal PASMCs. (H) The gap from the scratch wound was 50% closed at 24 h with PEA-PASMCs, which was significantly higher than the 10% gap closure of normal PASMC cells, n = 3. *P < 0.05, **P < 0.01, ****P < 0.0001. Magnifications of bright-field images and fluorescent images were 40× and 400×, respectively. Scale bar: 50 μm. PKM: pyruvate kinase M; PEA: pulmonary endarterectomy; DHE: dihydroethidium; 2-DG: 2-deoxy-D-glucose; Rot/AA: rotenone/antimycin A; OCR: oxygen consumption rate; ECAR: extracellular acidification rate; glycoPER: glycolytic proton exit rate; GLUT1: glucose transporter 1; HK2: hexokinase 2; PASMC: pulmonary artery smooth muscle cells; OD: optical density. N: control group.
Western blotting showed that the expression of PKM1, PKM2, GLUT1 and HK2 proteins increased consistently with their mRNA expression, and the ratio of PKM2/ PKM1 in PEA-PASMCs was significantly higher than that of the control group (Figure 3B). In addition, the elevated DHE fluorescent intensity in PEA-PASMC indicated increased intracellular ROS production compared to thecontrol group (Figure 3C).
In the assay measuring the rate of glycolysis, the oxygen consumption rate (OCR) represents aerobic metabolism, and the extracellular acidification rate (EACR) reflects the anaerobic glycolysis of cells. Compared to the control PASMCs, the basal OCR and EACR of PEA-PASMCswere significantly higher, suggesting that PEA-PASMCshad increased aerobic metabolism and anaerobic glycolysis (Figure 3D and 3E). The basal level of glycolysis was significantly higher in PEA-PASMCs than in normal controls (Figure 3F).
Cell proliferative and migratory activities were analyzed in PEA-PASMCs and control PASMCs. PEA-PASMCs demonstrated a significantly higher proliferation rate than the control cells, as shown by the CCK-8 test (Figure 3G). The results of the scratch migration assay showed that the PEA-PASMCs had a higher rate of scratch closure, where the gap was 52.4% closed in 24 h compared to 10% closed with the control PASMCs, P < 0.0001 (Figure 3H).
Downregulating PKM2 rectified the increased glycolytic, proliferative and migratory activities of PEA-PASMCs
To explore the roles of PKM2 in mediating the glycolytic abnormalities of the PEA-PASMCs, we used siRNA to downregulate PKM2, and the changes in the related genes and glycolysis were analyzed. Results showed that PKM2 siRNA reduced PKM2 mRNA level by more than 95% compared to the control siRNA-treated group. The expression of hnRNPA1, which modulates the splicing of PKM pre-mRNA, was significantly higher in PEA-PASMCs than in the control siRNA treated group. In contrast, the expression of c-myc, a transcription factor regulating the hnRNP family, was significantly decreased. Glucometabolic proteins GLUT1 and HK2 were also decreased significantly (P < 0.05) (Figure 4A). Western blotting showed that PKM2 was significantly reduced while hnRNPA1 and c-myc were significantly changed. However, protein expression of lactate dehydrogenase (LDHA) was downregulated significantly (P < 0.05) (Figure 4B).

Downregulating PKM2 expression rectified the increased glycolytic, proliferative and migratory activities of PEA-PASMCs. (A) Compared to the control siRNA, PKM2 siRNA significantly reduced the PKM2 mRNA level. Expression of hnRNPA1 was increased, and c-myc was decreased significantly. The mRNA expression of GLUT1 and HK2 was decreased significantly, while LDHA was not altered, n = 3. (B) PKM2 siRNA downregulated expression of PKM2 protein significantly; changes in hnRNPA1, c-myc, GLUT1 and HK2 proteins were not significant. Expression of LDHA protein was downregulated significantly, n = 3. In PKM2 siRNA-treated cells, the oxygen consumption rate (C) was significantly reduced and the extracellular acidification rate (D) was also reduced significantly. (E) The basal glycolysis rate was significantly lower than the control siRNA group. (F) PKM2 siRNA-treated cell showed a significantly lower rate of proliferation than control siRNA-treated cells. (G) The gap from the scratch wound was 8% closed at 24 h in PKM2 siRNA-treated cells, which was significantly lower than the 32% gap closure of the control siRNA-treated cells, n = 3. *P < 0.05, **P < 0.01, ***P < 0.001. Magnification of bright-field images: 40×. Scale bar: 100 μm. PKM: pyruvate kinase M; 2-DG: 2-deoxy-D-glucose; Rot/AA: rotenone/antimycin A; OCR: oxygen consumption rate; ECAR: extracellular acidification rate; glycoPER: glycolytic proton exit rate; GLUT1: glucose transporter 1; HK2: hexokinase 2; LDHA: lactate dehydrogenase; OD: optical density; NC: control siRNA group.
The rate of glycolysis in PKM2 siRNA or control siRNA-treated PEA-PASMCs were measured. The OCR and EACR of the PKM2 siRNA-treated cells were significantly reduced compared to the control siRNA group (Figure 4C and 4D). The level of glycolysis-related proton exits rate (glycoPER) decreased significantly, indicating that the basal level of glycolysis was significantly decreased, indicating PKM2-silencing reduced the rate of glycolysis (Figure 4E).
The proliferative activity of PEA-PASMCs was significantly reduced by PKM2 siRNA treatment (Figure 4F), and the scratch wound healing assay showed that the gap closure of PKM2 siRNA treated PEA-PASMCs was significantly slowed down (Figure 4G). These results suggested that knocking down PKM2 mitigated the excessive proliferative and migratory activities of PEA-derived cells.
In addition, to compare the effects of knocking down PKM2 in the control PASMCs and in PEA-PASMCs, the expression of glycolysis-related genes and the rate of glycolysis assay were measured (Supplementary Figure 1). It was found that the PKM2 siRNA reduced the expression of PKM2 significantly in the control PASMCs. The expression of GLUT1, HK2 and LDHA was decreased significantly in control PASMCs (Supplementary Figure 1A). The oxygen consumption rate (OCR) showed no significant difference (Supplementary Figure 1B). However, the extracellular acidification rate (ECAR) was decreased significantly in PKM2 siRNA-transfected control PASMCs (Supplementary Figure 1C), indicating that PKM2 knockdown reduced glycolysis in the control PASMCs.
Downregulation of hnRNPA1 reduced aberrant glycolytic, proliferative and migratory activities by reducing the expression of PKM2
The abundance of PKM2 is thought to be regulated by the alternative splicing mediated by the hnRNP family members. Here hnRNPA1 siRNA was used to reduce hnRNPA1 expression and whether this knockdown affected PKM2 levels and glycolysis of PEA-PASMCs or not was tested. The RT-PCR results showed that the transcription of hnRNPA1 was significantly reduced by hnRNPA1 siRNA than the control siRNA-treated group (P < 0.0001) (Figure 5A). In addition, the expression of PKM2 was downregulated significantly. Meanwhile, HK2 expression was downregulated, and c-myc expression was upregulated significantly (Figure 5A). Western blotting results showed consistent changes at the protein level, in which the expression of hnRNPA1, PKM2 and HK2 was downregulated; PKM1 and c-myc were upregulated (Figure 5B). These results suggested that hnRNPA1 inhibition reduced PKM2 production by modulating the alternative splicing of the PKM gene in PEA-PASMCs.

Downregulation of hnRNPA1 reduced aberrant glycolytic, proliferative and migratory activities by reducing the expression of PKM2. (A) Expression of hnRNPA1 mRNA was significantly downregulated by hnRNPA1 siRNA. PKM2 mRNA expression was reduced significantly compared to the control siRNA-treated cells. PKM1 was increased without significance. HK2 was significantly downregulated, and c-myc was increased significantly, n = 3. (B) Protein expression of hnRNPA1 was significantly downregulated in hnRNPA1 siRNA-treated cells. The expression of PKM2 was significantly reduced. In addition, PKM1 was increased, and HK2 was decreased significantly, and the expression of c-myc was significantly upregulated, n = 3. (C) In tests of glycolysis rate, the oxygen consumption rate was decreased without significance. (D) The extracellular acidification rate of cells was significantly decreased. (E) The basal glycolysis rate in hnRNPA1 siRNA-treated cells was significantly decreased. (F) The proliferative activity of the cell in the hnRNPA1 siRNA-treated group was significantly decreased than control-siRNA treated cells. (G) The scratch closure rate of the hnRNPA1 siRNA-treated cells was significantly lower than the control siRNA group (10% vs. 48%), n = 3. *P < 0.05, **P < 0.01, ***P < 0.001, ****P < 0.0001. Magnification of bright-field images: 40×. Scale bar: 100 μm. 2-DG: 2-deoxy-D-glucose; Rot/AA: rotenone/antimycin A; OCR: oxygen consumption rate; ECAR: extracellular acidification rate; glycoPER: glycolytic proton exit rate; GLUT1: glucose transporter 1; HK2: hexokinase 2; PKM: pyruvate kinase M; OD: optical density; NC: control siRNA group.
Tests of glycolysis rate were performed in hnRPNA1 siRNA- or control siRNA-treated PEA-PASMCs. Compared to the control group, the OCR and ECAR of hnRNPA1 siRNA-treated cells were reduced significantly (Figure 5C and 5D). The basal glycolysis was also reduced as the level of glycoPER decreased significantly (Figure 5E). The cellular proliferative activity in hnRNPA1 siRNA-treated PEA-PASMCs was attenuated (Figure 5F), and the scratch closure rate of the hnRNPA1 siRNA-treated group was significantly lower than the control siRNA-treated group (Figure 5G). In summary, these results showed that knocking down hnRNPA1 reduced PKM2 expression and exerted inhibitory effects of glycolysis, proliferation and migration of PEA-PASMCs.
Inhibition of ROS production alleviated aberrant glycolytic, proliferative and migratory activities with decreased PKM2 expression
To explore the roles of ROS on glycolysis, proliferation and migration of PEA-PASMC, antioxidant NAC and mito-TEMPO were used to reduce intracellular ROS of PEA-PASMCs. We found that both NAC and mito-TEMPO decreased intracellular ROS production significantly compared to the control group (Figure 6A). Gene expression of PKM2, c-myc and LDHA was downregulated significantly in the NAC-treated group compared to the control group (Figure 6B). In Western blotting analysis, expression of PKM2 was significantly downregulated, while c-myc was elevated in NAC and mito-TEMPO group (Figure 6C).

Inhibition of ROS alleviated aberrant glycolytic, proliferative and migratory activities with decreasing expression of PKM2. (A) Antioxidant NAC and mito- TEMPO significantly reduced intracellular ROS generation. (B) PKM2 expression was significantly decreased in PEA-derived cells treated with NAC. Expression of c-myc and LDHA was decreased in the NAC group compared to the control group. (C) Expression of PKM2 was decreased in NAC and mito-TEMPO group compared to the control group in the Western blotting analysis. Expression of hnRNPA1, c-myc and LDHA was increased in NAC or mito-TEMPO-treated group. (D) In the glycolysis assay, the oxygen consumption rate was significantly decreased in NAC and mito-TEMPO group. (E) The extracellular acidification rate was significantly decreased in the NAC group. (F) The basal glycolysis rate in the NAC group was significantly lower. (G) The proliferative activity of NAC-treated cell was decreased than the control group. (H) The scratch closure rate of the NAC and the mito-TEMPO group was both significantly lower than the control group. *P < 0.05, **P < 0.01, ***P < 0.001. Magnifications of bright-field images and fluorescent images were 40× and 400×, respectively. Scale bar: 50 μm. PKM:pyruvate kinase M; PEA: pulmonary endarterectomy; NAC: N-acetylcysteine; DHE: dihydroethidium; 2-DG: 2-deoxy-D-glucose; Rot/AA: rotenone/antimycin A; OCR: oxygen consumption rate; ECAR: extracellular acidification rate; glycoPER: glycolytic proton exit rate; GLUT1: glucose transporter 1; HK2: hexokinase 2.
On glycolysis rate assay, the OCR of NAC- and mito- TEMPO-treated PEA-PASMCs group was significantly decreased compared to the control group (Figure 6D). The EACR decreased significantly in the NAC-treated PEA-PASMCs group while showing no significance in the mito-TEMPO-treated PEA-PASMCs group compared to the control group (Figure 6E). In addition, the basal glycolysis was significantly decreased in NAC and mito-TEMPO-treated PEA-PASMCs group (Figure 6F).
Cellular proliferative activity in NAC- and mito-TEMPO-treated groups was attenuated compared to the control group (Figure 6G), and the scratch closure rate of antioxidant groups was significantly lower than the control group (Figure 6H). These results showed that inhibition of ROS production downregulated PKM2 expression and elicited inhibitory effects of the glycolysis, proliferation and migration of PEA-PASMCs.
Discussion
In this study, we demonstrated the significantly increased PKM2 expression in PEA tissue and elevated serum PKM2 levels in CTEPH patients for the first time, along with the observation of increased glycolysis and cellular proliferative activities in PEA-derived PASMCs from CTEPH patients. Elevated ROS production was also found in PEA-PASMCs, associated with abnormally increased glycolysis and proliferative activity. Furthermore, modulating PKM2 expression by hnRNPA1 knockdown and inhibition of oxidative stress mitigated the altered glycolysis, proliferation and migration of PEA-PASMC.
Our observation of altered glucose metabolism in PEA tissues-derived cells from CTEPH patients is important. Most CTEPH patients have experienced one or more acute pulmonary thromboembolic events. The pulmonary thrombus alters the microenvironment at the blockage site, thereby causing endothelial dysfunction and enhancing the proliferative and migratory activities of smooth muscle cells. Our data confirmed the relevance of increased energy requirements in the hyper-proliferative PASMCs in CTEPH.
PKM2 is commonly considered as a tumor-specific pyruvate kinase, where an increase in the dimeric proportion of PKM2 associated with shifted/elevated glycolysis while stimulating cell proliferation in the tumor.[29,30] In addition, to catalyze the conversion PEP to pyruvate, PKM2 could also enter the cell nucleus and act as a transcription factor. In this study, we have provided direct measurement of the increased serum levels of PKM2 in CTEPH patients as well as in PEA-PASMCs. The PEA-PASMCs also exhibited increased glycolysis, excessive proliferative and migratory activities. These evidence of metabolic changes in PEA-PASMCs from CTEPH patients is consistent to the previous findings of “Warburg” metabolism status in tumor cells and PAH.[31]
The expression of PKM2 is regulated by the hnRNP family. In PASMCs from CTEPH patients, inhibition of hnRNPA1 expression reduced the expression of PKM2 and the ratio of PKM2 and PKM1. We showed that hnRNPA1 regulated glycolysis and proliferative activity by modulating PKM2 expression, in a similar manner to the previously reported regulation of PKM2 by miR-124 and PBTP1 in fibroblasts and endothelial cells from PAH.[9,10] Taken together, these studies indicated that PKM2 is regulated by a hnRNP family member (PTBP1 or hnRNPA1) across different groups of PH (PAH and CTEPH) with differing etiologies. The convergence of these regulatory effects on PKM2 in different types of PH suggested that this common pathway and its related proteins may represent novel targets for modulating the metabolic reprogramming and vascular remodeling in PH.
The expression of glycolysis-related proteins GLUT1 and HK2 in PEA-PASMC was higher than the control group in this study. GLUT1 is associated with glucose transporting, and HK2 is responsible for converting glucose to 6-phosphate glucose, promoting subsequent steps of glucose metabolism. These increases are consistent with phenotypic changes of PEA-PASMCs with elevated glucose metabolic requirements. Additionally, we found that silencing PKM2 downregulated the expression of LDHA, which is an enzyme catalyzing the conversion of pyruvate to lactic acid. The reduction in LDHA indicates decreased glycolysis and cell proliferation confirmed in PEA-PASMCs.[32] All these results showed that when PKM2 decreased, the dysregulated glycolysis and the hyper-proliferate activities of PEA-PASMCs could be mitigated.
The expression of c-myc was observed in PEA-PASMCs. C-myc is a transcription factor related to cell proliferation and metabolic regulation, which is highly increased in hyper-proliferative cells.[33,34,35] Previous studies suggested that c-myc may regulate the expression of the hnRNP family, thereby affecting PKM2, glycolytic and proliferative activities of cells.[19,23] In this study, we have found that upregulating the expression of hnRNPA1 was associated with decreased c-myc expression while inhibiting hnRNPA1 expression could increase the expression of c-myc significantly. These results suggested that there may be feedback regulation between c-myc and hnRNPA1, which deserves further clarification. A schematic diagram showing the mechanisms via which the hnRNPA1/PKM2 signaling axis regulates glycolysis in PEA-PASMCs is presented in Figure 7.
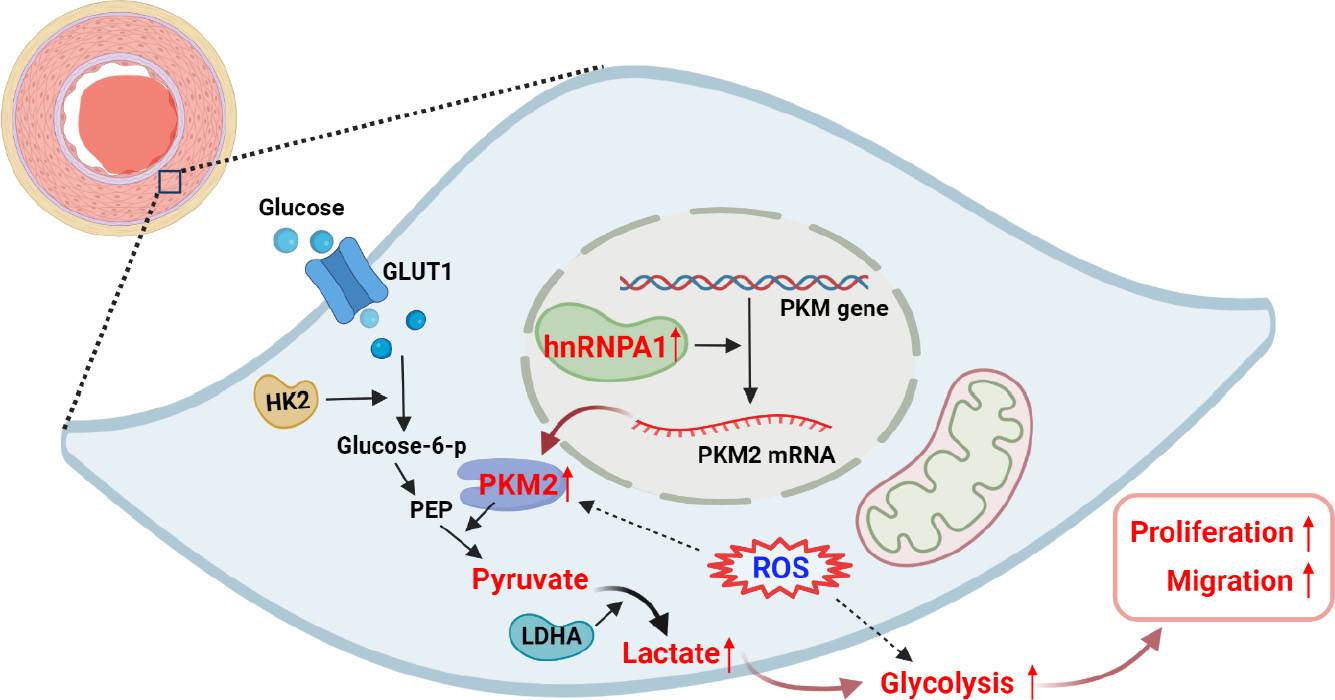
Schematic diagram showing the mechanisms via which the hnRNPA1/PKM2 signaling axis regulates glycolysis in PEA-PASMCs. An increased expression of hnRNPA1 produced more PKM2, which promoted cellular glycolysis, increasing proliferative and migratory activities in PEA-PASMCs. Increased intracellular ROS generation promoted glycolysis in PEA-PASMC. GLUT1: glucose transporter 1; HK2: hexokinase 2; PEP: phosphoenolpyruvate; LDHA: lactate dehydrogenase A; ROS: reactive oxygen species. This figure is created with BioRender.com.
ROS production was found elevated in PEA-PASMCs. Inhibition of ROS by NAC decreased the expression of PKM2 and rectified aberrant glycolysis, indicating intracellular oxidative stress-promoted glycolytic, proliferative and migratory activities in PEA-PASMCs. The previous study has shown that increased oxidative stress existed in PAH,[36] and the NADPH oxidase family (NOXs) and mitochondria are the primary sources of ROS generation.[37] In this study, the immunohistochemical results indicated that the expression of NOX4 was higher in CTEPH than in the control group, while the expression of NOX1, NOX2 and NOX5 showed no significant differences between the two groups (Supplementary Figure 2). These results suggested that NOX4 might be one of the sources of ROS in CTEPH. The intracellular ROS increased PKM2 phosphorylation in PASMCs from rodents with MCT-induced PAH,[38] indicating that the expression and activity of PKM2 were related to the production of ROS in addition to being regulated by hnRNP family members.
It has been reported that PEA-derived endothelial cells had decreased glycolysis.[39] In that study, the authors compared the PEA-derived endothelial cells with normal pulmonary artery endothelial cells, decreased expression of HK2 and phosphofructokinase-1 (PFK1) at mRNA level, and lower expression of HK2 and LDHA at the protein level. The different results between our study and this previous report could be due to the different cell types tested. In our study, the PEA-PASMCs are derived from CTEPH patient tissues, while the control PASMCs were purchased from commercial source. We acknowledge the potential differences in the techniques adopted for cell isolation. In addition, cells cultured from different PEA tissue samples may exhibit different metabolic profiles.
In conclusion, abnormally elevated ROS production and glycolysis were found in the pulmonary artery smooth muscle isolated from PEA tissues of CTEPH patients. In CTEPH-derived PASMCs, inhibition of hnRNPA1 or oxidative stress restored normal glycolysis, proliferative and migratory activities via downregulating PKM2. Regulation of PKM2 may represent a new therapeutic strategy targeting microvasculopathy and remodeling for the treatment of CTEPH.
Funding statement: This work was supported by the National Key R&D Program of China, Ministry of Science and Technology of China (No. 2018YFC1315100); CAMS Innovation Fund for Medical Sciences (CIFMS) (No.2018-I2M-1-003).
Acknowledgments
We wish to thank all the CTEPH patients and the healthy control who involved in this study. We thank the surgical center of China-Japan Friendship Hospital for the assistance of specimen collection.
-
Ethics Approval and Consent to Participate
This study was approved by the research ethical committee of China-Japan Friendship Hospital (Approval No. 2019-121-K83). Written informed consent was obtained from all participants.
-
Conflicts of Interest
Conflict of Interest: The authors declare that the research was conducted in the absence of any commercial or financial relationships that could be construed as a potential conflict of interest.
References
1 Galie N, Humbert M, Vachiery JL, Gibbs S, Lang I, Torbicki A, et al. 2015 ESC/ERS Guidelines for the diagnosis and treatment of pulmonary hypertension: The Joint Task Force for the Diagnosis and Treatment of Pulmonary Hypertension of the European Society of Cardiology (ESC) and the European Respiratory Society (ERS): Endorsed by: Association for European Paediatric and Congenital Cardiology (AEPC), International Society for Heart and Lung Transplantation (ISHLT). Eur Heart J 2016;37:67-119.10.1093/eurheartj/ehv317Search in Google Scholar PubMed
2 Gall H, Hoeper MM, Richter MJ, Cacheris W, Hinzmann B, Mayer E. An epidemiological analysis of the burden of chronic thromboembolic pulmonary hypertension in the USA, Europe and Japan. Eur Respir Rev 2017;26:160121.10.1183/16000617.0121-2016Search in Google Scholar PubMed PubMed Central
3 Kamenskaya O, Klinkova A, Chernyavskiy A, Lomivorotov VV, Edemskiy A, Shmyrev V. Long-term health-related quality of life after surgery in patients with chronic thromboembolic pulmonary hypertension. Qual Life Res 2020;29:2111–8.10.1007/s11136-020-02471-zSearch in Google Scholar PubMed
4 Dorfmuller P, Gunther S, Ghigna MR, Thomas de Montpreville V, Boulate D, Paul JF, et al. Microvascular disease in chronic thromboembolic pulmonary hypertension: a role for pulmonary veins and systemic vasculature. Eur Respir J 2014;44:1275–88.10.1183/09031936.00169113Search in Google Scholar PubMed
5 Gerges C, Gerges M, Friewald R, Fesler P, Dorfmuller P, Sharma S, et al. Microvascular Disease in Chronic Thromboembolic Pulmonary Hypertension: Hemodynamic Phenotyping and Histomorphometric Assessment. Circulation 2020;141:376–86.10.1161/CIRCULATIONAHA.119.041515Search in Google Scholar PubMed
6 Mayer E, Jenkins D, Lindner J, D’Armini A, Kloek J, Meyns B, et al. Surgical management and outcome of patients with chronic thromboembolic pulmonary hypertension: results from an international prospective registry. J Thorac Cardiovasc Surg 2011;141:702–10.10.1016/j.jtcvs.2010.11.024Search in Google Scholar PubMed
7 Kim NH, Delcroix M, Jenkins DP, Channick R, Dartevelle P, Jansa P, et al. Chronic thromboembolic pulmonary hypertension. J Am Coll Cardiol 2013;62:D92–9.10.1016/j.jacc.2013.10.024Search in Google Scholar PubMed
8 Tajsic T, Morrell NW. Smooth muscle cell hypertrophy, proliferation, migration and apoptosis in pulmonary hypertension. Compr Physiol 2011;1:295–317.10.1002/cphy.c100026Search in Google Scholar PubMed
9 Caruso P, Dunmore BJ, Schlosser K, Schoors S, Dos Santos C, Perez- Iratxeta C, et al. Identification of MicroRNA-124 as a Major Regulator of Enhanced Endothelial Cell Glycolysis in Pulmonary Arterial Hypertension via PTBP1 (Polypyrimidine Tract Binding Protein) and Pyruvate Kinase M2. Circulation 2017;136:2451–67.10.1161/CIRCULATIONAHA.117.028034Search in Google Scholar PubMed PubMed Central
10 Zhang H, Wang D, Li M, Plecita-Hlavata L, D’Alessandro A, Tauber J, et al. Metabolic and Proliferative State of Vascular Adventitial Fibroblasts in Pulmonary Hypertension Is Regulated Through a MicroRNA-124/PTBP1 (Polypyrimidine Tract Binding Protein 1)/Pyruvate Kinase Muscle Axis. Circulation 2017;136:2468–85.10.1161/CIRCULATIONAHA.117.028069Search in Google Scholar PubMed PubMed Central
11 Kovacs L, Cao Y, Han W, Meadows L, Kovacs-Kasa A, Kondrikov D, et al. PFKFB3 in Smooth Muscle Promotes Vascular Remodeling in Pulmonary Arterial Hypertension. Am J Respir Crit Care Med 2019;200:617–27.10.1164/rccm.201812-2290OCSearch in Google Scholar PubMed PubMed Central
12 Warburg O. On the origin of cancer cells. Science 1956;123:309–14.10.1126/science.123.3191.309Search in Google Scholar PubMed
13 Sakao S, Daimon M, Voelkel NF, Miyauchi H, Jujo T, Sugiura T, et al. Right ventricular sugars and fats in chronic thromboembolic pulmonary hypertension. Int J Cardiol 2016;219:143–149.10.1016/j.ijcard.2016.06.010Search in Google Scholar PubMed
14 Quarck R, Wynants M, Ronisz A, Sepulveda MR, Wuytack F, Van Raemdonck D, et al. Characterization of proximal pulmonary arterial cells from chronic thromboembolic pulmonary hypertension patients. Respir Res 2012;13:27.10.1186/1465-9921-13-27Search in Google Scholar PubMed PubMed Central
15 Christofk HR, Vander Heiden MG, Harris MH, Ramanathan A, Gerszten RE, Wei R, et al. The M2 splice isoform of pyruvate kinase is important for cancer metabolism and tumour growth. Nature 2008;452:230–3.10.1038/nature06734Search in Google Scholar PubMed
16 Vander Heiden MG, Cantley LC, Thompson CB. Understanding the Warburg effect: the metabolic requirements of cell proliferation. Science 2009;324:1029–33.10.1126/science.1160809Search in Google Scholar PubMed PubMed Central
17 Zhang Z, Deng X, Liu Y, Liu Y, Sun L, Chen F. PKM2, function and expression and regulation. Cell Biosci 2019;9:52.10.1186/s13578-019-0317-8Search in Google Scholar PubMed PubMed Central
18 Clower CV, Chatterjee D, Wang Z, Cantley LC, Vander Heiden MG, Krainer AR. The alternative splicing repressors hnRNP A1/A2 and PTB influence pyruvate kinase isoform expression and cell metabolism. Proc Natl Acad Sci U S A 2010;107:1894–9.10.1073/pnas.0914845107Search in Google Scholar PubMed PubMed Central
19 David CJ, Chen M, Assanah M, Canoll P, Manley JL. HnRNP proteins controlled by c-Myc deregulate pyruvate kinase mRNA splicing in cancer. Nature 2010;463:364–8.10.1038/nature08697Search in Google Scholar PubMed PubMed Central
20 Chen M, Zhang J, Manley JL. Turning on a fuel switch of cancer: hnRNP proteins regulate alternative splicing of pyruvate kinase mRNA. Cancer Res 2010;70:8977–80.10.1158/0008-5472.CAN-10-2513Search in Google Scholar PubMed PubMed Central
21 Lan Z, Yao X, Sun K, Li A, Liu S, Wang X. The Interaction Between lncRNA SNHG6 and hnRNPA1 Contributes to the Growth of Colorectal Cancer by Enhancing Aerobic Glycolysis Through the Regulation of Alternative Splicing of PKM. Front Oncol 2020;10:363.10.3389/fonc.2020.00363Search in Google Scholar PubMed PubMed Central
22 Fu R, Yang P, Amin S, Li Z. A novel miR-206/hnRNPA1/PKM2 axis reshapes the Warburg effect to suppress colon cancer growth. Biochem Biophys Res Commun 2020;531:465–71.10.1016/j.bbrc.2020.08.019Search in Google Scholar PubMed
23 Luan W, Wang Y, Chen X, Shi Y, Wang J, Zhang J, et al. PKM2 promotes glucose metabolism and cell growth in gliomas through a mechanism involving a let-7a/c-Myc/hnRNPA1 feedback loop. Oncotarget 2015;6:13006–18.10.18632/oncotarget.3514Search in Google Scholar PubMed PubMed Central
24 Anastasiou D, Poulogiannis G, Asara JM, Boxer MB, Jiang JK, Shen M, et al. Inhibition of pyruvate kinase M2 by reactive oxygen species contributes to cellular antioxidant responses. Science 2011;334:1278–83.10.1126/science.1211485Search in Google Scholar PubMed PubMed Central
25 Hayyan M, Hashim MA, AlNashef IM. Superoxide Ion: Generation and Chemical Implications. Chem Rev 2016;116:3029–85.10.1021/acs.chemrev.5b00407Search in Google Scholar PubMed
26 Han D, Williams E, Cadenas E. Mitochondrial respiratory chaindependent generation of superoxide anion and its release into the intermembrane space. Biochem J 2001;353:411–6.10.1042/bj3530411Search in Google Scholar
27 Patil S, Bunderson M, Wilham J, Black SM. Important role for Rac1 in regulating reactive oxygen species generation and pulmonary arterial smooth muscle cell growth. Am J Physiol Lung Cell Mol Physiol 2004;287:L1314–22.10.1152/ajplung.00383.2003Search in Google Scholar PubMed
28 Veit F, Pak O, Egemnazarov B, Roth M, Kosanovic D, Seimetz M, et al. Function of NADPH oxidase 1 in pulmonary arterial smooth muscle cells after monocrotaline-induced pulmonary vascular remodeling. Antioxid Redox Signal 2013;19:2213–31.10.1089/ars.2012.4904Search in Google Scholar PubMed
29 Li Z, Yang P, Li Z. The multifaceted regulation and functions of PKM2 in tumor progression. Biochim Biophys Acta 2014;1846:285–96.10.1016/j.bbcan.2014.07.008Search in Google Scholar PubMed
30 Israelsen WJ, Vander Heiden MG. Pyruvate kinase: Function, regulation and role in cancer. Semin Cell Dev Biol 2015;43:43–51.10.1016/j.semcdb.2015.08.004Search in Google Scholar PubMed PubMed Central
31 Archer SL. Pyruvate Kinase and Warburg Metabolism in Pulmonary Arterial Hypertension: Uncoupled Glycolysis and the Cancer-Like Phenotype of Pulmonary Arterial Hypertension. Circulation 2017;136:2486–90.10.1161/CIRCULATIONAHA.117.031655Search in Google Scholar PubMed PubMed Central
32 Di H, Zhang X, Guo Y, Shi Y, Fang C, Yuan Y, et al. Silencing LDHA inhibits proliferation, induces apoptosis and increases chemosensitivity to temozolomide in glioma cells. Oncol Lett 2018;15:5131–6.10.3892/ol.2018.7932Search in Google Scholar PubMed PubMed Central
33 Miller DM, Thomas SD, Islam A, Muench D, Sedoris K. c-Myc and cancer metabolism. Clin Cancer Res 2012;18:5546–53.10.1158/1078-0432.CCR-12-0977Search in Google Scholar PubMed PubMed Central
34 Chen Z, Zeng H, Guo Y, Liu P, Pan H, Deng A, et al. miRNA-145 inhibits non-small cell lung cancer cell proliferation by targeting c-Myc. J Exp Clin Cancer Res 2010;29:151.10.1186/1756-9966-29-151Search in Google Scholar PubMed PubMed Central
35 Munz M, Kieu C, Mack B, Schmitt B, Zeidler R, Gires O. The carcinomaassociated antigen EpCAM upregulates c-myc and induces cell proliferation. Oncogene 2004;23:5748–58.10.1038/sj.onc.1207610Search in Google Scholar PubMed
36 Frazziano G, Champion HC, Pagano PJ. NADPH oxidase-derived ROS and the regulation of pulmonary vessel tone. Am J Physiol Heart Circ Physiol 2012;302:H2166–77.10.1152/ajpheart.00780.2011Search in Google Scholar PubMed PubMed Central
37 Thannickal VJ, Fanburg BL. Reactive oxygen species in cell signaling. Am J Physiol Lung Cell Mol Physiol 2000;279:L1005–28.10.1152/ajplung.2000.279.6.L1005Search in Google Scholar PubMed
38 Guo D, Gu J, Jiang H, Ahmed A, Zhang Z, Gu Y. Inhibition of pyruvate kinase M2 by reactive oxygen species contributes to the development of pulmonary arterial hypertension. J Mol Cell Cardiol 2016;91:179–87.10.1016/j.yjmcc.2016.01.009Search in Google Scholar PubMed
39 Smolders V, Rodriguez C, Moren C, Blanco I, Osorio J, Piccari L, et al. Decreased Glycolysis as Metabolic Fingerprint of Endothelial Cells in Chronic Thromboembolic Pulmonary Hypertension. Am J Respir Cell Mol Biol 2020;63:710–3.10.1165/rcmb.2019-0409LESearch in Google Scholar PubMed
© 2023 Lianhua Liu, Wenyi Pang, Jixiang Liu, Shiqing Xu, Zhu Zhang, Risheng Hao, Jun Wan, Wanmu Xie, Xincao Tao, Peiran Yang, Lan Zhao, Zhenguo Zhai, Chen Wang, published by De Gruyter on behalf of Scholar Media Publishing
This work is licensed under the Creative Commons Attribution-NonCommercial-NoDerivatives 4.0 International License.
Articles in the same Issue
- Guideline and Consensus
- Chinese expert consensus on blood lipid management in patients with diabetes (2024 edition)
- Review Article
- Role of viral hepatitis in pregnancy and its triggering mechanism
- Original Article
- Machine learning-based phenogroups and prediction model in patients with functional gastrointestinal disorders to reveal distinct disease subsets associated with gas production
- Recognition of differently expressed genes and DNA methylation markers in patients with Lupus nephritis
- PRP improves the outcomes of autologous skin graft transplantation on the esophagus by promoting angiogenesis and inhibiting fibrosis and inflammation
- Identification of functional heterogeneity of immune cells and tubular-immune cellular interplay action in diabetic kidney disease
- Actin-related protein 2/3 complex subunit 1B promotes ovarian cancer progression by regulating the AKT/PI3K/mTOR signaling pathway
- Comprehensive succinylome analyses reveal that hyperthermia upregulates lysine succinylation of annexin A2 by downregulating sirtuin7 in human keratinocytes
- Inhibition of heterogeneous nuclear ribonucleoproteins A1 and oxidative stress reduces glycolysis via pyruvate kinase M2 in chronic thromboembolic pulmonary hypertension