The effects of cold region meteorology and specific environment on the number of hospital admissions for chronic kidney disease: An investigate with a distributed lag nonlinear model
-
Xinrui Wei


Abstract
Objective
To explore the effects of daily mean temperature (°C), average daily air pressure (hPa), humidity (%), wind speed (m/s), particulate matter (PM) 2.5 (μg/m3) and PM10 (μg/m3) on the admission rate of chronic kidney disease (CKD) patients admitted to the Second Affiliated Hospital of Harbin Medical University in Harbin and to identify the indexes and lag days that impose the most critical influence.
Methods
The R language Distributed Lag Nonlinear Model (DLNM), Excel, and SPSS were used to analyze the disease and meteorological data of Harbin from 01 January 2010 to 31 December 2019 according to the inclusion and exclusion criteria.
Results
Meteorological factors and air pollution influence the number of hospitalizations of CKD to vary degrees in cold regions, and differ in persistence or delay. Non-optimal temperature increases the risk of admission of CKD, high temperature increases the risk of obstructive kidney disease, and low temperature increases the risk of other major types of chronic kidney disease. The greater the temperature difference is, the higher its contribution is to the risk. The non-optimal wind speed and non-optimal atmospheric pressure are associated with increased hospital admissions. PM2.5 concentrations above 40 μg/m3 have a negative impact on the results.
Conclusion
Cold region meteorology and specific environment do have an impact on the number of hospital admissions for chronic kidney disease, and we can apply DLMN to describe the analysis.
1 Introduction
The World Health Organization (WHO) ranks air pollution and climate change as the top 10 global health risks[1]. Chronic kidney disease (CKD), as a non-communicable chronic disease, is included in the second tier of health problems and its importance is being emphasized year by year due to its high incidence, high disability rate, severe disease burden and low awareness rate[2]. As of 2019, the number of patients with CKD in the world exceeded 697 million, and the incidence rate of CKD in China was about 10.8% (lower than 13% in the United States and 16.2% in Australia)[2]. Among the 1.2 million deaths from CKD in the world every year, 170 000 were in China, second only to India, ranked the top 2 in the world[2]. Early screening, identification, intervention and management are of positive significance for controlling CKD, reducing the burden of the disease and improving the population health.
Cold regions in China account for 43.5 % of China’s land area and nearly 60 % of China’s administrative divisions[3]. It is concluded that diet, lifestyle and living conditions in cold regions are closely linked to the incidence and development of CKD[4]. This study will be based on climatic and atmospheric pollution in cold regions. Weather affects human health from multiple aspects and layers including physiological, psychological, social attributes[5-7]. In China, studies have shown that high temperature is associated with an increased risk of obstructive nephropathy[8] and non-optimal temperature leads to an increased burden of CKD[9]. In 2022, a 10 µg/m3 increase in PM2.5 was found to increase the CKD risk ratio by 1.71 (95% CI: 1.58-1.85)[10]. Harbin is the capital city of a cold region with the highest latitude and lowest temperature in China, and no pertinent research has been reported.
The number of CKD admissions depends not only on the day’s exposure, but also on the previous days’ exposure. The Distributed Lag Model was first proposed in econometric time series analysis and was extended by Gasparrini et al.[11-12] In this study, the nonlinear and delayed effects of climate change and air pollution on the number of Harbin CKD patients admitted to the Second Affiliated Hospital of Harbin Medical University were constrained and estimated by smoothing based on DLNM, combined with natural cubic spline (NS), stratified lag and cross basis function, as well as other related variables[13]. Additionally, the day of the week effect and holiday effect were controlled to assess the relationship between climatic conditions and disease outcomes[13].
2 Material
2.1 Research site
Harbin in Heilongjiang Province (and its municipal district) is located in the Northeast plain, with a temperate monsoon climate. It is located in the east longitude of 125°-130° and the north latitude of 44°-46°, and is the capital city of a typical cold region with up to 10 009 854 residents. Due to its high latitude, Harbin is vulnerable to cold air attack and covered by snow and ice nearly half of the year, with long wintertime and short sunshine duration and large differences between the maximum and the minimum temperatures.
2.2 Patient data
The data of patients with CKD were obtained from the Second Affiliated Hospital of Harbin Medical University, a representative hospital in Harbin. The hospitalized medical records from 01 January 2010 to 31 December 2019 were collected from the national medical diagnosis database authorized by the National Health Commission of the People’s Republic of China. According to the tenth edition of the International Standard Classification of Diseases (ICD10) combined with the classification code of the HIIS system of hospitals, diseases were sorted out. The inclusion criteria were: (1) currently living in Harbin; and (2) clearly meet the diagnostic criteria of the Guidelines for Early Screening, Diagnosis and Prevention of Chronic Kidney Disease (2022 Edition)[14]. The exclusion criteria were: (1) out-of-town patients; (2) patients with missing address information; and and (3) patients with acute, pregnancy, drug or trauma related kidney disease. Nearly one million data were collected and verified for their accuracy, including patient gender, age, address, primary diagnosis and code, secondary diagnosis and code, etc. As this study lacked identifiable patient information and was retrospective, it was not reviewed by the Ethics Committee and no informed consent was obtained.
2.3 Meteorological data
Meteorological data were mainly provided by the Harbin Meteorological Observatory (District Station 50953), which is located at 126.56° E and 45.82° N. The type of meteorological data is surface daily value data, and the period is from 01 January 2010 to 31 December 2019, covering ten full years. The data include daily mean temperature (°C), daily mean air pressure (hPa), daily mean humidity (%), and daily mean wind speed (m/s). The air pollution data were also obtained from the Harbin Meteorological Station, including daily environmental monitoring data of air pollution particulate matter (PM) 10 and fine PM2.5 for eight years from 01 January 2013 to 31 December 2019.
2.4 Statistical methods
DLNM is a modeling framework that can describe both non-linear and delayed correlations, known as exposure-delay-response correlations. The statistical computations of this framework are implemented in the R language package “dlnm” (P < 0.05) [13]. Its main characteristic is to specify an array association of additional dimensions, which takes into account the time dependency between the exposure and the results with offset. This model may explain the impact of a particular exposure event on multiple future outcomes, or a particular outcome is explained by multiple previous exposures. The basic model is expressed as:
Where, μt≡E (Yt), g is a monotone function, and Yt is the daily number of hospital admissions assumed to be Poisson distribution. The original variable is transformed to generate the change variable, namely the base variable, which is expressed as s(xt;β) = zt⊺.β. The dependent variable was the number of patients hospitalized for a disease, Zt is the n*vx matrix and the hysteresis dimension matrix Q allowing for a delay. In the dimension of n*(L+1), L is the maximum lag days and each column of Q matrix is multiplied by the basis function to get the n*vx*L model, so the DLNM base model can be expressed as:
rtj is from the basis function of Q matrix, and
3 Results
During the study period from 01 January 2010 to 31 December 2019 (3651 days), the average temperature in Harbin was 5.11°C, the minimum temperature fluctuated and the maximum temperature did not change significantly, and the general trend was consistent with that of the world. The average annual humidity was 65.87%, with precipitation increasing year to year. The mean atmospheric pressure was 1014.72 hPa, with seasonal variations. The wind speed was transformed into a dish and became progressively stable. Fig. 1 (a-d) shows the monthly average temperature, humidity, atmospheric pressure and wind velocity, respectively. The number of cold wave days (cold air activities in which the local minimum temperature drops by more than 8°C and the minimum temperature drops to 4°C or below within 24 hours) accounted for about 1/3 of the whole year (Fig. 2). Since 2013, the air pollution control in Harbin has been effective, and the PM2.5 and PM10 in the air has been steadily decreasing, but the pollution was still heavy in winter, and the air quality was in urgent need of improvement (Fig. 3).
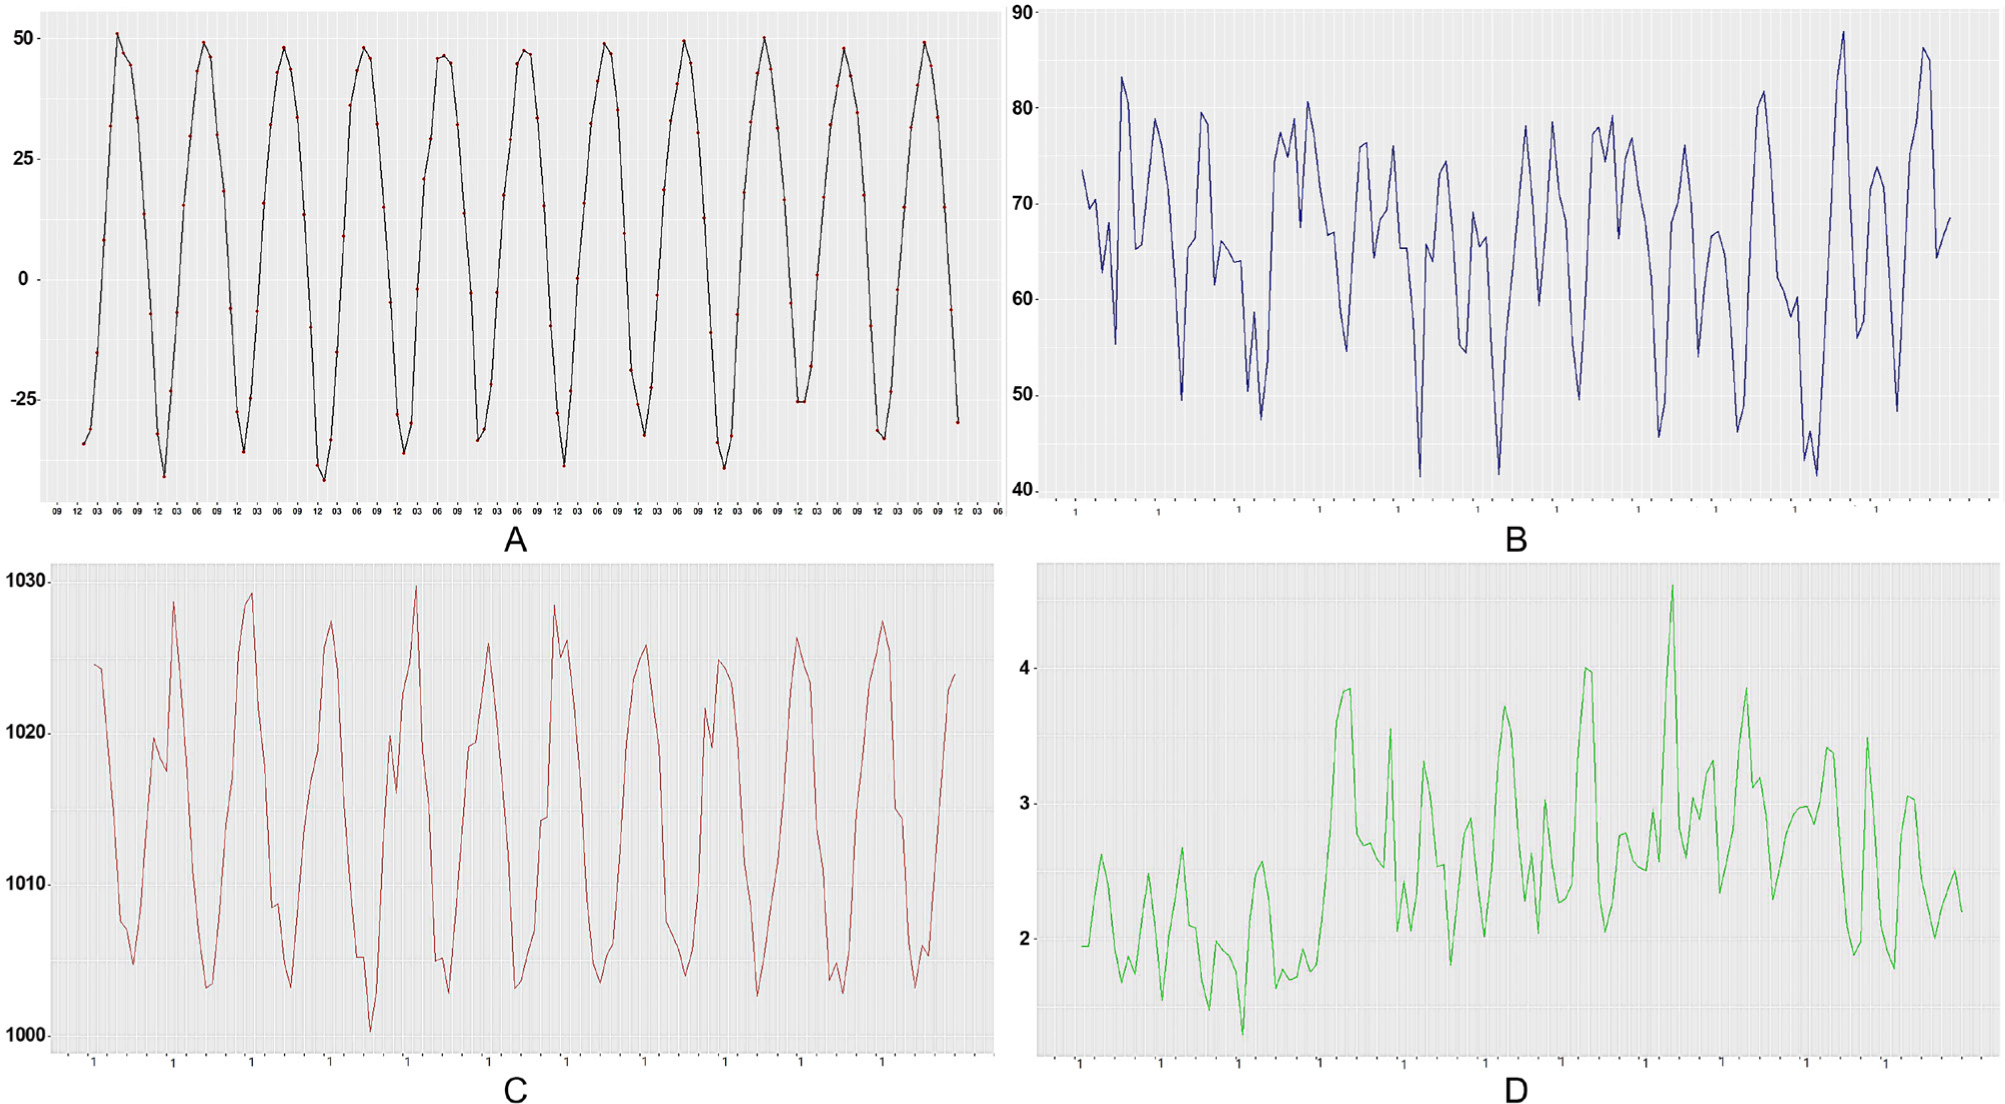
Line chart of monthly mean meteorological elements in Harbin from 2010 to 2020
(A) Monthly average temperature Line Chart: The lowest monthly average temperature shows a fluctuating upward trend; (B) Monthly average humidity line chart: Since 2019, the snowfall in winter has decreased significantly, and the precipitation in summer has increased significantly with overall increasing precipitation. (C) Monthly mean atmospheric pressure broken line chart: the high-level atmospheric pressure slightly decreased, whereas the low-level atmospheric pressure slightly increased, and the overall change of atmospheric pressure was significantly related to the season, showing a trend of low in summer and high in winter. (D) Monthly average wind speed broken line chart: from January 2013 to May 2017, the monthly average wind speed reached 4.61m /s, then gradually decreased in 2019.
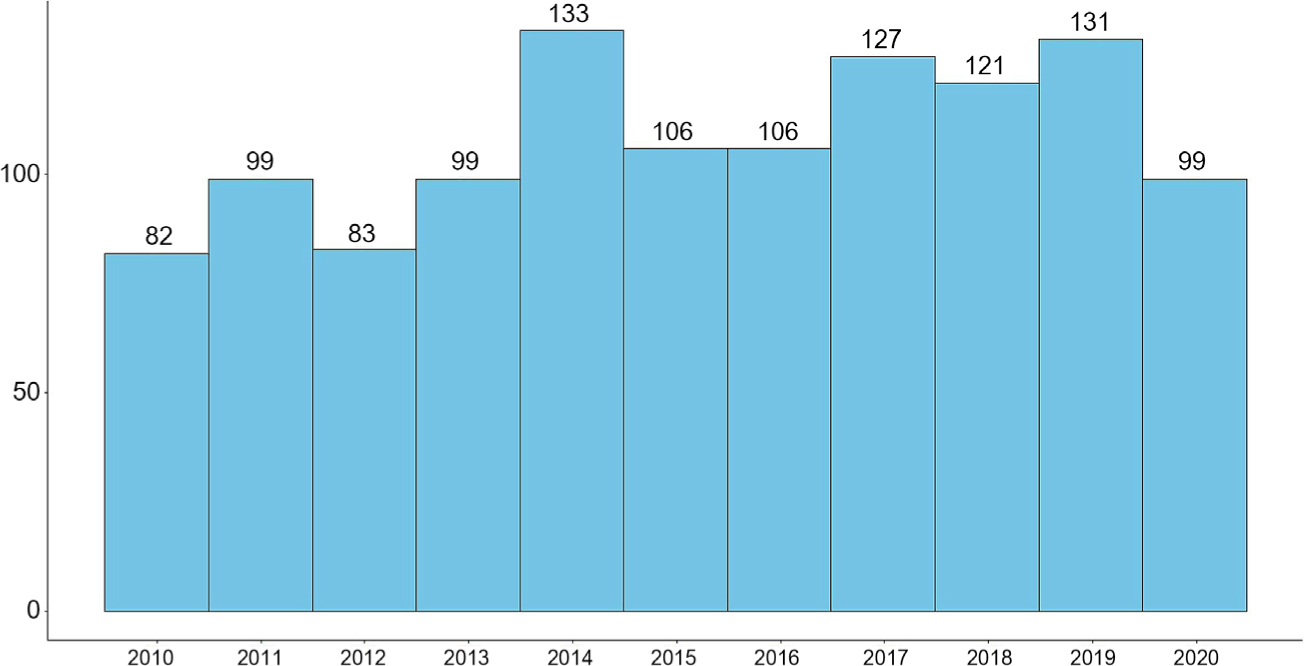
Annual cold wave days in Harbin from 2010 to 2020 with a maximum of 133 days and a minimum of 82 days
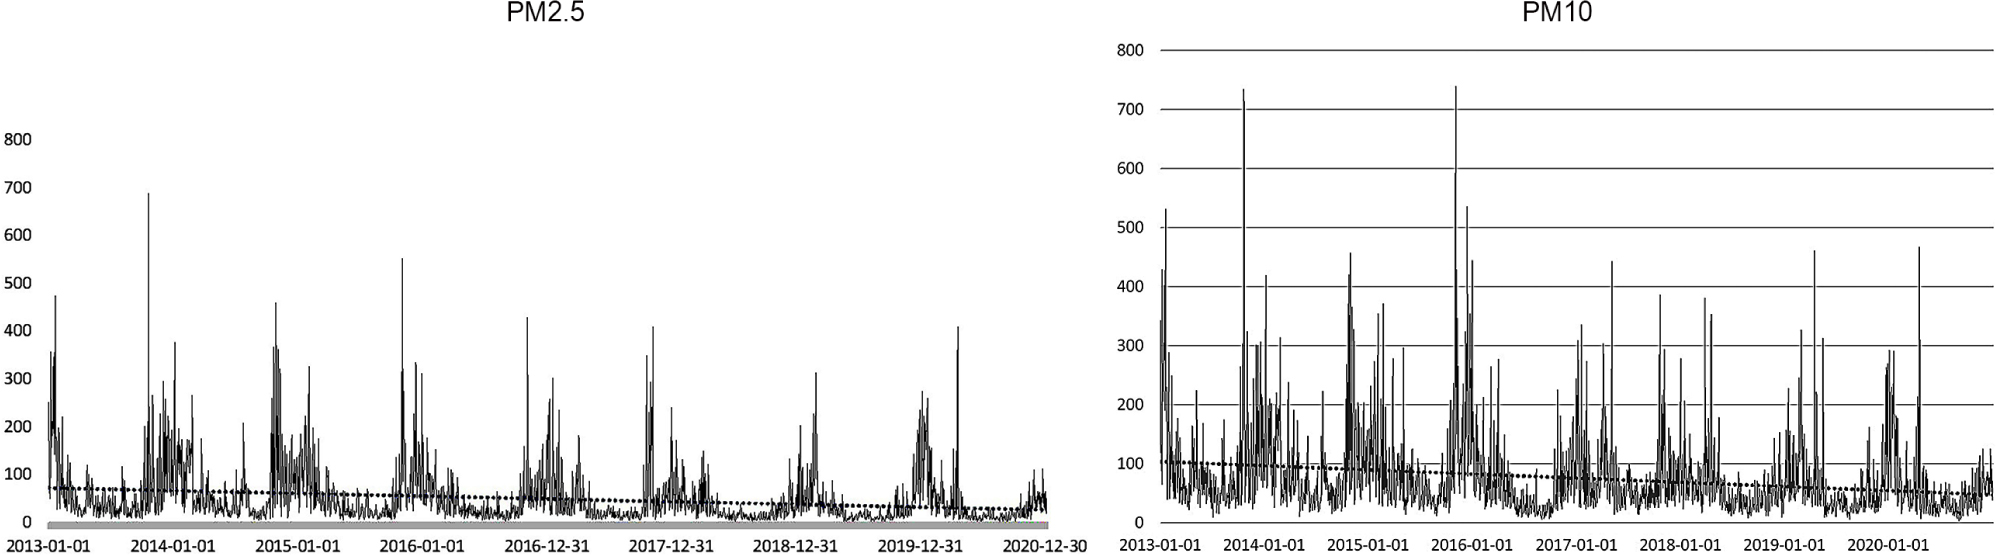
Changes of PM2.5 and PM10 concentrations in Harbin from 2013 to 2020. The overall trend was downward, and the concentration was higher in winter
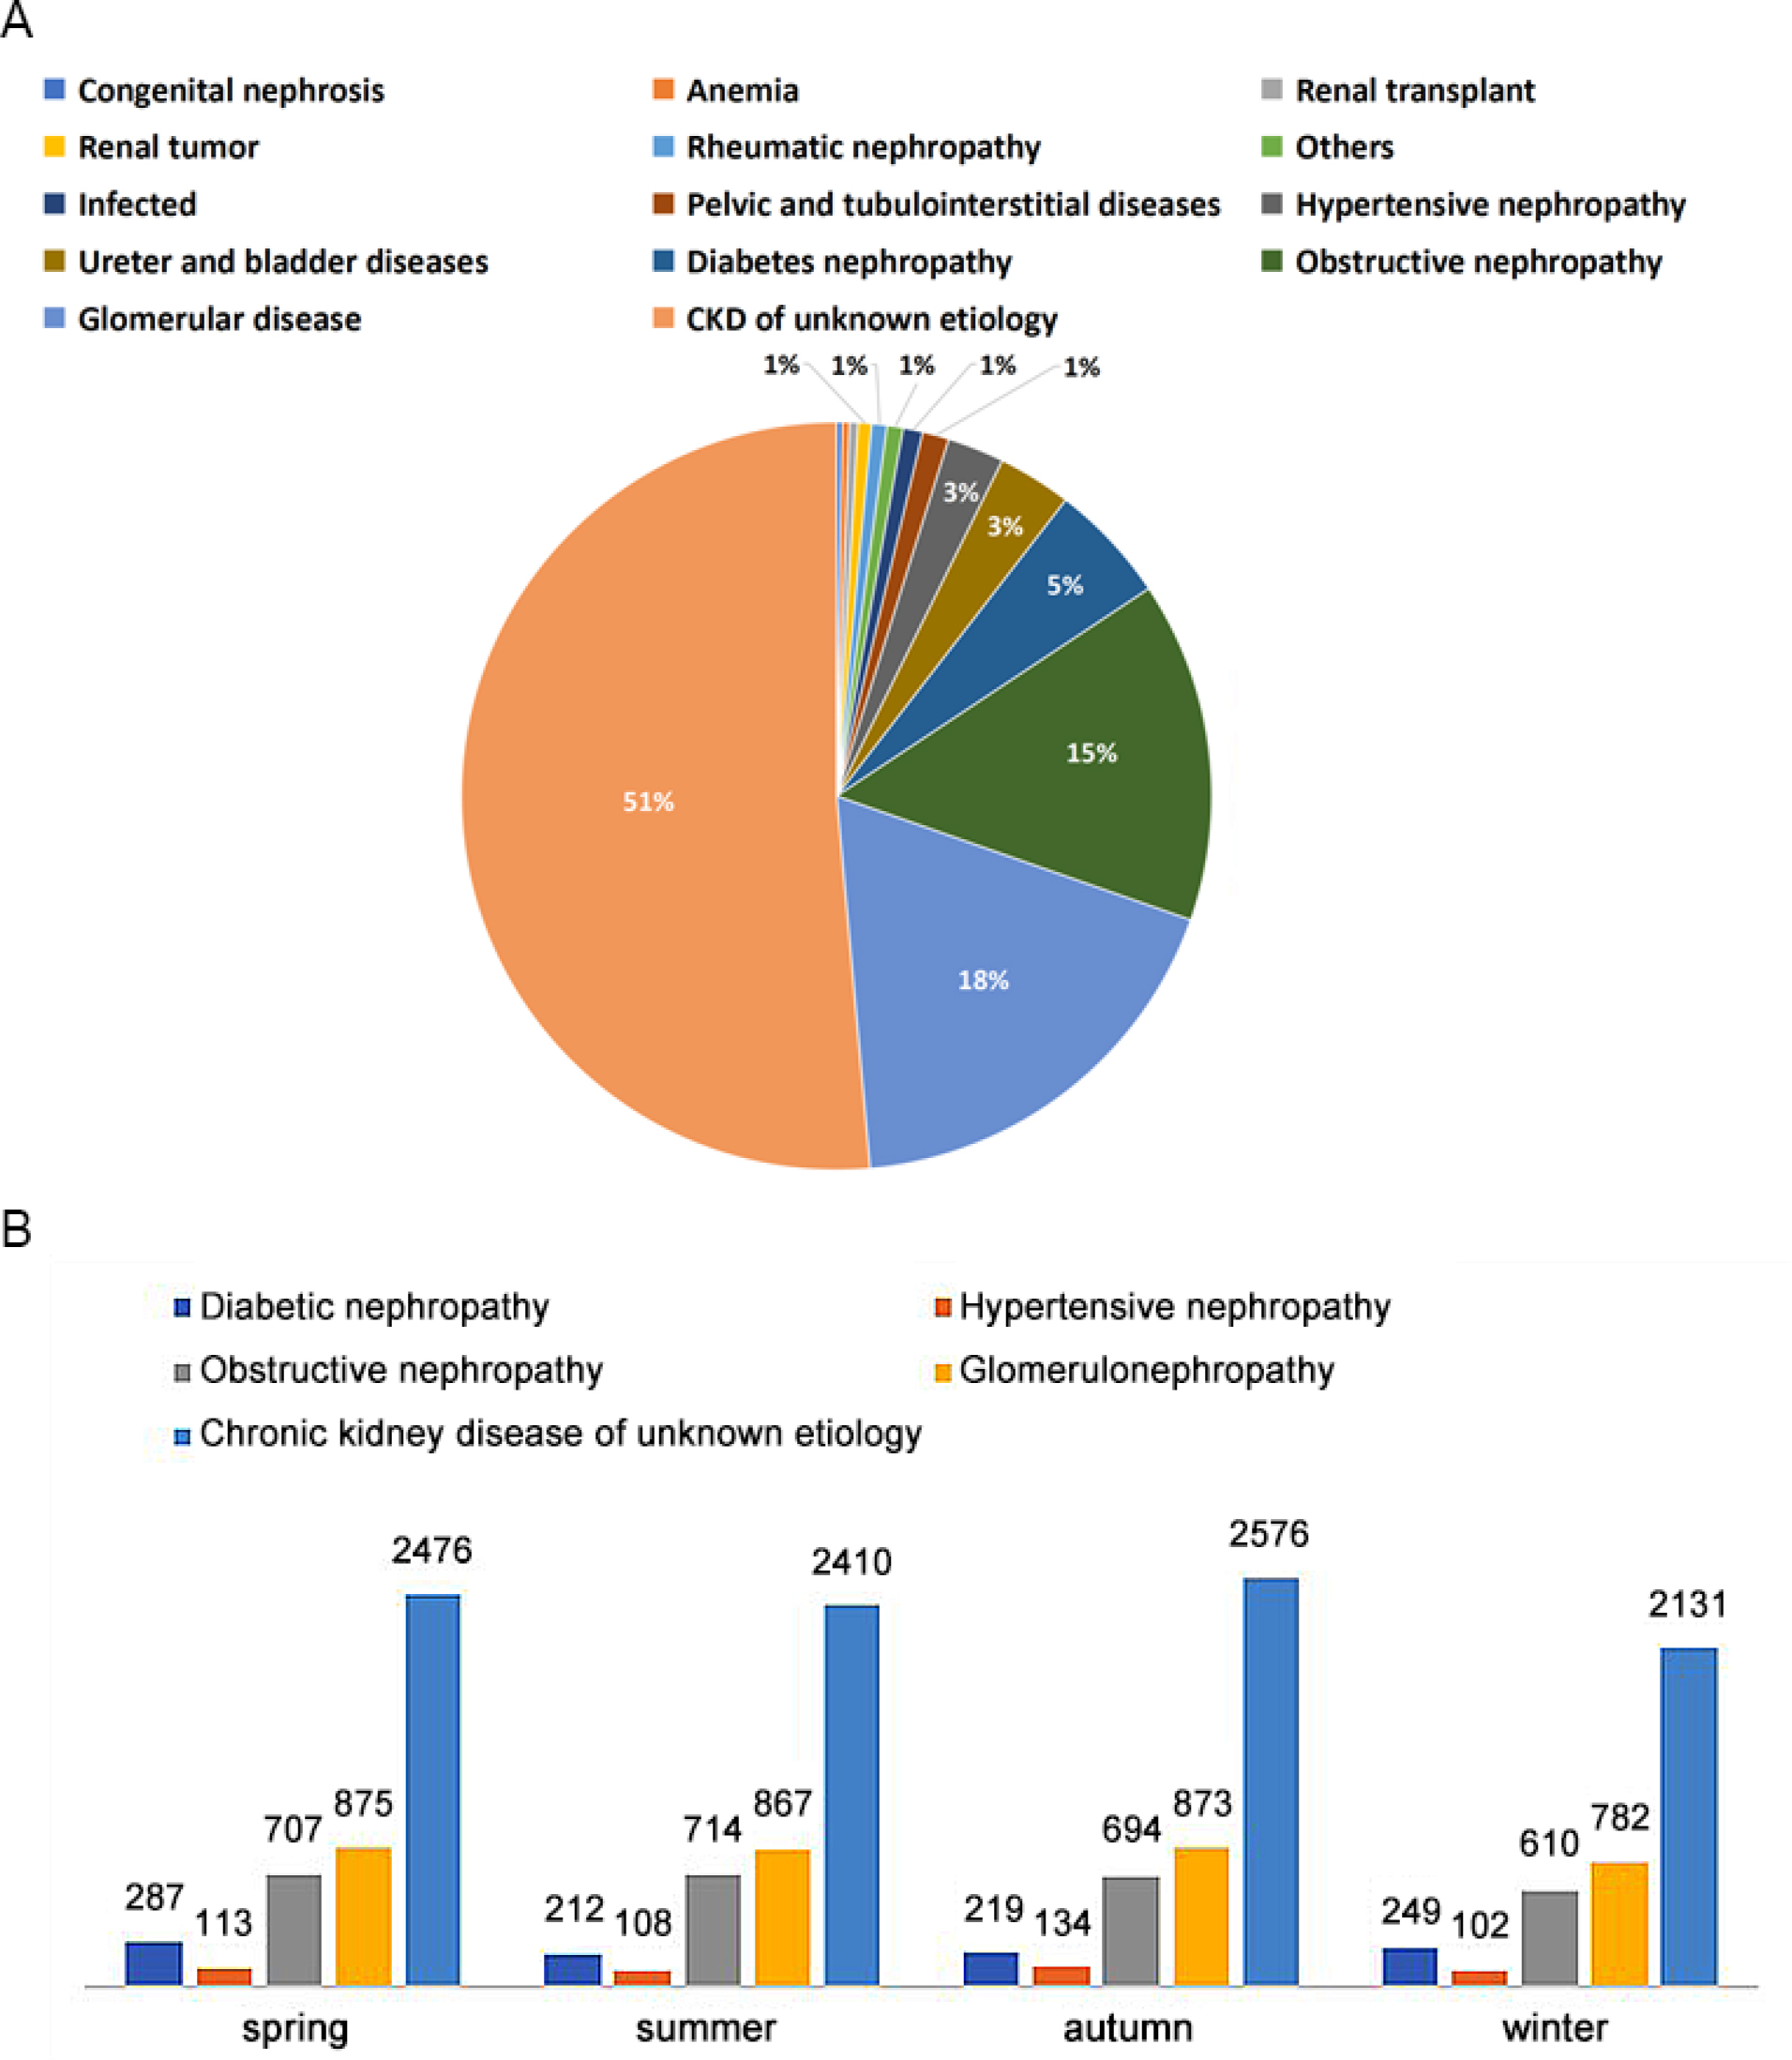
The number of patients with CKD hospitalized at the Second Hospital of Harbin Medical University was 18,655, with a male to female ratio of 1.27:1. The overall age distribution showed a parabolic shape, with 502 patients at the peak age of 62-63 years old, and the two rapid growth periods were 20 and 40 years old, respectively (Fig. 4). The top etiological diagnoses were chronic kidney disease with different CKD stages (no etiology indicated), glomerular nephropathy, obstructive nephropathy, diabetic nephropathy, and hypertensive nephropathy (Fig. 5). Over the first five years, the daily fluctuation of the number of patients admitted to CKD increased, and over the second five years, it showed an annual “M”-shaped changes (Fig. 6).
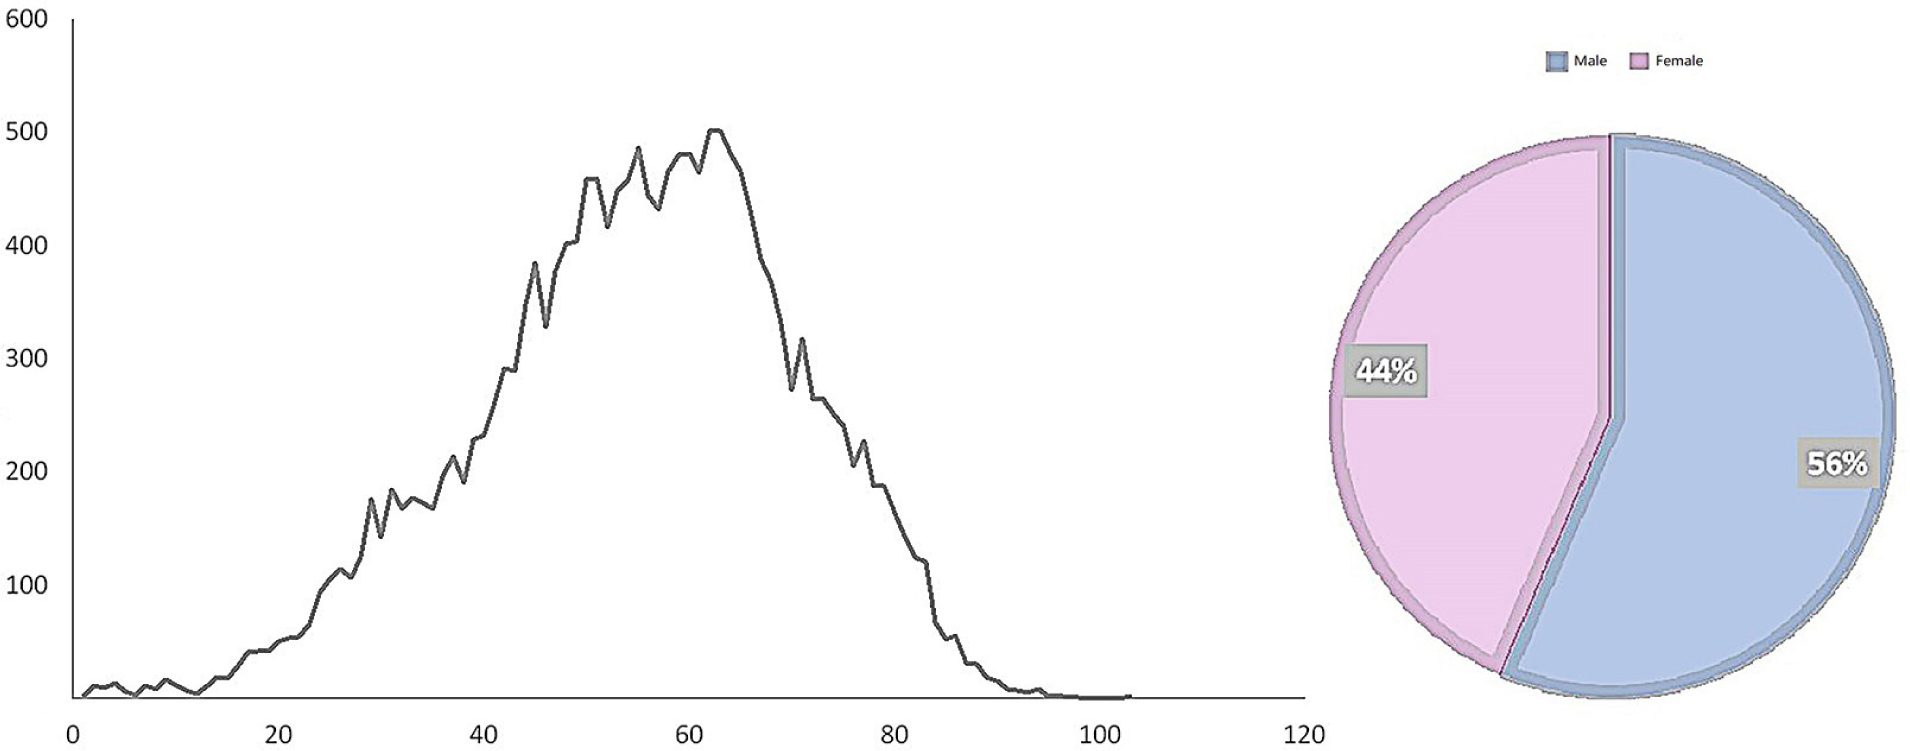
Composition of age and sex of chronic kidney disease (CKD) patients admitted to the Second Hospital of Harbin Medical University for ten years
The time distribution of patients with chronic kidney disease (CKD) admitted to the Second Hospital of Harbin Medical University in Harbin from 2010 to 2020
(A) The etiological diagnosis of CKD patients admitted to the Second Hospital of Medical University in Harbin. The top ranked etiological diagnosis in the past ten years: glomerular disease (18%), obstructive nephropathy (15%), diabetes nephropathy (5%), hypertensive nephropathy (3%), and chronic kidney disease (51%) with different CKD stages (no cause specified); (B) Seasonal changes of etiological diagnosis of patients with chronic kidney disease admitted to the Second Hospital of Medical University in Harbin. Diabetes nephropathy and glomerular disease occur most frequently in spring, obstructive nephropathy in summer, and hypertensive nephropathy and chronic kidney disease in autumn
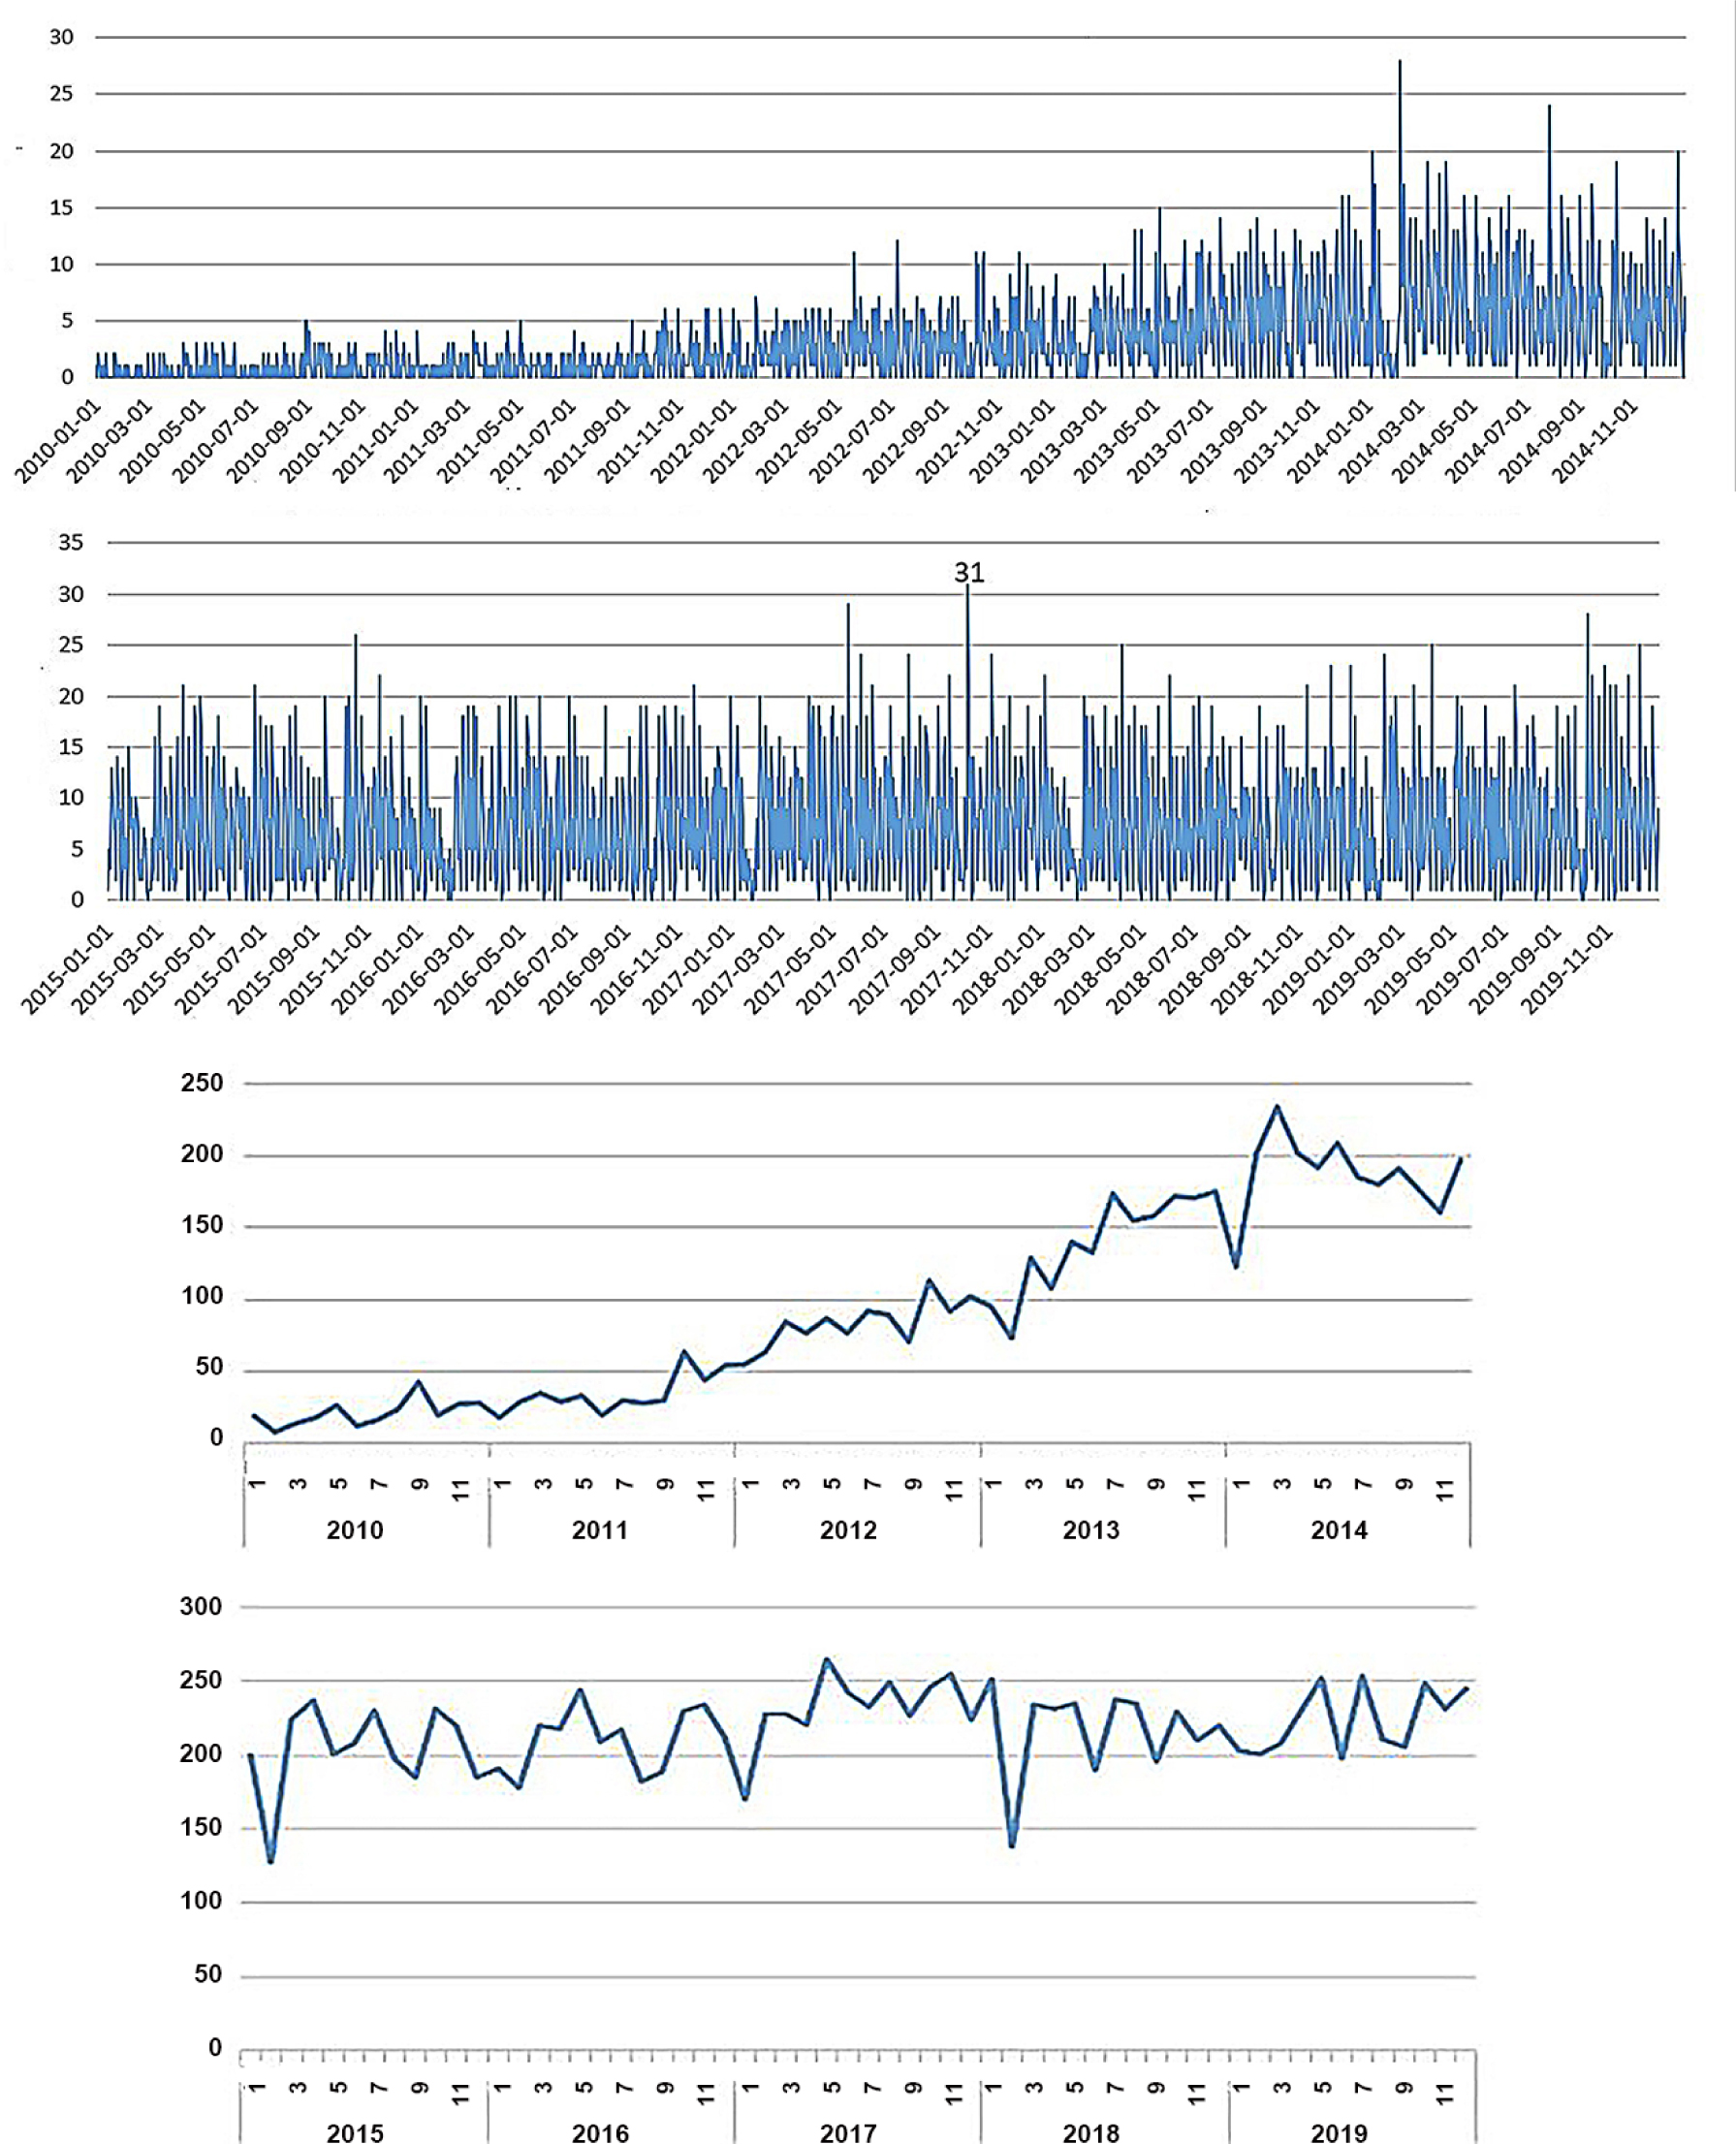
Stacking chart of daily and monthly changes of the number of chronic kidney disease (CKD) patients admitted to the Second Hospital of Harbin Medical University in Harbin. The maximum number of inpatients was 31, dated on 09 October 2017, followed by 28 on 08 October 2019. This pattern might be related to outpatient service after the National Day holiday. The number of people has fluctuated and increased in the first five years and remained relatively stable at a high level in the last five years, which is presumably related to the adjustment of local reimbursement policies. The number of hospital admissions each year basically presents a “M” type change with the month, and the rising trend occurs in winter and spring seasons (February to April) and in autumn and winter seasons (October to December), both of which belong to the seasonal change period
The lower temperature (< -8°C) has a greater impact on admission to CKD (RR is higher). On the 4th day of lag, when the temperature dropped down to -29.4°C, the risk became higher, which was 1.18 (95% CI: [1.06-1.31]); on the contrary, when the temperature arose to 30.8°C, the contribution of temperature to RR became insignificant after 20 days of lag. The risk of hypothermia persisted for up to 16 days, high temperature had an impact on admission on day 17, and the risk was greatest on day 20 with an RR of 1.01(95% CI: [0.97-1.04]) (Fig. 7). In our study on the effect of temperature on hospital admissions in different subgroups, we calculated the risk in 0, 10, 20, and 30 days of lag at very low average daily temperature. Seniors (≥ 65 years) were immediately affected by low temperatures, with the elder women more negatively affected by low temperatures as a whole at a lag of about 10 days. Obstructive nephropathy was essentially unaffected by hypothermia during the first 20 days of hysteresis, but was significantly increased around day 30. Hospitalized patients were mainly diagnosed with diabetic nephropathy, hypertensive nephropathy, glomerulopathy, and CKD for which the etiology is unknown. The effect value of hypertensive nephropathy was relatively high (1.28 [1.01-1.62]) when the lag was about 20 days and reached the highest (1.68 [1.10-2.56]) when the lag was 30 days). Diabetic kidney disease revealed an early reaction to hypothermia (1.13 [0.83-1.54]), which was not significant on day 30 (Table 1).
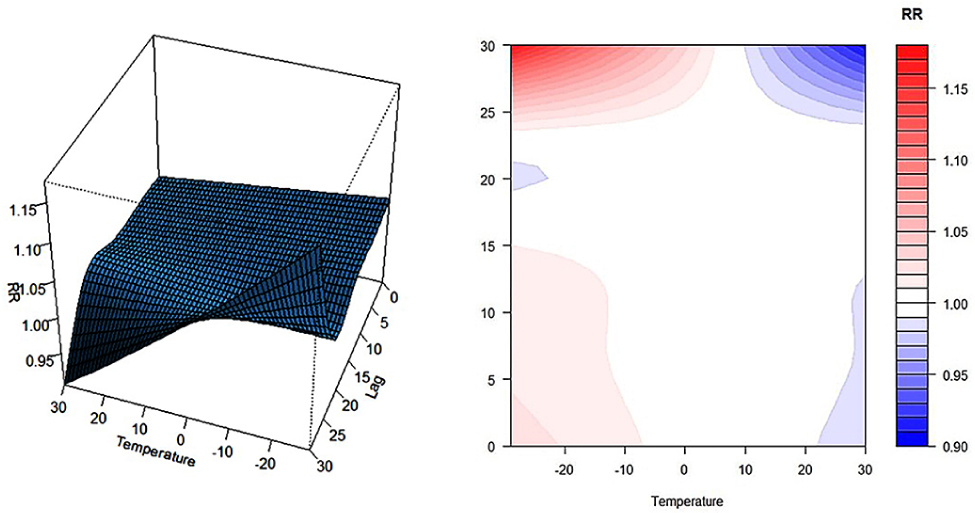
Impact of ten-year daily average temperature and hysteresis on chronic kidney disease (CKD) in Harbin
Effect value of extremely low daily average temperature on the number of inpatients with different lag days in each subgroup
| Number | -29.4°C RR (95%CI) | ||||
|---|---|---|---|---|---|
| lag0 | lag10 | lag20 | lag30 | ||
| Gender | |||||
| Male | 10 531 | 1.05[0.92-1.19] | 1.00[0.93-1.07] | 0.97[0.91-1.04] | 1.19[1.05-1.34] |
| Female | 8 124 | 1.00[0.88-1.14] | 1.04[0.97-1.12] | 1.01[0.94-1.08] | 1.17[1.02-1.33] |
| Age | |||||
| < 65 | 13 396 | 1.02[0.90-1.15] | 1.00[0.94-1.07] | 0.96[0.90-1.02] | 1.21[1.08-1.36] |
| ≥ 65 | 5 259 | 1.05[0.90-1.22] | 1.06[0.97-1.15] | 1.06[0.98-1.15] | 1.09[0.90-1.27] |
| Main diagnosis of etiology | |||||
| Obstructive nephropathy | 2 725 | 1.02[0.83-1.26] | 0.97[0.26-1.09] | 0.89[0.80-1.00] | 1.43[1.17-1.76] |
| Diabetes nephropathy | 966 | 1.13[0.83-1.54] | 1.09[0.92-1.30] | 0.97[0.83-1.14] | 0.92[0.69-1.22] |
| Hypertension nephropathy | 457 | 1.01[0.65-1.55] | 1.28[1.01-1.62] | 1.09[0.87-1.36] | 1.68[1.10-2.56] |
| Glomerular nephropathy | 3 397 | 1.07[0.89-1.28] | 1.03[0.93-1.14] | 0.99[0.90-1.09] | 1.26[1.05-1.50] |
| CKD of unknown etiology | 9 593 | 1.0[0.91-1.16] | 1.02[0.96-1.10] | 1.01[0.95-1.08] | 1.12[0.99-1.25] |
The influence of daily temperature difference of 2°C-10°C on hospital admission (Fig. 8) lasted from 1th day at the beginning and from the 11th day to the 19th day, and reached a high value of 1.02 [1.00-1.03] at the temperature difference of 2°C and a lag of 15 days. When the temperature difference of 11°C-25°C was delayed for 2-10 days, it had a significant effect on the admission, of which the temperature difference of 25°C generated the most harmful outcomes on the 6th day of lag, being 1.02 [0.98-1.06]. The higher daily average wind speed (Fig. 9) contributed more to the admission of CKD. The high wind speed interval (4-8 m/s) was positively correlated with the admission of CKD at 0-1 days of lag, while the low wind speed interval (0-2 m/s) was positively correlated with the admission of CKD at 2-6 days of lag. With a wind speed of 9.9m/s and the typical lag day-4, the relative risk was minimum (0.944 [0.873-1.021]), and the RR was maximum (1.145 [1.017-1.289]) at the 15th day. A wind speed of 2-4 m/s had no significant effect on the disease. In the graph depicting the relationship between baric pressure and admission of CKD (Fig. 10), the low-pressure interval (980.5-1005.0 hPa) and high-pressure interval (1020.0-1041.9 hPa) of baric pressure had only a lag effect on admission of CKD. The high-pressure interval affected admission of CKD on the 1st to 5th day lag and had a relatively significant effect on admission of CKD on the 3rd day lag (1.033 [0.91-1.01]). And the low-pressure region showed an impact on the disease at 6-9 days; specifically, it had the most significant effect on the disease when the lag was 15 days, at which time the baric pressure was 980.5hPa, RR = 1.13 [1.04-1.24]. The influences of partial high-pressure and partial low-pressure on disease were almost balanced. In general, when the ambient pressure is about 1010 kpa, the influence on CKD was small.
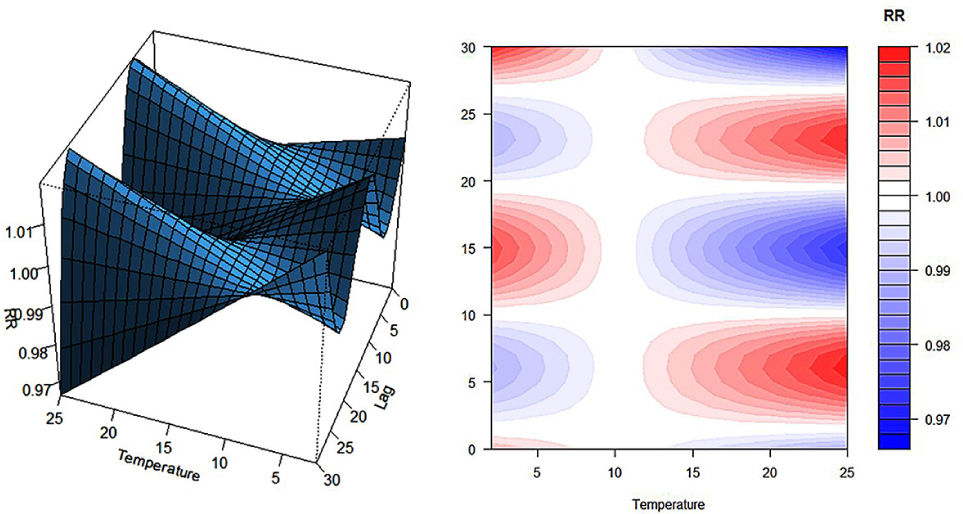
Impact of ten-year daily temperature difference and hysteresis on chronic kidney disease (CKD) in Harbin
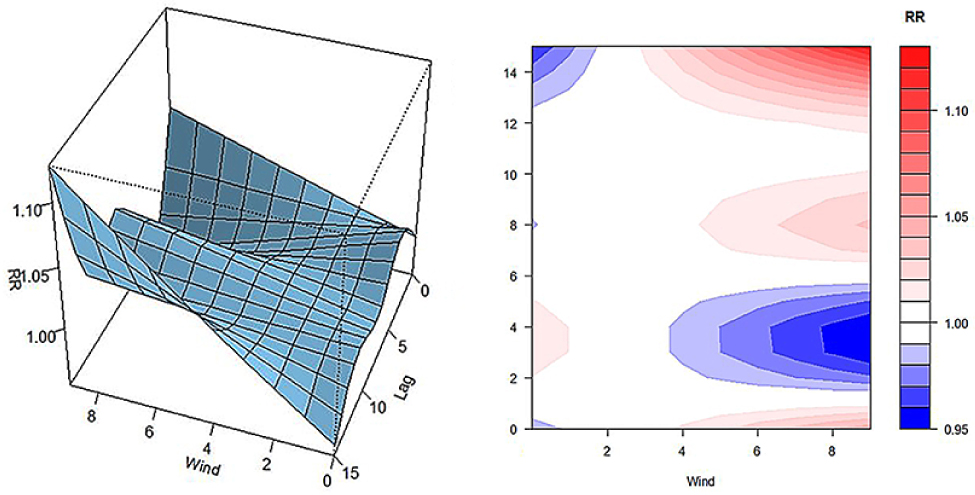
Impact of 10-year daily wind speed and lag on chronic kidney disease (CKD) in Harbin
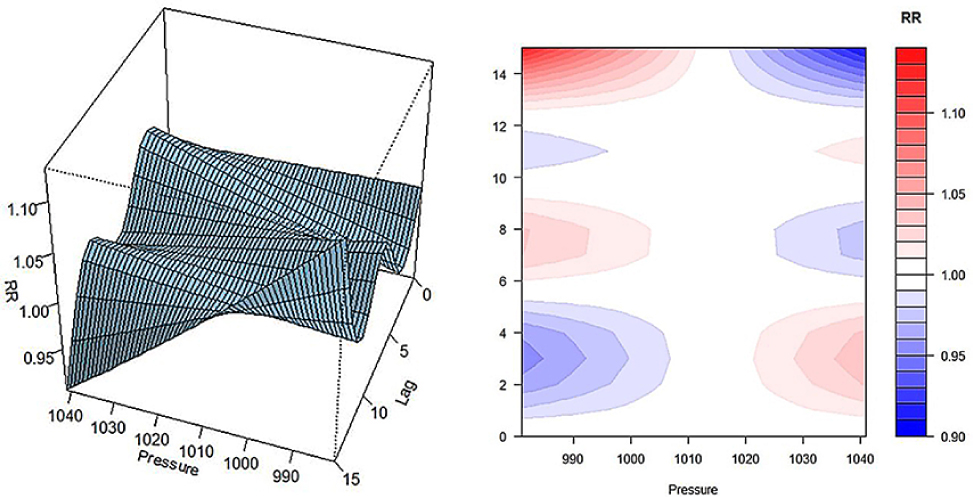
Impact of ten-year daily pressure and hysteresis on chronic kidney disease (CKD) in Harbin
The air quality standard in China is presently in the first stage of the WHO air quality standard, namely 35 µg/m3, but in Harbin, it mostly it mostly fails to meet the standard, especially in winter (From 2013 to 2019, the average PM2.5 in Harbin was about 91.42 µg/m3). We found in this study (Fig. 11) that PM2.5 had no effect on CKD within the limit range on the 0-1 day lag and RR began to increase gradually when PM2.5 > 40 µg/m3 on the 1 day lag. The high concentration range (300-600 µg/m3) from day 2 to day 5 of lag was positively correlated with disease onset, and RR reached the maximum value of 1.06 [0.89-1.27] when PM2.5 peaked at 688 µg/m3 on day 3 of lag. On the typical lag 3-7, the contribution to risk was opposite, and RR decreased gradually after day 7. Further analysis of the effects of maximum and minimum concentrations on the disease showed that PM2.5 at a concentration of 2.69 µg/m3 had almost no impact on health, but when it was greater than 200 µg/m3, the contribution became significant at lag 2-5. PM2.5 comes from PM10, so the influence of fine particulate matter PM10 on CKD was also investigated in this study (Fig. 12). As illustrated in Fig. 12, the influences of PM2.5 and PM10 on CKD had a similar pattern. On the 3rd day of lag, RR reached its maximum value at the highest concentration, which was 1.03 [0.89-1.19].
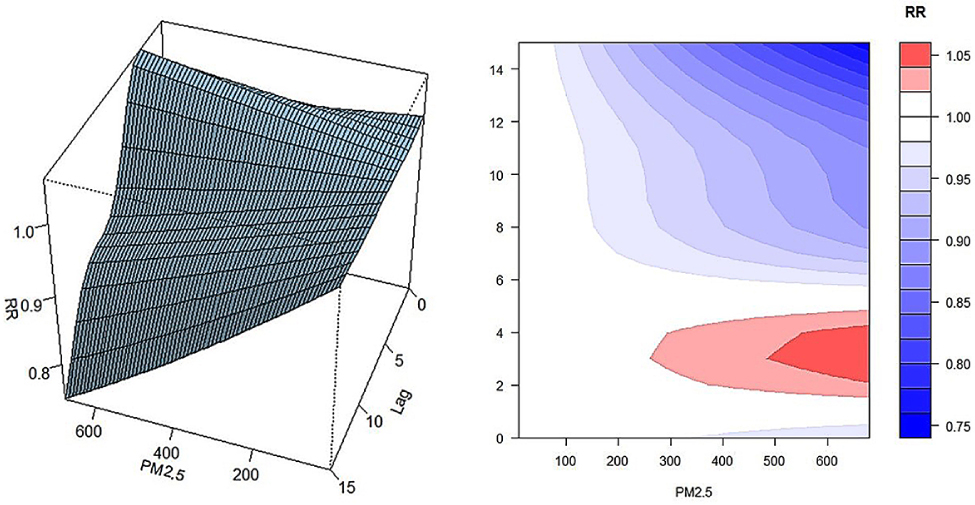
The impact of PM2.5 and lag on chronic kidney disease (CKD) in Harbin
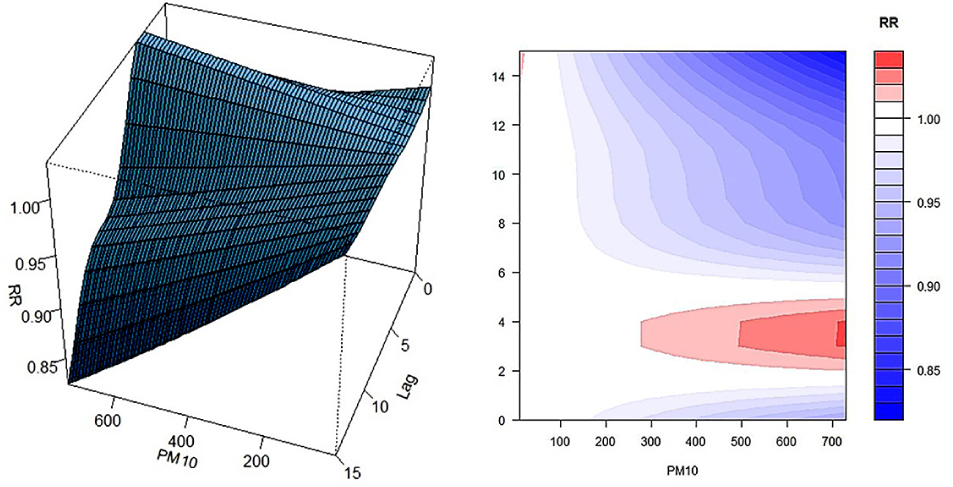
The impact of PM10 and lag on chronic kidney disease (CKD) in Harbin
4 Discussion
Chronic kidney disease (CKD) has a significant impact on global health[16]. Although the 2017 Global Burden of Disease study ranked it as the 16th leading cause of death worldwide, CKD increased the number of deaths at all ages by as much as 33.7% in a decade[17]. This may be the first study on the effects of climate and air pollution on the admission rate of CKD, especially in typical cold areas with heavy air pollution and large resident populations. The Second Affiliated Hospital of Harbin Medical University is a class 3A hospital with a large number of patients in northeast China. It has medical personnel with extensive experience in diagnosis and treatment and sophisticated equipment. A considerable proportion of CKD patients in Harbin are being treated in this hospital. In order to ensure the accuracy of the patient data and guarantee the authenticity of our study results, we strictly followed the inclusion and exclusion criteria. This study analyzed the law of meteorological and pollution data in Harbin and the relationship between meteorological factors and hospital admission.
When temperature remains above the warming threshold, climate change and pollution characteristic becomes critical and can well impose significant impacts on human health and the earth’s ecology[18]. Thus, vigilance and measures should be taken in the face of “global warming” in Harbin. However, this region is in cold wave for nearly 1/3 of the time every year, and it is therefore of great public significance to prevent the occurrence of cold wave related diseases.
The etiological components of hospitalization of CKD in Harbin are as follows: diabetic nephropathy and glomerular disease are more common in winter and spring, obstructive nephropathy is more common in summer, and hypertensive nephropathy and other chronic renal diseases are more common in summer and autumn. The causes may involve different pathologic mechanisms. (1) The incidence of diabetic nephropathy and glomerular diseases in Harbin is more frequent in winter and spring, which is consistent with the argument proposed by Wada et al., that the protein/ creatinine results of diabetic nephropathy patients in winter are higher[19]. Moreover, Schlesinger et al. also found that pathological changes in glomeruli during winter and spring lead to an increased incidence of lupus nephritis type V[20]. The causes for the increase in the number of hospital admissions may first be related to the decrease of residents’ activities and exposure to sunlight in cold season (decreased synthesis of active vitamin D3 or aggravated the progression of CKD[21]). Second, it is related to the increase of smoking and drinking during the Spring Festival and the excessive intake of high salt, high oil and high protein diet. (2) Hypertensive nephropathy and other CKDS occur more frequently in summer and autumn, which may be due to the changes of blood pressure caused by the transition from hot weather to cold weather[22]. Hypertension is one of the important risk factors for CKD. A low temperature can activate the RAS system and increase the heart rate and blood pressure, and blood pressure is negatively correlated with air temperature[23]. In addition, low temperature can also increase blood platelet, fibrinogen, blood cholesterol concentration, and blood viscosity[24] and subsequently affect the kidney blood vessels. (3) The high incidence of obstructive nephropathy in summer is consistent with the results reported in South Korea[25]. A study posited that the high incidence of urinary calculi was due to the concentration of urine in summer with high temperature[26], but the lag time of high temperature on calculi was shorter. However, surprisingly, this study found that low temperature was significantly associated with admission to hospital with obstructive nephropathy after 20 days of lag. Additionally, García-Arroyo et al. stated that obstructive nephropathy is more sensitive to heat than other causes of CKD because repeated heat stimulation may cause glomerular inflammatory stress and tubular damage[27].
In the gender composition of hospitalized patients with CKD in Harbin, the male-to-female ratio was 1.26:1, which could be explained from the following perspectives. First, according to the latest data from the Seventh National Census[28], the ratio of men to women is 111:100. Second, the smoking and drinking culture in cold regions is prevalent, most men have a bad habit of smoking and drinking. Finally, the incidence of male disease in Harbin was significantly higher than that in Guangzhou, Shanghai and other places, which reflects a hidden issue that men in Harbin pay less attention to CKD compared with first-tier cities. Thus, health education should be strengthened to improve the disease cognition level in Harbin. In addition, the overall age distribution of hospitalized patients shows a “parabolic shape” with ages peaked at 62-63 years old. In this demographic, the group enters the old age period, and it is highly desirable to enhance the lifestyle intervention and disease screening for the residents right after their retirement (55-65 years old). The gradual decrease in the number of hospital admissions after age 63 may be related to the decrease of the sample in this age group and the preference of patients in this age group to take conservative care at home. In addition, this study also found that 20 years old and 40 years old are two periods of rapid increase of diseases, and early improvement of health literacy and correction of bad living habits are the fundamental way to improve population health.
Here, we investigated the influence of meteorological factors on CKD in Harbin and found that different meteorological factors had different immediate and delayed effects on the results. (1) The average daily temperature, temperature difference, average daily pressure, average daily wind speed and daily pollution data in Harbin, but not humidity, were correlated with the admission to CKD (P < 0.005). (2) The effect of low temperature was instantaneous and lasted for 16 days. In the subgroup study on the effect of temperature on the admission to CKD, it was found that older males reacted sensitively to temperature, but older females responded strongly to temperature. The conclusion of the etiological diagnostic subgroup on the effect of temperature on disease supports the seasonal analysis of etiological diagnosis. (3) The negative effect of strong winds is not sustained, but lags far behind. The adverse effects of high pressure on the admission to CK were instantaneous, but the overall contribution was smaller than that of low pressure. Cold regions have high atmospheric pressure and high winter wind speed. According to the Gay-Lussac’s law, the lower the temperature is, the higher the density of gas molecules and atmospheric pressure are. Accordingly, the high air pressure and wind speed in winter in Harbin can also be attributed to the decrease of temperature. In addition, Jimenez-Conde also reported the correlation between reduced baric pressure and ischemic stroke and speculated that changes in atmospheric pressure could directly affect the vascular wall through certain mechanisms and cause endothelial injury by pro-inflammatory factors[29]. Intriguingly, a study related to meteorological medicine in COVID-19 documented that the persistent presence of virus particles in the air associated with low wind speed was conducive to the spread of novel coronavirus (SARS-CoV-2)[30]. Similarly, it can be inferred that low wind speed is also conducive to the spread of other virus particles. Some of the causes of CKD are associated with kidney injury by a single infection, promoting the admission to CKD at 2-4 days due to low wind speed. High wind speed is directly related to the decrease of urban road temperature and crowd activity, so strong wind also has an impact on CKD. A wind speed of 2-4 m/s and the atmospheric pressure of 1005-1020 hPa are the most appropriate condition for the prevention and treatment of CKD.
As the main air pollutants in Harbin, PM2.5 and PM10 are high in winter and spring and low in summer and autumn. PM2.5 and PM10 in cold regions mainly come from heating coal, motor fuel and industrial fuel. In 2019, PM2.5 caused an estimated 4.14 million deaths and 118 million disability-adjusted life years. To date, air pollution and disease risk have been a subject of intensive studies globally, but to our knowledge the present study is the only one on CKD containing lag days related to cold regions. Both PM2.5 and PM10 were found to be positively and non-linearly correlated with the admission to CKD with both reaching the highest concentration on the third day after the delay. Possible mechanisms of their influence on the results include the following. (1) Inflammatory mechanism: particles inhaled through the respiratory tract can cause inflammatory response and oxidative stress in the kidney, leading to damage of the kidney basement membrane and renal tubules[32]. (2) Vascular injury: short-term exposure to PM2.5 can decrease vascular velocity and increase vascular resistance in patients, thereby promoting RBC and PLT aggregation and contributing to thrombosis, renal atherosclerosis, renal tubule atrophy and interstitial fibrosis[33-34]. (3) Cell apoptosis: arsenic, cadmium and other substances in particulate matter play a key role in kidney injury via the PI3K-Akt/mTOR pathway[35-36]. In addition, since PM2.5 and PM10 are mixed substances, future studies are needed to uncover the relationship between their major components and the risk of CKD. The investigation found that 83 per cent of the Chinese population lives in areas where PM2.5 levels exceed China’s ambient air quality standards and 1.37 million premature deaths are ascribed to PM2.5[37]. A study conducted in Guangzhou found that PM2.5 has a greater impact on low temperature cardiovascular mortality[38]. As such, studying the relationship between population and the number of CKD hospitalizations in cold regions is of great importance. Although the air quality in Harbin has been controlled to a certain extent in recent years, the road to governance is still shouldering heavy responsibilities. It is imperative to develop a new clean, low-cost, environmentally friendly energy in the future.
This study has several advantages. First, most of the previous meteorological medical studies focused on hot spots or first-tier cities. This study is the first to analyze the influence of meteorological factors on the number of patients admitted to CKD in cold areas and also the first to analyze the influence of pollutant lag in cold areas. This is the first time that we are exploring the influence of different diagnostic subgroups of gender, age and etiology. Moreover, the Distributed Lag Nonlinear Model used in this study can effectively control variables and other effects, analyze the persistent and delayed effects of the risk of CKD entry, and draw useful conclusions, providing some novel information for disease warning and control. This study also has some shortcomings. Since the meteorological data in the study came from a single center to represent the exposure of residents in the whole region rather than individual exposure, information bias might be present. In addition, certain informational bias might also exist in the retrospective data of admitted patients. More importantly, due to the limitations of funds, region and time, local diet and living habits cannot be taken into comprehensive consideration in our statistics, and some crossover factors are uncontrollable. Broader and more rigorous studies covering more cities in cold regions and more influencing factors are required in order to have panoramic views and deeper understanding of the association between meteorological factors and the number of hospital admissions of CKD.
5 Conclusion
In summary, DLNM can be used to study how meteorological factors influence disease exposure. In the cold area like Harbin, different meteorological changes and air pollution have different immediate and delayed effects on CKD. Moisture does not clearly correlate with the increase in the number of patients admitted to CKD. The minimum cold threshold that increases the risk of admission to CKD is about -8°C, and the greater the daily temperature difference, the greater the risk is, while the wind speed of 2-4 m/s and the air pressure of 1005-1020 hPa have relatively little influence on the disease. PM2.5 and PM10 < 40 µg/m3 or after 7 days had little effect on the admission to CKD.
Author contribution
Wei X R contributed significantly to analyze and synthesize study data and prepare the initial draft. Wang Y C contributed to overseeing and directing the planning and execution of research activities. Jiang R was responsible for reviewing and revising the draft. Zhao G N and Li Y Y contributed to previse and arrangement the meteorology data. All authors read and approved the final manuscript.
Conflicts of interests
Wang Y C is an Editorial Board Member of the journal. The article was subjected to the journal’s standard procedures, with peer review handled independently of this member and his research groups.
References
[1] Campbell-Lendrum D, Prüss-Ustün A. Climate change, air pollution and noncommunicable diseases. Bull World Health Organ, 2019; 97(2): 160-161.10.2471/BLT.18.224295Search in Google Scholar PubMed PubMed Central
[2] Zhang L, Zhao M H, Zuo L, et al. China kidney disease network (CK-NET) 2016 annual data report. Kidney Int Suppl (2011), 2020; 10(2): e97-e185.10.1016/j.kisu.2020.09.001Search in Google Scholar PubMed PubMed Central
[3] Chen R S, Kang E S, Li-Zong W U, et al. Cold Regions in China. Cold Regions Sci Tech, 2006, 45(2): 95-102.10.1016/j.coldregions.2006.03.001Search in Google Scholar
[4] Wei X R, Wang Y C. Contemporary understanding of the risk factors for chronic kidney disease in cold area. FZM, 2022; 2(4): 204-213.10.2478/fzm-2022-0028Search in Google Scholar
[5] Marchant B, Ranjadayalan K, Stevenson R. Circadian and seasonal factors in the pathogenesis of acute myocardial infarction: the influence of environmental temperature. Heart, 1993; 69(5): 385-38710.1136/hrt.69.5.385Search in Google Scholar PubMed PubMed Central
[6] Patten S B, Williams J V, Lavorato D H, et al. Major depression prevalence increases with latitude in Canada. Can J Psychiatry, 2017; 62(1): 62-66.10.1177/0706743716673323Search in Google Scholar PubMed PubMed Central
[7] Falla M, Micarelli A, Hüfner K, et al. The effect of cold exposure on cognitive performance in healthy adults: a systematic review. Int J Environ Res Public Health, 2021; 18(18): 9725.10.3390/ijerph18189725Search in Google Scholar PubMed PubMed Central
[8] Liu J, Varghese B M, Hansen A, et al. Hot weather as a risk factor for kidney disease outcomes: A systematic review and meta-analysis of epidemiological evidence. Sci Total Environ, 2021; 801: 149806.10.1016/j.scitotenv.2021.149806Search in Google Scholar PubMed
[9] He L, Xue B, Wang B, et al. Impact of high, low, and non-optimum temperatures on chronic kidney disease in a changing climate, 1990-2019: A global analysis. Environ Res, 2022; 212(Pt A): 113172.10.1016/j.envres.2022.113172Search in Google Scholar PubMed PubMed Central
[10] Duan J W, Li Y L, Li S X, et al. Association of long-term ambient fine particulate matter (PM2.5) and incident CKD: a prospective cohort study in China. Am J Kidney Dis, 2022; 80(5): 638-647.10.1053/j.ajkd.2022.03.009Search in Google Scholar PubMed
[11] Armstrong B. Models for the relationship between ambient temperature and daily mortality. Epidemiology, 2006; 17(6): 624-631.10.1097/01.ede.0000239732.50999.8fSearch in Google Scholar PubMed
[12] Gasparrini A, Armstrong B, Kenward M G. Distributed lag non-linear models. Stat Med, 2010; 29(21): 2224-2234.10.1002/sim.3940Search in Google Scholar PubMed PubMed Central
[13] Gasparrini A, Armstrong B. Distributed lag non-linear models in R: the package dlnm. J Stat Softw, 2011; 43(8): 1-20.10.18637/jss.v043.i08Search in Google Scholar
[14] Chen T K, Knicely D H, Grams M E. Chronic kidney disease diagnosis and management: a review. JAMA, 2019; 322(13): 1294-1304.10.1001/jama.2019.14745Search in Google Scholar PubMed PubMed Central
[15] Cui L, Geng X, Ding T, et al. Impact of ambient temperature on hospital admissions for cardiovascular disease in Hefei City, China. Int J Biometeorol, 2019; 63(6): 723-734.10.1007/s00484-019-01687-0Search in Google Scholar PubMed
[16] Eckardt K, Coresh J, Devuyst O, et al. Evolving importance of kidney disease: from subspecialty to global health burden. Lancet, 2013; 382: 158-16910.1016/S0140-6736(13)60439-0Search in Google Scholar PubMed
[17] GBD 2017 Causes of Death Collaborators. Global, regional, and national age-sex-specific mortality for 282 causes of death in 195 countries and territories, 1980-2017: A systematic analysis for the global burden of disease study 2017. Lancet, 2018; 392: 1736-178810.1016/S0140-6736(18)32203-7Search in Google Scholar PubMed PubMed Central
[18] Armstrong McKay D I, Staal A, Abrams J F, et al. Exceeding 1.5°C global warming could trigger multiple climate tipping points. Science, 2022; 377(6611): eabn7950.10.1126/science.abn7950Search in Google Scholar PubMed
[19] Wada Y, Hamamoto Y, Ikeda H, et al. Seasonal variations of urinary albumin creatinine ratio in Japanese subjects with Type 2 diabetes and early nephropathy. Diabet Med, 2012; 29(4): 506-508.10.1111/j.1464-5491.2011.03472.xSearch in Google Scholar PubMed
[20] Schlesinger N, Schlesinger M, Seshan S V. Seasonal variation of lupus nephritis: high prevalence of class V lupus nephritis during the winter and spring. J Rheumatol, 2005; 32(6): 1053-1057.Search in Google Scholar
[21] Krummel T, Ingwiller M, Keller N, et al. Effects of high- vs low-dose native vitamin D on albuminuria and the renin-angiotensin-aldosterone system: a randomized pilot study. Int Urol Nephrol, 2022; 54(4): 895-905.10.1007/s11255-021-02950-3Search in Google Scholar PubMed
[22] Han Y, Du J, Wang J, et al. Cold Pressor Test in Primary Hypertension: A Cross-Sectional Study. Front Cardiovasc Med. 2022; 9: 860322.10.3389/fcvm.2022.860322Search in Google Scholar PubMed PubMed Central
[23] Goel H, Shah K, Kumar A, et al. Temperature, cardiovascular mortality, and the role of hypertension and renin-angiotensin-aldosterone axis in seasonal adversity: a narrative review. J Hum Hypertens, 2022; 36(12): 1035-1047.10.1038/s41371-022-00707-8Search in Google Scholar PubMed
[24] Chen Z, Liu P, Xia X, et al. The underlying mechanisms of cold exposure-induced ischemic stroke. Sci Total Environ, 2022; 834: 155514.10.1016/j.scitotenv.2022.155514Search in Google Scholar PubMed
[25] Lee S, Kim M S, Kim J H, et al. Daily Mean Temperature Affects Urolithiasis Presentation in Seoul: a Time-series Analysis. J Korean Med Sci, 2016; 31(5): 750-756.10.3346/jkms.2016.31.5.750Search in Google Scholar PubMed PubMed Central
[26] Vicedo-Cabrera A M, Goldfarb D S, Kopp RE, et al. Sex differences in the temperature dependence of kidney stone presentations: a population-based aggregated case-crossover study. Urolithiasis, 2020; 48(1): 37-46.10.1007/s00240-019-01129-xSearch in Google Scholar PubMed PubMed Central
[27] García-Arroyo F E, Cristóbal M, Arellano-Buendía A S, et al. Rehydration with soft drink-like beverages exacerbates dehydration and worsens dehydration-associated renal injury. Am J Physiol Regul Integr Comp Physiol, 2016; 311(1): R57-R65.10.1152/ajpregu.00354.2015Search in Google Scholar PubMed PubMed Central
[28] Zhang Y, Zou B, Zhang H, et al. Empirical Research on Male Preference in China: A Result of Gender Imbalance in the Seventh Population Census. Int J Environ Res Public Health, 2022; 19(11): 6482.10.3390/ijerph19116482Search in Google Scholar PubMed PubMed Central
[29] Jimenez-Conde J, Ois A, Gomis M, et al. Weather as a trigger of stroke. Daily meteorological factors and incidence of stroke subtypes. Cerebrovasc Dis, 2008; 26(4): 348-54.10.1159/000151637Search in Google Scholar PubMed
[30] Coccia M. How do low wind speeds and high levels of air pollution support the spread of COVID-19? Atmos Pollut Res, 2021; 12(1): 437-445.10.1016/j.apr.2020.10.002Search in Google Scholar PubMed PubMed Central
[31] Sang S, Chu C, Zhang T, et al. The global burden of disease attributable to ambient fine particulate matter in 204 countries and territories, 1990-2019: A systematic analysis of the Global Burden of Disease Study 2019. Ecotoxicol Environ Saf, 2022; 238: 113588.10.1016/j.ecoenv.2022.113588Search in Google Scholar PubMed
[32] He M, Ichinose T, Ito T, et al. Investigation of inflammation inducing substances in PM2.5 particles by an elimination method using thermal decomposition. Environ Toxicol, 2019; 34: 1137-114810.1002/tox.22816Search in Google Scholar PubMed
[33] Liang S, Zhao T, Hu H, et al. Repeat dose exposure of PM2.5 triggers the disseminated intravascular coagulation (DIC) in SD rats. Sci Total Environ, 2019; 663: 245-253.10.1016/j.scitotenv.2019.01.346Search in Google Scholar PubMed PubMed Central
[34] Nemmar A, Al-Salam S, Zia S, et al. Diesel exhaust particles in the lung aggravate experimental acute renal failure. Toxicol Sci, 2010; 113: 267-277.10.1093/toxsci/kfp222Search in Google Scholar PubMed
[35] Ji P Y, Li Z Y, Wang H, et al. Arsenic and sulfur dioxide co-exposure induce renal injury via activation of the NF-κB and caspase signaling pathway. Chemosphere, 2019; 224: 280-288.10.1016/j.chemosphere.2019.02.111Search in Google Scholar PubMed
[36] Kuang X. A study on the key role of cadmium accumulation induced by PM2.5 exposure in renal injury. ISEE Conference Abstracts, 2018; 2018(1).10.1289/isesisee.2018.P02.1580Search in Google Scholar
[37] Liu J, Han Y, Tang X, et al. Estimating adult mortality attributable to PM2.5 exposure in China with assimilated PM2.5 concentrations based on a ground monitoring network. Sci Total Environ, 2016; 568: 1253-1262.10.1016/j.scitotenv.2016.05.165Search in Google Scholar PubMed
[38] Chen S, Dong H, Li M, et al. Interactive effects between temperature and PM2.5 on mortality: a study of varying coefficient distributed lag model-Guangzhou, Guangdong Province, China, 2013-2020. China CDC Wkly, 2022; 4(26): 570-576.10.46234/ccdcw2022.124Search in Google Scholar PubMed PubMed Central
© 2023 Xinrui Wei et al., published by Sciendo
This work is licensed under the Creative Commons Attribution-NonCommercial-NoDerivatives 4.0 International License.
Articles in the same Issue
- The effects of cold region meteorology and specific environment on the number of hospital admissions for chronic kidney disease: An investigate with a distributed lag nonlinear model
- Effects of cold climate on growth and development
- Multiple inducible thermogenic mechanisms in the development of cold acclimatization
- Present situation of rational drug use in plateau area
- Silicon dioxide nanoparticles inhibit the effects of cold exposure on metabolism and inflammatory responses in brown adipocytes
- Hydroxychloroquine induces long QT syndrome by blocking hERG channel
- Cold exposure alters proteomic profiles of the hypothalamus and pituitary in female rats
- Advances in the application of cryotherapy to the treatment of breast cancer