Anthracene-d- and l-phenylalanine derivatives: synthesis, dual-state emission, mechanochromic luminescence, chiroptical property and enantioselective recognition of free amino acids
-
Qixiang Yang
 ,
Jiao Jiao
and
Yong Nie
,
Jiao Jiao
and
Yong Nie

Abstract
Anthracene-d- and l-phenylalanine compounds (d-1, l-1) were obtained in high yields by the condensation reactions of 9-anthraldehyde with d- and l-phenylalanine and reduction with sodium borohydride. Both compounds d-1 and l-1 show luminescence in solution and solid states, exhibiting dual-state emission property. Solid samples of d-1 and l-1 exhibit mechanochromic luminescence enhancement with grinding. In respect of chiroptical property, d-1 and l-1 display mirror-image circular dichroism spectra in solution, and solid samples in KBr pellets exhibit circularly polarized luminescence with a dissymmetry factor of −1.4 × 10⁻⁴/6.0 × 10−4, respectively. The two compounds can differentiate enantiomers of free amino acids such as phenylalanine, lysine, glutamic acid and folic acid, in aqueous phase.
1 Introduction
Chiral luminescent materials have received extensive attention in recent years and have great application prospects in 3D display, information storage and processing, and fluorescent probes. 1 , 2 , 3 , 4 , 5 , 6 Chiral luminescent materials can be excited to directly emit left- or right-handed circularly polarized light, a phenomenon known as circularly polarized luminescence (CPL). 7 Circularly polarized luminescent materials have two most important parameters which are the luminescence quantum yield (QY) and the luminescence dissymmetry factor (g lum) and the value of the latter is between −2 and +2. The currently reported organic small molecules usually have higher luminescence quantum yields but smaller luminescence dissymmetry factor. 8 At present, the luminescence dissymmetry factor of organic small molecules is generally in the range of 10−5 to 10−2, which limits the development and application of organic small molecules in CPL-active materials. 9 , 10
Meanwhile, fluorescence detection of chiral substances is one of the hotspots of current research, 11 , 12 , 13 , 14 chiral molecules with different configurations have similar chemical and physical properties, but may have different biological effects, 15 thus the identification of chiral substances is of great importance. 16 Traditional chiral detection methods mainly include liquid chromatography, 17 nuclear magnetic resonance, 18 single-crystal X-ray diffraction 19 and mass spectrometry, 20 which are complicated, time-consuming and expensive, and have certain limitations. The detection and analysis of chiral substances (e.g. amino acids) using fluorescence spectroscopy can overcome the above shortcomings and facilitate the detection of chiral substances. 21 , 22 , 23 , 24
Traditional organic luminescent materials generally emit light in solution, while in the aggregation state or solid state, the luminescence is greatly weakened or even quenched (Aggregation Caused Quenching (ACQ)), 25 which limits the applications of luminescent materials. 26 , 27 Tang et al. proposed the concept of Aggregation-Induced Emission (AIE) when studying the luminescent properties of polyphenylsilole. 28 The typical AIE compounds are not emissive in dilute solution, but the luminescence is enhanced in the aggregated state or solid state, thus the AIE materials extend the application range of luminescent materials. 29 , 30 , 31 In addition to these two luminescent systems, there also exists the phenomenon of Dual-State Emission (DSE) between AIE and ACQ, 32 and materials with DSE properties emit light both in solution and solid states, and further extends the range of applications of luminescent materials.
In recent years, the application of compounds with DSE properties has received much attention. 33 , 34 It has been found that most of the structures of DSE compounds have distorted molecular configurations and excited state intramolecular proton transfer character in donor-acceptor (D-A) systems. 35 , 36 It remains a challenge in DSE compounds with other types. 37 The synthesis of DSE compounds is generally complicated, especially the application of DSE organic compounds in chiral recognition has been relatively little studied. 9 Therefore, it is of importance to synthesize chiral DSE organic compounds by a simple method and study their luminescent properties and chiral recognition property.
There have been a number of studies on the chiral recognition of free amino acids as an important class of chiral molecules using AIE molecules, which need to continuously adjust the ratio of the solvents for different amino acids to produce the AIE phenomenon for the purpose of recognition, 38 which is a cumbersome process due to the wide variety of amino acids. With their advantages, DSE molecules usually do not need to adjust the specific solvent ratio in the detection of amino acids and their derivatives, which makes the detection process simpler and faster. At the same time, amino acids generally have good water solubility, and thus the detection of chiral amino acid enantiomers in the aqueous phase can eliminate the interference of soluble organic substances, 39 which further extends the detection mode of chiral recognition.
Phenylalanine is one of the essential amino acids, 40 , 41 which is characterized by its easy availability and stable chiral configuration and has been often introduced into molecules as a chiral group. 42 In this paper, we have synthesized the anthracene- d- and l-phenylalanine derivatives (d-1, l-1) by a simple method in high yields and investigated the luminescent properties under different conditions, as well as the chiral recognition of several free amino acids in aqueous phase. The results show that both compounds d-1 and l-1 have DSE properties, the solid has mechanochromic luminescence enhancement and CPL properties, and the solution holds potential for aqueous phase recognition of free amino acids.
2 Experimental section
2.1 Instruments and reagents
1H NMR and 13C NMR analyses were performed using a Bruker Avance III 600 MHz spectrometer. IR spectra were recorded in the range 450–4,000 cm−1 on a Perkin Elmer Tensor II spectrometer using KBr pellets. Mass spectra were measured on a Thermo Fisher Scientific LTQ FTICR-MS instrument. Melting points were measured with a SGW X-4 apparatus and were not corrected. Specific rotations were measured by a Rudolph Autopol VI polarimeter. UV/Vis spectra were recorded on a UV3600 Plus spectrometer. Emission spectra were measured on Edinburgh FLS1000 and FLS920 fluorimeters. Absolute fluorescence quantum yields were obtained using an integrating sphere. Circular dichroism spectra were measured using a Chirascan qCD spectrometer. Circularly polarized luminescence spectra were measured on a JASCO-300 spectrometer. X-ray diffraction patterns were recorded on a SmartlabSE X diffractometer. The morphology was studied by a Regulus 8100 Scanning Electron Microscope.
Reagents and solvents are commercially available and used without further purification: 9-Anthraldehyde, 97.23 % purity, d- and l-phenylalanine, analytically pure, Shanghai Haohong scientific Co.; d- and l-Lysine, d- and l-glutamic acid, analytically pure, Shanghai Chemilab Biotechnology Co.; folic acid, analytically pure, Shanghai Macklin Biochemical Co.; potassium hydroxide, analytically pure, Sinopharm Chemical Reagent Co.; anhydrous ethanol, anhydrous methanol, dichloromethane, dimethyl sulfoxide, tetrahydrofuran, all analytically pure, Fuyu Chemical; sodium borohydride, 99 % pure, Shanghai Aladdin Biochemical Technology Co.; concentrated hydrochloric acid (36 %–38 %), analytically pure, Yantai Yuandong Fine Chemicals Co.; potassium bromide, spectroscopic grade, Shandong Keyuan Biochemical Co.; dimethylsulfoxide-d 6, (D, 99.9 %) + 0.03 % (v/v) TMS, Cambridge Isotope Laboratories, Inc.
2.2 Synthesis of d-1 and l-1
2.2.1 Synthesis of (anthracen-9-ylmethyl)-d-phenylalanine (d-1)
d-phenylalanine (165.1 mg, 1 mmol) and KOH (56.1 mg, 1 mmol) were put in a flask containing anhydrous ethanol (15 mL) and heated (60 °C, oil bath) with stirring until completely dissolved, 9-anthraldehyde (206.2 mg, 1 mmol) was added to the solution while warm and the reaction mixture was stirred at room temperature for 24 h and a yellow flocculent precipitate was formed. To the mixture NaBH4 (189.2 mg, 5 mmol) was added and it was further stirred for 12 h, the yellow flocculent precipitate changed to light yellow. The solvents were removed under reduced pressure and water (30 mL) was added and the solution was adjusted to pH 2–3 with dilute hydrochloric acid. After filtration, the residue was washed with water and dichloromethane for several times, and dried in air to afford d-1 as a light yellow solid (327.6 mg, yield 92.2 %); m.p. 223.5–223.7 °C. – [α]D 25 = +35.07 (c = 0.03, CH3OH). – 1H NMR (600 MHz, DMSO‑d 6): δ = 8.61 (s, 1H), 8.33 (d, J = 8.3 Hz, 2H), 8.10 (d, J = 7.4 Hz, 2H), 7.55–7.51 (m, 4H), 7.28 (d, J = 4.3 Hz, 4H), 7.25–7.20 (m, 1H), 4.87–4.62 (m, 2H), 4.00 (s, 1H), 3.07–3.02 (m, 2H). – 13C NMR (151 MHz, DMSO‑d 6): δ = 130.98, 130.13, 129.21, 128.81, 128.14, 126.36, 126.14, 125.17, 124.50, 62.21, 43.47, 37.82. – IR (KBr, cm−1): ν = 3,392, 3,035, 1,604, 1,454, 1,367, 1,038, 742, 521. – HRMS ((+)-ESI): m/z = 356.1645 (calcd. 356.1645 for C24H22O2N, [M+H]+).
2.2.2 Synthesis of (anthracen-9-ylmethyl)-l-phenylalanine (l-1)
l-1 was synthesized by a similar method to that described for d-1. l-phenylalanine (165.3 mg, 1 mmol), KOH (56.3 mg, 1 mmol), 9-anthraldehyde (205.4 mg, 1 mmol), NaBH4 (188.7 mg, 5 mmol), and the other liquids were used in the same amount to afford l-1 as a light yellow solid (322.5 mg, yield 90.8 %); m.p. 232.4–232.9 °C (lit. 226 °C, 43 218–220 °C 44 ). – [α]D 25 = −45.09 (c = 0.03, CH3OH). – 1H NMR (600 MHz, DMSO‑d 6): δ = 8.59 (s, 1H), 8.31 (s, 2H), 8.09 (d, J = 6 Hz, 2H), 7.58–7.45 (m, 4H), 7.27 (d, J = 3.6 Hz, 4H), 7.24–7.19 (m, 1H), 4.72–4.60 (m, 2H), 3.90 (s, 1H), 3.05–2.93 (m, 2H). – 13C NMR (151 MHz, DMSO‑d 6): δ = 130.97, 130.24, 129.23, 128.85, 128.19, 126.48, 126.26, 125.22, 124.50, 62.08, 43.30, 37.46. – IR (KBr, cm−1): ν = 3,413, 3,037, 1,612, 1,448, 1,371, 1,026, 740, 528. – HRMS ((+)-ESI): m/z = 356.1646 (calcd. 356.1645 for C24H22O2N, [M+H]+). The NMR data are essentially consistent with those reported in the literature (ref. 43]) for l -1 in DMSO‑d 6.
2.3 Fumigation experiment
A small quartz plate with a small amount of solid sample was placed near the mouth of a glass container (volume ca. 30 mL) with 15 mL of ethanol and a lid, which was gently heated to ca. 40 °C, and the system was allowed to stand for 5 min before the quartz plate was taken out and the emission spectrum was measured.
2.4 Chiral recognition
Solution preparation: 20 mg of d-1 or l-1 was added to 30.0 mL of THF and the mixture was treated by sonication for 5 min to give a solution with a concentration of 1.9 × 10⁻³ mol L−1. A certain amount of amino acids was dissolved in double distilled water to give the corresponding aqueous solutions (1.9 × 10⁻³ mol L−1).
Chiral recognition: 1 mL of the aqueous solution of amino acid was added to the THF solution of d-1 or l-1 (1 mL), and the change of the emissions under UV light at 365 nm was compared to that of d-1 or l-1, and the emission spectra were measured using fluorescence spectrometer.
3 Results and discussion
3.1 Synthesis of d-1 and l-1
Both enantiomers d-1 and l-1 were obtained in high yields (91–92 %) by the condensation reactions of 9-anthraldehyde and d- or l-phenylalanine and subsequent reduction with sodium borohydride (Scheme 1), and characterized by 1H NMR, 13C NMR, and mass spectrometry (Figures S1–S10, Supporting information available online). The compounds are soluble in THF and MeOH, slightly soluble in DMSO, and insoluble in dichloromethane and ethyl acetate. Barrett et al. 43 reacted a methanolic mixture of l-phenylalanine and NaBH3CN with 9-anthraldehyde to obtain l-1. Lu et al. synthesized l-1 by the condensation reaction of l-phenylalanine and 9-anthraldehyde followed by reduction with NaBH4 44 (56 % yield). We note that the two enantiomers show slight difference in part of the NMR and IR spectra, probably due to the difference in concentration, water content in deuterated solvent or background noise (NMR), and particle size, dispersion and concentration in KBr pellets (IR). It should also be noted that although l-1 is known, its luminescence properties have only been studied preliminarily in solution, and its DSE emission, mechanochromic luminescence, chiroptical properties and the application in chiral recognition have not been investigated.

Synthesis of d-1 and l-1.
The electronic structures of d-1 and l-1 have been studied at the B3LYP/6-31G(d,p) level using the density-functional theory (DFT) method (Figure 1). The results show that both the LUMOs and HOMOs are distributed on the anthracene moieties and only a small part of phenylalanine is involved. The energy levels of the LUMOs and HOMOs and the HOMO-LUMO energy gaps of the two enantiomers are basically the same.

Frontier molecular orbitals and their energy levels/gaps of d-1 (a) and l-1 (b).
3.2 Absorption and emission spectra in solution
The UV/Vis absorption spectra of d-1 and l-1 were measured in dimethyl sulfoxide (DMSO) at room temperature (Figure 2, Table 1). The two absorption spectra are essentially the same and demonstrate two sets of absorption bands, in which the short-wavelength bands at 264 nm are assigned to the phenylalanine moieties and the long-wavelength bands at 334, 351, 369, 389 nm are the characteristic absorption bands of the anthracene rings.

UV/Vis absorption spectra of d-1 and l-1 (DMSO, 1 × 10⁻⁴ mol L−1).
Photophysical data of d-1 and l-1.
| Compd | λ abs (nm)a | λ em (nm)b | λ em (nm)c | λ em (nm)d | λ em (nm)e | λ em (nm)f | Φ (%)b | Φ (%)c | Φ (%)d | Φ (%)e | τ (ns)c |
|---|---|---|---|---|---|---|---|---|---|---|---|
| d-1 | 264,334, 351,369, 389 |
399, 414, 439, 464 |
452 | 467 | 440 | 456 | 29 | 15 | 34 | 21 | 2.81 |
| l-1 | 264,334, 350,369, 389 |
396, 414, 439, 464 |
451 | 467 | 440 | 456 | 27 | 22 | 35 | 22 | 3.95 |
-
aDMSO, 1 × 10⁻⁴ mol L−1. bMeOH, 8 × 10⁻⁴ mol L−1, λ ex = 380 nm. cSolid, λ ex = 350 nm. dGround, λ ex = 350 nm. eAnnealed, λ ex = 350 nm. fFumigation with C2H5OH, λ ex = 350 nm.
At room temperature the emission bands of d-1 and l-1 in methanol are at 396, 414, 439 and 464 nm (Figure 3, Table 1; the corresponding excitation spectra are displayed in Figures S13, S14), respectively, with basically the same in the blue-violet region, which are mainly the locally excited (LE) emissions of the anthracene groups, essentially in agreement with the characteristics of the absorption spectra of the solutions and with the above mentioned electron cloud distributions of the frontier molecular orbitals. The emission wavelengths of d-1 and l-1 in THF solution are essentially the same as those in methanol (Figure S19), but the emission intensity in THF is relatively weaker, reflecting a special solvent effect.
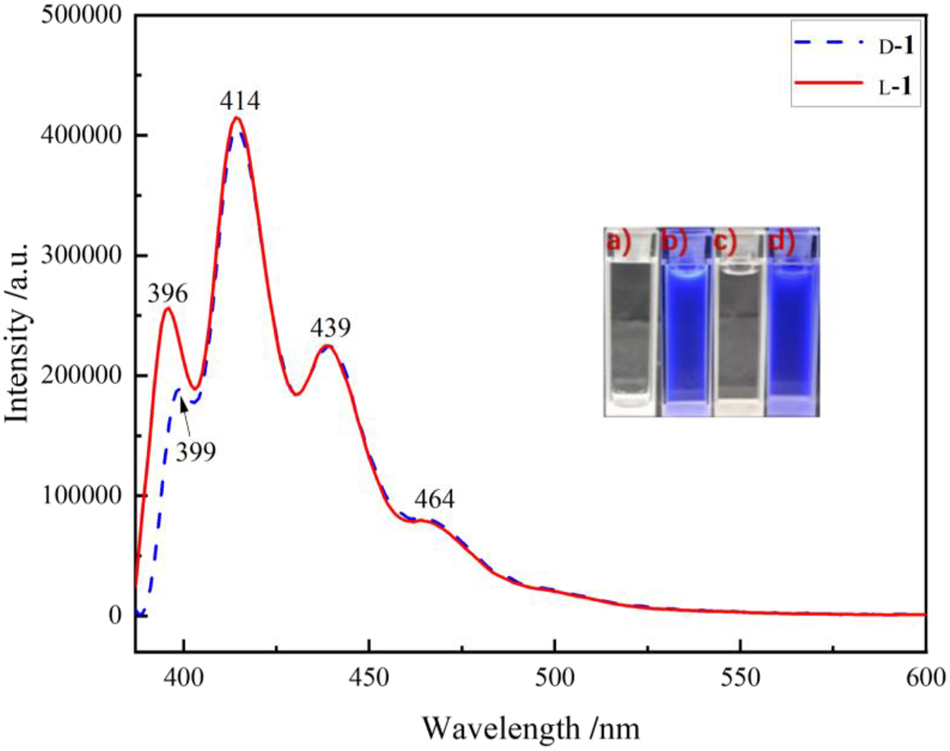
Emission spectra of d-1 and l-1 (λ ex = 380 nm; methanol, 8 × 10⁻⁴ mol L−1), insets are photographs of (a) d-1, (c) l-1 under natural light, and (b) d-1, (d) l-1 under UV light at 365 nm.
3.3 Solid-state and mechanochromic luminescence
Unlike the emission spectra of the solutions, the solid-state emission spectra of both d-1 and l-1 in powder at room temperature show broader unstructured single emission bands (Figure 4; the corresponding excitation spectra are displayed in Figures S11, S12) with the maximum emission wavelengths of 451 nm and 452 nm, respectively, due to the different environments of the anthracene rings in the solid state from those in solution. In the solid state, the anthracene ring may interact with the aromatic rings of other molecules, resulting in the change in the band shape and emission wavelength. From these results, both compounds d-1 and l-1 have DSE properties, and the emission quantum yields in the solid state are somewhat lower than those in solution (Table 1).

Normalized emission spectra of d-1 (left) and l-1 (right) before and after grinding, annealed and fumigated with C2H5OH (λ ex = 350 nm), respectively. Insets are photographs of (top) (a) d-1 before grinding, (b) d-1 ground, (c) d-1 annealed, (d) d-1 fumigated, and (i) l-1 before grinding, (j) l-1 ground, (k) l-1 annealed, (l) l-1 fumigated under natural light; (bottom) (e–p) the corresponding samples of (a–l) under UV light at 365 nm.
After grinding for 5 min with a pestle and a mortar, the emission wavelengths of both d-1 and l-1 show a red shift of 15 nm (Figure 4; the corresponding excitation spectra are displayed in Figures S15, S16) and the emission intensities increase significantly (Figures S20, S21), with the emission quantum yields of d-1 and l-1 increasing from 15 % and 22 % before grinding to 34 % and 35 % after grinding, respectively (Table 1) with a significant mechanochromic emission enhancement. The powder X-ray diffraction (PXRD) patterns (Figure 5) show changes due to the transition between the crystalline to the amorphous state by grinding, with significantly altered stacking structures, which may have affected the conjugation between the aromatic rings and inhibited the energy transfer, 45 resulting in a decrease in the non-radiative decay rates and an increase in the radiative decay rates, leading to enhanced emissions with a red shift. After annealing (170 °C, 3 min), the emission wavelengths are blue-shifted when compared with those before and after grinding (Figure 4) and the emission quantum yields are reduced to 21 % and 22 %, respectively. The PXRD patterns after annealing (Figure 5) show that the annealing leads to a change in the crystal structure and produces a different crystalline form from that before annealing. The ground d-1 and l-1 were fumigated with ethanol vapor for 5 min, and the corresponding emission spectra show a blue shift of 11 nm when compared with those before fumigation and the bands are slightly broadened, with a wide weak band appearing near 600 nm, probably due to the formation of excimer state (Figure 4). As can be seen in Figure 5, the diffraction peaks reappear after ethanol vapor fumigation and partially recover to the crystalline form of that before grinding, but with a lower intensity, which may be the reason for the change of the emissions after annealing.
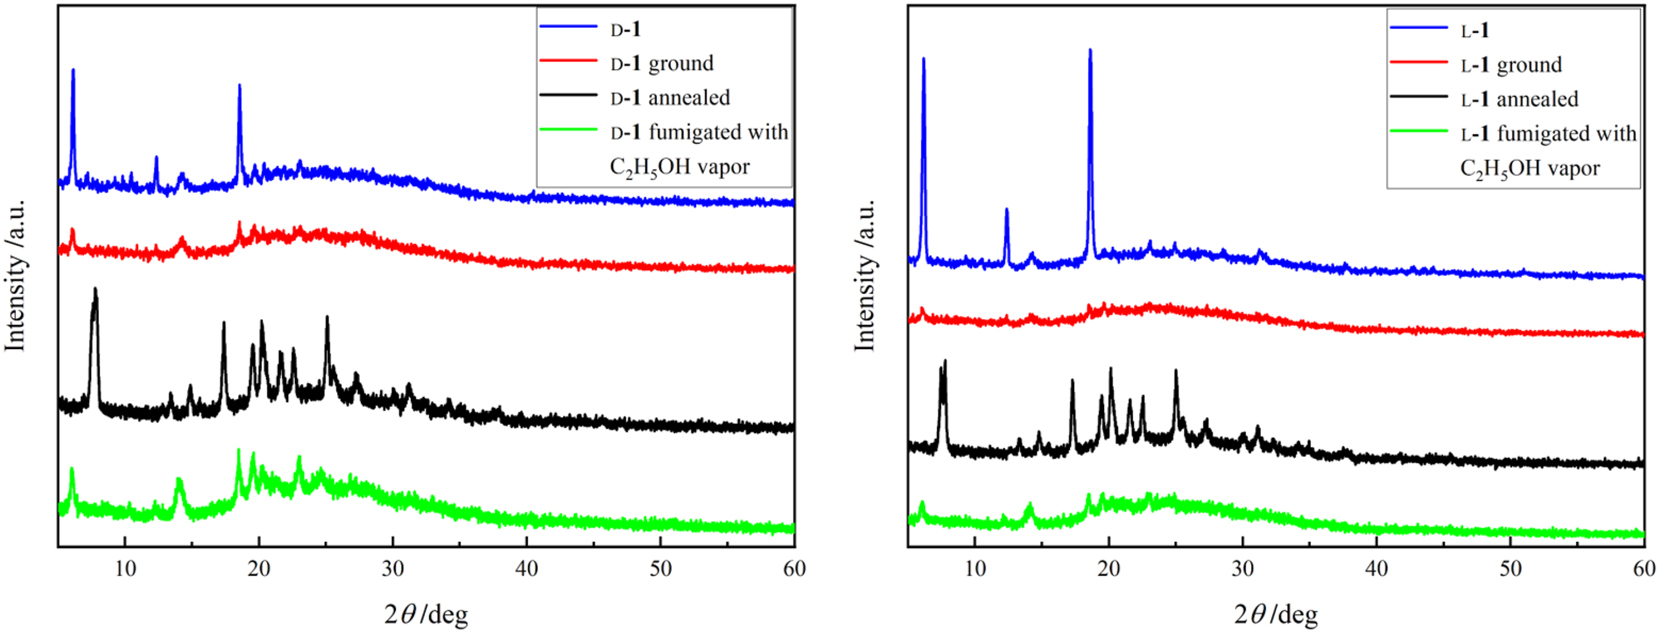
PXRD patterns of d-1 (left) and l-1 (right) before and after grinding, annealed and fumigated with C2H5OH.
3.4 Chiroptical properties
The circular dichroism (CD) spectra of d-1 and l-1 in methanol were studied at room temperature (Figure 6). The CD spectra of the two compounds show mirror image symmetry with distinct Cotton effect peaks between 200 and 270 nm, suggesting an enantiomeric relationship. The CPL spectra of d-1 and l-1 in KBr pellets (1:100, mass ratio) were measured at room temperature (Figure 7). The spectra show CPL signals suggesting that both compounds d-1 and l-1 are CPL-active. The luminescence dissymmetry factor at the corresponding maximum emission wavelengths is −1.4 × 10⁻⁴/6.0 × 10−4 for d-1 and l-1, respectively. A series of anthracene-amino acid esters with an amide moiety as a linker have been studied and the corresponding g lum of CPL is of the order of magnitude of 10−3 in PMMA composite films. 46 The results suggest that the samples are capable of chiral transfer from the amino acid moieties to the anthracene rings, although the g lum is relatively low.

CD spectra of d-1 and l-1 (methanol, 4 × 10⁻⁴ mol L−1).

CPL spectra (left) and luminescence dissymmetry factor versus wavelength (right) for d-1 and l-1 in KBr pellet.
3.5 Chiral recognition of free amino acids
In order to examine the molecular recognition performance of d-1 and l-1 for free amino acids, solutions of d-1 and l-1 and several amino acids (chemical structures shown in Figure S22) of the same concentration were prepared and mixed in a ratio of 1:1, and the configurations of the amino acids (derivatives) were differentiated by the fluorescence intensities.
When an aqueous solution of l-phenylalanine (l-Phe) is mixed with l-1 in THF, as the amount of l-Phe increases, the intensity of the emission bands gradually increases and the emissions are slightly red-shifted by ca. 3 nm (Figure 8, left), indicating some aggregates might be formed. When the amount of l-Phe is 1,000 μL reaching a ratio of 1:1, further increasing the amount of l-Phe does not change the emission intensity significantly (Figure 8, right), so the ratio for the recognition of phenylalanine by d-1 and l-1 is assumed to be 1:1.

Emission spectra of mixtures of l-1 with different amounts of l-Phe (left) and the ratio of the emission intensity of the mixture to that of l-1 (right) (λ ex = 380 nm).
Based on the above results, the enantioselective recognition of d- and l-Phe by d-1 and l-1 was investigated. The fluorescence recognition ability can be expressed by the enantioselective fluorescence enhancement ratio (eƒ). 47 l-1 can enantioselectively recognize d- and l-Phe, and the emissions of the mixtures are still the LE bands of the anthracene groups. Moreover, the emissions of the mixtures are much stronger than that of l-1, and it is stronger when mixed with l-Phe than with d-Phe (Figure 9, left), and the eƒ value of the mixture of l-1 with l-Phe versus the mixture of l-1 with d-Phe is 1.15 (Table 2). In addition, the mixtures with the phenylalanine enantiomers exhibit enhanced emissions almost immediately upon mixing, i.e. the recognition is fairly sensitive.

Emission spectra of l-1 mixing with d- and l-Phe (left) and d-1 mixing with d- and l-Phe (right) (λ ex = 380 nm), insets are photographs of (a) l-1 + l-Phe, (b) l-1 + d-Phe, (e) d-1 + l -Phe, (f) d-1 + d-Phe under natural light; (c) l-1 + l-Phe, and (d) l-1 + d-Phe, (g) d-1 + l-Phe, and (h) d-1 + d-Phe under UV light at 365 nm.
Recognition of d- and l-amino acid by d-1 and l-1.
| Recognition reagent | Amino acid | eƒ = (I D–I 0)/(I L–I 0) or (I L–I 0)/(I D–I 0)a |
|---|---|---|
| d-1 | d- and l-phenylalanine | 1.30 |
| l-1 | l- and d-phenylalanine | 1.15 |
| d-1 | d- and l-lysine | 6.30 |
| l-1 | l- and d-lysine | 4.98 |
| d-1 | d- and l-glutamic acid | 1.45 |
| l-1 | l- and d-glutamic acid | 1.32 |
-
a I D, Fluorescence intensity of d-1 mixed with amino acid; I L, Fluorescence intensity of l-1 mixed with amino acid; I 0, Fluorescence intensity of d-1 or l-1, λ ex = 380 nm.
d-1 also shows chiral recognition of d- and l-Phe, and the emission changes of the mixtures are similar to those of the mixtures with l-1, except that the stronger emission is observed after mixing with d-Phe (Figure 9, right), i.e., 1 selectively recognizes Phe with the same configuration. The eƒ value in the case of d-1 is 1.30 (Table 2), slightly better than that of l-1. The emissions of the mixtures are significantly enhanced to a different extent upon the addition of Phe enantiomers, probably because the combination of Phe with the recognition sites in d-1 or l-1 regulates the conjugation between the anthracene rings 48 and the benzene rings in both components are located on the same side, and are close to each other with some π···π interaction to increase the rigidity of the structures, 49 resulting in an increase in the radiative decay rate and thus the emission enhancement (Figure 10).

Proposed recognition mechanism of l-1 with d-Phe (a) and with l-Phe (b).
In the case of lysine (Lys), it is evident from the emission spectra (Figure 11) of the corresponding mixtures that both d-1 and l-1 could recognize Lys more efficiently than Phe. The emissions are significantly enhanced compared to those of the d-1 and l-1 solutions, and more significant enhancement is observed for the mixtures of l-1 + l-Lys (eƒ value of 6.30) and d-1 + d-Lys (eƒ value of 4.98) (Table 2). In this case the chiral discrimination of d- and l-Lys is also possible by the naked eye, with much stronger luminescence from the mixtures of recognizing molecules with Lys in the same configurations, which greatly facilitates the chiral recognition of Lys. The dynamic light scattering (DLS; Figure S23) measurements show that the mixtures are of 409 nm (l-1 + d-Lys) and 425 nm (l-1 + l-Lys) in size, respectively, suggesting that molecular aggregates are formed in the mixtures. It is the lysine (water)-induced aggregation (Figure S24) and in turn the aggregation induced emission enhancement (AIEE). As can be seen by the scanning electron microscopy (SEM; Figure 12), the aggregates formed by l-1 with d-Lys and l-Lys are of different size and morphology, with the latter being relatively larger and more regular, indicating that the recognition reagent l-1 and l-Lys have more efficient interactions with each other, and hence much stronger emission than that of the mixture of l-1 with d-Lys. For the chiral recognition of lysine, d-1 and l-1 have the advantage of rapid response compared with other related systems. 50 , 51 , 52 , 53

Emission spectra of l-1 mixing with d- and l-Lys (left) and d-1 mixing with d- and l-Lys (right) (λ ex = 380 nm), insets are photographs of (a) l-1 + l-Lys, (b) l-1 + d-Lys, (e) d-1 + l-Lys, (f) d-1 + d-Lys under natural light; (c) l-1 + l-Lys, (d) l-1 + d-Lys, (g) d-1 + l-Lys, and (h) d-1 + d-Lys under UV light at 365 nm.
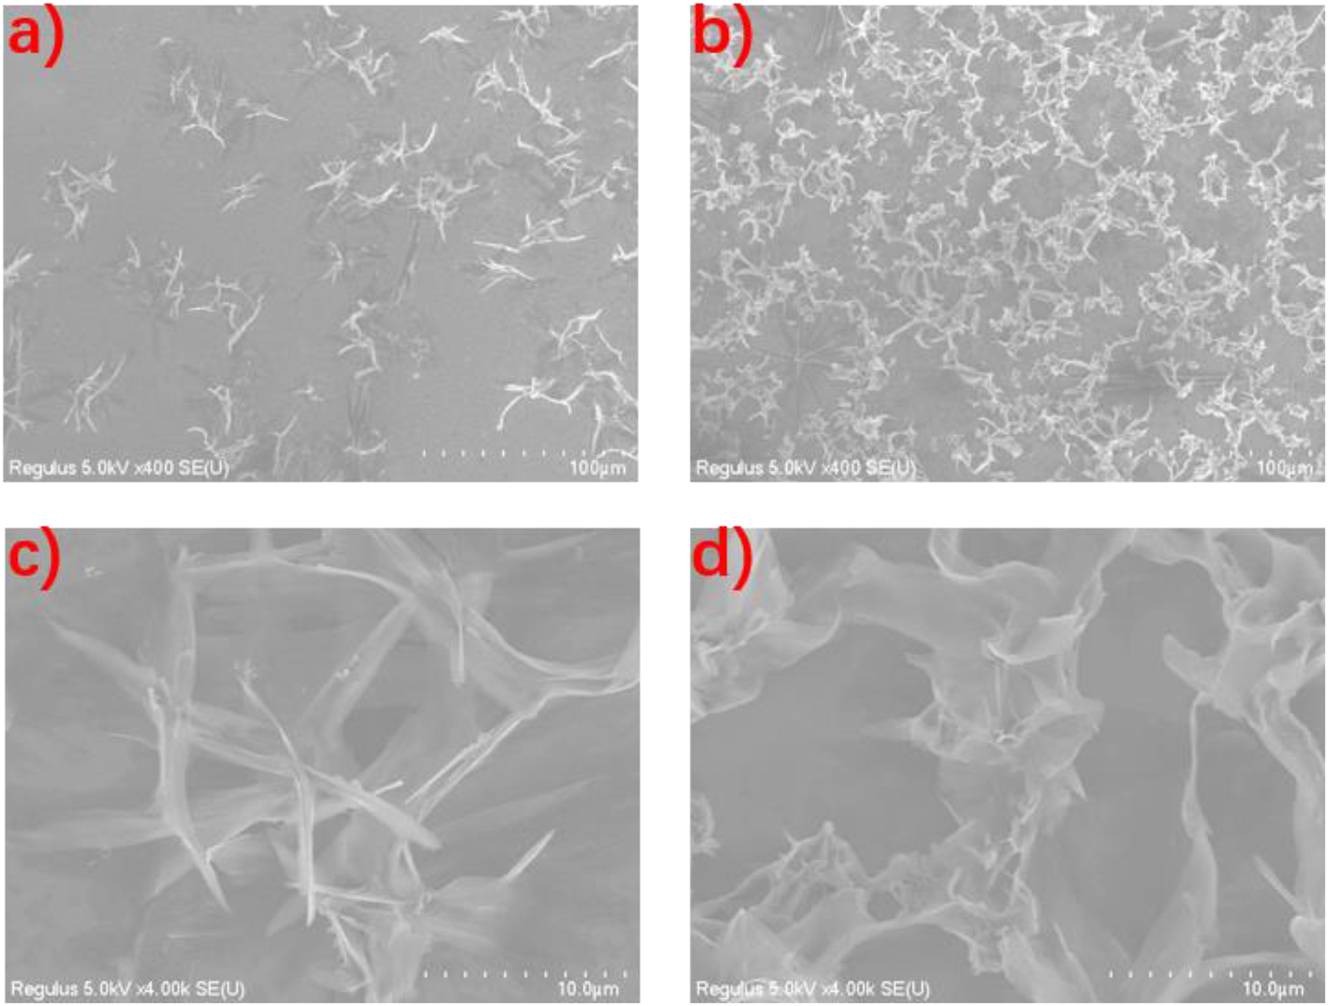
SEM images of the mixtures of (a) l-1 + d-Lys, (b) and l-1 + l-Lys; magnified SEM images of the mixtures of (c) l-1 + d-Lys and (d) l-1 + l-Lys.
d-1 and l-1 are also shown to be able in the chiral sensing of glutamic acid (Glu). From the emission spectra (Figure 13), the emissions of the mixtures are all stronger than those of the d-1 or l-1 solution. At the maximum emission wavelength, l-1 recognizes enantiomers of Glu with an eƒ value of 1.32, and d-1 recognizes Glu with an eƒ value of 1.45 (Table 2). Similar to the recognition of the amino acids mentioned above, the emissions are stronger when the recognizing molecules are mixed with the amino acid in the same configuration.
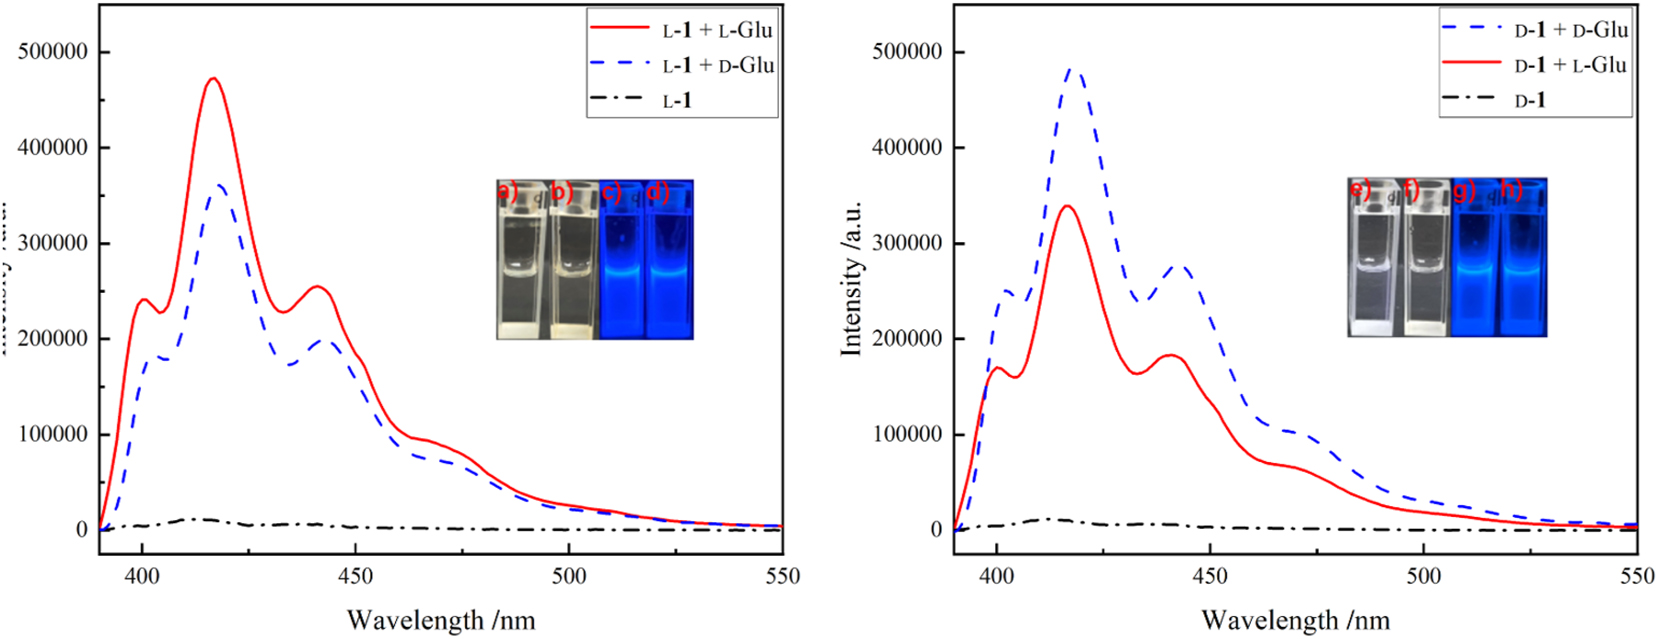
Emission spectra of l-1 mixing with d- and l-Glu (left) and d-1 mixing with d- and l-Glu (right) (λ ex = 380 nm). Insets are photographs of (a) l-1 + l-Glu, (b) l-1 + d-Glu, (e) d-1 + l-Glu, (f) d-1 + d-Glu under natural light; (c) l-1 + l-Glu, (d) l-1 + d-Glu, (g) d-1 + l-Glu, and (h) d-1 + d-Glu under UV light at 365 nm.
In the case of folic acid (l-configuration), the emissions of the corresponding mixtures are also significantly enhanced, but the ratio of the fluorescence intensities of the d-1/folic acid mixture to that of the l-1/folic acid mixture at the maximum emission wavelength [(I d –I d-1)/(I l –I l-1)] is 1.93, i.e., folic acid is better recognized by d-1 (Figure 14). This result is contrary to the recognition of the amino acids mentioned above, which may be due to the fact that the structure of folic acid has more binding sites and greater structural rigidity, resulting in a stronger binding to d-1 than to l-1, i.e. this is an example of the heterochiral recognition. 24

Emission spectra of d-1 and l-1 mixing with folic acid (λ ex = 380 nm), insets are photographs of (a) d-1 + folic acid, (b) l-1 + folic acid under natural light, (c) d-1 + folic acid, and (d) l-1 + folic acid under UV light at 365 nm.
The above results of the chiral recognition of several amino acids show the advantage of d-1 and l-1 as amino acid derivatives for the recognition of free amino acids in aqueous phase, and the emissions of the mixed solutions are significantly stronger than those of 1 and in all cases the recognition is very fast. Among the free amino acids tested, the best result is the chiral recognition of Lys.
4 Summary
Anthracene-phenylalanine compounds d-1 and l-1 have been easily synthesized and the emission properties under different conditions, and the enantioselective fluorescence recognition of free amino acids in aqueous phase, have been investigated. Both enantiomers show DSE properties, with enhanced mechanochromic luminescence and circularly polarized luminescence in the solid, indicating the modulation of the luminescence properties of both enantiomers by the introduction of the chiral phenylalanine moiety. The enantioselective fluorescence recognition of Phe, Lys, Glu and folic acid can be achieved with d-1 or l-1 as the recognition reagent, especially for Lys. This work provides useful information on the synthesis and luminescence properties of compounds with DSE property and the development of easily accessible aqueous-phase recognition reagents for free amino acids.
5 Supporting information
1H NMR, 13C NMR, IR and MS spectra of d-1 and l-1, excitation spectra of d-1 and l-1 before and after grinding, fluorescence decay curves of d-1 and l-1, emission spectra of d-1 and l-1 in THF solution, emission spectra of d-1 and l-1 (solid before and after grinding, annealing and ethanol fumigation), and chemical structures of d- and l-phenylalanine, d- and l-lysine, d- and l-glutamic acid and folic acid. The supplementary material is available online (https://doi.org/10.1515/znb-2025-0003).
Funding source: Natural Science Foundation of Shandong Province
Award Identifier / Grant number: ZR2020MB001 and ZR2022MB107
Acknowledgements
We thank the Natural Science Foundation of Shandong Province (grants ZR2020MB001 and ZR2022MB107) for support of this work.
-
Research ethics: Not applicable.
-
Informed consent: Not applicable.
-
Author contributions: All authors have accepted responsibility for the entire content of this submitted manuscript and approved submission.
-
Use of Large Language Models, AI and Machine Learning Tools: None declared.
-
Conflict of interest: The authors declare no conflict of interest regarding this article.
-
Research funding: Natural Science Foundation of Shandong Province (grants ZR2020MB001 and ZR2022MB107).
-
Data availability: The raw data can be obtained on request from the corresponding author.
References
1. Feng, H.-Y.; Pu, J.-R.; Wang, S.; Jiang, S.-J.; Yang, W.-Q.; Cao, D.-R.; Feng, Y.-S. Dyes Pigm. 2023, 217, 111422; https://doi.org/10.1016/j.dyepig.2023.111422.Search in Google Scholar
2. Yan, H.-W.; He, Y.-L.; Wang, D.; Han, T.; Tang, B.-Z. Aggregate 2023, 4, e331; https://doi.org/10.1002/agt2.331.Search in Google Scholar
3. Zhang, Z.-W.; Wang, D.; Yan, X.-T.; Yan, Y.-F.; Lin, L.-X.; Ren, Y.-Z.; Chen, Y.-Y.; Feng, L.-Y. J. Colloid Interface Sci. 2024, 674, 576–586; https://doi.org/10.1016/j.jcis.2024.06.208.Search in Google Scholar PubMed
4. Zhang, C.; Li, S.; Dong, X.-Y.; Zang, S.-Q. Aggregate 2021, 2, e48; https://doi.org/10.1002/agt2.48.Search in Google Scholar
5. Zhou, Y.-H.; Si, P.-B.; Liu, X.-Q.; Wang, D.-Q.; Yin, X.-Y.; Teng, M.-Y. Synth. Mater. Aging Appl. 2021, 50, 127–130.Search in Google Scholar
6. Li, X.-N.; Xie, Y.-J.; Li, Z. Adv. Photonics Res. 2021, 2, 2000136; https://doi.org/10.1002/adpr.202000136.Search in Google Scholar
7. Li, M.; Lin, W.-B.; Fang, L.; Chen, C.-F. Acta Chim. Sin. 2017, 75, 1150–1163; https://doi.org/10.6023/a17090440.Search in Google Scholar
8. Zhang, T.-W.; Zhang, Y.; He, Z.-Y.; Yang, T.-J.; Hu, X.; Zhu, T.-F.; Tang, Y.-H.; Zhang, Y.-F.; Jiao, J. Chem. - Asian J. 2024, 19, e202400049; https://doi.org/10.1002/asia.202400049.Search in Google Scholar PubMed
9. Hu, M.; Feng, H.-T.; Yuan, Y.-X.; Zheng, Y.-S.; Tang, B.-Z. Coord. Chem. Rev. 2020, 416, 213329; https://doi.org/10.1016/j.ccr.2020.213329.Search in Google Scholar
10. Liu, X.-H.; Jiao, J.-M.; Jiang, X.-X.; Li, J.-F.; Cheng, Y.-X.; Zhu, C.-J. J. Mater. Chem. C 2013, 1, 4713–4719; https://doi.org/10.1039/c3tc30886c.Search in Google Scholar
11. Bigdeli, A.; Ghasemi, F.; Fahimi-Kashani, N.; Abbasi-Moayed, S.; Orouji, A.; Jafar-Nezhad Ivrigh, Z.; Shahdost-Fard, F.; Hormozi-Nezhad, M. R. Analyst 2020, 145, 6416–6434; https://doi.org/10.1039/d0an01211d.Search in Google Scholar PubMed
12. Ulatowski, F.; Jurczak, J. Asian J. Org. Chem. 2016, 5, 715–723; https://doi.org/10.1002/ajoc.201600093.Search in Google Scholar
13. Chen, X.-Y.; Zhu, R.-L.; Zhang, B.-C.; Zhang, X.-L.; Cheng, A.-Y.; Liu, H.-P.; Gao, R.-Y.; Zhang, X.-P.; Chen, B.; Ye, S.-Y.; Jiang, J.; Zhang, G.-Q. Nat. Commun. 2024, 15, 3314; https://doi.org/10.1038/s41467-024-47648-z.Search in Google Scholar PubMed PubMed Central
14. Hu, M.; Yuan, Y.-X.; Wang, W.-Z.; Li, D.-M.; Zhang, H.-C.; Wu, B.-X.; Liu, M.-H.; Zheng, Y.-S. Nat. Commun. 2020, 11, 161; https://doi.org/10.1038/s41467-019-13955-z.Search in Google Scholar PubMed PubMed Central
15. Aboul‐Enein, H. Y.; Bounoua, N.; Rebizi, M.; Wagdy, H. Chirality 2021, 33, 196–208; https://doi.org/10.1002/chir.23303.Search in Google Scholar PubMed
16. Wang, Y.-X.; Zhou, Y.-J.; Zhao, S.-S.; Zhang, M.-J.; Li, A.-Q.; Li, G.-G.; Guo, Q.; Guo, X.-R.; Tong, Z.; Li, Z.-Y.; Lin, J.; Zhuang, T. J. Mater. Chem. A 2024, 12, 9421–9426; https://doi.org/10.1039/d3ta07645h.Search in Google Scholar
17. Kumar, A. P.; Jin, D.-R.; Lee, Y.-I. Appl. Spectrosc. Rev. 2009, 44, 267–316; https://doi.org/10.1080/05704920902717971.Search in Google Scholar
18. Chen, Y.-T.; Li, B.; Chen, J.-L.; Su, X.-C. Anal. Chem. 2022, 94, 7853–7860; https://doi.org/10.1021/acs.analchem.2c00218.Search in Google Scholar PubMed
19. Ge, R.; Zhu, Y.-Y.; Wang, H.-F.; Gu, S.-X. Chin. J. Org. Chem. 2022, 42, 424–433; https://doi.org/10.6023/cjoc202108047.Search in Google Scholar
20. Yu, X.-Y.; Yao, Z.-P. Anal. Chim. Acta 2017, 968, 1–20; https://doi.org/10.1016/j.aca.2017.03.021.Search in Google Scholar PubMed
21. Wu, L.-J.; Lu, X.-Y.; Cai, W.-T.; Zou, Y.-J.; Zhang, X.-Y.; Yang, J.-L.; Zhao, G. Int. J. Mol. Sci. 2024, 25, 7504; https://doi.org/10.3390/ijms25147504.Search in Google Scholar PubMed PubMed Central
22. Chen, X.-M.; Hu, N.; Wei, H.-F.; Wang, H.-B. J. Fluoresc. 2020, 30, 679–685; https://doi.org/10.1007/s10895-020-02539-6.Search in Google Scholar PubMed
23. Chen, Y.-L.; Lai, K.-J.; Cai, J.-M.; Li, Y.-C.; Wang, H.-B. J. Fluoresc. 2022, 32, 983–992; https://doi.org/10.1007/s10895-022-02908-3.Search in Google Scholar PubMed
24. Pu, L. Angew. Chem. Int. Ed. 2020, 59, 21814–21828; https://doi.org/10.1002/anie.202003969.Search in Google Scholar PubMed
25. Im, S.; Ryu, C. H.; Kim, M.; You, D. K.; Yi, S.; Lee, W.; Lee, K. M. Inorg. Chem. Front. 2022, 9, 501–513; https://doi.org/10.1039/d1qi01405f.Search in Google Scholar
26. Lee, W. Y.; Lee, S.; Joo, B. S.; Kang, J. H.; Jang, H. S.; Ko, H.; Kang, G. Appl. Surf. Sci. 2024, 160444 (7 pages); https://doi.org/10.1016/j.apsusc.2024.160444.Search in Google Scholar
27. Zhang, L.; Li, G.-Z.; Xin, Q.; Liu, H.-N.; Yang, X.-Z.; Liu, Y. Sens. Actuators, B 2024, 413, 135878; https://doi.org/10.1016/j.snb.2024.135878.Search in Google Scholar
28. Luo, J.-D.; Xie, Z.-L.; Lam, J. W. Y.; Cheng, L. T.; Chen, H.-Y.; Qiu, C.-F.; Kwok, H. S.; Zhan, X.-W.; Liu, Y.-Q.; Zhu, D.-B.; Tang, B.-Z. Chem. Commun. 2001, 1740–1741; https://doi.org/10.1039/b105159h.Search in Google Scholar PubMed
29. Xu, L.-F. Coord. Chem. Rev. 2024, 506, 215701; https://doi.org/10.1016/j.ccr.2024.215701.Search in Google Scholar
30. Teo, N. K. S.; Fan, B.; Ardana, A.; Thang, S. H. Aggregate 2023, 5, e414; https://doi.org/10.1002/agt2.414.Search in Google Scholar
31. Xu, H.-D.; Chen, X.; Wang, H.; Wang, C.-Z.; Guo, Y.-J.; Lin, Y.-X.; Huang, Y.-H.; Hou, J.-Q.; Wei, X.-D. Aggregate 2024, e580.Search in Google Scholar
32. Chen, G.; Li, W.-B.; Zhou, T.-R.; Peng, Q.; Zhai, D.; Li, H.-X.; Yuan, W.-Z.; Zhang, Y.; Tang, B.-Z. Adv. Mater. 2015, 27, 4496–4501; https://doi.org/10.1002/adma.201501981.Search in Google Scholar PubMed
33. Ma, Z.-Q.; Tu, J.-J.; Yang, D.; Zhang, Q.; Wu, J.-Y. J. Mol. Struct. 2024, 1312, 138478; https://doi.org/10.1016/j.molstruc.2024.138478.Search in Google Scholar
34. Pei, Q.; Wang, X.-F.; Hu, W.-J.; Nie, L.-Z.; Shi, Y.-N.; Ding, A.-X.; Tang, F. Colloids Surf., A 2023, 677, 132347; https://doi.org/10.1016/j.colsurfa.2023.132347.Search in Google Scholar
35. Rodríguez-Cortés, L. A.; Navarro-Huerta, A.; Rodríguez-Molina, B. Matter 2021, 4, 2622–2624.10.1016/j.matt.2021.06.023Search in Google Scholar
36. Belmonte-Vázquez, J. L.; Amador-Sánchez, Y. A.; Rodríguez-Cortés, L.; Rodríguez-Molina, A. B. Chem. Mater. 2021, 33, 7160–7184; https://doi.org/10.1021/acs.chemmater.1c02460.Search in Google Scholar
37. Berdnikova, D. V.; Steup, S.; Bolte, M.; Suta, M. Chem. Eur. J. 2023, 29, e202300356; https://doi.org/10.1002/chem.202300356.Search in Google Scholar PubMed
38. Feng, H.-T.; Zhang, X.; Zheng, Y.-S. J. Org. Chem. 2015, 80, 8096–8101; https://doi.org/10.1021/acs.joc.5b01194.Search in Google Scholar PubMed
39. Yu, K.; Xu, Z.-Y.; An, J.-P.; Zhu, Y.-Y.; Gu, S.-X. Chem. Reagents 2024, 46, 53–65.Search in Google Scholar
40. Amin, A.; Frampton, J.; Liu, Z.; Franco‐Becker, G.; Norton, M.; Alaa, A.; Li, J. V.; Murphy, K. G. Diabetes, Obes. Metab. 2020, 23, 147–157; https://doi.org/10.1111/dom.14204.Search in Google Scholar PubMed
41. Pilotto, A.; Zipser, C. M.; Leks, E.; Haas, D.; Gramer, G.; Freisinger, P.; Schaeffer, E.; Liepelt-Scarfone, I.; Brockmann, K.; Maetzler, W.; Schulte, C.; Deuschle, C.; Hauser, A. K.; Hoffmann, G. F.; Scheffler, K.; van Spronsen, F. J.; Padovani, A.; Trefz, F.; Berg, D. Neurology 2021, 96, e399–e411; https://doi.org/10.1212/wnl.0000000000011088.Search in Google Scholar PubMed
42. Liu, G.-F.; Liu, J.-Y.; Feng, C.-T.; Zhao, Y.-L. Chem. Sci. 2017, 8, 1769–1775; https://doi.org/10.1039/c6sc04808k.Search in Google Scholar PubMed PubMed Central
43. Wan, Q.-H.; Shaw, P. N.; Davies, M. C.; Barrett, D. A. J. Chromatogr. A 1997, 765, 187–200.10.1016/S0021-9673(96)00928-4Search in Google Scholar
44. Zong, G.-Q.; Lu, G.-X. Tetrahedron Lett. 2008, 49, 5676–5679; https://doi.org/10.1016/j.tetlet.2008.07.081.Search in Google Scholar
45. Liu, H.-C.; Gu, Y.-R.; Dai, Y.-X.; Wang, K.; Zhang, S.-T.; C, G.; Zou, B.; Yang, B. J. Am. Chem. Soc. 2020, 142, 1153–1158; https://doi.org/10.1021/jacs.9b11080.Search in Google Scholar PubMed
46. Wang, Z.-E.; Li, Y.-Z.; Hao, A.-Y.; Xing, P.-Y. Angew. Chem. Int. Ed. 2021, 60, 3138–3147; https://doi.org/10.1002/anie.202011907.Search in Google Scholar PubMed
47. Ren, L.-Q.; Zhan, B.-Q.; Guo, Y.-H.; Zu, B.; Li, Y.-Z.; He, C. Nat. Chem. 2024, 17, 83–91; https://doi.org/10.1038/s41557-024-01649-z.Search in Google Scholar PubMed
48. Kan, X.-T.; Y, H.; Niu, Y.-B.; Hu, Y.-B.; Zhang, Y.-M.; Wei, T.-B.; Lin, Q. New J. Chem. 2022, 46, 2858–2862.10.1039/D1NJ05911DSearch in Google Scholar
49. Bai, L.; Huo, S.-H.; Chen, J.; Lu, X.-Q. Chem. J. Chin. Univ. 2019, 40, 41–46.Search in Google Scholar
50. Wang, P.; Wang, R.; Sun, Y.; Song, K.-Y.; Sun, X.-X. Int. J. Mol. Sci. 2024, 25, 10666; https://doi.org/10.3390/ijms251910666.Search in Google Scholar PubMed PubMed Central
51. Du, G.-Y.; Pu, L. Org. Lett. 2019, 21, 4777–4781; https://doi.org/10.1021/acs.orglett.9b01661.Search in Google Scholar PubMed
52. Iqbal, S.; Yun, S.-S.; Jiang, L.; Wang, X.-J.; Chen, Y.; Wang, Y.-L.; Yu, X.-Q.; Pu, L. Chem. – Eur. J. 2019, 25, 9967–9972; https://doi.org/10.1002/chem.201901374.Search in Google Scholar PubMed
53. Sun, M.-X.; Ni, C.-Z.; Zhang, F.-Q.; Zhu, Y.-Y.; Zeng, J.; Gu, S.-X. Chin. Chem. Lett. 2023, 34, 108345; https://doi.org/10.1016/j.cclet.2023.108345.Search in Google Scholar
Supplementary Material
This article contains supplementary material (https://doi.org/10.1515/znb-2025-0003).
© 2025 Walter de Gruyter GmbH, Berlin/Boston
Articles in the same Issue
- Frontmatter
- In this issue
- Research Articles
- Chemical aspects of the preparation of Vulcanised Fibre using zinc chloride hydrates: from a brief history to a new consideration of the key reactions in ionic liquids
- On the preparation and spectral properties of some hydroxy-substituted triphenylmethane dyes
- High-pressure synthesis and crystal structure of Ga5Na1–x B12O26–x (OH) x (x = 0.12)
- Intermetallic phases with Ho4Ir13Ge9-type structure
- Interplay between oxidative addition and reductive elimination at a diruthenium complex bearing the bis(diphenylphosphanyl)amine ligand
- Anthracene-d- and l-phenylalanine derivatives: synthesis, dual-state emission, mechanochromic luminescence, chiroptical property and enantioselective recognition of free amino acids
- Synthesis, structures and optical properties of 3,3′-disubstituted biphenyl compounds