
The electronic structure, phase transition, elastic, thermodynamic, and thermoelectric properties of FeRh: high-temperature and high-pressure study
-
YanJun Hao
 ,
Lin Zhang
,
Lin Zhang

Abstract
Using the projector augmented wave (PAW) within the Perdew, Burke, and Ernzerhof (PBE) form of generalized gradient approximation (GGA), We present a study of the electronic structure, phase transition, elastic, thermodynamic, and thermoelectric properties of FeRh. We find that FM structure exhibits the largest Fe magnetic moment, which is in accordance with the experimental data and Fe magnetic moment for A-AFM and G-AFM phases, c-AFM, A’-AFM and Ort phases show lower Fe local magnetic moment. Our most stable structure is orthorhombic phase. This conclusion is supported by Zarkevich and Johnson, but contrary to the results of Aschauer et al., Kim et al. and Gruner et al. The obtained phase transition of Ort → c-AFM occurs at ca. 116.5 GPa and c-AFM to A’-AFM phase transition pressure is 119.0 GPa. The compressional, shear and average velocities as well as the bulk and shear moduli increase monotonically with increasing pressure. It is also found that thermal electronic contributions to specific heat are not negligible and contribution rate of electrons to the total thermal conductivity dominant at high temperature. At lower temperature, lattice thermal conductivity KL increases rapidly with the increasing pressure and KL has a moderate increase under pressure at higher temperature. Whereas, electronic thermal conductivity Ke is opposite. Most of the heat is carried by phonons with mean free paths ranging from 10 to 300 nm at 300 K.
1 Introduction
The FeRh alloys has received much attention both theoretical and experimental research due to the wide range of intriguing temperature dependent magnetic and transport properties, in particular its potential application in magnetic refrigeration technology an alternative technology to the current gas-compression method [1], [2], [3], high-density recording media for future hard disks [4], ultrafast (picosecond) switching [5], and room-temperature antiferromagnetic memory resistors [6].
Experimentally, earlier study works by Fallot [7] and Kouvel et al. [8] found that FeRh exhibits a first-order phase transition from an antiferromagnetic (AFM) structure to a ferromagnetic (FM, CsCl structure) structure around 350∼400 K [7], [8]. The phase transition is accompanied by an increase in volume of about 1%, an increase of iron magnetic moment [9], a large increase in entropy [10] and a large drop in electrical resistivity [8]. In contradiction to experiment of Fallot [7] and Kouvel et al. [8], X-ray diffraction measurements by Bergevin and Muldawer [11] showed that the transition is isostructural. In 2005, Kuncser, Nicula, and Ponkratz et al. [12] used the high-pressure energy dispersive X-ray experiments to find a phase transition from body center cubic (bcc) to face-center-cubic (fcc) at 19 GPa.
Theoretically, in 1982, Koenig [13] used the linear muffin-tin orbitals (LMTO) method to calculate the band structure of paramagnetic, ferromagnetic and antiferromagnetic ordered FeRh. In 1992, Moruzzi and Marcus [14] predict zero-pressure equilibrium state to be AFM using the augmented-spherical-wave (ASW) method. In 2003, Gruner, Hoffmann and Entel [15] investigated the thermodynamic behavior of FeRh in an Ising-type spin model and explained the transition through entropy associated with competing magnetic states of the Rh atom. In 2005, Gu and Antropov [16] found that the antiferro-ferromagnetic transition in FeRh occurs mostly due to the spin wave excitations via the non-collinear version of the linear muffin-tin orbital method in the atomic-sphere approximation (LMTO-ASA). In the same year, Rajagopalan [17] employed the means of the tight binding linear muffin tin orbital method to find a structural phase transition from NaCl-type to tetragonal-type structure to be 20.3 GPa. Aschauer, Braddell, and Brechbuhl et al. [18] in 2016 used the density functional theory calculations to find that usual local density approximation yielding the wrong ground-state structure, and generalized gradient (GGA) extensions being in better agreement with the bulk experimental structure. They also found the ground state in FeRh to be cubic G-AFM phase. In the same year, Kim, Ramesh, and Kioussis [19] found tetragonally expanded G-AFM is the stable structure and cubic G-AFM structure is believed to be metastable via the projector augmented-wave method. Recently, Wolloch, Gruner and Keune et al. [20] predicted the ground-state is B2-AFM phase and confirmed the recently reported lattice instability in the AFM phase using the projector augmented-wave (PAW) method. Very recently, Zarkevich and Johnson [21] obtained the most stable structure to be orthorhombic phase using density functional theory (DFT) based ab initio molecular dynamics. From above theoretical work, we can find that the ground state structure is disagreement for different theoretical calculations.
Therefore, in this work, we predict the electronic structure, phase transition, elastic, thermodynamic and thermoelectric properties of FeRh using the projector augmented-wave method based on the DFT. This paper is proceeded as follows: In section 2, we make a brief review of the theoretical method. The calculated results with some discussions are shown in section 3 and compared with the previously available experimental and theoretical results. Conclusions are summarized in section 4.
2 Theoretical method
Our density functional theory (DFT) computations with spin-polarized have been performed employing the Vienna ab-initio simulation package (VASP) [22], [23], [24], using the projector augmented-wave (PAW) method [24], [25]. The plane wave energy cutoff was set to 550 eV and the Brillouin zone was sampled with Γ-centered Monkhorst-Pack using 19 × 19 × 19 k grid for orthorhombic structure and 12 × 12 × 12 k mesh for other phases. Exchange and correlation potentials were treated within the generalized gradient approximation of Perdew, Burke, and Ernzerhof (PBE) [26]. Valence-electron configurations for pseudo-atoms were Fe 3pd7s1 and Rh 4p5s4d. Atomic positions and lattice parameters were fully optimized to obtain relaxed structures at a range of fixed volumes and the maximum energy of each phase were no more than 10−9 eV. Accurate total energy calculations were performed by means of the linear tetrahedron method with Blöchl’s correction [27]. The finite temperature for electric structure was treated with Fermi-Dirac-smearing method of Mermin [28]. The phonon frequency was computed via the small displacement method within the quasi-harmonic approximation [29]. To obtain a vibrational free energy converged within 1 meV, 4 × 4 × 4 super cells are used for FM-FeRh. The elastic constants are calculated as the second derivatives of the internal energy with respect to the strain tensor proposed by Sin’ko and Smirnov [30].
To calculate the electrical conductivity and thermal conductivity from electrons of FeRh, Boltztrap2 code which is based on Boltzmann transport theory [31] under the constant relaxation time approximation was used. Moreover, 40,000 k-points was used in Brillouin zone to obtain convergence. Relaxation time (τ) in our calculations is assumed to have direction independency and is treated constant (10−14 s) within a consideration temperature range.
Via Boltzmann transport equation (BTE) within the relaxation time approximation (RTA), the lattice thermal conductivity is given as
Here, V is the unit-cell volume, N is the number of q points, Cq is the lattice specific heat, υq is the group velocity, and
3 Results and discussion
3.1 Electronic structure and phase transition
2For FM, c-AFM, G-AFM, A-AFM, A’-AFM, orthorhombic (Ort, Pmmn space group no. 59) and nonmagnetic (NM, CsCl structure) structure, the total energy E and corresponding a primitive cell volume are calculated, and then make a fit of these energy–volume (E–V) data to the fourth-order Birch–Murnaghan (BM4) equation of state (EOS) [33], [34]. For comparison purposes, the energy versus volume curves are plotted in Figure 1, here volume is equal to the volume of primitive cell divided by number of atoms. AFM structure can be described as alternating FM planes which are antiferromagnetically coupled along the sheet normal direction, for c-AFM, G-AFM, A-AFM and A’-AFM phase, FM planes are the (110), (001), (111), and (100) planes, respectively [19]. It can be noticed that the total energies are increased in the following trend as Ort < A’-AFM < G-AFM < A-AFM < FM < c-AFM, i.e., Ort phase has the lowest energy at its equilibrium volume. This conclusion is also supported by Zarkevich and Johnson [21].
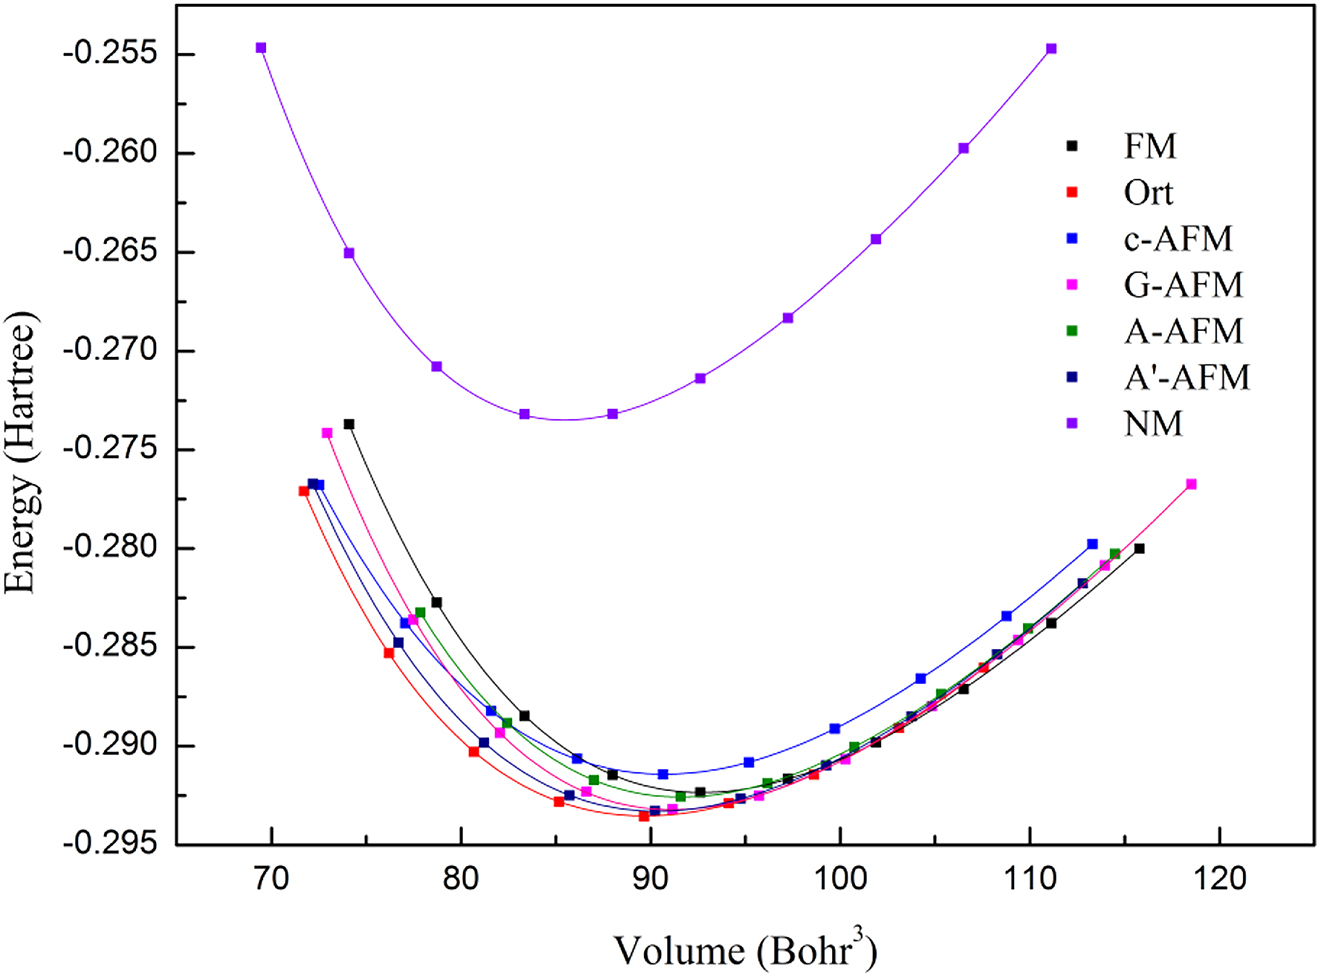
Energy (E) of FM, c-AFM, G-AFM, A-AFM, A’-AFM, NM, and orthorhombic (Ort) as a function of volume (V) at 0 K, in which volume is equal to the volume of primitive cell divided by number of atoms.
In Table 1, we report the equilibrium volume, lattice parameters, relative energies and magnetic moments together with the previously other calculations [15], [19] and available experimental data [35], [36]. Our predict results of all the considered phase are in good agreement with the available experimental values and other theoretical data and the differences for lattice parameters are less than 1.0%. The FM structure has the largest Fe magnetic moment, which is in good agreement with the experimental value of 3.2 μB [35]. However, Fe magnetic moment for A-AFM and G-AFM phases decreases and c-, A’-AFM and Ort phases show lower Fe local magnetic moment.
Calculated and experimented equilibrium Volume V0 (Å3), lattice parameters (a, b and c, Å), relative energy (ΔE, eV), and magnetic moment (M, μB) in different structures.
| structure | V0 | a | B | C | c/a | ΔE | |MFe| | |MRh| | |
|---|---|---|---|---|---|---|---|---|---|
| FM | This work | 27.49 | 3.018 | 3.018 | 1.000 | 0.00000000 | 3.21 | 1.05 | |
| Exp. | 2.989a | 2.989a | 1.000a | 3.2b | 0.9b | ||||
| PAW | 3.004c | 3.004c | 1.000c | 3.17c | 1.02c | ||||
| ASW | 3.020d | 3.020d | 1.000d | 3.23d | 1.00d | ||||
| c-AFM | This work | 26.64 | 2.770 | 3.504 | 1.265 | 0.04975250 | 3.00 | ||
| PAW | 2.749c | 3.498c | 1.27c | 2.95c | |||||
| G-AFM | This work | 27.04 | 3.002 | 3.002 | 1.000 | −0.04554840 | 3.15 | ||
| PAW | 2.987c | 2.986c | 1.000c | 3.12c | |||||
| A-AFM | This work | 27.15 | 3.078 | 2.866 | 0.931 | −0.01217110 | 3.16 | ||
| PAW | 3.064c | 2.850c | 0.93c | 3.12c | |||||
| A’-AFM | This work | 26.78 | 2.770 | 3.490 | 1.260 | −0.05217110 | 2.96 | ||
| PAW | 2.761c | 3.472c | 1.26c | 3.15c | |||||
| NM | This work | 25.36 | 2.938 | 2.938 | 1.000 | 1.02864400 | |||
| Orth | This work | 26.61 | 2.801 | 4.270 | 1.588 | −0.06629230 | 2.89 |
The relationship between enthalpy and pressure is shown in Figure 2. Here, the pressure P can be obtained by
where E and V are energy and volume, respectively. From this figure, we can observe that Ort structure is stable up to 116.5 GPa at 0 K, i.e., the phase transition of Ort → c-AFM occurs at ca. 116.5 GPa according to the curve of enthalpy and pressure. It is also noted that the c-AFM to A’-AFM phase transition pressure is 119.0 GPa.
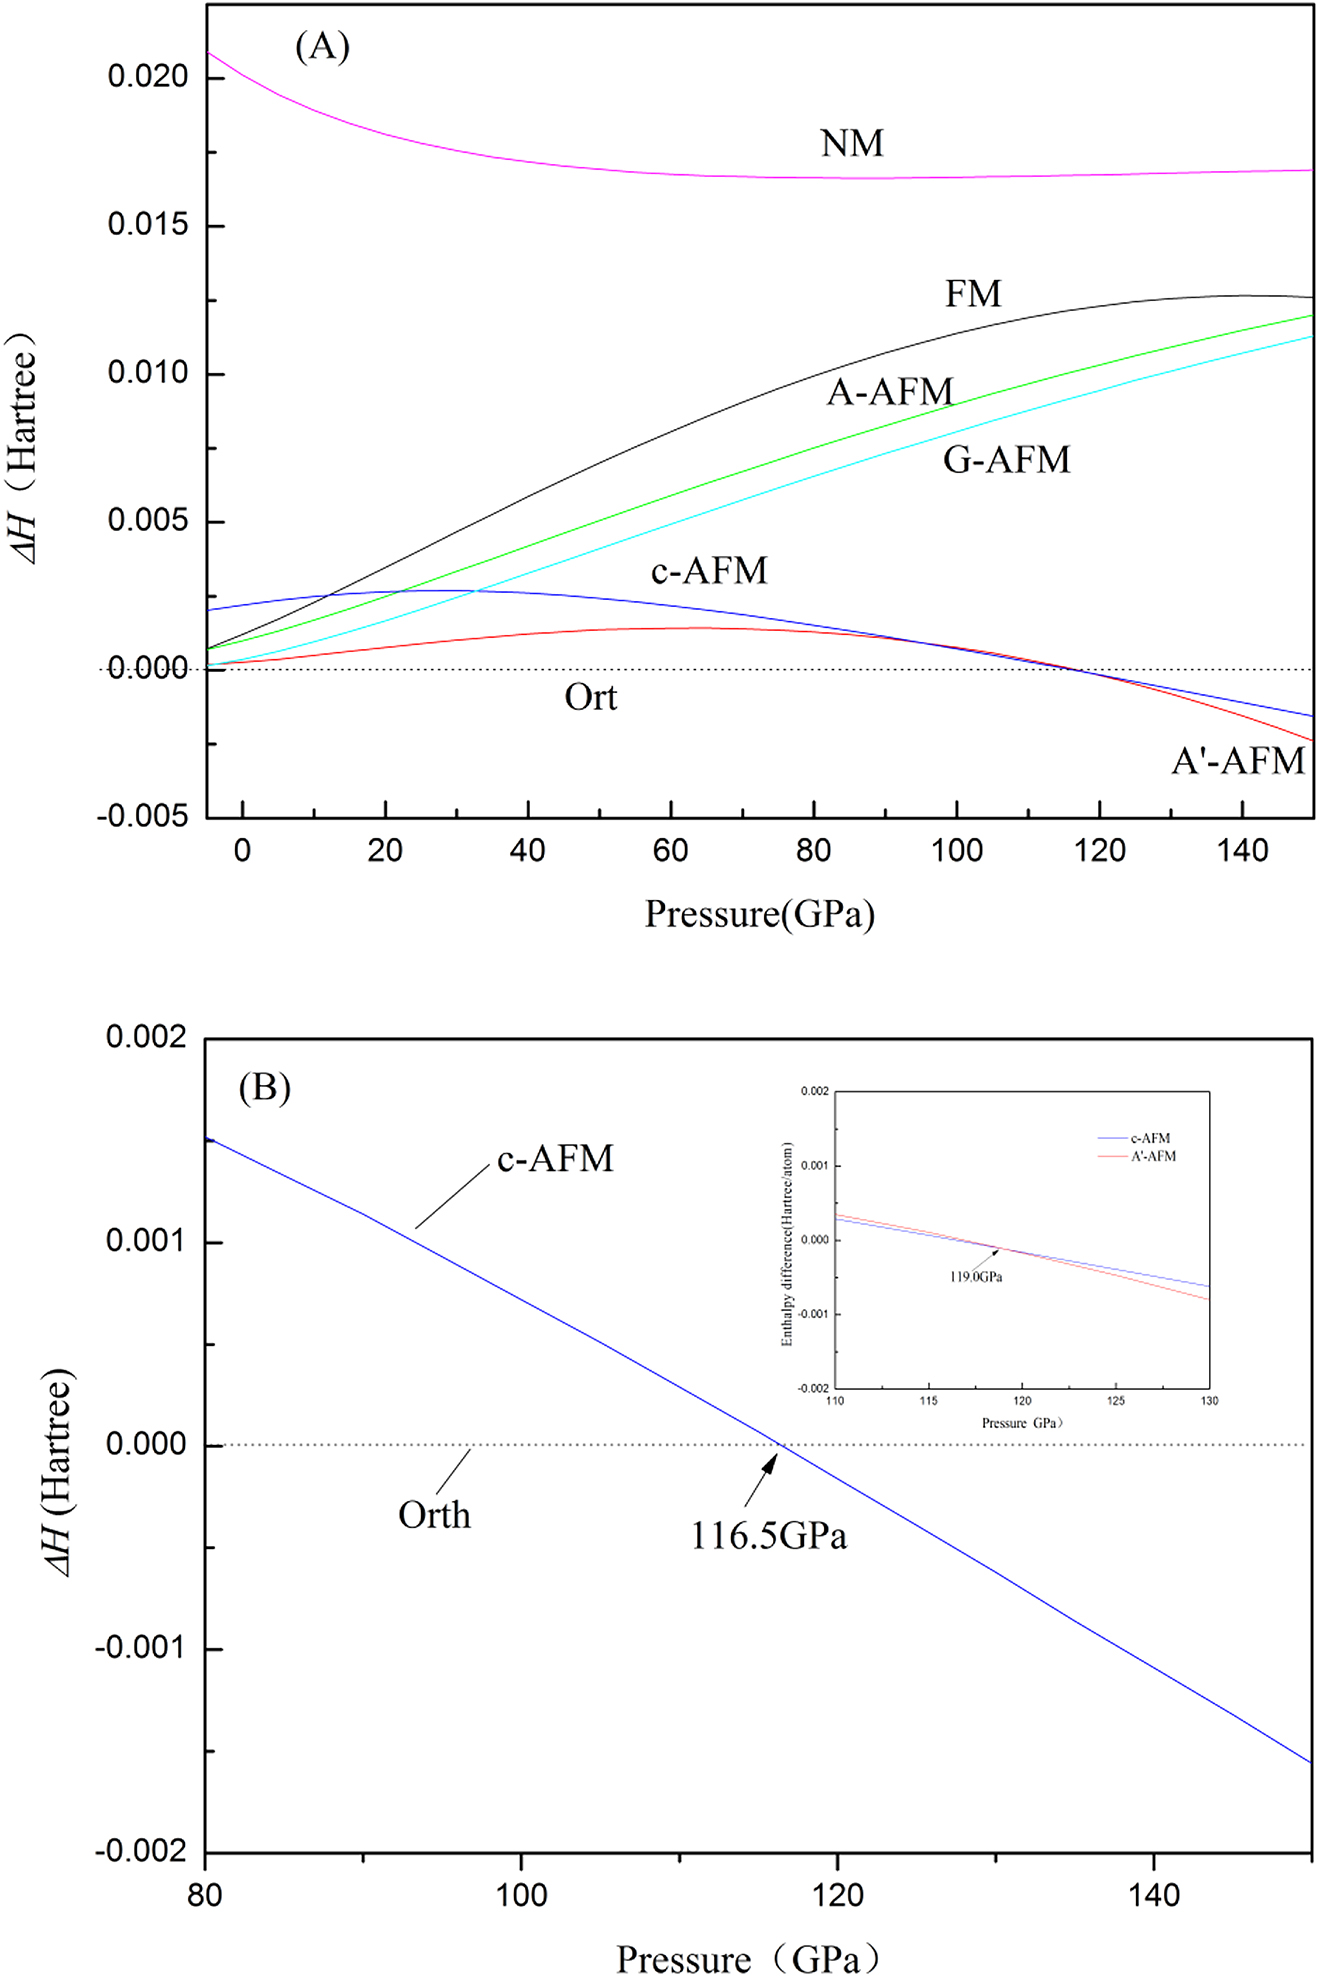
(A) The calculated enthalpy differences (ΔH) for FM, c-AFM, G-AFM, A-AFM, and A’-AFM phases with respect to Ort phase as a function of pressure. (B)The enthalpy of c-AFM, A’-AFM, and Ort phase (ΔH) as a function of pressure (P) is presented. In the inset, the enthalpy difference of c-AFM and A’-AFM as a function of pressure (P) is presented.
The total and local densities of states (DOS) for FM, Ort, c-AFM, and A’-AFM phases are displayed in Figure 3. In the FM state, strong hybridization of the Fe and Rh states in spin-up and spin-down channels is apparent, which leads to the large atomic magnetic moments: 3.21 μB for Fe and 1.05 μB for Rh. In the AFM-FeRh states (Ort, c-AFM, and A’-AFM), total majority and minority DOS and local Rh DOS for the spin-up and spin-down projections are equal, respectively, i.e., total magnetic moment and Rh magnetic moment equal to 0 μB. This result is in good agreement with the available theoretical calculations [37], [38] except for Ort phase.
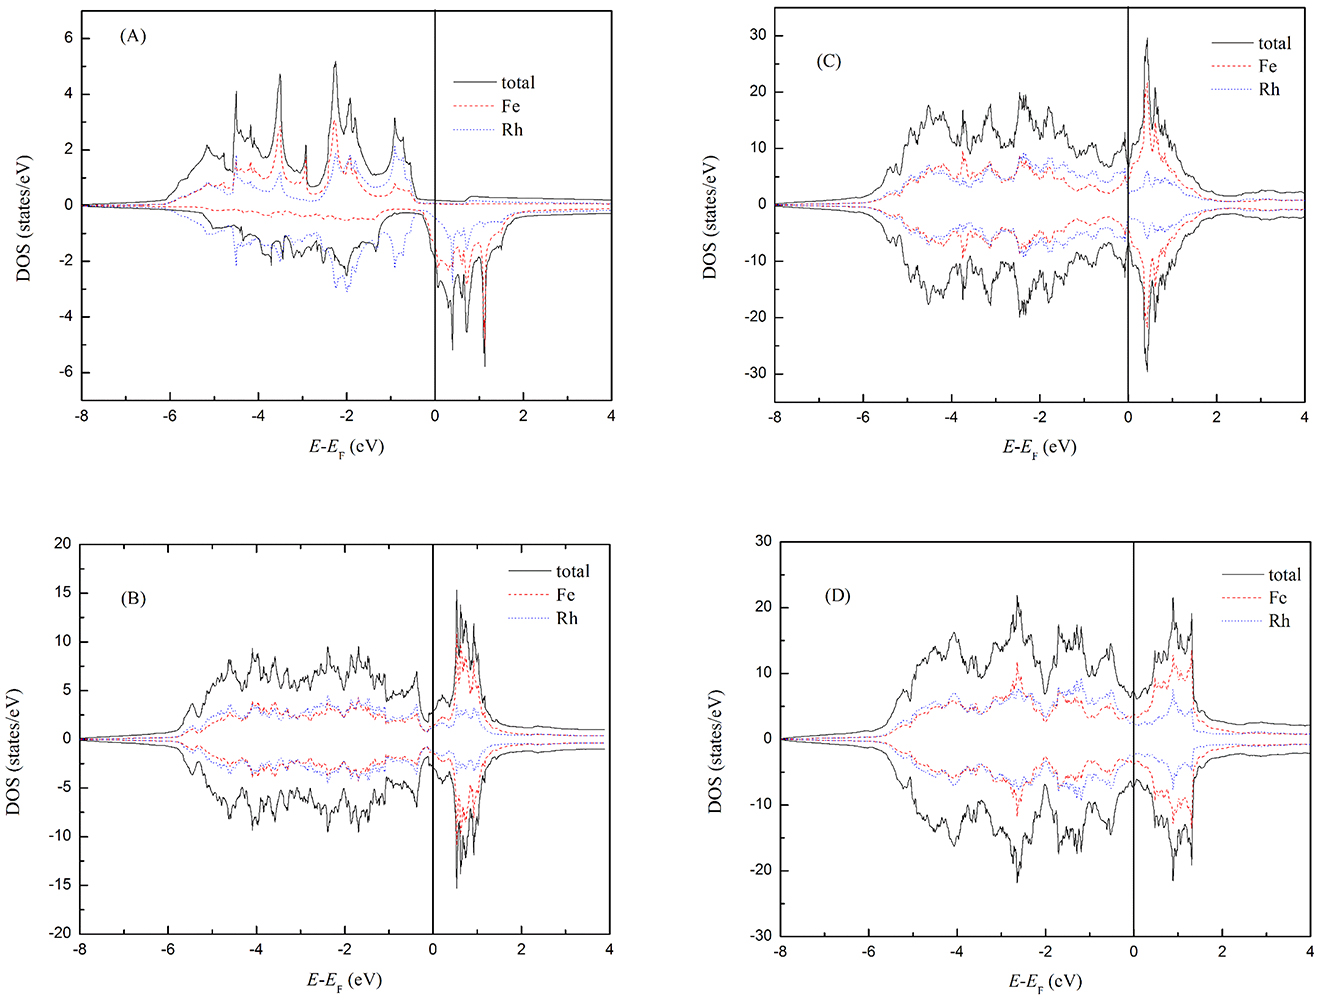
The total and local densities of states (DOS) for different phases. (A)FM-FeRh; (B)Ort-FeRh; (C) c-AFM; (D)A’-AFM, wherein EF denotes the Fermi energy.
3.2 Elastic properties
The obtained elastic constants for FM at zero and high pressures are listed in the Table 2 and together with other theoretical results [18], [39]. Obviously, our results are in good agreement with the theoretical values at zero pressure. It is found that c11, c12 and c44 have rapid linear increases under the effect of pressure and c44 increases moderately. The conditions for the mechanical stability of crystal have been explained by sin’ko [30]:
Elastic constants of FM at different pressures.
| P (GPa) | c11 | c12 | c44 | B | G | RG/B | σ | |
|---|---|---|---|---|---|---|---|---|
| This work | 0 | 259.1 | 162.5 | 110.9 | 194.7 | 79.4 | 0.408 | 0.3204 |
| 5 | 287.4 | 182.1 | 119.1 | 217.2 | 85.8 | 0.395 | 0.3254 | |
| 10 | 310.0 | 200.6 | 129.9 | 237.1 | 91.8 | 0.387 | 0.3285 | |
| 15 | 325.7 | 216.9 | 140.5 | 253.2 | 96.1 | 0.380 | 0.3316 | |
| 20 | 341.9 | 233.5 | 155.2 | 269.6 | 101.9 | 0.378 | 0.3322 | |
| Ref. [39] | 0 | 278.3 | 179.4 | 110.2 | 194.9 | |||
| Ref. [18] | 0 | 251.6 | 164.2 | 109.8 | 193.3 |
For cubic structure, we have
So we can judge that FM-FeRh is mechanically stable in the range of pressure considered.
From elastic constants, the isotropic aggregate bulk modulus B and shear modulus G can be obtained according to the Voigte-Reusse-Hill (VRH) average scheme [40]. For cubic crystals, the relationship between bulk modulus B and elastic constants is
The shear modulus G are expressed as (In the following formulas, subscript v denotes the Voigt bound, r denotes the Reuss bound)
Hence, Hill bulk modulus and shear modulus are
Thus, the isotropically averaged aggregate velocities for compressional (υP) and shear waves (υS) are written as
The average velocities approximately is given by [41]
Figure 4 presents the pressure dependence of bulk modulus, shear modulus, compressional velocities (υP), shear waves velocities (υS) and average velocities (υm). One noted that the bulk modulus, shear modulus, and velocities (υP, υS, υm) show a linear increase with increasing pressure. Our bulk modulus at zero GPa is 194.7 GPa, which agree well with the results of 194.9 GPa by He et al. [39] and 193.3 GPa by Aschauer et al. [18]. The obtained compressional velocities (υP), shear waves velocities (υS) are 2.878 and 5.598 km/s at 0 GPa, which are in excellent agreement with the experimental values [42], [43].
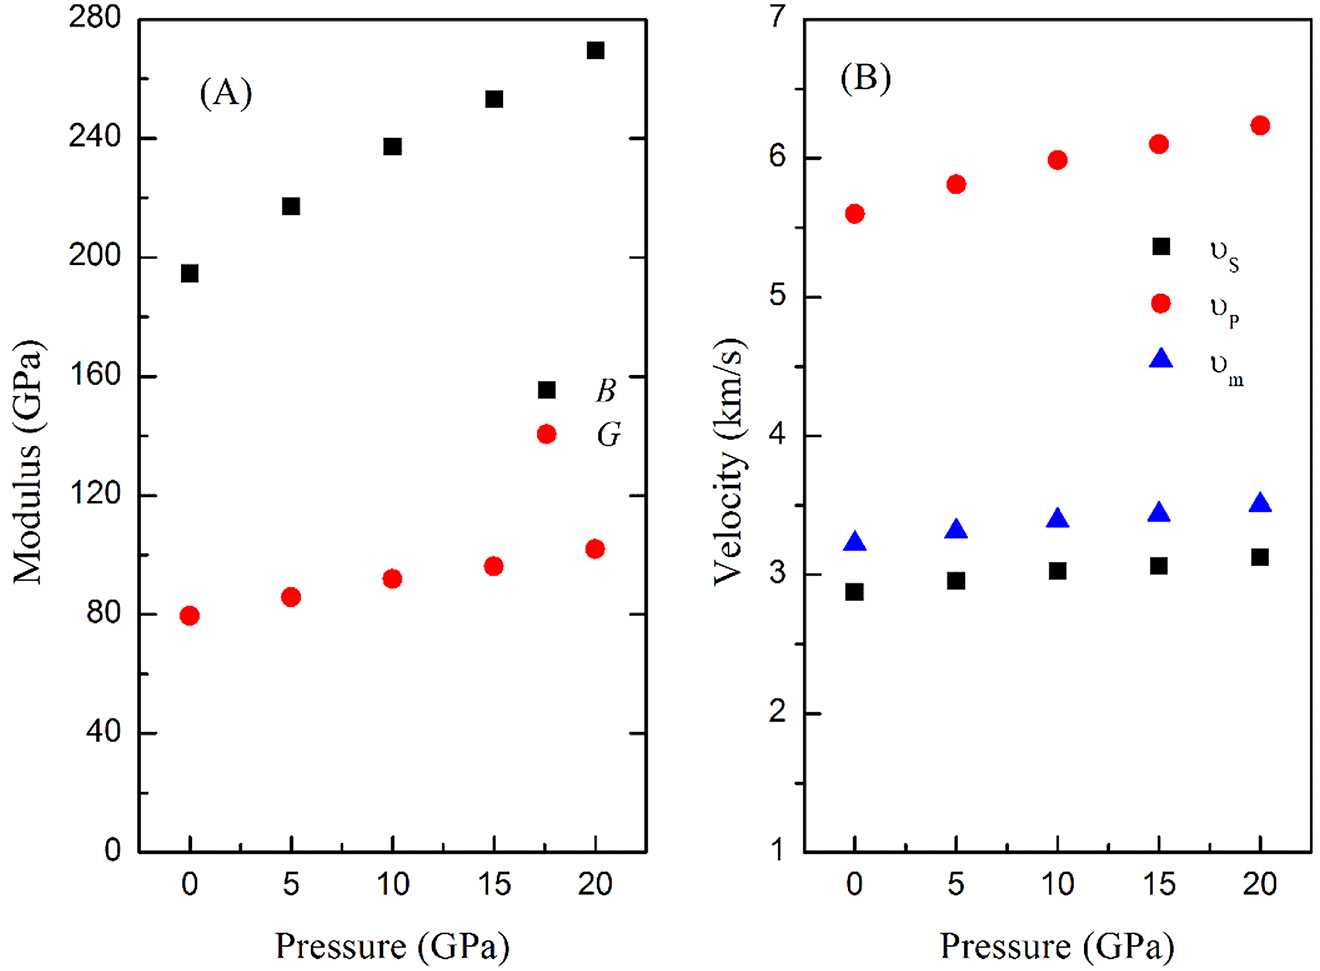
(A) Pressure dependence of bulk modulus and shear modulus in FM-FeRh (B) Predicted compressional and shear wave velocities and average velocities of the FM-FeRh as a function of pressure.
According to Pugh criteria, G/B ratio (RG/B) of 0.5 separates ductile and brittle materials. If RG/B < 0.5, the material behaves in a ductile manner, otherwise the material behaves in a brittle manner. The calculated G/B values for FM-FeRh are less than 0.5 at 0 GPa and decreases as the pressure increasing. This indicates that higher pressure can improve the ductility of FM-FeRh. It is known that Poisson’s ratio is associated with the volume change during uniaxial deformation, which usually ranges from −1 to 0.5. Poisson’s ratio σ is expressed as
The larger the Poisson ratio, the better the plasticity [44]. For FM, the Poisson’s ratio increases under the effect on pressure, which implies that the plasticity can be enhanced by pressure.
3.3 Thermodynamic properties
The predicted phonon dispersions at 0 K for FM-FeRh are shown in Figure 5. It is observed that FM-FeRh is stable at 0 K since all phonon modes have real frequencies in the entire Brillouin zone. As discussed by Kim, Ramesh and Kioussis [19], the low-frequency acoustical branches are related with the displacements of both Fe and Rh atoms, while the optical branches and high-frequency acoustical branches are mainly related with Fe and Rh displacements, respectively. Unfortunately, there are not yet experimental data on phonon dispersions of FM-FeRh to compare with our calculated results
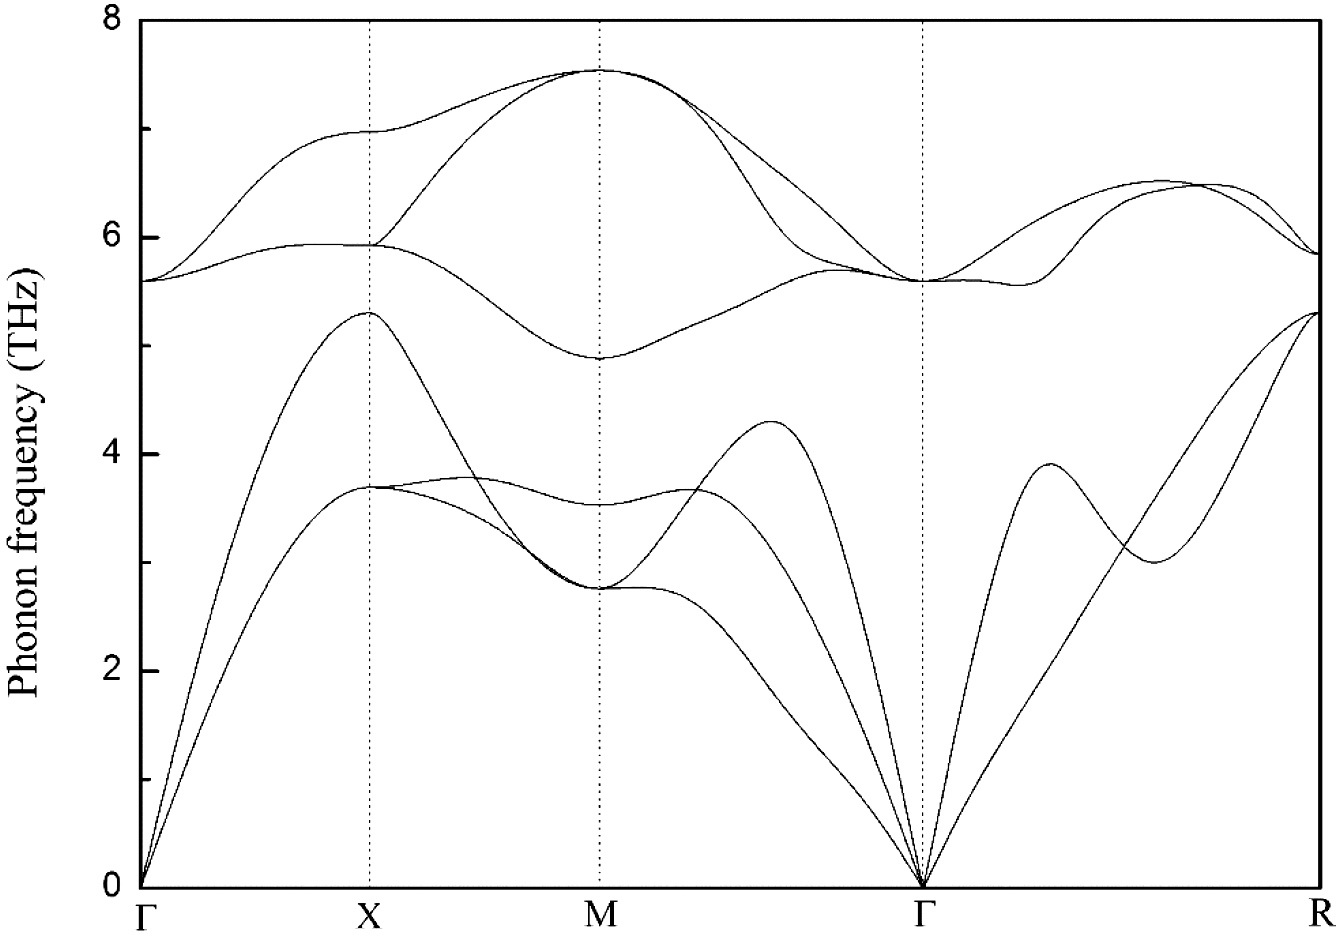
Predicted phonon dispersions for FM-FeRh at zero temperature equilibrium volume.
Figure 6 plots the Helmholtz free energy of FM-FeRh versus volume at different temperatures. The equilibrium volumes with minimum free energy are derived from fitting curves of the BM fourth equation of states [33], [34]. The dot line with circles connecting the minimum energy shows the lattice equilibrium volume becomes larger with the application of temperature.
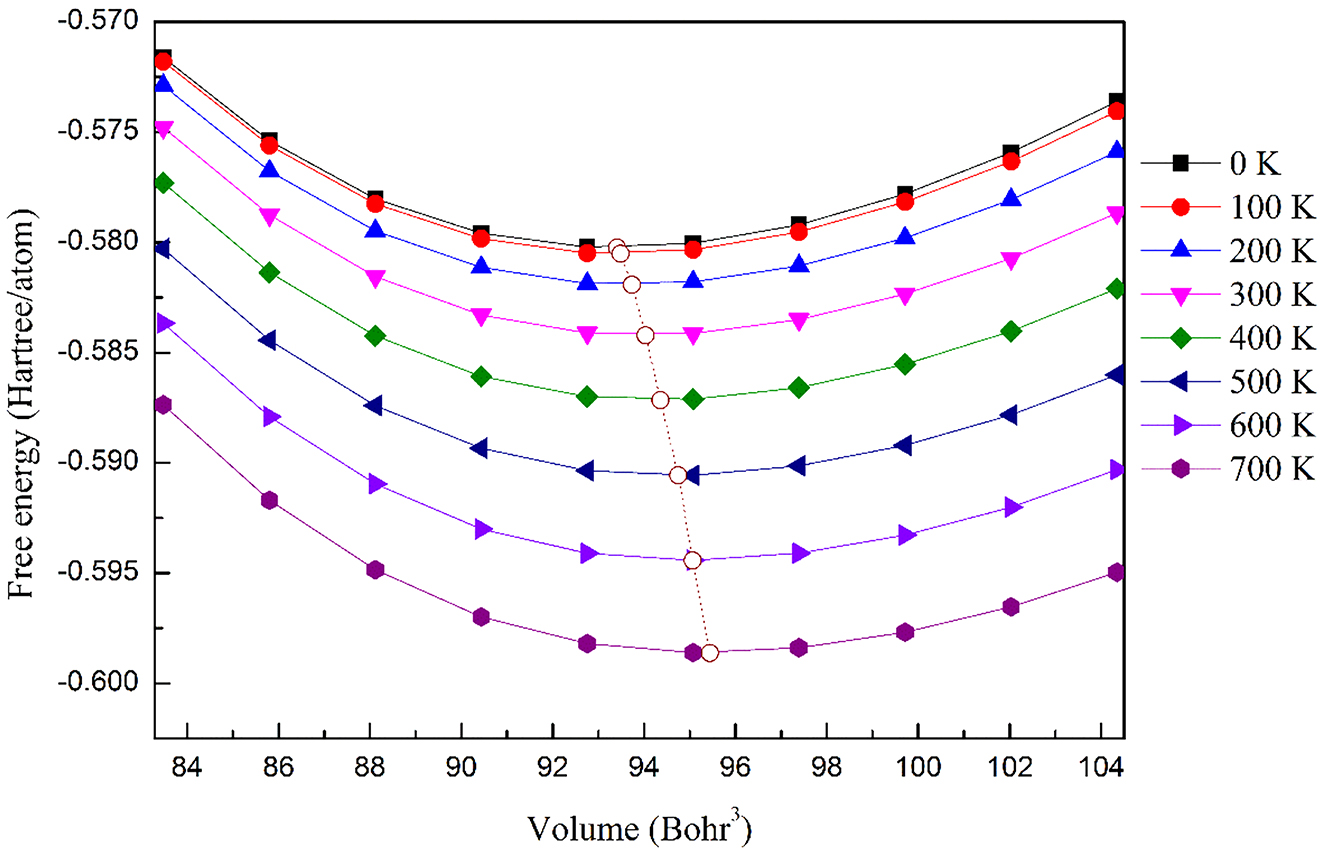
The relations between Helmholtz free energy and volume for FM-FeRh. The dot line connects points (circles) of minimum of free energy at each temperature. Here, volume is equal to the volume of primitive cell divided by number of atoms.
The relation between the ratios of relative volume V/V0 and pressure at several temperatures are displayed in Figure 7. The relative volume V/V0 decrease with the increasing pressure at given temperature. Similarly, the relative volume V/V0 decrease with the rise of temperature at given pressure, which indicate the compressibility increases at high temperature due to more intense molecular thermal motion.
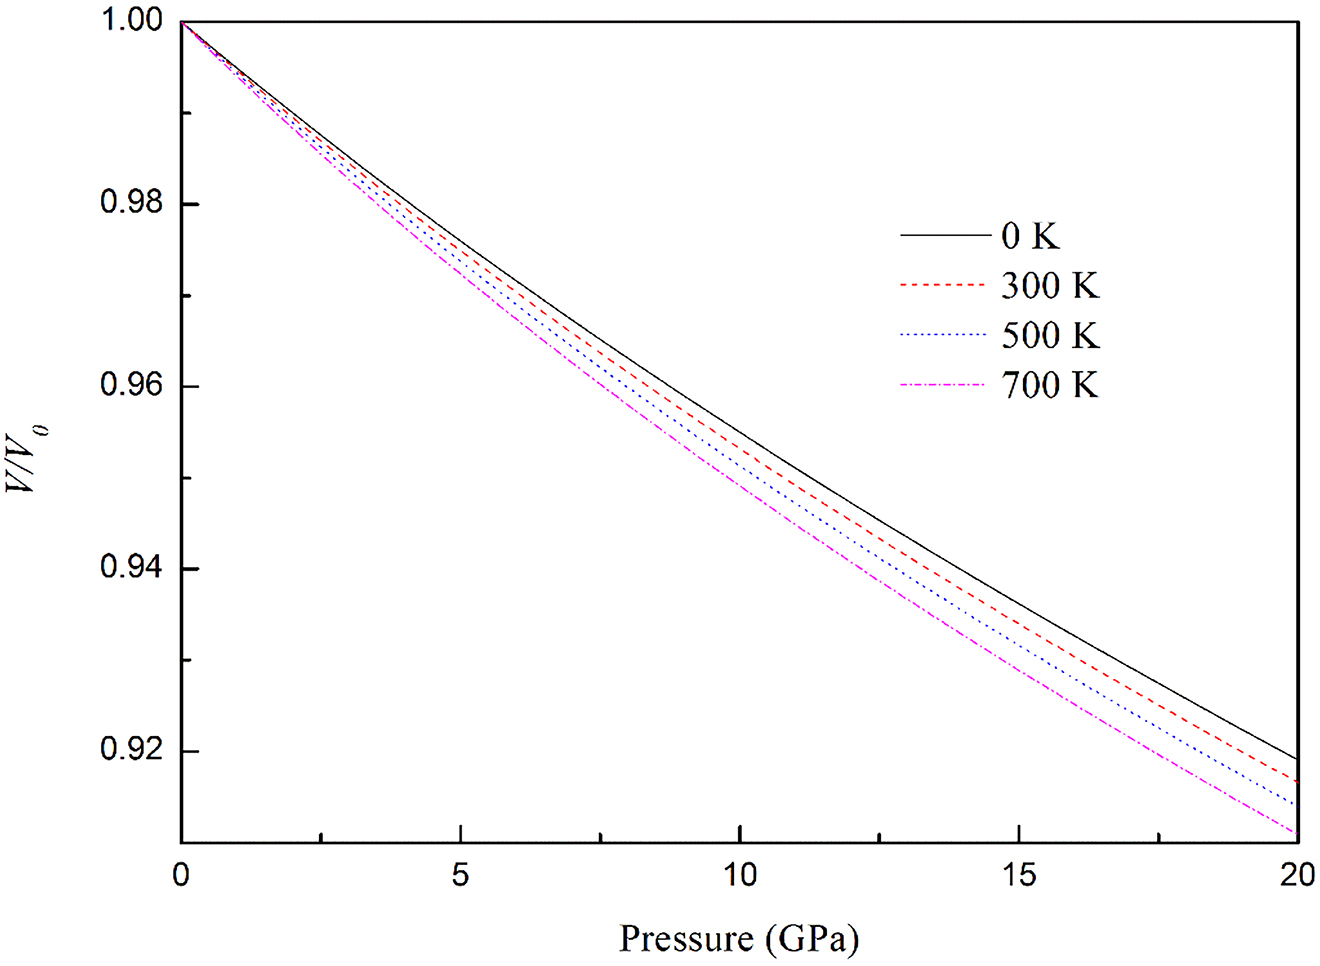
The relative volume V/V0 as a function of pressure, where V0 is zero-pressure equilibrium primitive cell volume at that temperature and V is volume of primitive cell at that pressure and that temperature.
The volume thermal expansion coefficients at different temperatures and pressures are presented in Figure 8. The thermal expansion α changes rapidly when T < 300 K and P < 10 GPa and approaches gradually to almost a linear increase at T > 300 K. In Figure 8A, the difference of α at 0 and 5 GPa is larger than the difference of a at 5 and 10 GPa. In Figure 8B, the higher the temperature, the smaller the change in volumetric thermal expansion α at given pressure. Linear thermal expansion coefficient is defined as
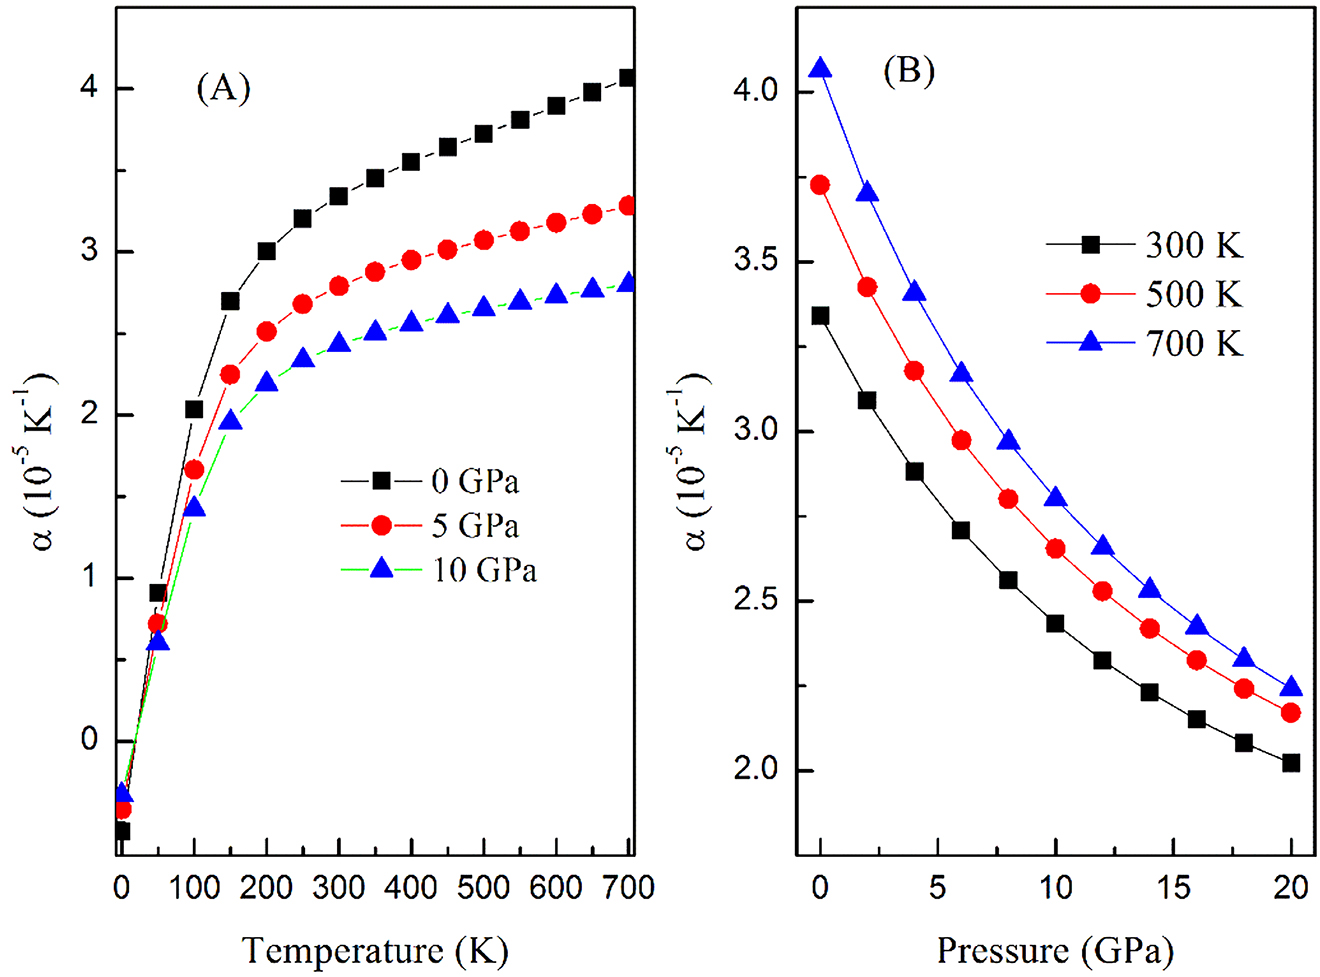
The thermal expansion versus temperature and pressure.
Figure 9 depicts the temperature dependence of specific heat CV at different volumes. As volume expansion, specific heat CV increases at given temperature. This is caused by Helmholtz free energy. As shown in Figure 10, Helmhotz free energy increases with increasing volume at given temperature. The variation curves of specific heat CV with temperature T at 0 GPa of FM-FeRh are displayed in Figure 11. For the thermal electronic contributions to specific heat is small when temperature is lower and lattice vibration make the dominant contribution to specific heat. As the temperature increases, thermal electronic contributions to specific heat increases and is not negligible at high temperature. It is also found the vibrational CV tends to the classical constant 3R with the increasing temperature. This is analogue to those of other metal materials [46].
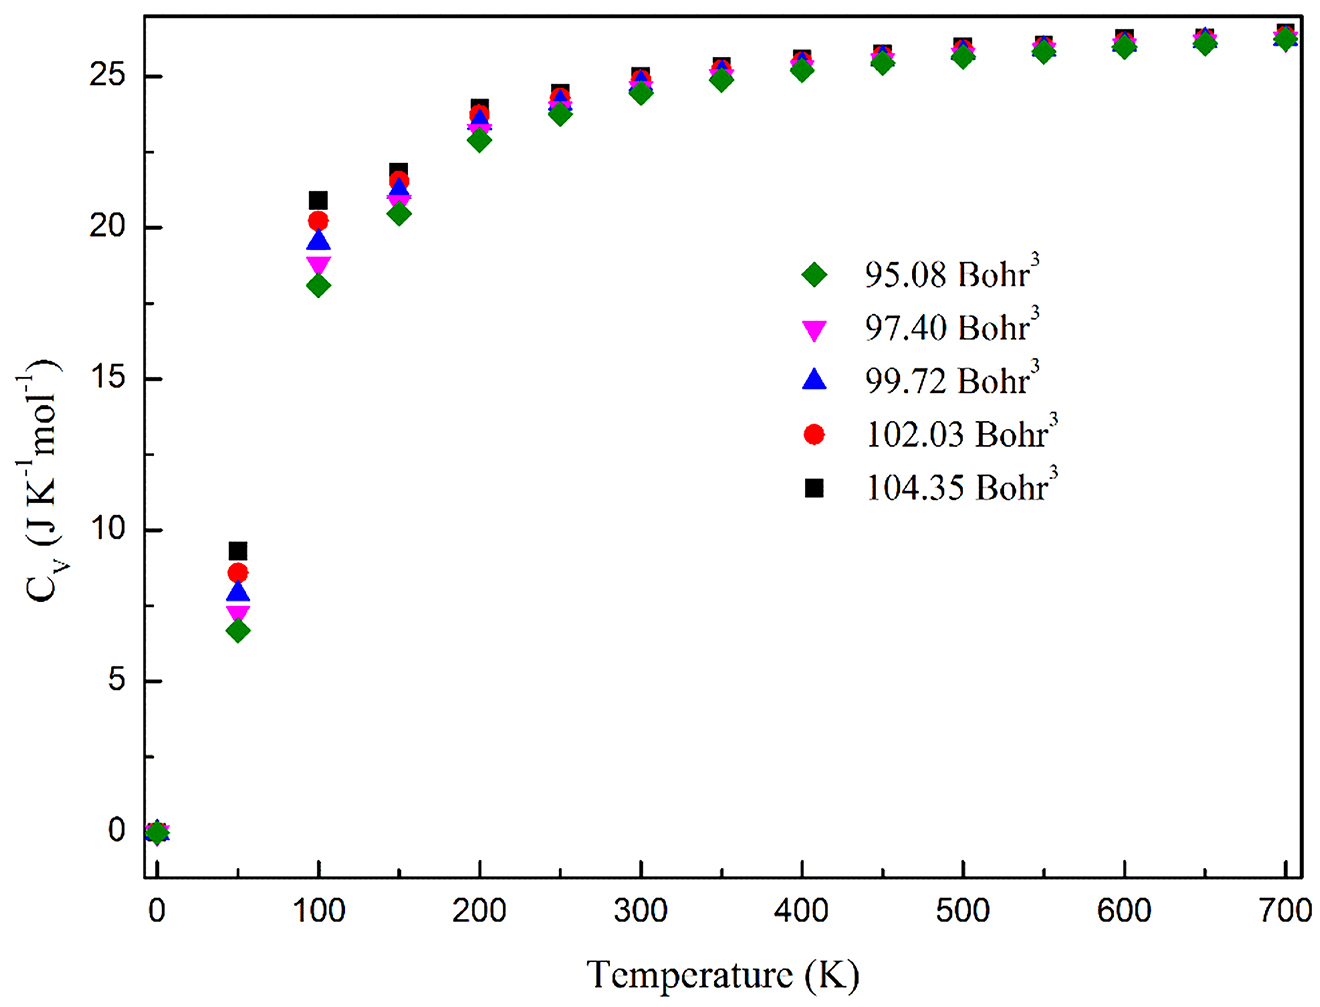
Specific heat CV as a function of temperature at various volumes. Here, volume is equal to the volume of primitive cell divided by number of atoms.
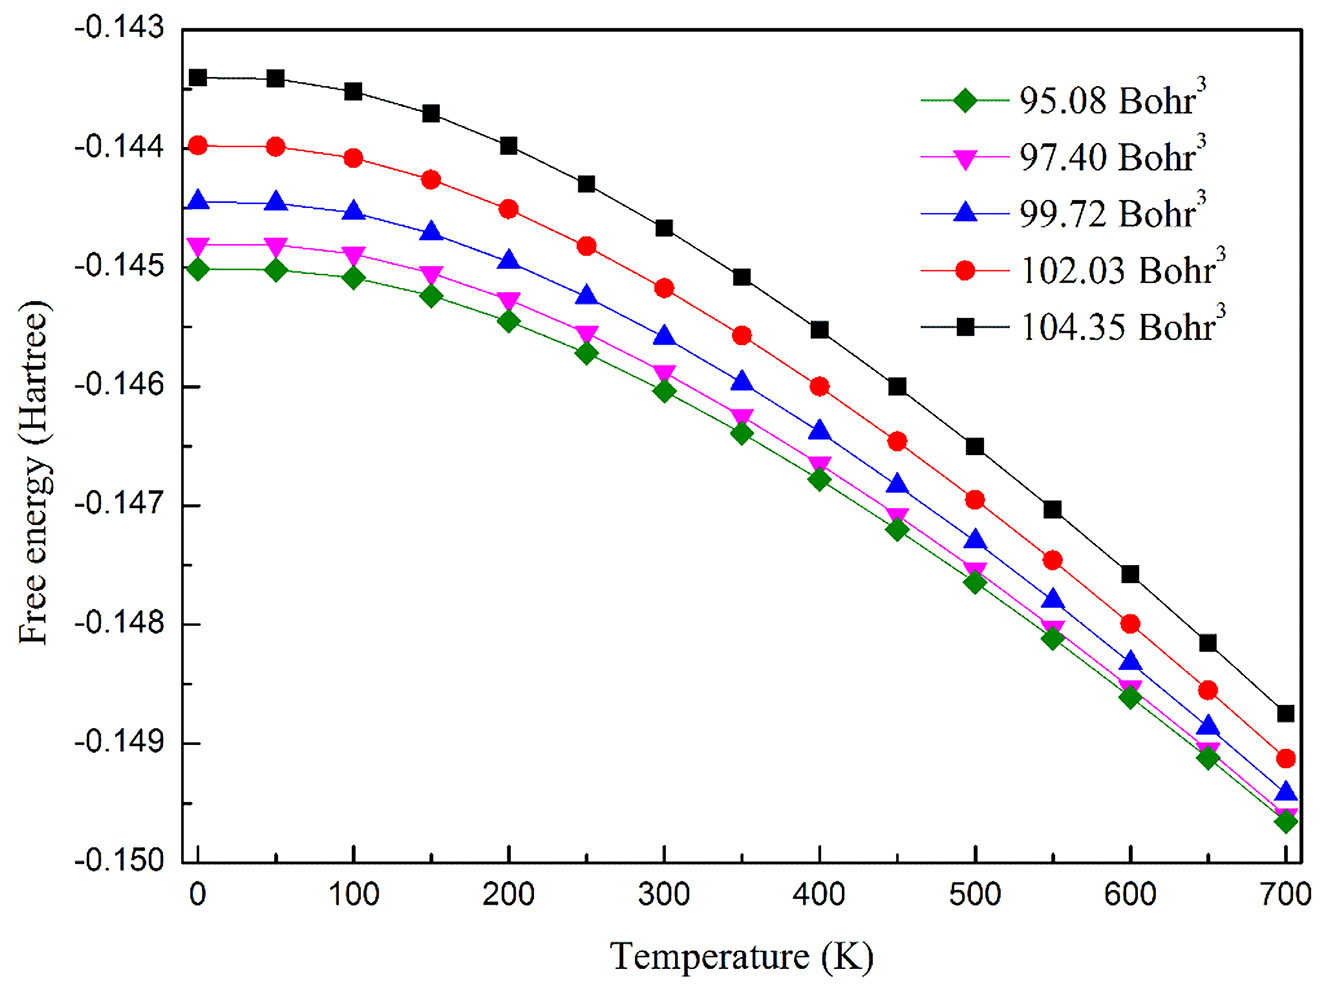
Helmhotz free energy against temperature at several volume (volume is equal to the volume of primitive cell divided by number of atoms).
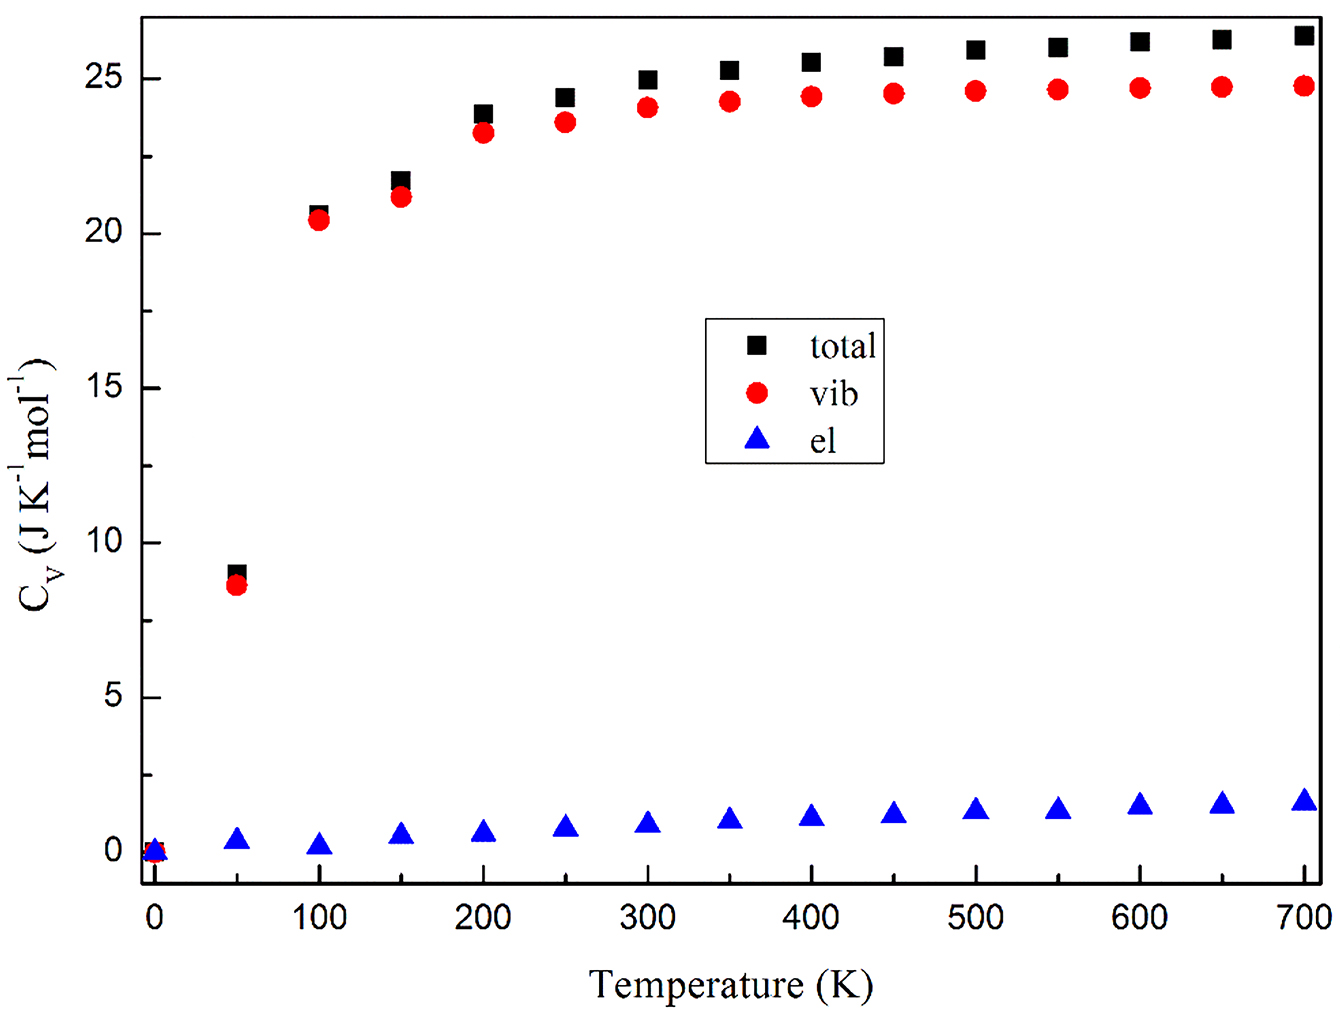
Specific heat CV at zero pressure for the FM-FeRh. Squares, circles and triangles represent total, vibrational and electronic Cv, respectively.
3.4 Thermal conductivity
The electrical conductivity for FM-FeRh is shown in Figure 12. The electrical conductivity decreases with the increasing temperature. This is related to the increased electron-phonon scattering with temperature. At 300 K, the electrical conductivity is 6.32 × 10⁶ (Ωm)−1 i.e., the electrical resistivity is 15.8 μΩcm, which is in good agreement with the experimental value of 13.4 μΩcm [47].
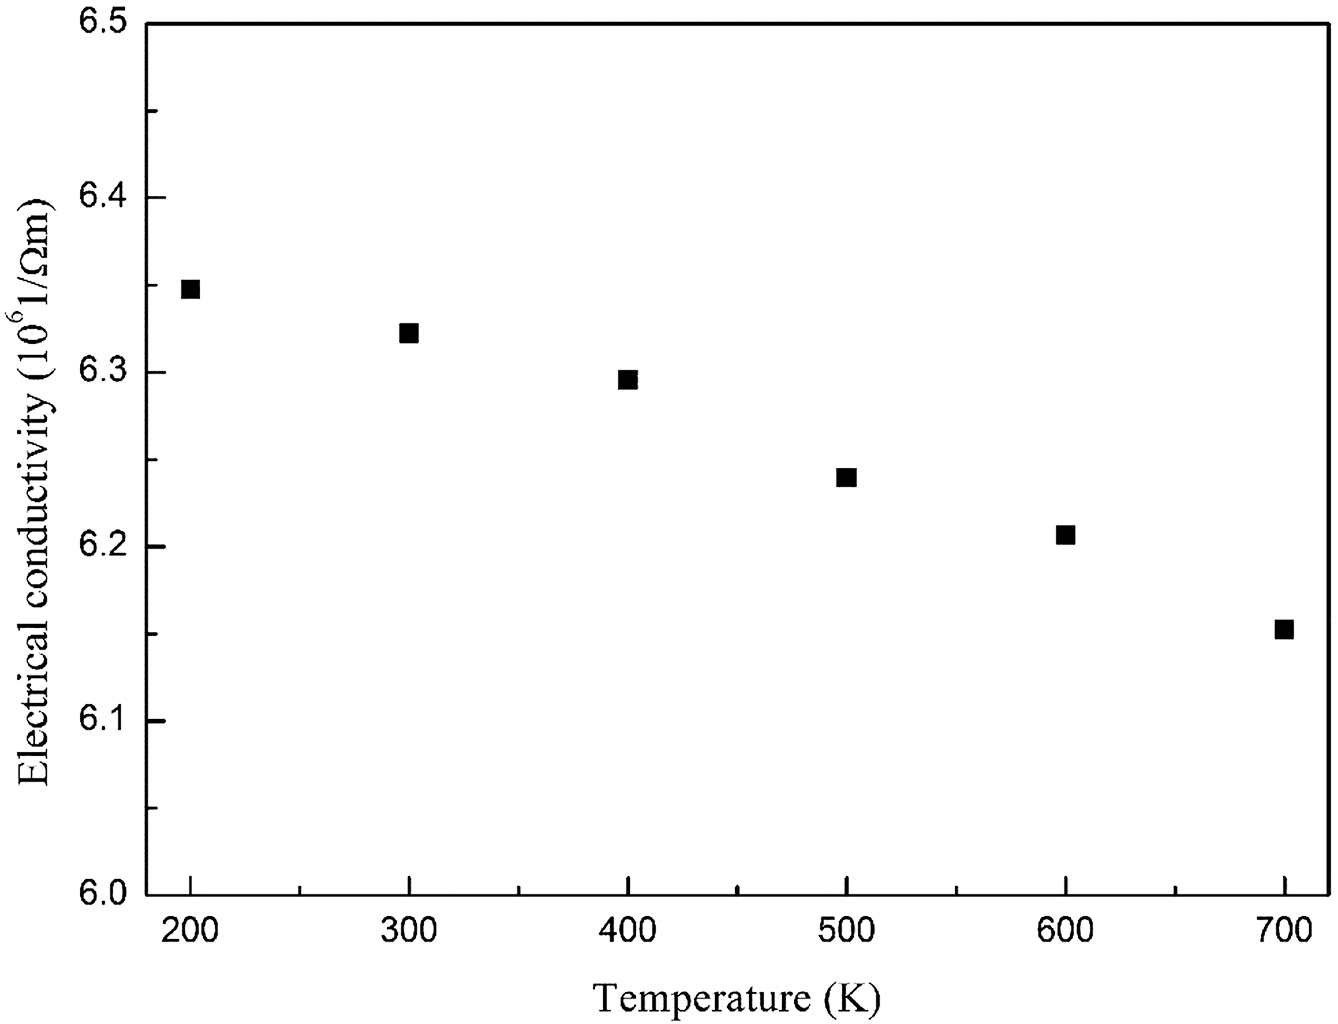
Temperature dependence electrical conductivity for FM-FeRh at μ = Ef, where μ and Ef are chemical potential and Fermi energy, respectively.
The thermal conductivity as a function of temperature for FM-FeRh is depicted in Figure 13. The electronic thermal conductivity is 56.43 W/mK at 200 K, and then increase linearly with temperature and the value increase to 107.59 W/mK at 700 K. It is noted that the lattice thermal conductivity KL decreases exponentially with increasing temperature, this mainly results from the increasing phonon–phonon scattering with temperature. Whereas, KL tends to be proportional to 1/T at high temperature. We also noted that the phonon boundary scattering has no effect on lattice thermal conductivity within a consideration temperature range and the total thermal conductivity increases monotonically as temperature increasing. When the temperature increases from 200 to 700 K, the contribution rate of electrons to the total thermal conductivity increases from 55.6 to 93.6%. It is also noted that most of the heat is carried by phonons with mean free paths ranging from 10 to 300 nm at 300 K.
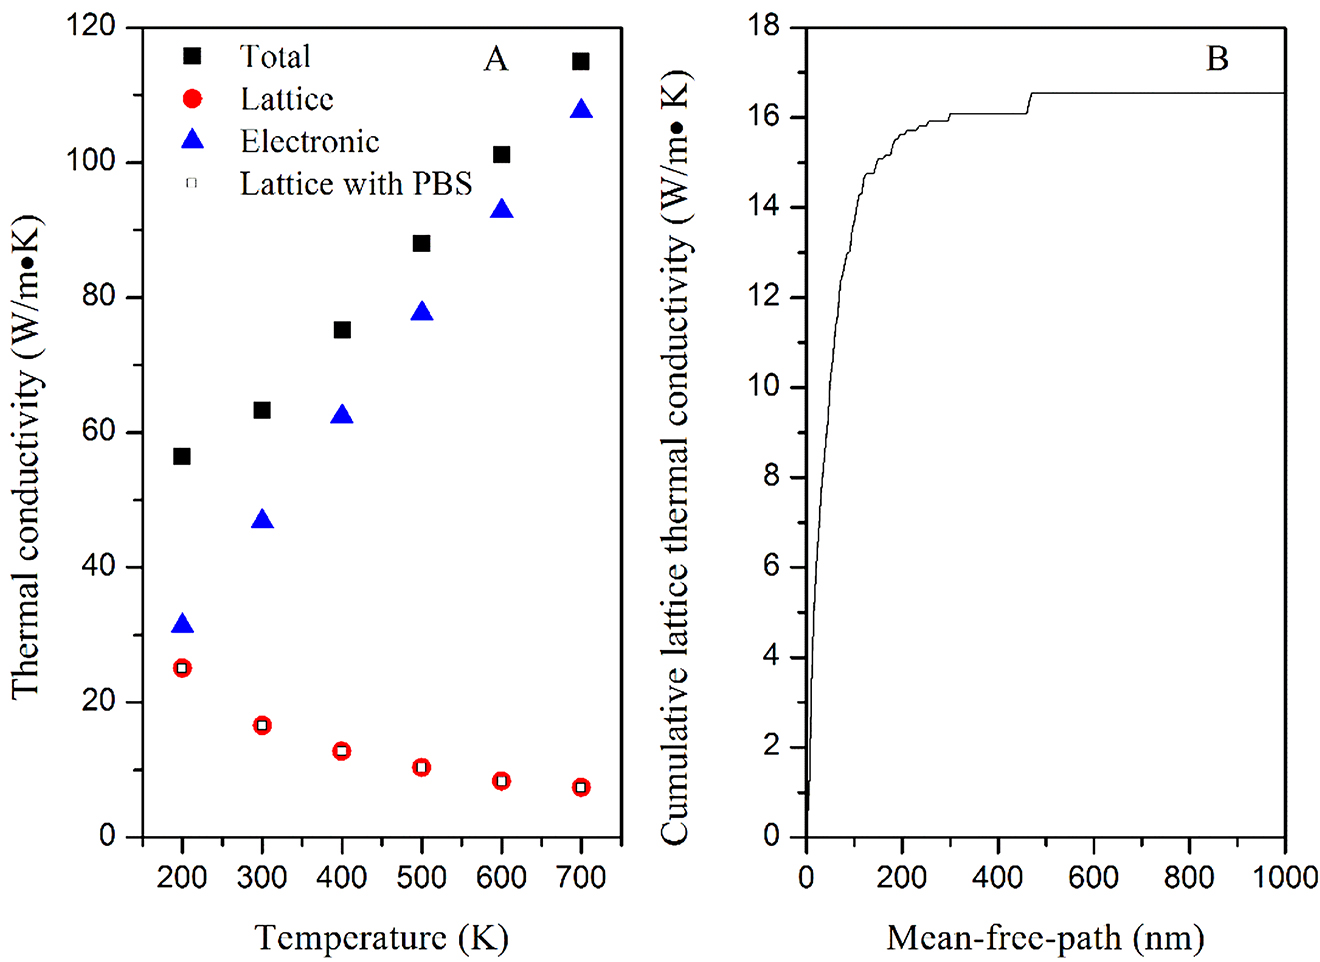
(A) The relationship between thermal conductivity of FeRh and temperature at 0 GPa. The squares, circles and triangles denote total thermal conductivity, lattice thermal conductivity and electronic thermal conductivity, respectively. The open square indicates lattice thermal conductivity with phonon-boundary scattering (PBS). (B) Cumulative lattice thermal conductivity versus phonon mean free path is presented.
Figure 14 shows thermal conductivity dependence on pressure. At given temperature, thermal conductivities (KL, Ke, KTo) increase linearly as pressure. The total thermal conductivity KTo varies between 63.4 at 0 GPa and 80.9 W/mK at 20 GPa for T = 300 K and between 117.9 and 140.9 W/mK for T = 700 K. At lower temperature, KL increases rapidly with an increase in pressure and at higher temperature, KL increases slowly under pressure. Whereas, Ke is opposite. At given pressure, KL decreases with growing the temperature. This phenomenon is due to the enhancement of intrinsic phonon–phonon scattering with temperature increasing. When temperature is constant, the contribution rate of electrons to the total thermal conductivity decreases with pressure increasing. The higher the temperature, the smaller the decrease.
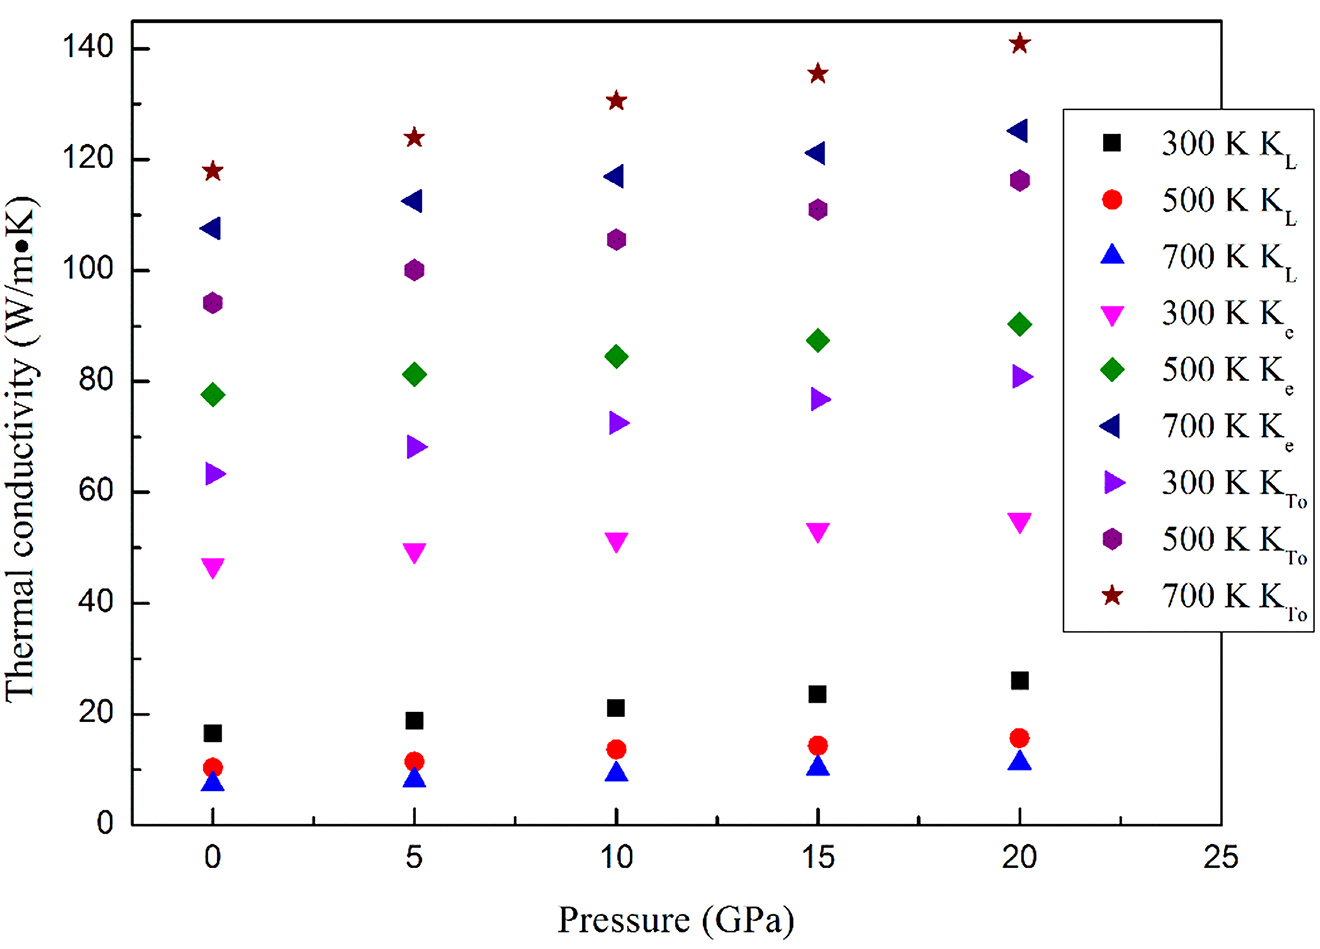
shows the thermal conductivity as a function of pressure at selected temperatures, in which KTo, KL, Ke are total thermal conductivity, lattice thermal conductivity and electronic thermal conductivity, respectively.
4 Conclusions
Through the projector augmented wave (PAW) based on density functional theory, we can draw the following conclusions.
Our equilibrium volume, lattice parameters, relative energies and magnetic moments agree well with the available experimental values and other theoretical results. Our most stable structure is Ort phase. This conclusion is in accordance with that of Zarkevich and Johnson. The phase transition of Ort → c-AFM occurs at ca. 116.5 GPa and the c-AFM to A’-AFM phase transition pressure is 119.0 GPa.
In the FM state, strong hybridization of the Fe and Rh states in spin-up and spin-down channels leads to the large atomic magnetic moments: 3.21 μB for Fe and 1.05 μB for Rh. In the AFM-FeRh states (Ort, c-AFM, and A’-AFM), total magnetic moment and Rh magnetic moment equal to 0 μB. This result is in good agreement with the available theoretical calculations except for Ort phase.
The obtained elastic constants of FM-FeRh at 0 GPa agree well with the other theoretical values. The bulk modulus, shear modulus, compressional velocities, shear waves velocities and average velocities (υm) show a linear increase with application pressure. These results are in good agreement with the available experimental and theoretical values. By analyzing G/B, FM-FeRh behaves in a ductile manner.
Through finite temperature density functional theory within the quasi-harmonic approximation, the Helmholtz free energy as a function of volume at different temperatures, the dependence of the volume on pressure at various temperatures, the dependence of volume thermal expansion coefficients on temperatures and pressures and specific heat CV vs temperature have been successfully obtained. At 300 K and 0 GPa, linear thermal expansion coefficient is 1.11 × 10⁻⁵ K−1, which is in good agreement with the experimental value of 0.95 × 10⁻⁵ K−1 and theoretical result of 1.1 × 10⁻⁵ K−1. Thermal electronic contributions to specific heat increases with the application of temperature and is not negligible at high temperature. The vibrational CV tends to the classical constant 3R with the increasing temperature.
At 300 K, the predicted electrical conductivity is 6.32 × 10⁶ (Ωm)−1 i.e., the electrical resistivity is 15.8 μΩcm, which is in good agreement with the experimental value of 13.4 μΩcm. At higher temperature, contribution rate of electrons to the total thermal conductivity dominant. Thermal conductivities (KL, Ke, KTo) increase linearly as pressure. At lower temperature, KL increases rapidly with the increasing pressure and KL has a moderate increase as increasing pressure at higher temperature. Whereas, Ke is opposite. It is found that most of the heat is carried by phonons with mean free paths ranging from 10 to 300 nm at 300 K.
Funding source: Guangxi Jiangnan District Scientific Research and Technology Development Project of China
Award Identifier / Grant number: 2019021001
Acknowledgements
The authors are thankful to the reviewers of the manuscript for their valuable comments and prof. Jianzhou Zhao for his helpful assistance. The Peac Institute of Multiscale Sciences is also highly acknowledged.
Author contribution: All the authors have accepted responsibility for the entire content of this submitted manuscript and approved submission.
Research funding: This research was funded by the Guangxi Jiangnan District Scientific Research and Technology Development Project of China (2019021001).
Conflict of interest statement: The authors declare no conflicts of interest regarding this article.
References
[1] A. Chirkova, K. P. Skokov, L. Schultz,N.V. Baranov, O. Gutfleisch, and T. G. Woodcock, “Giant adiabatic temperature change in FeRh alloys evidenced by direct measurements under cyclic conditions,” Acta Mater., vol. 106, p. 15, 2016, https://doi.org/10.1016/j.actamat.2015.11.054.Search in Google Scholar
[2] V. I. Zverev, A. M. Saletsky, R. R. Gimaev, A.M. Tishin, T. Miyanaga, and J. B. Staunton, “Influence of structural defects on the magnetocaloric effect in the vicinity of the first order magnetic transition in Fe50.4Rh49.6,” Appl. Phys. Lett., vol. 108, no. 19, 2016, Art no. 192405, https://doi.org/10.1063/1.4949355.Search in Google Scholar
[3] E. Stern-Taulats, A. Gracia-Condal, A. Planes, et al., “Reversible adiabatic temperature changes at the magnetocaloric and barocaloric effects in Fe49Rh51,” Appl. Phys. Lett., vol. 107, no. 15, 2015, Art no. 152409, https://doi.org/10.1063/1.4933409.Search in Google Scholar
[4] J. U. Thiele, S. Maat, and E. E. Fullerton. “FeRh/FePt exchange spring films for thermally assisted magnetic recording media,” Appl. Phys. Lett., vol. 82, no, 17, p. 2859, 2003, https://doi.org/10.1063/1.1571232.Search in Google Scholar
[5] G. P. Ju, J. Hohlfeld, B. Bergman, “Ultrafast generation of ferromagnetic order via a laser-induced phase transformation in FeRh thin films,” Phys. Rev. Lett., vol. 93, no. 19, p. 197403, 2004, https://doi.org/10.1103/physrevlett.93.197403.Search in Google Scholar
[6] X. Marti, I. Fina, C. Frontera, et al., “Room-temperature antiferromagnetic memory resistor,” Nat. Mater., vol. 13, no. 4, p. 367, 2014, https://doi.org/10.1038/nmat3861.Search in Google Scholar PubMed
[7] M. Fallot, “Les alliages du fer avec les métaux de la famille du platine,” Ann. Phys., vol. 10, no. 10, p. 291, 1938, https://doi.org/10.1051/anphys/193811100291.Search in Google Scholar
[8] J. S. Kouvel, and C. C. Hartelius, “Anomalous magnetic moments and transformations in the ordered alloy FeRh,” J. Appl. Phys., vol. 33, no. 3, p. 1343, 1962, https://doi.org/10.1063/1.1728721.Search in Google Scholar
[9] G. Shirane, C. W. Chen, P. A. Flinn, and R. Nathans, “Mössbauer study of hyperfine fields and isomer shifts in the Fe-Rh alloys,” Phys. Rev., vol. 131, no. 1, p. 183, 1963, https://doi.org/10.1103/physrev.131.183.Search in Google Scholar
[10] J. S. Kouvel, “Unusual nature of the abrupt magnetic transition in FeRh and its pseudobinary variants,” J. Appl. Phys., vol. 37, no. 3, p. 1257, 1966, https://doi.org/10.1063/1.1708424.Search in Google Scholar
[11] F. D. Bergevin, L. Muldawer, and C. R. Hebd, “Étude cristallographique de certains alliage fer-rhodium,” Seances Acad. Sci., vol. 252, p. 1347, 1961.Search in Google Scholar
[12] V. Kuncser, R. Nicula, U. Ponkratz, et al., “Structural phase transition induced in Fe50Rh50 alloys by high pressure,” J. Alloys Compd., vol. 386, no. 1, p. 8, 2005, https://doi.org/10.1016/j.jallcom.2004.04.139.Search in Google Scholar
[13] C. Koenig. “Self-consistent band structure of paramagnetic, ferromagnetic and antiferromagnetic ordered FeRh,” J. Phys. F Met. Phys., vol. 12, no. 13, p. 1123, 1982, https://doi.org/10.1088/0305-4608/12/6/013.Search in Google Scholar
[14] V. L. Moruzzi, and P. M. Marcus, “Antiferromagnetic-ferromagnetic transition in FeRh,”Phys. Rev. B, vol. 46, no. 5, p. 2864, 1992, https://doi.org/10.1103/physrevb.46.2864.Search in Google Scholar PubMed
[15] M. E. Gruner, E. Hoffmann, and P. Entel, “Instability of the rhodium magnetic moment as the origin of the metamagnetic phase transition in α−FeRh,” Phys. Rev. B, vol. 67, no. 6, 2003, Art no. 064415, https://doi.org/10.1103/physrevb.67.064415.Search in Google Scholar
[16] R. Y. Gu, and V. P. Antropov, “Earth matter density uncertainty in atmospheric neutrino oscillations,” Phys. Rev. B, vol. 72, no. 9, 2005, Art no. 012403, https://doi.org/10.1103/physrevb.72.012403.Search in Google Scholar
[17] M. Rajagopalan, “Structural phase transition induced by pressure in the ordered alloy FeRh,” Int. J. Mod. Phys. B, vol. 19, no. 21, p. 3389, 2005, https://doi.org/10.1142/s0217979205032164.Search in Google Scholar
[18] U. Aschauer, R. Braddell, S. A. Brechbuhl, P. M. Derlet, and N. A. Spaldin, “Strain-induced structural instability in FeRh, “Phys. Rev. B, vol. 94, no. 1, 2016, Art no. 014109, https://doi.org/10.1103/physrevb.94.014109.Search in Google Scholar
[19] J. Kim, R. Ramesh, and N. Kioussis, “Time-dependent probability density function in cubic stochastic processes,” Phys. Rev. B, vol. 94, no. 5, p. 180407, 2016, https://doi.org/10.1103/physrevb.94.180407.Search in Google Scholar
[20] M. Wolloch, M. E. Gruner, W. Keune, et al., “Impact of lattice dynamics on the phase stability of metamagnetic FeRh: Bulk and thin films,” Phys. Rev. B, vol. 94, no. 17, p. 174435, 2016.10.1103/PhysRevB.94.174435Search in Google Scholar
[21] N. A. Zarkevich, and D. D. Johnson, “FeRh ground state and martensitic transformation,” Phys. Rev. B, vol. 97, no. 1, 2018, Art no. 014202, https://doi.org/10.1103/physrevb.97.014202.Search in Google Scholar
[22] G. Kresse, and J. Furthmuller, “Efficient iterative schemes forab initiototal-energy calculations using a plane-wave basis set,” Phys. Rev. B, vol. 54, no. 16, 1996, Art no. 11169, https://doi.org/10.1103/physrevb.54.11169.Search in Google Scholar
[23] G. Kresse, and J. Furthmuller, “Efficiency of ab-initio total energy calculations for metals and semiconductors using a plane-wave basis set,”Comput. Mater. Sci., vol. 6, no. 1, p. 15, 1996, https://doi.org/10.1016/0927-0256(96)00008-0.Search in Google Scholar
[24] G. Kresse, and D. Joubert, “From ultrasoft pseudopotentials to the projector augmented-wave method,” Phys. Rev. B, vol. 59, p. 1758, 1999, https://doi.org/10.1103/physrevb.59.1758.Search in Google Scholar
[25] P. E. Blochl, “Projector augmented-wave method,” Phys. Rev. B, vol. 50, no. 24, p. 17953, 1994, https://doi.org/10.1103/physrevb.50.17953.Search in Google Scholar PubMed
[26] J. P. Perdew, K. Burke, and M. Ernzerhof, “Generalized gradient approximation made simple,” Phys. Rev. Lett., vol. 77, no. 18, p. 3865, 1996, https://doi.org/10.1103/physrevlett.77.3865.Search in Google Scholar PubMed
[27] P. E. Blochl, O. Jepsen, and O. K. Andersen, “Improved tetrahedron method for Brillouin-zone integrations,” Phys. Rev. B, vol. 49, no. 23, p. 16223, 1994, https://doi.org/10.1103/physrevb.49.16223.Search in Google Scholar PubMed
[28] N. D. Mermin, “Thermal properties of the inhomogeneous electron gas,” Phys. Rev., vol. 137, no. 5, p. A1441, 1965, https://doi.org/10.1103/physrev.137.a1441.Search in Google Scholar
[29] D. Alfe, “PHON: a program to calculate phonons using the small displacement method,” Comput. Phys. Commun., vol. 180, p. 2622, 2009, https://doi.org/10.1016/j.cpc.2009.03.010.Search in Google Scholar
[30] G. V. Sin’ko, and N. A. Smirnov, “Ab initio calculations of elastic constants and thermodynamic properties of bcc, fcc, and hcp Al crystals under pressure,” J. Phys. Condens. Mat., vol. 14, p. 6989, 2002.10.1088/0953-8984/14/29/301Search in Google Scholar
[31] G. K. H. Madsen, J. Carrete, and M. J. Verstraete, “BoltzTraP2, a program for interpolating band structures and calculating semi-classical transport coefficients,” Comput. Phys. Commun., vol. 231, p. 140, 2018, https://doi.org/10.1016/j.cpc.2018.05.010.Search in Google Scholar
[32] T. Tadano, Y. Gohda, and S. Tsuneyuki, “Anharmonic force constants extracted from first-principles molecular dynamics: applications to heat transfer simulations,” J. Phys. Condens. Matter, vol. 26, no. 22, p. 225402, 2014, https://doi.org/10.1088/0953-8984/26/22/225402.Search in Google Scholar
[33] F. Birch, “Finite elastic strain of cubic crystals,”Phys. Rev., vol. 71, no. 11, p. 809, 1947, https://doi.org/10.1103/physrev.71.809.Search in Google Scholar
[34] F. Birch, “Elasticity and constitution of the Earth’s interior,” J. Geophys. Res., vol. 57, no. 2, p. 227, 1952, https://doi.org/10.1029/jz057i002p00227.Search in Google Scholar
[35] G. Shirane, C. W. Chen, R. Nathans, and P. A. Flinn, “Hyperfine fields and magnetic moments in the Fe-Rh system,” J. Appl. Phys., vol. 34, no. 4, p. 1044, 1963, https://doi.org/10.1063/1.1729362.Search in Google Scholar
[36] J. M. Lommel, and J. S. Kouvel, “Effects of mechanical and thermal treatment on the structure and magnetic transitions in FeRh,” J. Appl. Phys., vol. 38, no. 3, p. 1263, 1967, https://doi.org/10.1063/1.1709570.Search in Google Scholar
[37] L. M. Sandratskii, and P. Mavropoulos, “Magnetic excitations and femtomagnetism of FeRh: A first-principles study,” Phys. Rev. B, vol. 83, p. 174408, no. 17, 2011, https://doi.org/10.1103/physrevb.83.174408.Search in Google Scholar
[38] J. Kudrnovsky, V. Drchal, and I. Turek, “Physical properties of FeRh alloys: the antiferromagnetic to ferromagnetic transition,” Phys. Rev. B, vol. 91, no. 1, 2015, Art no. 014435, https://doi.org/10.1103/physrevb.91.014435.Search in Google Scholar
[39] W. Q. He, H. B. Huang, and X. Q. Ma, “First-principles calculations on elastic and entropy properties in FeRh alloys,” Mater. Lett., vol. 195, p. 156, 2017, https://doi.org/10.1016/j.matlet.2017.02.043.Search in Google Scholar
[40] R. Hill, “The elastic behaviour of a crystalline aggregate,” Proc. Phys. Soc. Lond. A., vol. 65, no. 5, p. 349, 1952, https://doi.org/10.1088/0370-1298/65/5/307.Search in Google Scholar
[41] O. L. Anderson, “A simplified method for calculating the debye temperature from elastic constants,” J. Phys. Chem. Solids, vol. 24, no. 7, p. 909, 1963.10.1016/0022-3697(63)90067-2Search in Google Scholar
[42] A. I. Zakharov, “Crystal lattice parameter and structural distortions in Fe-Rh alloy during phase transformations,” Fiz. Met. Metalloved., vol. 24, p. 84, 1967.Search in Google Scholar
[43] J. A. Ricodeau, and D. Melville, “Model of the antiferromagnetic-ferromagnetic transition in FeRh alloys, “J. Phys. F., vol. 2, no. 2, p. 337, 1972, https://doi.org/10.1088/0305-4608/2/2/024.Search in Google Scholar
[44] R. J. Schiltz, and J. F. Smith, “Elastic constants of some MAl2 single crystals,” J. Appl. Phys., vol. 45, no. 11, p. 4681, 1974, https://doi.org/10.1063/1.1663118.Search in Google Scholar
[45] M. R. Ibarra, and P. A. Algarabel, “Giant volume magnetostriction in the FeRh alloy,”Phys. Rev. B, vol. 50, no. 6, p. 4196, 1994, https://doi.org/10.1103/physrevb.50.4196.Search in Google Scholar PubMed
[46] Y. Z. Nie, and Y. Q. Xie, “Ab initiothermodynamics of the hcp metals Mg, Ti, and Zr,” Phys. Rev. B, vol. 75, no. 17, p. 174117, 2007, https://doi.org/10.1103/physrevb.75.174117.Search in Google Scholar
[47] C. J. Schinkel, R. Hartog, and F. H. A. M. Hochstenbach, “On the magnetic and electrical properties of nearly equiatomic ordered FeRh alloys,” J. Phys. F Metal Phys., vol. 4, no. 9, p. 1412, 1974, https://doi.org/10.1088/0305-4608/4/9/013.Search in Google Scholar
© 2020 Walter de Gruyter GmbH, Berlin/Boston
Articles in the same Issue
- Frontmatter
- Atomic, molecular & chemical physics
- Systematic calculations of energy levels and transitions rates in Mo XXVIII
- Dynamical systems & nonlinear phenomena
- Gap solitons supported by an optical lattice in biased photorefractive crystals having both the linear and quadratic electro-optic effect
- Hydrodynamics
- Permanent solutions for some oscillatory motions of fluids with power-law dependence of viscosity on the pressure and shear stress on the boundary
- Quantum Theory
-
Exact solution of the 1D Dirac equation for the inverse-square-root potential
- Solid state physics & materials science
- Structural and wavelength dependent optical study of thermally evaporated Cu2Se thin films
- The electronic structure, phase transition, elastic, thermodynamic, and thermoelectric properties of FeRh: high-temperature and high-pressure study
- Thermodynamics & statistical physics
- Fundamental limitations of the mode temperature concept in strongly coupled systems