
Trace Hydrogen Sulphide Gas Sensor Based on Cu/rGO Membrane-Coated Photonic Crystal Fibre Michelson Interferometer
-
Taiming Luo
 ,
Jianwei Wei
,
Jianwei Wei
 ,
Xiaozhan Yang
,
Xiaozhan Yang

Abstract
A novel Michelson interferometric hydrogen sulphide sensor coated with copper/reduced graphene oxide (Cu/rGO) composite membrane is proposed and fabricated. A section of endlessly photonic crystal fibre (EPCF) was sandwiched in two single-mode fibres (SMFs). One SMF was spliced and tapered with EPCF; the other SMF was connected with the Faraday rotator mirror to construct the Michelson structure. The cladding of the EPCF was coated by the Cu/rGO-sensing membrane, which was prepared by the dip-coating method. The obtained Cu/rGO-sensing film has a length of 25.0 mm. The fabricated sensing membrane is characterised by the scanning electron microscopy, X-ray photoelectron spectroscopy (XPS), Raman spectroscopy, and so on. Experimental results demonstrated that the Cu/rGO-sensing film has a 24.56-nm thickness with a compact and uniform appearance. The XPS and Raman spectra indicate that there are three elements (C, O, and Cu), which are consistent with the expected compositions of the Cu/rGO membrane. With the increase of concentration of hydrogen sulphide, the interference spectra appear red-shifted. The linearity of 0.97662 and the sensitivity of 13.23 pm/ppm are achieved. In addition, the dynamic response and recovery time of the sensor are approximately 70 and 88 s, respectively. The surface adsorption energies of the film are calculated by the density functional theory. The theoretical results are in good agreement with the experimental findings. This sensor has some key advantages of small size, simple structure, easy fabrication, and great applicability for detecting the trace hydrogen sulphide.
1 Introduction
Hydrogen sulphide (H2S) is a colorless, flammable, odorous, and toxic gas. The natural lipolysis of hydrogen sulphide brings it to be absorbed by human lung and blood and damages human organs [1], [2]. It often exists in sewers, reservoirs, petrochemical factories, heavy water production, agriculture, and hot springs, which often cause the incidents of hydrogen sulphide poisoning [3], [4]. At present, H2S detections are commonly used by the metal oxide semiconductor sensors, solid electrolyte sensors, polymer electrolyte sensors, and heater resistance sensors [5], [6], [7]. However, it is still unfavourable in the performance of selectivity, stability, and antielectromagnetic interference [8], [9], [10], [11], [12], [13], [14], [15], whereas the optical fibre sensors can overcome the above problems [16]. Among them, the fibre-optic Michelson interferometric sensor has the advantages of strong selectivity, good stability, high sensitivity, antielectromagnetic interference, small size, low cost, simple structure, and so on. At the same time, this kind of sensor can be applied in gas detection, temperature, pressure, strain measurement, and filter modulation [17], [18], [19], [20]. In gas detection, the performance of sensing film is very important because the surface interaction between gas and membrane demands good efficiency. It is found that the nano-copper/reducing graphene oxide (rGO) composite film can enhance the photostability and photocurrent density when compared to that of only the rGO membrane [21]. The addition of copper appears to increase the adsorption abilities and efficiencies between the gas molecules and those hydroxyl groups that are distributed on the surface of rGO [22], [23]. But so far, the optical fibre Michelson gas sensor combined with the Cu/rGO film has not been reported yet in the previous literatures.
In this work, a Michelson interferometric hydrogen sulphide sensor coated with Cu/rGO-sensing film is proposed and constructed. Two standard single-mode fibres (SMFs) were spliced at both ends of an endlessly photonic crystal fibre (EPCF) to form the SMF–EPCF–SMF structure. One end of the structure is tapered, and the other end of the sensor is connected with a fibre-optic Faraday rotator mirror (FRM). The surface of EPCF is coated with a Cu/rGO-sensing film. Finally, the multibeam interference is formed in the tapered region. In addition, because of the reflection of the FRM, the interference is strengthened, and the contrast of interference fringe is improved, which effectively increases the sensitivity of the sensor. At the same time, the density functional theoretical calculation is used in the selectivity analysis. The results are discussed.
2 Principle
The single tapered Michelson interferometric hydrogen sulphide sensor coated with Cu/rGO-sensing film is shown in Figure 1. The tapered structure of optical fibre has been extensively studied as power couplers and splitters [24], [25], [26]. The cladding and the core lights are reflected by the reflector and coupled back to the core in the tapered region. The phase difference (Δφ) between cladding and core modes can be given as follows:
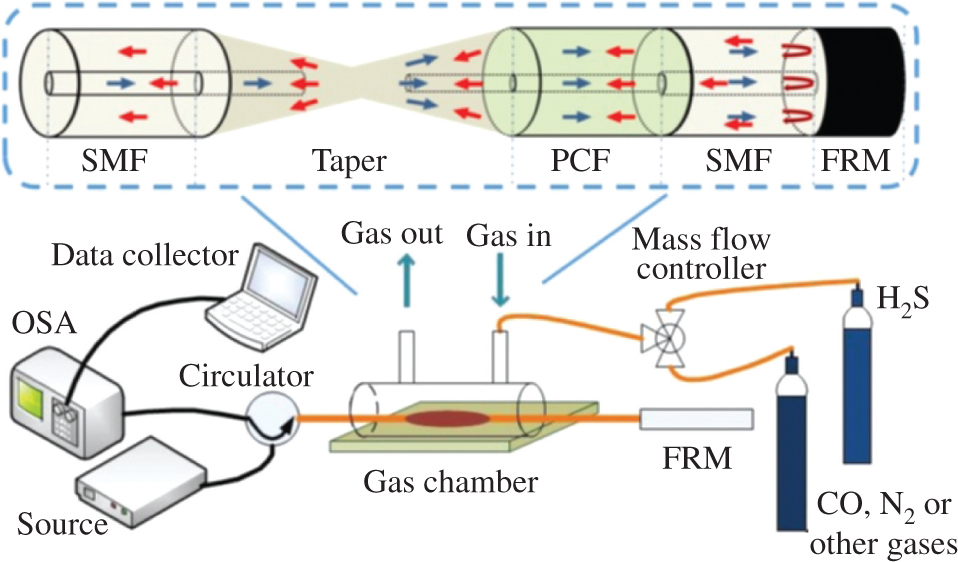
Schematic diagram of the experimental setup. The inset shows the fibre-optic Michelson structure.
where ncladding and ncore are the refractive indices of the cladding and core, respectively. Δneff is the difference between ncladding and ncore. L is the length of the sensing region, and λ is the wavelength of the incident light. According to the phase relation of Michelson interference enhancement and attenuation, the condition of maximum interference attenuation can be expressed as follows:
where k can be any integer.
Combining (1) and (2), the following formula can be given as
Obviously, the wavelength shift (Δλ) is proportional to refractive index difference (Δneff). Because of the constancy of the ncore, the Δneff will change with various ncladding. When the sensing film adsorbs gas molecules, the tiny change of the cladding refractive index will lead to the movement of the monitoring trough [27]. Therefore, by monitoring the variation of the trough, the gas concentration information can be obtained accordingly.
3 Experiment and Methods
3.1 Sensor Fabrication
The standard SMF and EPCF fibres were bought from Yangtze Optical Fibre and Cable Joint Stock Limited Company (YOFC, Wuhan, China). The cladding diameter of EPCF is 125 μm, with multilayer air holes of 9.5 μm in diameter, arranged in a hexagonal structure with a length of 31.5 mm. The optical fibre fusion machine is S178C type, Furukawa, Japan. The light source is ASE broadband light source (Kangguan, Beijing, China). The annulus is PIOC315P210 type (Xianlian Co., Ltd., Sichuan, China), and the spectrum analyser is used by AQ6370D spectrometer (Yokogawa, Tokyo, Japan). In the preparation process of sensing structure, the manual splicing procedure is adopted, and the parameters are set in Table 1. At this time, the ends between SMF and EPCF are spliced to form a shrunk taper, and the other end of EPCF is spliced with another SMF and connected with an FRM. Thus, the Michelson interferometer is obtained and illustrated in the inset of Figure 1.
The procedures and setting parameters of the tapered fibre.
| Procedure | Parameter | Procedure | Parameter |
|---|---|---|---|
| The first arc-power | +100 | Automatic discharge time | +1500 ms |
| The first end arc-power | +100 | End time of first discharge | +0 ms |
| The second arc-power | +40 | End time of redischarge | +0 ms |
| The second end arc-power | +40 | Discharge compensation value | −20 |
| The cleaning duration time | +200 ms | Clean discharge deviation | +20 |
| The prefusion time | +160 ms | Discharge centre offset | −50 μm |
| The initial arc-duration time | +1000 ms | Z-pull distance | 15 μm |
| The second arc-duration time | +2000 ms | Z-push distance | 400 μm |
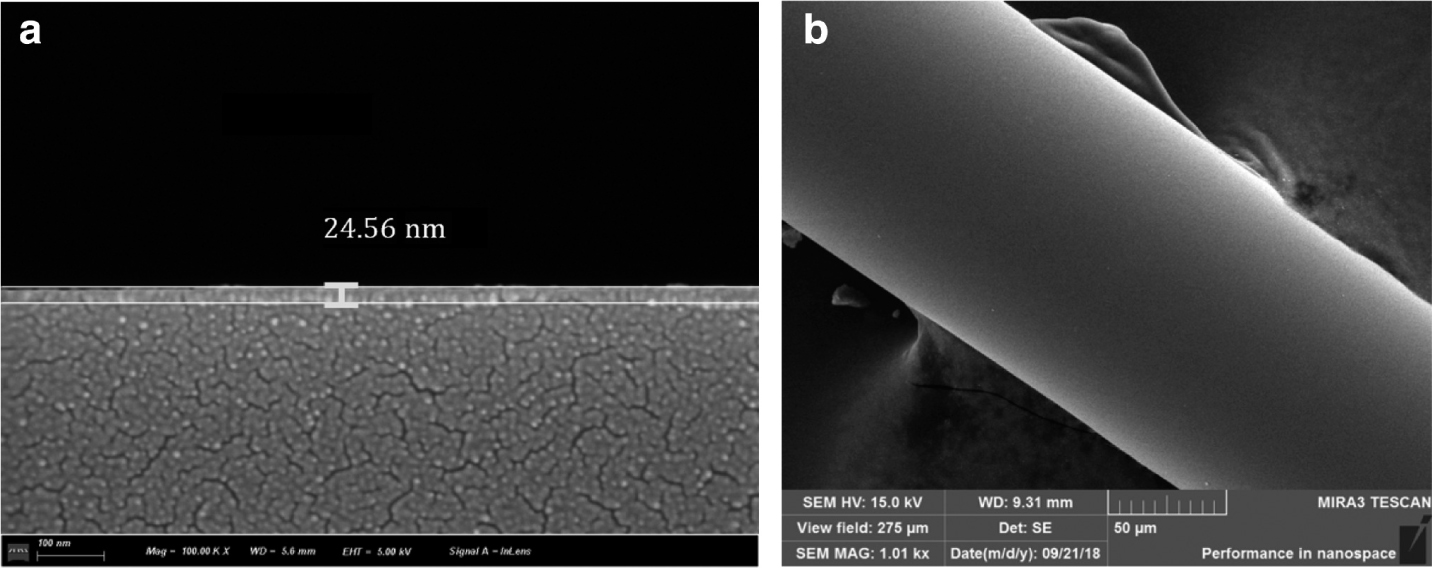
The SEM morphology of sensing film: (a) SEM image of the thickness of cross section and (b) SEM image of the side surface.
3.2 Preparation and Characterisation of Sensing Membrane
The 3.2 g/L nano-copper with diameter of 5–10 nm and GO aqueous dispersion solutions were bought from Nanjing Xianfeng Nano Material Technology Co., Ltd., Nanjing, China. The Cu/rGO-sensing film is prepared by the dip-coating method. First, 500 μL graphene oxide (GO) aqueous dispersion solution is mixed in 300 μL isopropanol and 200 μL 30 % hydrogen peroxide solution and then dispersed uniformly by ultrasound for 20 min to obtain GO mixed solution. Second, 700 μL nano-copper aqueous dispersion is added to 300 μL isopropanol for ultrasonic dispersion. The EPCF is, respectively immersed in GO and nano-copper solution for 10 min, and then it is dried by the vacuum freeze dryer, and the above dip-coating process is repeated alternately. Lastly, the coated fibre is placed in a tubular furnace, which is accessed by nitrogen and calcined at 300 °C for 2 h, and then the Cu/rGO membrane–coated EPCF is obtained. The scanning electron microscopy (SEM) results (Fig. 2) show that the film thickness is about 24.56 nm, and the film surface is dense and smooth. To further determine the element composition of the sensing film, X-ray photoelectron spectroscopy (XPS) and Raman spectroscopy are used.
Figure 3 is the XPS of Cu/rGO composite membrane. Figure 3a is the full spectrum scanning of elements in the composite. The composite mainly contains three elements: C, O, and Cu. Figure 3b is a narrowband scan image of C1s after peak splitting. The binding energies corresponding to C–C/C=C, C–O, C=O, and O–C=O are 284.3, 285.7, 287.1, and 288.4 eV, respectively. Figure 3c is a narrowband scanning image of Cu2p after peak splitting. The binding energies of copper Cu+ 2P3/2, Cu2+ 2P3/2, Cu+ 2P1/2, and CuO 2P1/2 are 932.6, 934.6, 952.4/954.1, and 963 eV, respectively. These are in good agreement with the XPS results of the known Cu/rGO composites [21], [28], [29], [30]. It can be seen that nano-coppers are partially oxidised to CuO. In addition, the photoionisation cross section of H element has a low content, and the signal is too weak. Thus, the energy spectrum of H element cannot be displayed in XPS. Figure 4 is the Raman spectrum of the membrane. The intensity ratio of D to G peak is 1.053, which is consistent with the Raman peaks reported in literature [26], proving that GO is reduced to rGO.
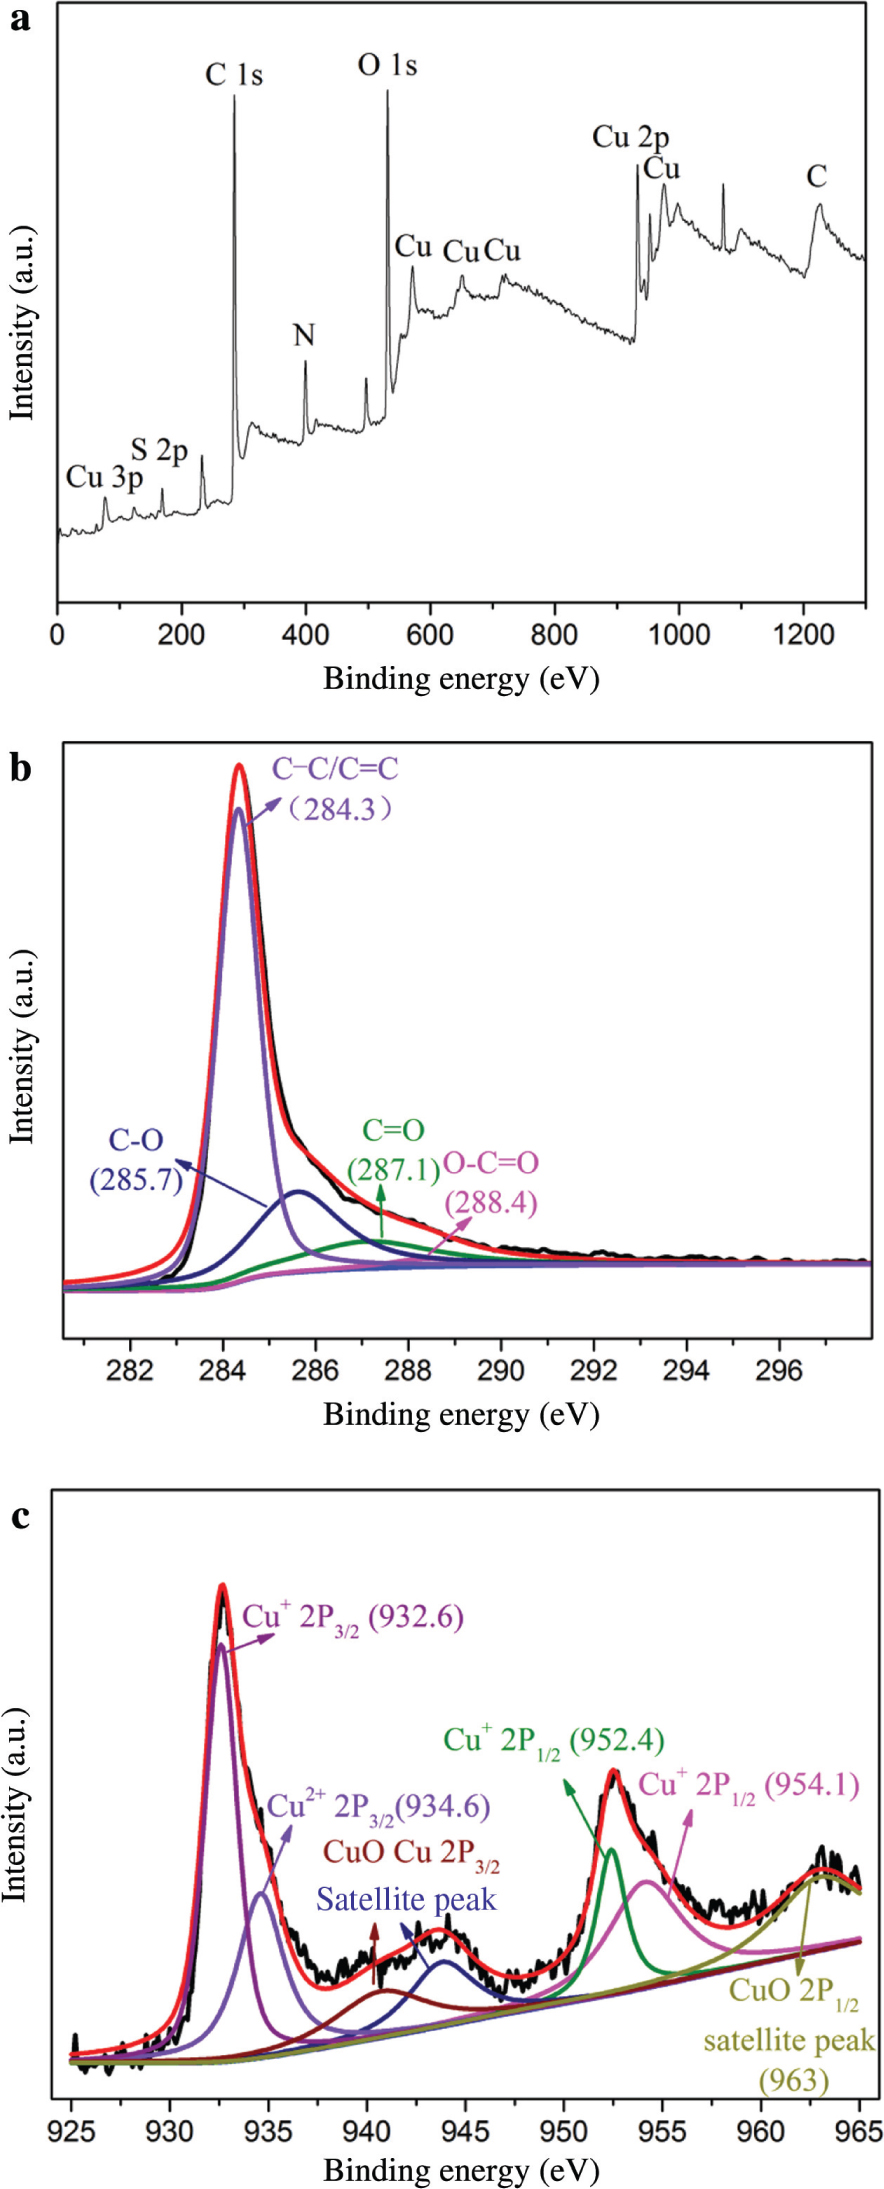
(a) XPS image of CuO/rGO membrane and the corresponding high-resolution XPS scans of (b) C 1s and (c) Cu 2p.
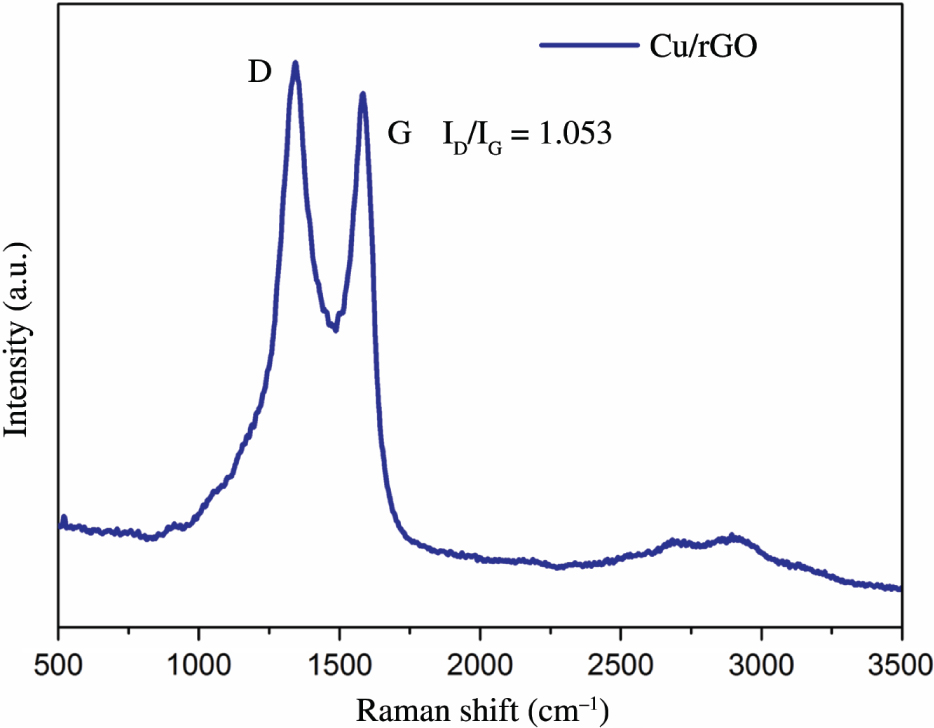
Raman spectrum of Cu/rGO membrane.
3.3 Gas-Sensing Properties
Figure 1 is a schematic diagram of a single tapered Michelson interferometric hydrogen sulphide sensor based on the Cu/rGO-sensing film. H2S gases 0–70 ppm are introduced into the gas chamber. Ambient air is used here in this experiment for gas dilution. The interference spectra obtained are shown in Figure 5. In the range of 0–70 ppm H2S gas concentration, the interference spectra of the sensor show a significant red shift with the increase of H2S gas concentration. The reason is that when the H2S gas molecules contact with Cu/rGO-sensing film, the refractive index of the film will increase because of the adsorption of H2S gas. It can be seen from formula (3) that the interference spectra of the sensor will be red-shifted with the increase of H2S gas concentration. The experimental results are in good agreement with the theoretical analysis. By fitting the spectral offset, the relationship between the spectral offset and the measured gas concentration is obtained. The linearity of the sensor is 0.97662, and the sensitivity is 13.23 pm/ppm. The limit of detection (LOD) of the gas sensor can be obtained according to the formula in literature [31], [32], that is, LOD = 3σ/K, in which σ (0.000723 nm) is the standard deviation for the wavelength of the sensing system in the absence of H2S, and K (0.01323 nm/ppm) denotes the slope of the fitting curve; thus, the low LOD (0.164 ppm) of this sensor is achieved. It is worth noting that the film with different thicknesses will all cause the interference spectra to shift to various extents. For a determined film thickness, the sensor’s gas detection ability will not be affected because the reference valley wavelength is a determined and fixed value, which will not change during the measurements.
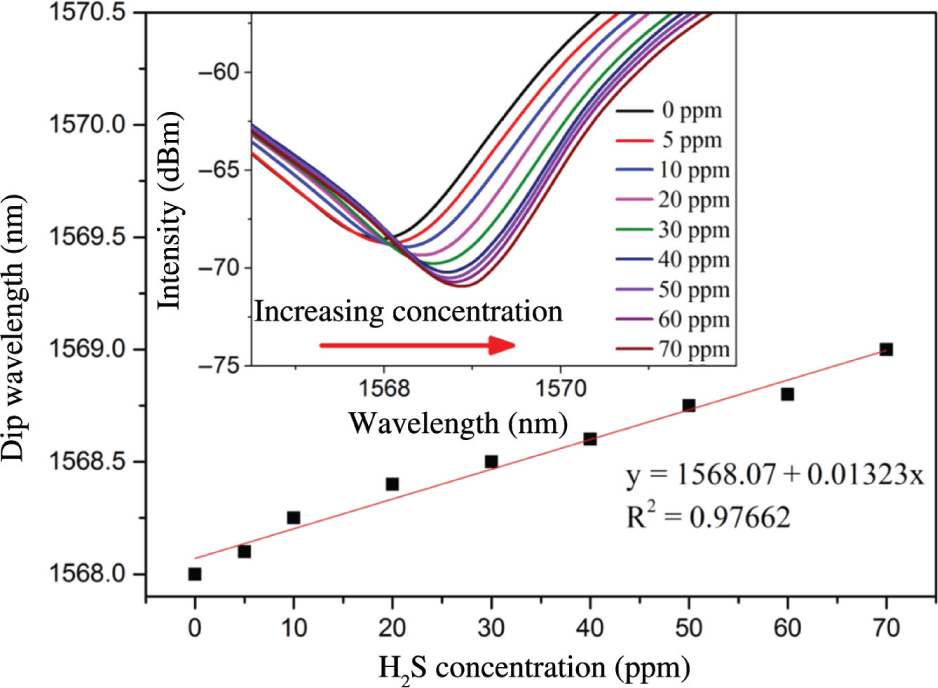
The wavelength shift upon the concentration of hydrogen sulphide. The inset shows the reflectance spectra of the sensor in various concentrations of hydrogen sulphide.
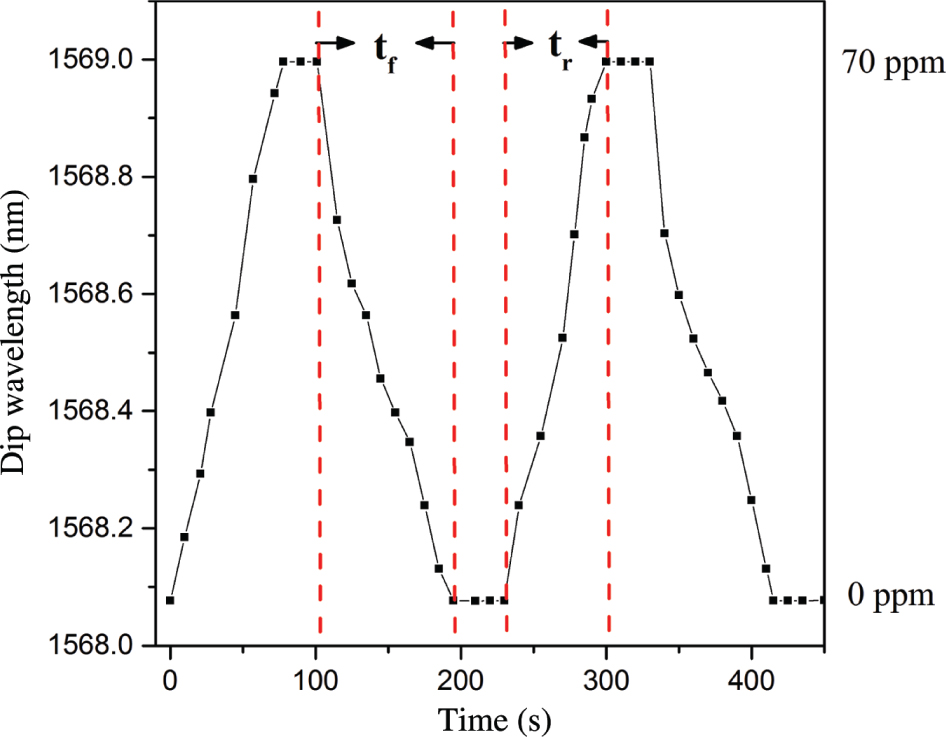
Dynamic response of the hydrogen sulphide sensor.
Figure 6 shows the response–recovery time curve of the sensor. The response time tr and recovery time tf of the sensor are approximately 70 and 88 s, respectively. Figure 7 shows the gas selectivity of the sensor. Compared with the same concentration of carbon monoxide, carbon dioxide, hydrogen, nitrogen, ammonia, and oxygen, the sensor has a high selectivity for hydrogen sulphide. The main reason is because hydrogen sulphide gas molecule is polar molecule. Compared to nonpolar molecules, such as carbon dioxide, nitrogen, and oxygen, this Cu/rGO-sensing film results in a better adsorption on H2S molecules. In addition, hydrogen sulphide is a reducing gas, which is easy to lose electron. There is a very weak chemisorption between the hydrogen sulphide gas molecule and nano-copper. Electrons obtained by copper ions (Cu2+ or Cu+) correspond to the response process of the gas sensor. On the contrary, it corresponds to the recovery process of the gas sensor. The relevant process formula is as follows: Cu+ Cu or Cu2+ Cu+. At the same time, H2S has the maximum molecular radius among the above gas molecules; the binding capacity of the outermost electrons on the 3P orbital is weak and easy to give electrons to the sensing film. Thus, the sensor has a high selectivity for hydrogen sulphide gas. Among these molecules, except hydrogen sulphide, the selectivity of H2 and NH3 is relatively slightly higher than those of other gases, mainly because the rGO has a certain hydrogen adsorption capacity [33]. Ammonia is a polar molecule. It can be attracted/absorbed to the polar functional groups that are located on the surface of rGO. Although these adsorptions are weaker than those of other chemical bondings, they are still much stronger than physical adsorption. It is worth noting that CO’s polarity is weak because of the π backbonding. Therefore, the selectivity of CO is poor.
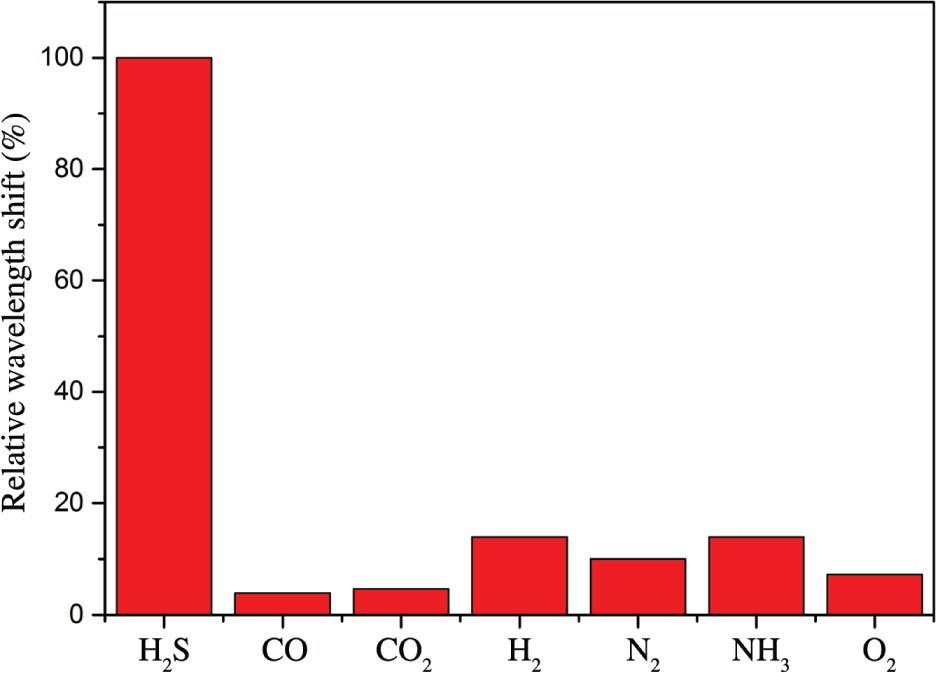
Selectivities for hydrogen sulphide, carbon monoxide, carbon dioxide, hydrogen, nitrogen, ammonia, and oxygen.
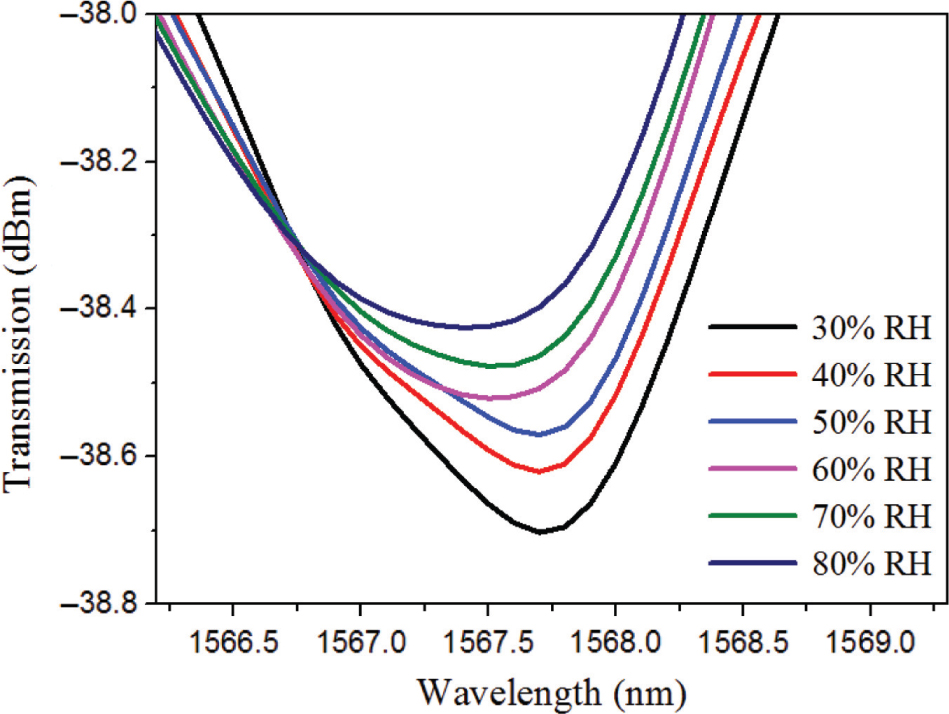
The interference valley wavelength shift dependence with various relative humidity (monitoring at 300 K).
The sensor’s response to moisture has been performed by the experiment. Figure 8 is the interference valley wavelength shift dependence on various relative humidity levels (monitoring at 300 K). With the increase of relative humidity, the spectral interference valley shows a blue shift. When the relative humidity is 80 %, the interference valley wavelength moves 0.32 nm, compared to that of 30 % humidity. When the relative humidity increases from 30 % to 50 %, the interference valley wavelength moves 0.06 nm. However, the relative humidity increased from 50 % to 80 %; the interference valley wavelength is shifted 0.26 nm. Therefore, in the relative humidity range of 30 %–50 %, the sensor is less affected by the moisture. Therefore, the sensor has certain application value when the relative humidity is lower than 50 %.
4 Theoretical Calculation
The adsorption energies of several typical gases (H2S, CO, CO2, H2, N2, NH3, and O2) were calculated by the density functional theory. For Cu/rGO, the lattice consists of 62 carbon atoms, 4 oxygen atoms, 1 copper atom, and 3 hydrogen atoms. The existence of hydrogen atoms is due to a very small amount of hydrogen functional groups on the surface of rGO. The molecular structures and total energy are calculated by the density functional simulation software SIESTA [34]. The relaxation atomic force is less than 0.02 eV/Å. The used pseudopotential is a generalised gradient approximation pseudopotential modified by PBE (Perdew–Burke–Ernzerhof) [35].
In order to minimize the error, the double-ζ polarisation basis set is used to express the wave function of the valence electrons. The calculation of the gas adsorption energy is based on the same Cu/rGO lattice, and the total energy is calculated at 300 K and 300-Ry cutoff energy [35]. The adsorption sites are shown in Figure 9, and the gas adsorption structures and their corresponding energies at different adsorption sites are given in Table 2. The average adsorption energies follow the order of H2S > H2 > NH3 > N2 > O2 > CO2 > CO, which is also consistent with the order of gas selectivity in Figure 7. Therefore, among the seven gases, rGO has a high adsorption capacity for hydrogen sulphide; the addition of copper has a catalytic action on the adsorption of hydrogen sulphide. Reducing graphene oxide strongly attracts hydrogen in hydrogen sulphide because hydrogen atom in hydrogen sulphide is relatively positively charged, whereas carbon atoms in rGO are relatively negatively charged; electrostatic attraction also occurs between them. According to the order of adsorption energy, it can be considered that an extremely weak chemical adsorption appears at 300 K, which is the process of adsorption and desorption of hydrogen sulphide. For other gases, physical adsorption can be considered, as shown in Figures 7 and 9.
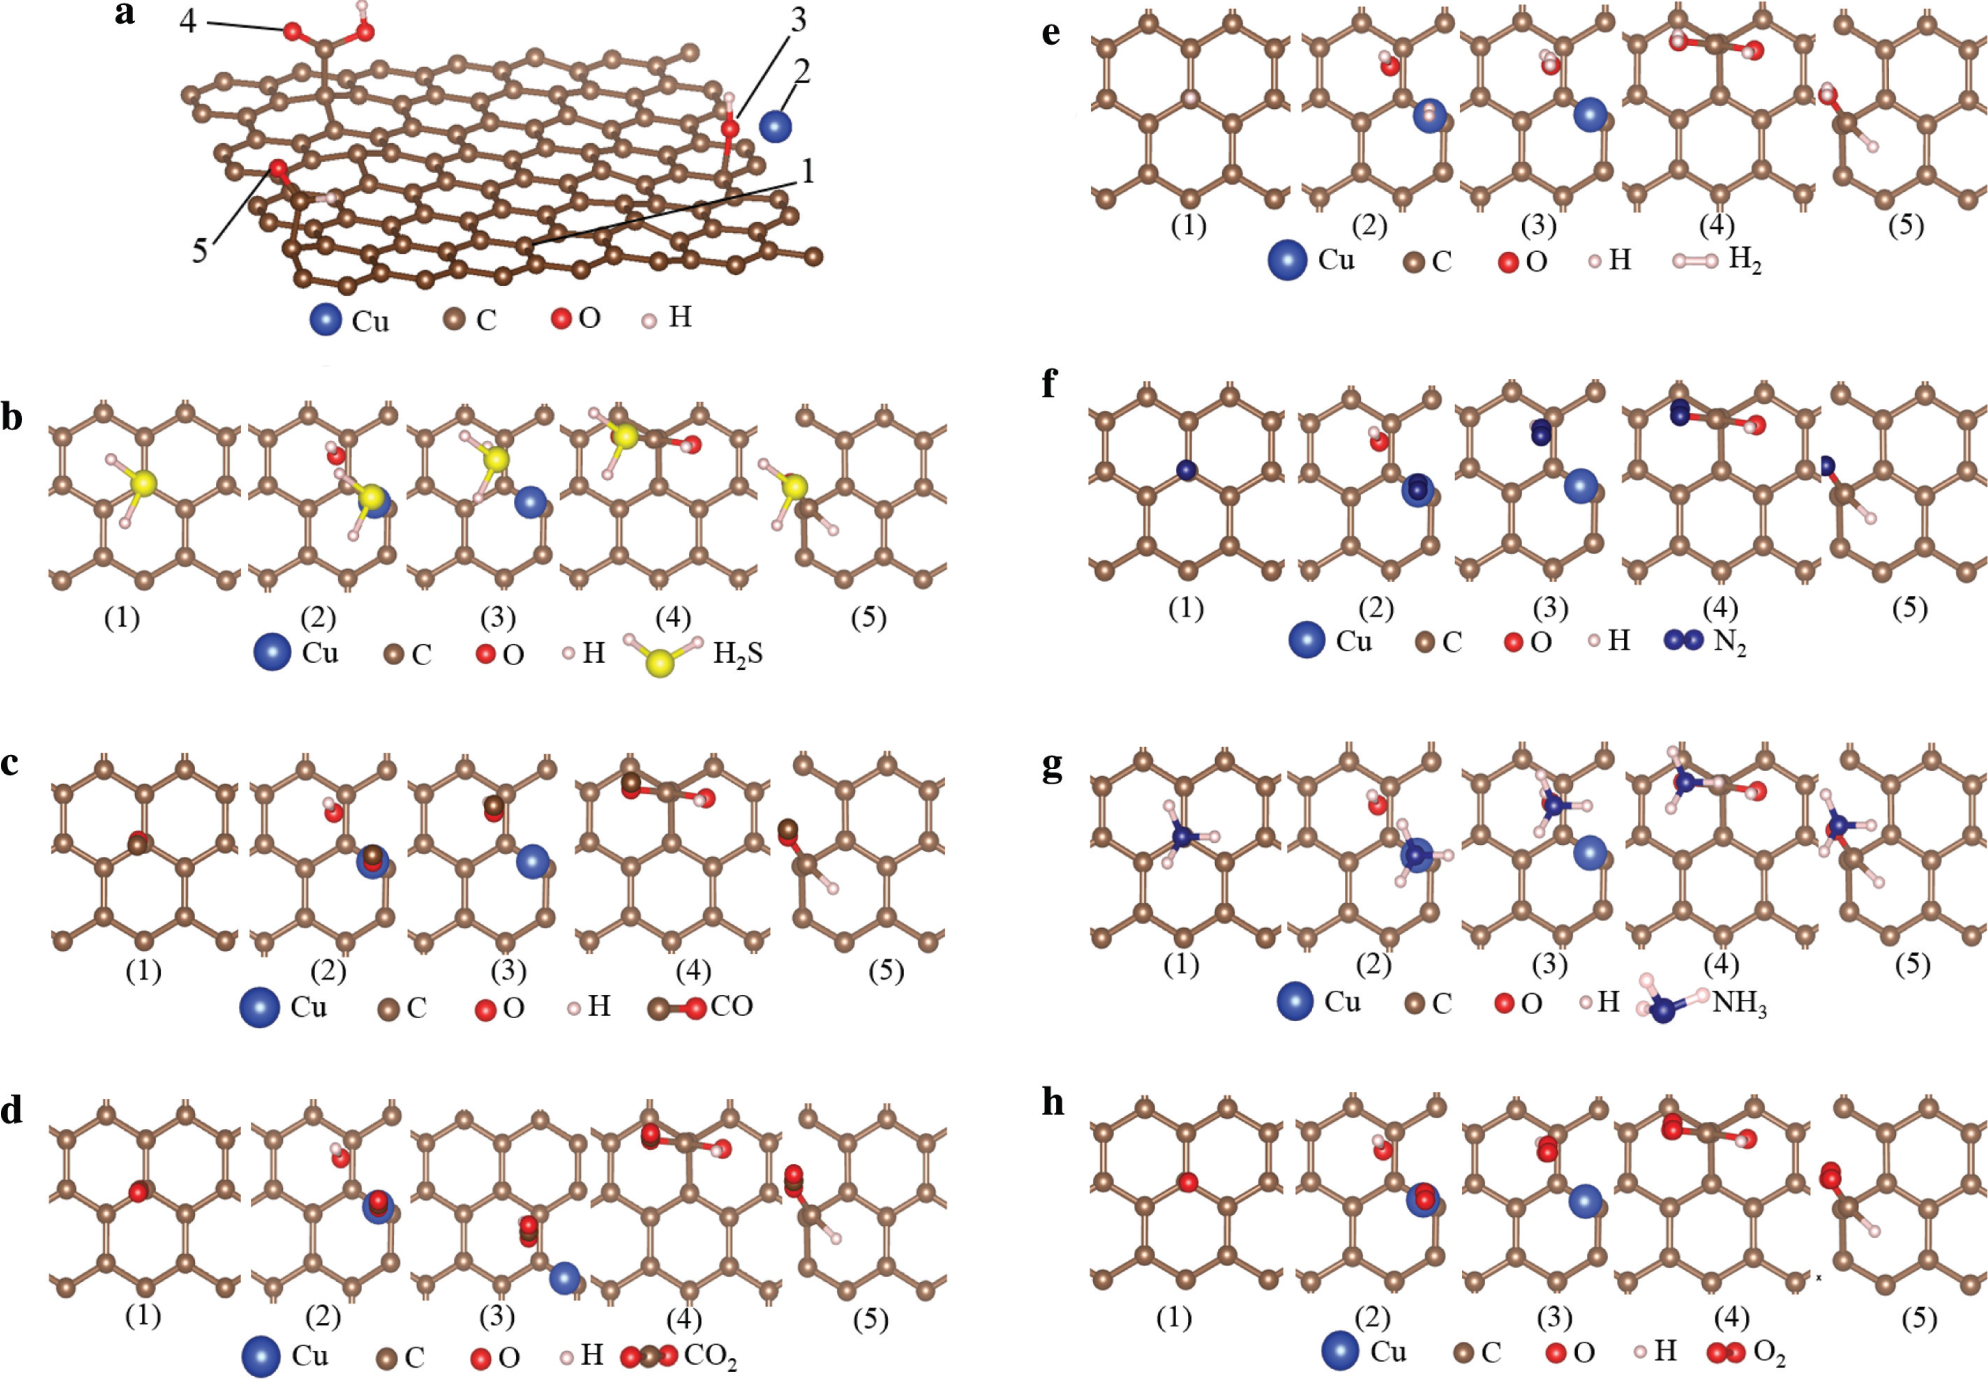
(a) The adsorption sites of the rGO. Adsorption structures of (b) hydrogen sulphide, (c) carbon monoxide, (d) carbon dioxide, (e) hydrogen, (f) nitrogen, (g) ammonia, and (h) oxygen.
The average adsorption energies of different gases and the adsorption energies of the different sites (all the units are eV).
| Gases | 1 | 2 | 3 | 4 | 5 | Average |
|---|---|---|---|---|---|---|
| Sites | ||||||
| H2S | −0.099274 | −0.122494 | −0.095402 | −0.090620 | −0.091545 | −0.0998670 |
| CO | −0.001350 | −0.001303 | −0.000995 | −0.000610 | −0.000605 | −0.0009730 |
| CO2 | −0.007686 | −0.007653 | −0.009182 | −0.005671 | −0.007722 | −0.0075832 |
| H2 | −0.054136 | −0.073801 | −0.066748 | −0.078403 | −0.062966 | −0.0672108 |
| N2 | −0.016218 | −0.018953 | −0.018464 | −0.015561 | −0.019579 | −0.0177553 |
| NH3 | −0.092806 | −0.063407 | −0.061889 | −0.009136 | −0.062862 | −0.0500200 |
| O2 | −0.011654 | −0.013172 | −0.014742 | −0.010204 | −0.018331 | −0.0136209 |
Comparisons (sensor type, detection limit, working temperature, response time tr, and recovery time tf) of several H2S detection methods: long-period fibre grating (LPFG), heterostructural tubule (HT), electroactive polyimide (EP), optical fibre evanescent-wave sensing (OFEWS), and photonic crystal fibre Michelson interferometer (PCFMI).
| Sensor type | Detection limit (ppm) | Temperature (K) | tr/tf (s) | Reference |
|---|---|---|---|---|
| LPFG | 0.5 | 300 | 89/97 | Qin et al. [36] |
| HT | 0.01 | 443 | 35/29 | Na et al. [37] |
| EP | 0.142 | 300 | 43/99 | Padua et al. [38] |
| OFEWS | 5.1 | 300 | 2.03/– | Ke et al. [39] |
| PCFMI | 0.164 | 300 | 70/88 | This work |
The comparisons (sensor type, detection limit, working temperature, response time tr, and recovery time tf) of several H2S detection methods between this work and other studies are shown in Table 3 [36], [37], [38], [39]. Compared with the heterostructural tubule heater and chemiresistor gas sensor, fibre gas sensor can work without electricity at room temperature and has a higher chemical stability [36], [37], [38], [39]. Therefore, fibre gas sensors including the fibre Michelson interferometer have a good safety application for the monitoring of nonelectric gas environment.
5 Conclusions
In this work, a single tapered Michelson interferometric hydrogen sulphide sensor based on the Cu/rGO-sensing film is proposed. The gas-sensing performance of the sensor is evaluated, and the results show that with the increase of H2S concentration the central wavelength of its transmission spectrum shows red shift. The sensitivity of the sensor is 13.23 pm/ppm in the range of 0–70 ppm H2S gas concentration. It has a good linearity and selectivity. The theoretical simulation results are consistent with the experimental findings. The sensor has the advantages of small size, light weight, easy preparation, high sensitivity, and selectivity. It has a potential application for trace H2S gas detection in toxic environments.
Acknowledgement
This work was supported by the National Natural Science Foundation of China (Funder Id: http://dx.doi.org/10.13039/501100001809, grant no. 51574054), the University Innovation Team Building Program of Chongqing (grant no. CXTDX201601030), Scientific and Technological Research Program of Chongqing Municipal Education Commission (grant no. KJZD-M201901102), the Livelihood Project of Chongqing Science and Technology Bureau (grant no. cstc2017shmsA20017), and the Innovation Leader Project of Chongqing Science and Technology Bureau (grant no. CSTCCXLJRC 201905).
References
[1] R. O. Beauchamp, J. S. Bus, J. A. Popp, C. J. Boreiko, et al., CRC Crit. Rev. Toxicol. 13, 25 (1984).10.3109/10408448409029321Search in Google Scholar PubMed
[2] A. F. Abu-Hani, S. T. Mahmoud, F. Awwad, and A. I. Ayesh, Sens. Actuators B Chem. 241, 1179 (2017).10.1016/j.snb.2016.10.016Search in Google Scholar
[3] H. Daldal, B. Beder, S. Serin, and H. Sungurtekin, Clin. Toxicol. 48, 755 (2010).10.3109/15563650.2010.508044Search in Google Scholar PubMed
[4] D. H. Truong, M. A. Eghbal, W. Hindmarsh, S. H. Roth, and P. J. O’Brien, Drug Metabol. Rev. 38, 733 (2006).10.1080/03602530600959607Search in Google Scholar PubMed
[5] A. Mirzaei, S. S. Kim, and H. W. Kim, J. Hazard. Mater. 357, 314 (2018).10.1016/j.jhazmat.2018.06.015Search in Google Scholar PubMed
[6] X. Yang, Y. Zhang, X. Hao, Y. Song, X. Liang, et al., Sens. Actuators B Chem. 273, 635 (2018).10.1016/j.snb.2018.06.087Search in Google Scholar
[7] F. I. Ali, F. Awwad, Y. E. Greish, and S. T. Mahmoud, IEEE Sens. J. 19, 2394 (2018).10.1109/JSEN.2018.2886131Search in Google Scholar
[8] T. Hyodo, M. Takamori, T. Goto, T. Ueda, and Y. Shimizu, Sens. Actuators B Chem. 287, 42 (2019).10.1016/j.snb.2019.02.036Search in Google Scholar
[9] H. Takeo, T. Yamashita, and Y. Shimizu, Sens. Actuators B Chem. 207, 105 (2015).10.1016/j.snb.2014.10.005Search in Google Scholar
[10] A. Chowdhuri, V. Gupta, K. Sreenivas, R. Kumar, S. Mozumdar, et al., Appl. Phys. Lett. 84, 1180 (2004).10.1063/1.1646760Search in Google Scholar
[11] A. Ebrahimi, A. Pirouz, Y. Abdi, S. Azimi, and S. Mohajerzadeh, Sens. Actuators B Chem. 173, 802 (2012).10.1016/j.snb.2012.07.104Search in Google Scholar
[12] V. D. Kapse, S. A. Ghosh, G. N. Chaudhari, and F. C. Raghuwanshi, Talanta 76, 610 (2008).10.1016/j.talanta.2008.03.050Search in Google Scholar PubMed
[13] M. Kaur, N. S. Ramgir, U. K. Gautam, S. K. Ganapathi, S. Datta, et al., Mater. Chem. Phys. 147, 707 (2014).10.1016/j.matchemphys.2014.06.010Search in Google Scholar
[14] J. Kim and K. Yong, J. Phys. Chem. C 115, 7218 (2011).10.1021/jp110129fSearch in Google Scholar
[15] M. MalekAlaie, M. Jahangiri, A. M. Rashidi, A. HaghighiAsl, and N. Izadi, Mater. Sci. Semiconduct. Proc. 38, 93 (2015).10.1016/j.mssp.2015.03.034Search in Google Scholar
[16] R. Chen, W. Liu, G. Huang, D. Wang, X. Qin, et al., Appl. Opt. 57, 9755 (2018).10.1364/AO.57.009755Search in Google Scholar PubMed
[17] A. D. Kersey, Int. Soc. Opt. Photonics 1367, 2 (1991).Search in Google Scholar
[18] B. H. Lee, Y. H. Kim, K. S. Park, J. B. Eom, M. J. Kim, et al., Sensors 12, 2467 (2012).10.3390/s120302467Search in Google Scholar PubMed PubMed Central
[19] J. T. Zhou, Y. P. Wang, C. R. Liao, B. Sun, J. He, et al., Sens. Actuators B Chem. 208, 315 (2015).10.1016/j.snb.2014.11.014Search in Google Scholar
[20] T. Zhu, D. Wu, M. Liu, and D. W. Duan, Sensors 12, 10430 (2012).10.3390/s120810430Search in Google Scholar PubMed PubMed Central
[21] X. Q. An, K. F. Li, and J. W. Tang, ChemSusChem 7, 1086 (2014).10.1002/cssc.201301194Search in Google Scholar PubMed PubMed Central
[22] L. N. Sun, Q. W. Deng, Y. L. Li, L. B. Deng, Y. Y. Wang, et al., Electrochim. Acta 222, 1650 (2016).10.1016/j.electacta.2016.11.155Search in Google Scholar
[23] B. Elyassi, Y. Al. Wahedi, N. Rajabbeigi, P. Kumar, J. Seok, et al., Micropor. Mesopor. Mat. 190, 152 (2014).10.1016/j.micromeso.2014.02.007Search in Google Scholar
[24] J. D. Love, W. M. Henry, W. J. Stewart, R. J. Black, S. Lacroix, et al., IEE Proc. J. (Optoelectronics) 138, 343 (1991).10.1049/ip-j.1991.0060Search in Google Scholar
[25] Y. He and F. G. Shi, Opt. Commun. 260, 127 (2006).10.1016/j.optcom.2005.10.002Search in Google Scholar
[26] Z. Tian, S. S. Yam, and H. P. Loock, Opt. Lett. 33, 1105 (2008).10.1364/OL.33.001105Search in Google Scholar
[27] R. Jha, J. Villatoro, G. Badenes, and V. Pruneri, Opt. Lett. 34, 617 (2009).10.1364/OL.34.000617Search in Google Scholar
[28] J. Choi, H. Oh, S. W. Han, S. Ahn, J. Noh, et al., Curr. Appl. Phys. 17, 137 (2017).10.1016/j.cap.2016.11.020Search in Google Scholar
[29] V. V. Nikesh, A. B. Mandale, K. R. Patil, and S. Mahamuni, Mater. Res. Bull. 40, 694 (2005).10.1016/j.materresbull.2004.12.008Search in Google Scholar
[30] K. Wang, Dong, X. Wang, C. Zhao, X. Qian, et al., Electrochim. Acta 152, 433 (2015).10.1016/j.electacta.2014.11.171Search in Google Scholar
[31] X. Ding, L. Qu, R. Yang, Y. Zhou, and J. Li, Luminescence 30, 465 (2015).10.1002/bio.2761Search in Google Scholar PubMed
[32] A. S. Emrani, N. M. Danesh, P. Lavaee, M. Ramezani, K. Abnous, et al., Food. Chem. 190, 115 (2016).10.1016/j.foodchem.2015.05.079Search in Google Scholar PubMed
[33] S. Patchkovskii, J. S. Tse, S. N. Yurchenko, L. Zhechkov, T. Heine, et al., PNAS, 102, 10439 (2005).10.1073/pnas.0501030102Search in Google Scholar PubMed PubMed Central
[34] J. M. Soler, E. Artacho, J. D. Gale, A. García, J. Junquera, et al., J. Phys. Condens. Matter 14, 2745 (2002).10.1088/0953-8984/14/11/302Search in Google Scholar
[35] N. Troullier, J. L. Martins, Phys. Rev. B 43, 1993 (1991).10.1103/PhysRevB.43.1993Search in Google Scholar
[36] X. Qin, W. Feng, X. Yang, J. Wei, and G. Huang, Sens. Actuators B Chem. 272, 60 (2018).10.1016/j.snb.2018.05.152Search in Google Scholar
[37] H. B. Na, X. F. Zhang, M. Zhang, Z. P. Deng, X. L. Cheng, et al., Sens. Actuators B Chem. 297, 126816 (2019).10.1016/j.snb.2019.126816Search in Google Scholar
[38] L. M. G. Padua, J. M. Yeh, K. S. Santiago, Polymers 11, 1918 (2019).10.3390/polym11121918Search in Google Scholar PubMed PubMed Central
[39] Z. J. Ke, D. L. Tang, X. Lai, Z. Y. Dai, and Q. Zhang, Optik 157, 1094 (2018).10.1016/j.ijleo.2017.11.130Search in Google Scholar
© 2020 Walter de Gruyter GmbH, Berlin/Boston
Articles in the same Issue
- Frontmatter
- Atomic, Molecular & Chemical Physics
- The Reaction and Microscopic Electron Properties from Dynamic Evolutions of Condensed-Phase RDX Under Shock Loading
- Trace Hydrogen Sulphide Gas Sensor Based on Cu/rGO Membrane-Coated Photonic Crystal Fibre Michelson Interferometer
- Dynamical Systems & Nonlinear Phenomena
- A General Viscous Model for Some Aspects of Tropical Cyclonic Winds
- Nonlinear Pull-in Instability of Rectangular Nanoplates Based on the Positive and Negative Second-Order Strain Gradient Theories with Various Edge Supports
- Hydrodynamics
- On the Heat Flow Through a Porous Tube Filled with Incompressible Viscous Fluid
- Effect of Magnetic Field on the Unsteady Boundary Layer Flows Induced by an Impulsive Motion of a Plane Surface
- Solid State Physics & Materials Science
- Facile Combustion Synthesis of (Y,Pr)2O3 Red Phosphor: Study of Luminescence Dependence on Dopant Concentration and Enhancement by the Effect of Co-dopant
- Size-Dependent Ultrasonic and Thermophysical Properties of Indium Phosphide Nanowires