Effect of hemoglobin, triglyceride, and urea in different concentrations on compatibility between methods used in HbA1c measurement
-
Sabahattin Muhtaroglu

 ,
Didem Barlak-Keti
and
Hatice Saracoglu
,
Didem Barlak-Keti
and
Hatice Saracoglu

Abstract
Objectives
The variability between methods is seen in the existence of hemoglobin (Hb), triglyceride (TG), blood urea nitrogen (BUN) and glucose in the specimens, which can affect the measurement. Therefore, this study aimed to compare boronate affinity chromatography and turbidimetric inhibition immunoassay methods for glycosylated hemoglobin (HbA1c) levels in samples containing different levels of Hb, TG, BUN and glucose.
Methods
In this study, a total of 412 consecutive samples were used for method comparison. The samples were divided into groups according to HbA1c, TG, BUN, Hb, and glucose levels. Clinically significant changes for HbA1c are defined as ≥0.5%.
Results
The mean relative difference as % was determined as 1.4% by the Bland–Altman plot of Trinity against Roche. The Passing–Bablok analysis indicated good agreement (r=0.985) between two methods. When compared the group with and without a clinically significant difference, we found differences only between glucose levels (p=0.003).
Conclusions
High glucose levels may cause a difference between the methods. Therefore, we suggest that a method’s performance and properties should be considered prior to clinical usage.
Introduction
Diabetes mellitus (DM) is one of the main reasons for morbidity and death in the world and negatively affects the quality of life due to its complications (such as retinopathy, nephropathy, neuropathy, vascular and heart diseases) [1, 2]. Fasting plasma glucose and OGTT 2-h glucose value are traditional diagnostic methods for predicting impaired glucose tolerance. Glycosylated hemoglobin (HbA1c), which is a measure of chronic glycemia, has been advocated in the diagnosis of diabetes and prediabetes, and in evaluating treatment adequacy based on its association with microvascular and macrovascular complications [1]. The HbA1c occurs as a consequence of a nonenzymatic reaction formed by the addition of glucose molecules to the N-terminal valine residue of the beta chain of the hemoglobin (Hb) and is used for the following DM since it is associated with mean plasma glucose of approximately 2–3 months [2, 3]. In 2011, HbA1c has been accepted as one of the diagnostic criteria for DM with a cut off 6.5% (48 mmol/mol) by the World Health Organization (WHO) [4].
HbA1c can be determined by diverse techniques. These methods can generally be divided into two groups: Methods that measure according to charge differences (HPLC and electrophoresis) and methods that measure according to structural differences (boronate affinity chromatography and immunoassays) [5].
The boronate affinity chromatography system distinguishes and quantifies glycated Hb from the non-glycated Hb based on the cis-diol group. The immunoassay method uses antibodies to bind the structure of the N-terminal glycated amino acids of the beta chain of the Hb for quantification [6].
Although many studies compared high-performance liquid chromatography (HPLC) and immunoassay methods [5, 7], [8], [9], there are only a few studies that evaluated the performance of boronate affinity chromatography and turbidimetric inhibition immunoassay (TINIA) method for HbA1c assay [10, 11].
Different techniques and devices for HbA1c measurements show distinct characteristics and performances. The variability between methods is still seen in the existence of the Hb variants or different levels of Hb, triglyceride (TG), and blood urea nitrogen (BUN) in the specimens [6, 10, 12]. Therefore, this study aimed to compare Premier Hb9210 (Trinity Biotech, Ireland) based on the boronate affinity chromatography and Cobas c501 (Roche Diagnostics, Germany) based on TINIA, one of the immunoassay methods. HbA1c levels in samples containing different levels of Hb, TG, and BUN were compared with two methods. Also, we investigated the clinical significance of the differences between the results of the two methods.
Materials and methods
Study population
This cross-sectional study was performed in the Biochemistry laboratory of the Erciyes University Health Application and Research Center Hospital. A total of 412 consecutive samples submitted to the laboratory were included for method comparison.
The samples were divided into three groups according to HbA1c levels (<6%, n=166; 6–9.9%, n=199; ≥10%, n=47). The performance of Trinity against the Roche method was evaluated at three different levels of HbA1c between the two methods was detected. In addition, the samples were divided into subgroups according to TG (<200, n=260; 200–400, n=66; >400 mg/dL, n=13), BUN (≤20, n=129; >20 mg/dL, n=20), Hb (<12 g/dL for female, <14 g/dL for male, n=43; ≥12 g/dL for female, ≥14 g/dL for male, n=225) and glucose levels (<126 mg/dL, n=133; ≥126 mg/dL, n=127). HbA1c values measured by two methods in these subgroups were compared. Clinical significance is the change in HbA1c values that affects the intervention or treatment decision. A difference of 0.5% (5.5 mmol/mol) or more between the two measurement methods for HbA1c was defined as a clinical significant change [13]. The two groups were created based on whether the difference between the two measurement methods for HbA1c shows clinically significant change or not.
Biochemical analysis
HbA1c values were analyzed in whole blood collected into tubes with EDTA. HbA1c analyses were performed on Premier Hb9210 (Trinity Biotech, Ireland, coefficient of variation <2% for National Glycohemoglobin Standardization Program (NGSP) units declared by the manufacturers) and Cobas c501 (Roche Diagnostics, Germany, coefficient of variation <3% for international federation of clinical chemistry and laboratory medicine (IFCC) units declared by the manufacturers) [12, 14], [15], [16].
Two levels of HbA1c internal quality control materials (PreciControl HbA1c norm and PreciControl HbA1c path, Roche Diagnostic, Germany) were assayed 20 times on consecutive days to determine between-day CV. Data sets were created separately for two levels and the %CV values were calculated. The %CV values obtained for the two levels were converted into a single value using the following formula and the total %CV was calculated.
Bias for HbA1c was calculated by obtaining values from the Randox International Quality Assessment Scheme (RIQAS) EQC program. The mean value calculated by the EQC program using participant laboratory results for the HbA1c test was used as the reference value. %bias values were calculated for HbA1c using the formula below, separately for each month during a year.
The mean of the bias% values determined for one year was taken and total analytical error was calculated using the following equation.
The total analytical error for the TINIA method (Roche Cobas c501) was calculated as 2.5% by determining the total CV% (0.93) and bias% [1] values.
The samples were run on the same day by the same technician and reported HbA1c values as NGSP unit. TG, BUN, and glucose levels were measured on Roche Cobas c701 (Roche Diagnostics, Germany), and Hb levels were measured on Siemens Advia 2021i (Siemens, Germany).
Premier Hb9210 boronate affinity system and TINIA method using the Tina-quant Gen3 assay on a Roche Cobas c501 were confirmed by the IFCC and NGSP. Reference method accepted as TINIA (Roche) for the present study.
This study was approved by the Clinical Research Ethics Committee and was acted with respect to the guidelines of the Declaration of Helsinki.
Statistical analysis
SPSS software (statistics version 22; IBM, Inc., Chicago, IL, USA) was applied for statistical analyses. The histogram and Q–Q graphs were used to determine the normality of the data distribution. The summary statistics of continuous variables with and without a normal distribution were exhibited as mean ± standard deviation and median (25th–75th percentile). The summary statistics of categorical variables were shown as frequency and percentage. The HbA1c measurements of the two devices were compared with the Wilcoxon signed-rank test. The Mann–Whitney U test was applied for variables without a normal distribution when comparing two groups. To examine the degree of consistency between HbA1c values obtained by the two methods based on calculation, we used the graphical procedure outlined by the Bland–Altman plot. The methods were compared using the Passing–Bablok regression analysis. Systematic constant and proportional faults were detected based on the confidence intervals of the estimated regression coefficients. A systematic constant error was assumed if the confidence interval of the constant excludes 0; it was considered a proportional error if the confidence interval of the slope excludes 1. Moreover, intraclass correlation coefficient (ICC) and concordance correlation coefficients (CCC) were calculated with 95% confidence intervals. Strength of agreement: <0.20 poor; 0.21–0.40 fair; 0.41–0.60 moderate; 0.61–0.80 good; 0.81–1.00 very good. Spearman’s correlation analysis was used. A p<0.05 was accepted as statistically significant.
Results
The distribution of patients according to age, sex characteristics, and biochemical data is shown in Table 1.
Distribution of patients according to age, sex characteristics and biochemical data.
| n | ||
|---|---|---|
| Age | 412 | 48.4 ± 21.3 |
| Gender (F/M) | 412 (249/163) | 60.4%/39.5% |
| Subjects with diabetes mellitus | 318 | 77% |
| Subjects without diabetes mellitus | 94 | 23% |
| According to Hb values | 268 | 65% |
| Subjects with anemia | 43 | 10% |
| Subjects without anemia | 225 | 55% |
| According to glucose values | 260 | 63% |
| Subjects with <126 mg/dL(<7 mmol/L) | 133 | 51% |
| Subjects with ≥126 mg/dL(≥7 mmol/L) | 127 | 49% |
| According to TG values | 339 | 82% |
| Subjects with <200 mg/dL (2.26 mmol/L) | 260 | 63% |
| Subjects with 200–399 mg/dL (2.26–4.51 mmol/L) | 66 | 16% |
| Subjects with ≥400 mg/dL (>4.52 mmol/L) | 13 | 3% |
| According to BUN values | 149 | 36% |
| Subjects with ≤20 mg/dL(≤7.1 mmol/L) | 129 | 31% |
| Subjects with >20 mg/dL(>7.1 mmol/L) | 20 | 5% |
| Trinity HbA1c % | 412 | 7.28 ± 2.02 |
| mmol/mol | 56.41 ± 22.26 | |
| Roche HbA1c % | 412 | 7.37 ± 1.95 |
| mmol/mol | 57.41 ± 21.47 |
-
Data were presented as n and (%) or mean ± standard deviation. The bold values represent the total number.
The mean relative difference as % was determined as 1.4 by the Bland–Altman plot of Trinity against Roche for all samples (HbA1c 4.2–15.6%) (Figure 1). Bland–Altman plots indicated that the mean relative differences as % between the two methods at <6.5%, 6.6–9.9%, ≥10% HbA1c levels were determined as 1.3, 2.2, and 1.4, respectively (Figure 2).
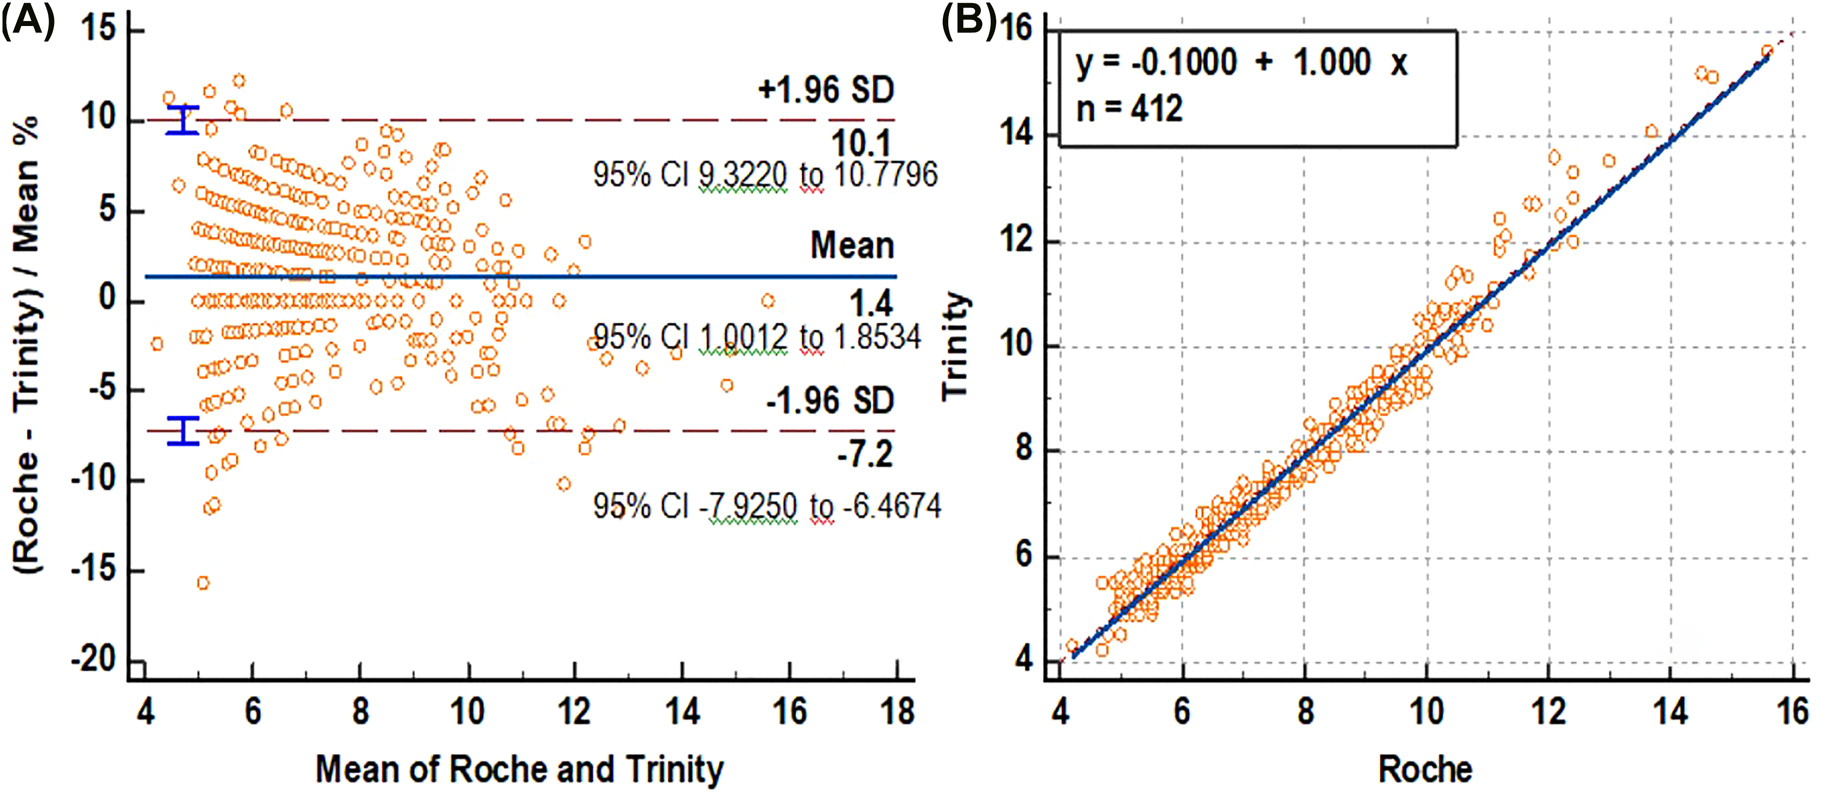
(A) Bland-Altman plot examination for calculating absolute difference between methods, (B) Passing-Bablok regression analysis of Trinity and Roche for HbA1c.
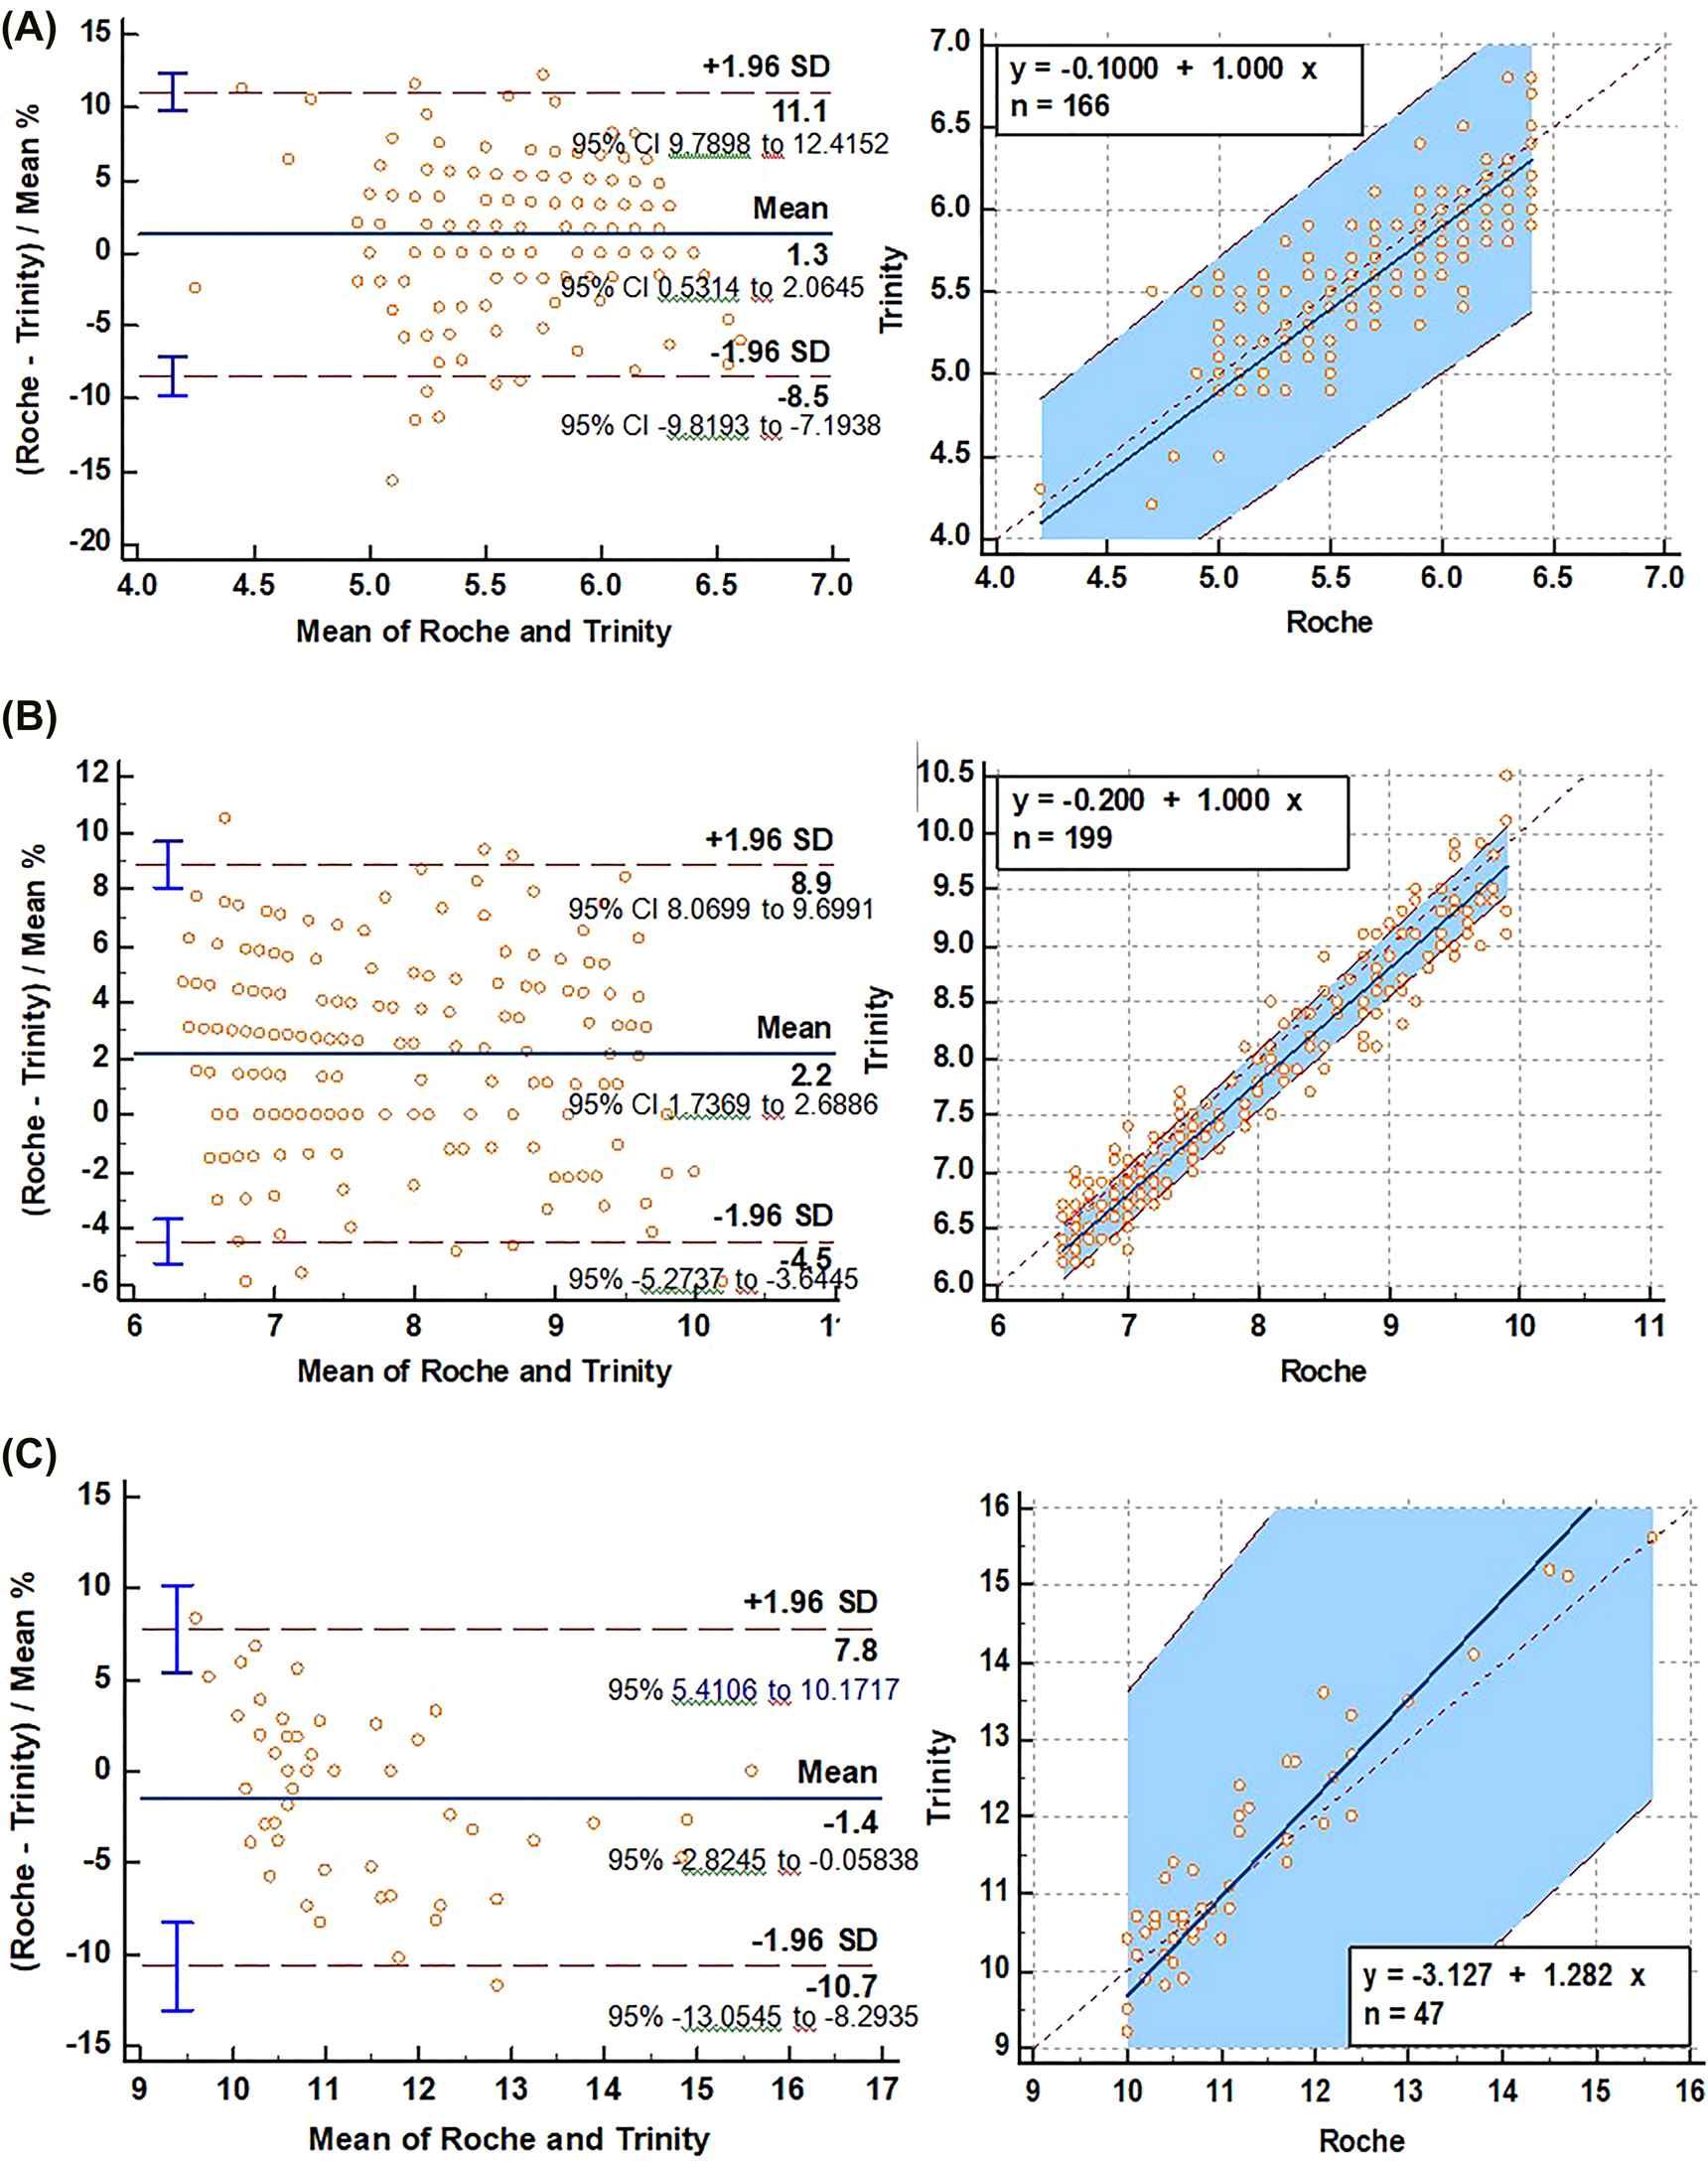
Bland-Altman plot examination for calculating absolute differences between methods for <6.5% (A), 6.5–9.9% (B) and ≥10% (C) HbA1c values.
The Passing–Bablok linear regression was used to evaluate the agreement between two methods. Good agreement (r=0.985) between Trinity and Roche was observed. The Passing–Bablok regression analysis indicated better agreement (r=0.957) between two methods at 6.5–9.9 HbA1c than at the <6.5% and ≥10% HbA1c values (r=0.813 and 0.918, respectively) (Supplementary material Table S1).
Regression equation revealed constant (regression line’s intercept) and proportional (regression line’s slope) difference with their confidence intervals of 95% (95% CI) at ≥10% of HbA1c values.
There was no significant difference in bias% between the two methods for TG, BUN, Hb, and glucose levels (Supplementary material Table S2). However, median HbA1c values of the two methods showed statistically significant differences at varied HbA1c, TG, BUN, Hb, and glucose levels (Table 2).
Comparison of HbA1c levels at different TG, BUN, Hb and glucose levels.
| Roche HbA1c | Trinity HbA1c | p-Value | |
|---|---|---|---|
| TG | |||
|
|
|||
| <200 mg/dL (2.26 mmol/L) | 6.40 (5.70–7.40) | 6.30 (5.60–7.30) | <0.001 |
| 200–400 mg/dL (2.26–4.51 mmol/L) | 6.60 (5.80–8.10) | 6.70 (5.70–7.90) | 0.013 |
| >400 mg/dL (>4.52 mmol/L) | 8.20 (5.90–9.10) | 7.80 (5.80–9.30) | 0.475 |
|
|
|||
| BUN | |||
|
|
|||
| ≤20 mg/dL (≤7.1 mmol/L) | 7.00 (6.00–8.85) | 6.7 (5.75–8.45) | <0.001 |
| >20 mg/dL (>7.1 mmol/L) | 7.10 (5.20–9.50) | 6.85 (6.00–7.77) | 0.012 |
|
|
|||
| Hb | |||
|
|
|||
| M<14, F<12 g/dL (M<8.67, F<7.45 mmol/L) | 7.00 (6.00–8.20) | 6.70 (5.80–8.00) | 0.003 |
| M≥14, F≥12 g/dL (M≥8.67, F≥7.45 mmol/L) | 6.50 (5.70–7.85) | 6.40 (5.60–7.65) | <0.001 |
|
|
|||
| Glucose | |||
|
|
|||
| <126 mg/dL (<7 mmol/L) | 5.80 (5.40–6.40) | 5.70 (5.40–6.20) | 0.001 |
| ≥126 mg/dL (≥7 mmol/L) | 7.40 (6.60–9.20) | 7.30 (6.40–9.10) | 0.001 |
-
M, male; F, female.
The difference between the HbA1c values measured by the two methods in 15% of the patients was ≥0.5% and this difference was considered clinically significant. Patients who have a clinically significant difference between the two methods were highest (33%) in patients with HbA1c ≥10% (Figure 3).
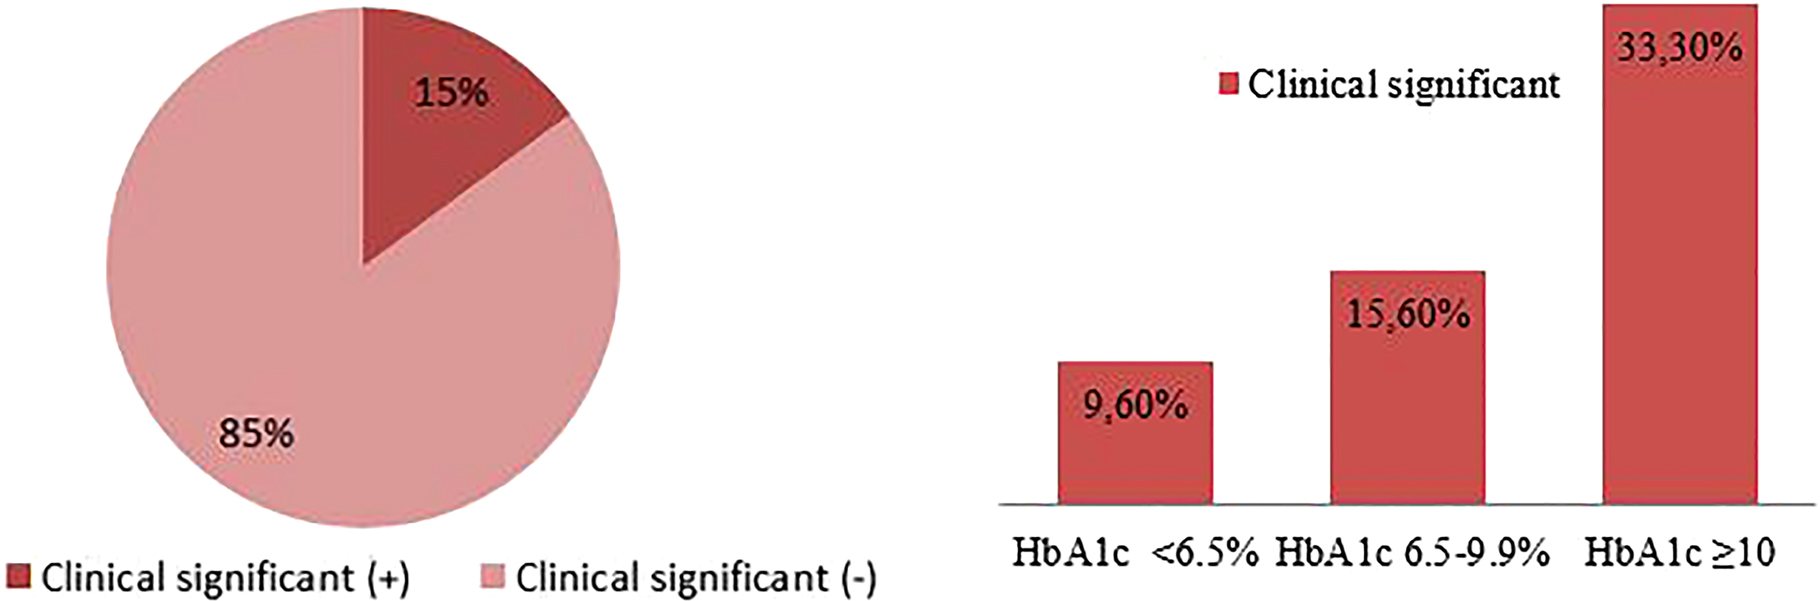
Evaluation of the difference between the two methods in terms of clinical significance.
When comparing the groups with and without a clinically significant difference for HbA1c, we found differences between glucose levels (p=0.003) (Table 3).
Comparison of TG, BUN, glucose and Hb levels of the groups with and without clinically significant difference for HbA1c.
| n | Clinically significant (−) | n | Clinically significant (+) | p-Value | |
|---|---|---|---|---|---|
| TG, mg/dL | 229 | 145 (103–213) | 31 | 134 (94–214) | 0.719 |
| BUN, mg/dL | 121 | 13.50 (10.60–17.00) | 28 | 14.00 (11.10–18.22) | 0.605 |
| Glucose, mg/dL | 229 | 122 (100–163) | 31 | 167 (120–228) | 0.003 |
| Hb, g/dL | 231 | 13.90 (12.90–15.10) | 37 | 13.60 (12.30–14.70) | 0.208 |
-
The bold value represents the emphasize statistically significant difference.
Discussion
Due to commonly used in following of patients with DM, the reliability and comparability between the alternative analytical methods that evaluate HbA1c has become very important. There are many studies comparing HPLC and TINIA and finding a very good correlation between these two methods [8, 17]. However, Ozcelik et al. [17] and Sudhakar et al. [18] reported that HbA1c values are statistically higher in HPLC than in TINIA. This is explained by the fact that the HbA1c peak is influenced by other contents and aberrant Hb variants. HPLC (Ion exchange) method is based on the charge of the globin component of Hb. Because abnormal Hb fragments are less positively loading than HbA, similar to glycosylated hemoglobin, their co-elution from the colon may affect the measurement results. It is also thought to be due to the use of different calibrators or differences in sample preparation [17, 18].
Boronate affinity chromatography is a glycation-specific method based on the principle of binding boronate to the unique cis-diol structure formed between Hb and glucose molecules. It is believed that this method has several advantages when compared with HPLC. The separation of glycated from non-glycated Hb is physically little affected by any Hb variant in the affinity chromatography method [19].
There are fewer studies comparing boronate affinity chromatography and TINIA methods.
As far as we know, our study is different from these studies because the present study interpreted the performance and clinical significance of these two methods according to HbA1c levels in patients with different BUN, TG, Hb and glucose levels.
Razi et al. [5] have reported that the smallest difference (0.11%) was detected between D10 (HPLC) and Cobas Integra (immunoassay method). Additionally, the mean absolute difference was found 0.87% between the reference methods and Nycocard (Boronate affinity method).
In another study, Karami et al. [20] investigated the concordance of the results of HbA1c measurement in diabetic patients assayed using Nycocard and HPLC. They showed a considerable difference between HPLC (as the reference method) and Nycocard.
Khan et al. [21] compared two methods used in HbA1c measurement, HPLC and immunological methods. They showed that there was no significant difference between two methods in HbA1c up to 10.0%, but there was a significant difference in HbA1c of more than 10.0%. In the current study, we indicated that the best agreement between the two methods was at 6.5–9.9% HbA1c.
Thvarajah et al. [11] compared two methods, based on boronate affinity chromatography and immunoturbidimetric method. They found a good correlation between the methods.
The biological variation is more than the analytical variation of most methods and analytical affects on HbA1c are predictable and can be recovered. However, non-glycemic biological variables show their effects by affecting hematopoiesis [22]. Any condition that shorten erythrocyte lifespan (hemolytic anemia, hemoglobinopathies) or reduces mean erythrocyte age (recovery from blood loss) can falsely lower HbA1c results. On the contrary, any conditions that prolong erythrocyte survival (iron deficiency anemia, splenectomy) may falsely increase HbA1c results [19, 22]. However, it is not clear to what extent changes in erythrocyte indices influence HbA1c values [23].
In the present study, although bias% according to Hb levels is not significantly different, we detected clinically significant differences between the two devices results in 27.9% of patients with anemia. We have proposed it is useful to be careful in specific patients such as anemia.
Others such as carbamylation have largely been eliminated in advanced assay systems [16]. A study of patients with type 2 DM and chronic kidney disease (3B/4) taking erythropoietin displaied a clinically significant decline in HbA1c values. HbA1c measurements were made using ion exchange chromatography. It has been suggested that low HbA1c values in patients with diabetes and chronic kidney disease are due to a change in red cell glycation rates as a result of new erythrocyte production following erythropoietin therapy, not uremia.
The effect of the lowering of the HbA1c values following erythropoietin treatment in patients with diabetes and chronic kidney disease has been asserted to be secondary to the production of new erythrocytes, inducing a change in the red-cell glycation rates [24]. In a study comparing the HPLC cation exchange method (Arkray Adam HA-8160) and immunoturbidimetric method (Cobas Integra 800), the researchers determined that carbamylated hemoglobin does not cause significantly different HbA1c results between the two methods [25].
In this study, in which we compared the TINIA method with boronate chromatography we could not find the difference between the groups with and without a clinically significant difference according to BUN levels including those with chronic kidney disease.
Although lipemia, urea, and glucose (labile HbA1c) do not cause a significant problem in many systems, lipids lead to a significant negative relative bias in capillary electrophoresis when TGs and cholesterol levels exceed nearly 15 mmol/L (1,327 mg/dL) and 8.5 mmol/L (328 mg/dL), respectively [16].
In a research carried out by Wu et al. [10], the analytical performances of Premier Hb9210, and Roche Cobas c501 were evaluated. They determined that Roche’s HbA1c results were 0.04% lower when compared to the Trinity (relative bias, less than ±7%). Additionally, in the study carried out in vitro, very high concentrations of TG and cholesterol (≥15.28 mmol/L (1,352 mg/dL) and ≥8.72 mmol/L (337 mg/dL), respectively) gave rise to falsely low HbA1c values on Roche c501. A significant bias was observed at concentrations of 15.28/8.72 mmol/L TG/cholesterol, (relative bias, greater than ±7%). Unlike the study by Wu et al. [10], we did not find a significant difference between devices according to bias%. The explanation for this situation may be that we evaluate according to endogenous TG levels in our study.
The isoelectric points of labile HbA1c (LA1c) and its stable counterpart are analogous, which may cause little or no separation between them by some systems that discriminate according to the molecular charge principle. Wu et al. [10] showed that LA1c did not affect commonly used HbA1c measurement methods and there was good comparability between methods for glucose levels up to 278 mmol/L (505 mg/dL).
In the present study, when comparing the groups with and without a clinically significant difference, we found significant differences between glucose levels between groups. The result may associate with LA1c in patients with high glucose levels.
There are some limitations in this study: (1) All of the patients (n=412) did not have TG, BUN, Hb, and glucose values, so we had to evaluate the effect of each in separate patient subgroups, (2) we could not identify the anemia types of the low Hb subgroup, (3) we were unable to obtain information on patients such as presence of diseases or use of drugs that affect erythrocyte life.
In conclusion, there is good agreement between methods. However, high glucose levels may be an important factor affecting the clinical significance of two methods. Therefore, we suggest that a method performance and patient properties should be considered prior to clinical usage. It seems to be an important advantage in the measurement of HbA1c, that the immunological method is easy, cost-effective, does not require qualified personnel, gives fast results and is less affected by some analytes in blood samples.
-
Research funding: None declared.
-
Author contributions: All authors have accepted responsibility for the entire content of this manuscript and approved its submission.
-
Competing interests: Authors state no conflict of interest.
-
Informed consent: Non applicable.
-
Ethical approval: This study was approved by the Clinical Research Ethics Committee and was acted with respect to the guidelines of the Declaration of Helsinki.
References
1. Guo, F, Moellering, DR, Garvey, WT. Use of HbA1c for diagnoses of diabetes and prediabetes: comparison with diagnoses based on fasting and 2-hr glucose values and effects of gender, race, and age. Metab Syndr Relat Disord 2014;12:258–68. PMID: 24512556. https://doi.org/10.1089/met.2013.0128.Search in Google Scholar PubMed PubMed Central
2. Maesa, JM, Fernandez-Riejos, P, Mora, CS, de Toro, M, Valladares, PM, Gonzalez-Rodriguez, C. Evaluation of bio-rad D-100 HbA1c analyzer against Tosoh G8 and menarini HA-8180V. Pract Lab Med 2016;5:57–64. PMID: 28856205. https://doi.org/10.1016/j.plabm.2016.05.002.Search in Google Scholar PubMed PubMed Central
3. Sherwani, SI, Khan, HA, Ekhzaimy, A, Masood, A, Sakharkar, MK. Significance of HbA1c test in diagnosis and prognosis of diabetic patients. Biomark Insights 2016;11:95–104. PMID: 27398023. https://doi.org/10.4137/BMI.S38440.Search in Google Scholar PubMed PubMed Central
4. Use of glycated haemoglobin (HbA1c) in the diagnosis of diabetes mellitus abbreviated report of a WHO consultation. Available from: http://www.who.int/diabetes/publications/diagnosis_diabetes2011/en/ [Accessed Dec 2016].Search in Google Scholar
5. Razi, F, Rahnamaye Farzami, M, Ebrahimi, SA, Nahid, M, Bigdeli, MG, Sheidaei, A, et al.. Comparative analytical performance of various HbA1c assays in Iran. Arch Iran Med 2016;19:414–9. PMID: 27293057.Search in Google Scholar
6. Weykamp, C, John, WG, Mosca, A. A review of the challenge in measuring hemoglobin A1c. J Diabetes Sci Technol 2009;3:439–45. PMID: 20144280.https://doi.org/10.1177/193229680900300306.Search in Google Scholar PubMed PubMed Central
7. Gilani, M, Aamir, M, Akram, A, Haroon, ZH, Ijaz, A, Khadim, MT. Comparison of turbidimetric inhibition immunoassay, high-performance liquid chromatography, and capillary electrophoresis methods for glycated hemoglobin determination. Lab Med 2020;51:579–84. https://doi.org/10.1093/labmed/lmaa010.Search in Google Scholar PubMed
8. Sriwimol, W, Choosongsang, P, Choosongsang, P, Treerut, P, Muenniam, B, Makkong, P, et al.. Strong correlation and high comparability of capillary electrophoresis and three different methods for HbA1c measurement in a population without hemoglobinopathy. Scand J Clin Lab Invest 2020;80:139–50. PMID: 31841038. https://doi.org/10.1080/00365513.2019.1703213.Search in Google Scholar PubMed
9. Klingenberg, O, Furuset, T, Hestbraten, CR, Hallberg, MH, Steiro, A, Orset, IR, et al.. HbA1c analysis by capillary electrophoresis – comparison with chromatography and an immunological method. Scand J Clin Lab Invest 2017;77:458–64. PMID: 28644050. https://doi.org/10.1080/00365513.2017.1338747.Search in Google Scholar PubMed
10. Wu, X, Chao, Y, Wan, Z, Wang, Y, Ma, Y, Ke, P, et al.. A comparative evaluation of the analytical performances of capillarys 2 flex piercing, Tosoh HLC-723 G8, premier Hb9210, and Roche Cobas c501 Tina-quant Gen 2 analyzers for HbA1c determination. Biochem Med 2016;26:353–64. PMID: 27812304. https://doi.org/10.11613/bm.2016.039.Search in Google Scholar
11. Thevarajah, TM, Hasrash, T, Ismail, AM. A comparison of three methods of measuring plasma glycated hemoglobin. Asian Biomed 2008;2:43–9.Search in Google Scholar
12. National Glycohemoglobin Standardization Program. Available from: http://www.ngsp.org [Accessed 10 May 2016].Search in Google Scholar
13. Lenters-Westra, E, Weykamp, C, Schindhelm, RK, Siebelder, C, Bilo, HJ, Slingerland, RJ. One in five laboratories using various hemoglobin A1c methods do not meet the criteria for optimal diabetes care management. Diabetes Technol Therapeut 2011;13:429–33. PMID: 21355726. https://doi.org/10.1089/dia.2010.0148.Search in Google Scholar PubMed
14. Weykamp, CW, Mosca, A, Gillery, P, Panteghini, M. The analytical goals for hemoglobin A(1c) measurement in IFCC units and national glycohemoglobin standardization program units are different. Clin Chem 2011;57:1204–6. PMID: 21571810. https://doi.org/10.1373/clinchem.2011.162719.Search in Google Scholar PubMed
15. Goodall, I, Colman, PG, Schneider, HG, McLean, M, Barker, G. Desirable performance standards for HbA(1c) analysis precision, accuracy and standardisation: consensus statement of the Australasian Association of Clinical Biochemists (AACB), the Australian Diabetes Society (ADS), the Royal College of Pathologists of Australasia (RCPA), Endocrine Society of Australia (ESA), and the Australian Diabetes Educators Association (ADEA). Clin Chem Lab Med 2007;45:1083–97. PMID: 17579563. https://doi.org/10.1515/CCLM.2007.158.Search in Google Scholar PubMed
16. Sacks, DB, Arnold, M, Bakris, GL, Bruns, DE, Horvath, AR, Kirkman, MS, et al.. Guidelines and recommendations for laboratory analysis in the diagnosis and management of diabetes mellitus. Clin Chem 2011;57:e1–47. PMID: 21617152. https://doi.org/10.1373/clinchem.2010.161596.Search in Google Scholar PubMed
17. Ozcelik, F, Yiginer, O, Serdar, M. Comparison of three methods for measurement of HbA1c. Turk J Biochem 2010;35:344–9.Search in Google Scholar
18. Sudhakar, B, Reddy, A, Fallerio, J. Comparison of three methods for measurement of blood HbA1c as to reliability. Int J Bioassays 2014;3:3000–5.Search in Google Scholar
19. Sacks, DB, MBChB, Path, FRC. Carbohydrates (part 4, chapter 22). In: Burtis, CA, Ashwood, ER, editors. Fundamentals of clinical chemistry, 6th ed. Philadelphia: WB Saunders; 2008:396 p.Search in Google Scholar
20. Karami, A, Baradaran, A. Comparative evaluation of three different methods for HbA1c measurement with high-performance liquid chromatography in diabetic patients. Adv Biomed Res 2014;3:94. PMID: 24800183. https://doi.org/10.4103/2277-9175.129364.Search in Google Scholar PubMed PubMed Central
21. Khan, AH, Rabeya, MR, Saeidullah, M. Measurements of HbA1c by high performance liquid chromatography in D- 10 analyzer and immunological method by Beckman Coulter AU480 system: a comparative study. J Enam Med Col 2012;2:62–6. https://doi.org/10.3329/jemc.v2i2.12839.Search in Google Scholar
22. Campbell, L, Pepper, T, Shipman, K. HbA1c: a review of non-glycaemic variables. J Clin Pathol 2019;72:12–9. PMID: 30361394. https://doi.org/10.1136/jclinpath-2017-204755.Search in Google Scholar PubMed
23. English, E, Idris, I, Smith, G, Dhatariya, K, Kilpatrick, ES, John, WG. The effect of anaemia and abnormalities of erythrocyte indices on HbA1c analysis: a systematic review. Diabetologia 2015;58:1409–21. PMID: 25994072. https://doi.org/10.1007/s00125-015-3599-3.Search in Google Scholar PubMed
24. Ng, JM, Cooke, M, Bhandari, S, Atkin, SL, Kilpatrick, ES. The effect of iron and erythropoietin treatment on the A1C of patients with diabetes and chronic kidney disease. Diabetes Care 2010;33:2310–3. PMID: 20798337. https://doi.org/10.2337/dc10-0917.Search in Google Scholar PubMed PubMed Central
25. Malathi, T, Nordin, N, Chew, YY. Performance evaluation of the Arkray Adams HA-8160 HbA1c analyser. Malays J Pathol 2008;30: 81–6. PMID: 19291916.Search in Google Scholar
Supplementary Material
The online version of this article offers supplementary material (https://doi.org/10.1515/tjb-2021-0166).
© 2022 Sabahattin Muhtaroglu et al., published by De Gruyter, Berlin/Boston
This work is licensed under the Creative Commons Attribution 4.0 International License.
Articles in the same Issue
- Frontmatter
- Review Article
- The implication of molecular markers in the early stage diagnosis of colorectal cancers and precancerous lesions
- Research Articles
- What are the predominant parameters for Down syndrome risk estimation in first-trimester screening: a data mining study
- Comparison between liquid chromatography-tandem mass spectrometry and immunoassay methods for measurement of plasma 25 (OH) vitamin D
- Comparison of Barricor tube and serum separator tube in outpatients
- Effect of hemoglobin, triglyceride, and urea in different concentrations on compatibility between methods used in HbA1c measurement
- Evaluation of hemolysis interference and possible protective effect of N-phenyl maleimide on the measurement of small peptides
- Neuroprotective and metabotropic effect of aerobic exercise training in female patients with type 2 diabetes mellitus
- Serum asprosin levels in patients with retinopathy of prematurity
- Neutrophil/lymphocyte and platelet/lymphocyte ratios as a biomarker in postoperative wound infections
- Relationship between dental caries and saliva’s visfatin levels, total antioxidant capacity (TAC) and total oxidant status (TOS)
- Might periostin serve as a marker of bone marrow involvement in patients with diffuse large B-cell lymphoma?
- A new approach for the pleiotropic effect of metformin use in type 2 diabetes mellitus
- IGFBP7 is a predictor of diuretic-induced acute kidney injury in the patients with acute decompensated heart failure
- Serum vitamin D receptor and fibroblast growth factor-23 levels in postmenopausal primary knee osteoarthritis patients
- Antioxidant activity of ethanol extract and fractions of Piper crocatum with Rancimat and cuprac methods
- Lycorine impedes 7,12-dimethylbenz(a)anthracene exposed hamster oral carcinogenesis through P13K/Akt and NF-κB inhibition
- Sublethal effects of acrylamide on thyroid hormones, complete blood count and micronucleus frequency of vertebrate model organism (Cyprinus carpio)
- Acknowledgment
- Acknowledgment