Evaluation of prolidase activity in uremic bone disease
-
Arzu Kösem
 ,
Elmas Öğüş
,
Elmas Öğüş

Abstract
Background
In this study, we planned to evaluate the comparison of serum prolidase activity with other biochemical markers.
Methods
The patient group was consisted of totally 73 patients with 21 male and 18 female who were diagnosed as chronic renal failure (CRF) and were undergoing peritoneal dialysis while 21 male and 13 female who were undergoing hemodialysis. The control group was composed of 54 healthy volunteers, including 25 men and 29 women. Serum and erythrocyte prolidase activities were measured in both patient and control groups and the relationship between serum prolidase activities and metabolic markers of bone (osteocalcin, bone-specific alkaline phosphatase, calcitonin, vitamin D and parathormone) were compared in both groups.
Results
There was a significant difference between the serum prolidase activity of peritoneal dialysis and pre-hemodialysis groups as compared with the control group (p<0.05). Serum prolidase activity of the pre-hemodialysis group was lower than that of post-hemodialysis group and there was a statistically significant difference (p<0.05). There was a significant difference between prolidase activities in erythrocytes of prehemodialysis and control groups (p<0.05).
Conclusion
Kidney is the most prolidase-rich tissue in the human body. According to our results, the prolidase activity decreased in CRF; and the level of decrement was independent from the hemodialysis procedure.
Özet
Amaç
Bu çalışmada, kronik böbrek yetmezliği (KBY) hastalarında diğer biyokimyasal belirteçler ile serum prolidaz aktivitesini değerlendirmek ve diyaliz işleminin prolidaz aktivitesi üzerine etkilerini incelemek amaçlanmıştır.
Metod
Çalışmada hasta grubu KBY tanısı ile periton diyalizi uygulanan 21 erkek ve 18 kadın hasta ve hemodiyaliz uygulanan 21 erkek ve 13 kadın hasta olmak üzere toplam 73 hastadan oluşmaktaydı. Kontrol grubu ise 25 erkek ve 29 kadın olmak üzere toplam 54 sağlıklı gönüllüden oluşturuldu. Hasta gruplarında ve kontrol grubunda serum ve eritrosit prolidaz aktiviteleri ölçüldü ve prolidaz aktivitesi ile diğer kemik belirteçleri (osteokalsin, kemik spesifik alkalen fosfataz, kalsitonin, vitamin D, parathormon) arasındaki ilişki araştırıldı.
Bulgular
Periton diyalizi ve hemodiyaliz giriş gruplarının serum prolidaz aktiviteleri kontrol grubu ile karşılaştırıldığında anlamlı bir fark bulundu (p<0.05). Hemodiyaliz giriş grubunda serum prolidaz aktivitesi, hemodiyaliz çıkış grubuna göre düşüktü ve istatistiksel olarak anlamlı fark bulundu (p <0.05). Hemodiyaliz giris ve kontrol grubu eritrosit prolidaz aktiviteleri arasında anlamlı fark vardı (p <0.05).
Sonuç
Böbrek, insan vücudunun prolidaz bakımından en zengin dokularından biridir. Sonuç olarak, prolidaz aktivitesi KBY’de düşmektedir ve bu düşüklük hemodiyaliz işleminden bağımsızdır.
Introduction
Chronic renal failure (CRF) can be defined as chronic, progressive impairment in adjustment of fluid – solid load of the kidney as well as metabolic and endocrine functions due to decrease in glomerular filtration rate (GFR) [1]. Since kidney plays an important role in adjusting mineral balance, mild – severe disturbances can occur in bone when renal functions are impaired. Prolonged renal replacement treatment may also increase the several systemic complications. One of the complications of CRF with a high morbidity rate is renal osteodystrophy (ROD) [2]. The enzyme prolidase (EC 3.4.13.9, aminoacyl-L-prolin hydrolase) is in the class of hydrolases [3], [4], [5]. Prolidase breaks down dipeptides with proline (Pro) or hydroxyprolin (OH-Pro) in C terminal (X-Proline, X-Hidroxyproline) [6], [7] and plays a significant role in recovery of amino acids from proteins originated from nutrition and stored collagen of the body. Type I collagen forms 90%–95% of the bone matrix. Collagen comprises 21% of Pro and OH-Pro. Under the conditions where collagen cycle accelerates, it is anticipated that the level of prolidase enzyme also increases. The activity of prolidase is found in many tissues such as liver, kidney, ileum, jejunum, duodenum, pancreas, stomach, spleen, brain, cerebellum, heart, skeletal muscle and erythrocyte. The highest activity is observed in kidneys [8]. Studies conducted on role of activity of prolidase activity on the bone cycle are scarce. In this study, we aimed to examine whether the measurement of prolidase activity in serum and erythrocyte is valuable in the evaluation of ROD and to assess the relations between serum parathormone (PTH), osteocalcin, calcitonin, vitamin D and bone-specific alkaline phosphatase (bAP). Moreover, we evaluated performance characteristics such as accuracy, precision, linearity, analytical sensitivity, limit of detection of prolidase assay.
Materials and methods
The patient group was consisted of totally 73 patients followed up in the department of nephrology due to CRF diagnosis including 21 male (age: 44.1±12.9 years) and 18 female (age: 41.3±12.9 years) patients undergoing peritoneal dialysis as well as 21 male (age: 48.5±20 years), 13 female (age: 51.7±19.5 years) patients undergoing hemodialysis. Patients with chronic liver disease or cancer were excluded from the study. According to the causes of CRF, hypertension patients (38.5%) had formed the largest part of our patient group. It was followed by diabetes mellitus (24.7%). Moreover, there were two patients with nephrotic syndrome, two patients with IgA nephropathy and one patient with SLE (Table 1).
Characteristics of the patients.
| Patient (n) | 73 |
| Age, years (mean±SD) | 46±16.5 |
| Female (%) | 31 (43) |
| Male (%) | 42 (57) |
| Duration of dialysis, month (mean±SD) | 46±50.1 |
| The frequency of dialysis per a week | 3 |
| Duration of dialysis session, hour | 3.5 |
| Primary renal disease | |
| Hypertension (%) | 28 (38.5) |
| Diabetes mellitus (%) | 18 (24.7) |
| Urolithiasis (%) | 4 (5.5) |
| Chronic glomerulonephritis (%) | 2 (5) |
| Amyloidosis (%) | 2 (2.7) |
| Nephrotic syndrome (%) | 2 (2.2) |
| IgA nephropathy (%) | 2 (2.2) |
| Hereditary (%) | 2 (2.2) |
| Chronic pyelonephritis (%) | 1 (1.4) |
| SLE (%) | 1 (1.4) |
| Unknown origin (%) | 11 (15.1) |
Control group was formed by totally 54 healthy volunteers including 25 men (mean age: 46±6.4 years) and 29 women (mean age: 45±10 years); who had no history of hypertension, diabetes mellitus, thyroid, chronic liver, kidney diseases and chronic medication as well as without cancer diagnosis (Table 1).
In hemodialysis patients, low flux membranes were used and surface of those membranes was 2 m2. In lean patients, membranes with a surface area of 1.5 m2 were used. In our patients, the mean surface area was 1.8 m2. We used the continuous ambulatory peritoneal dialysis (CAPD) technic for the peritoneal dialysis and the conventional technic for hemodialysis. Blood samples were collected in evacuated tubes with gel (Vacutainer SST, Becton-Dickinson) before and after dialysis in HD group and fasting samples in the control group. In peritoneal dialysis (PD) patients, blood samples were collected before dialysis.
Blood samples were centrifuged at 1300 g for 10 min within 30 min after blood collection. In serum samples, PTH and bAP parameters were studied within maximum 2 h in the sampling day. Serum samples which aliquoted for osteocalcin, calcitonin and vitamin D examinations were stored in −80°C; these tests were simultaneously performed. For determination of prolidase activity, erythrocyte package and hemolyzed samples were prepared and stored in −80°C until examination day.
Parathormone (PTH) was measured by chemiluminescent assay in Beckman Access DxI 800 immunochemistry analyzer (Beckman Coulter Inc, Fullerton, CA, USA). Osteocalcin and calsitonin measurements were made by immunoenzymatic technique by using DiaSource kits at Alisei Quality analyser (SEAC Radim Group, Pomezia, Italy). Vitamin D was measured by using RIA technique (DiaSource kits) at Gamma Counter C12 NE 1600. ALP activity was measured by Olympus AU 2700 chemistry analyzer (Hamburg, Germany) and then serum samples were inhibited by urea and measured ALP activity again for bAP. The difference of two results was calculated. The ALP assay calibration and control were made by Olympus AU 2700 chemistry analyser [9].
Preparation of packaged erythrocytes hemolysate
Blood samples with EDTA (Becton-Dickinson) were centrifuged for 3 min at 2000 rpm and plasma was discharged; the remaining erythrocyte package was suspended with equal amount of saline and suspension was centrifuged at 2000 rpm; supernatant was discharged. This washing process was repeated twice. The resultant erythrocyte package was hemolysed with 2.5 mmol/L MnCl2 with a ratio of 1:200. Hemolysates were aliquoted and aliquots were stored in −80°C until the examination day for the measurement of prolidase activity. Hemolysate preparation procedures were performed at room temperature.
Measurement method of prolidase enzyme activity
One hundred microliter of serum and 500 μL pre-incubation solution (1 mmol/L reduced glutathione, 5 mmol/L MnCl2 and 50 mmol/L Tris HCl buffer including 0.1% Triton-X100, pH 7.8) were incubated at 37°C for 3 h. From this mixture, 100 μL aliquot was taken and it was added to 100 μL pre-incubation solution including 144 mmol/L Gly-Pro and the mixture was incubated at 37°C for 30 min. Reaction was stopped by adding 1 mL 0.45 mol/L TCA into the mixture. The mixture was centrifuged at 1500 ×g for 10 min and the supernatant was separated. One milliliter glacial acetic acid and 1 mL Chinard solution (3 g/dL ninhydrin is dissolved in glacial acetic acid/6 mol/L orthophosphoric acid, v/v 55% and 45%, respectively and thus the solution is prepared) were added to 0.5 mL clear supernatant. After the mixture was incubated at 90°C for 20 min, it was cooled on ice and absorbance values of samples were read in a spectrophotometer (Shimadzu UV 120, Tokyo, Japan) at 515 nm against blank not including substrate. Proline concentrations measured were calculated in comparison with 5 mg/dL L-proline serving as standard solution [10].
Prolidase assay was linear up to 1.25 mmol/L (1250 μmoL/L=1250 U/L) with Pro; the detection limit was 0.0058 mmol/L L-proline and prolidase activity corresponding to above mentioned Pro concentration was ~6 U/L. Within-run and between-day CVs% in low and high control pools were found as 2.6, 3.6 and 4.03, 4.6, respectively. Percent recovery values of five pools established in recovery study were 0, 101, 96.6, 95.9, 98.8%, respectively (mean 98.5%) from low to high pool.
Statistical analysis
Descriptive statistics were calculated. Data of patient and control group were tested by Kolmogorov – Smirnov test in terms of normal distribution. It was found that both groups had not a normal distribution (p<0.05). For this reason, the nonparametric statistical methods for variables were measured. Patient (pre-hemodialysis, post-hemodialysis, peritoneal dialysis) and control groups were compared by Kruskal- Wallis test; when the difference between the groups was significant, Mann-Withney U test was used. Mann-Withney Uwas used for the difference between pre-hemodialysis and post-hemodialysis groups. Considering group comparisons, inter-group the differences were accepted as significant if p<0.05. Correlation between parameters was examined using Spearman correlation coefficient. For all statistical analyses, “SPSS for Windows ver. 15.00” statistical software package was used.
Ethical considerations
The study was approved by Institutional Review Board of Ankara Hospital (0228/2007). Informed consent was taken from all the subjects.
Results
Prolidase activities of patient and control groups are shown in Table 2. Serum prolidase activities of the peritoneal dialysis group were significantly different than that of the control group (p<0.05). Although the erythrocyte prolidase activity was relatively low in the patient group compared to the control group, the difference between groups was not statistically significant (p>0.05). Serum and erythrocyte prolidase activities were significantly lower in the pre-hemodialysis group in comparison with the control group (p<0.05). No significant difference was observed in any samples (serum, erythrocyte) between post-hemodialysis and control groups (p>0.05) (Figure 1).
Prolidase activities of the patients and control groups.
| PD [median (min–max)] | Pre-HD [median (min–max)] | Post-HD [median (min–max)] | Control [median (min–max)] | p-Value | |
|---|---|---|---|---|---|
| Erytrosite prolidase, U/gHb | 112 (9–281) | 99 (13–223) | 101 (23–313) | 129 (25–339) | 0.578a |
| 0.031b | |||||
| 0.093c | |||||
| 0.632d | |||||
| Serum prolidase, U/L | 1157 (637–1463) | 1153 (115–1448) | 1363 (149–2262) | 1529 (967–2110) | <0.001a |
| <0.001b | |||||
| 0.100c | |||||
| 0.004d | |||||
| Serum prolidase, U/L/Total protein, g/L | 18±4 | 18±6 | 0.799e | ||
| Osteocalsin, ng/mL | 56 (2–61) | 77.5 (20–223) | 77.5 (20–223) | 7.08 (0–22) | <0.001a |
| <0.001b | |||||
| <0.001c | |||||
| Calsitonin, pg/mL | 22 (1–194) | 13.25 (1–175) | 13.25 (1–175) | 16 (39–752) | 0.247a |
| 0.838 b | |||||
| 0.838 c | |||||
| Vit D, ng/mL | 24 (3–70) | 35.5 (3–158) | 35.5 (3–158) | 83 (23–194) | <0.001a |
| <0.001b | |||||
| <0.001c | |||||
| bAP, U/L | 65 (33–294) | 135 (39–752) | 135 (39–752) | 58 (31–98) | 0.247 a |
| <0.001b | |||||
| <0.001c | |||||
| PTH, pg/mL | 285 (47–1102) | 360 (8–1522) | 360 ( 8–1522) | 40.40 (17–48) | <0.001a |
| <0.001b | |||||
| <0.001c |
PD, peritoneal dialysis; Pre-HD, pre-hemodialysis; Post-HD, post-hemodialysis. ap-Value when PD and control groups are compared; bp-Value when pre-HD and control groups are compared; cp-Value when post-HD and control groups are compared; dp-Value when pre-HD and Post-HD groups are compared; ep-Value when pre-HD and post-HD groups are compared in terms of serum prolidase/total protein ratio.
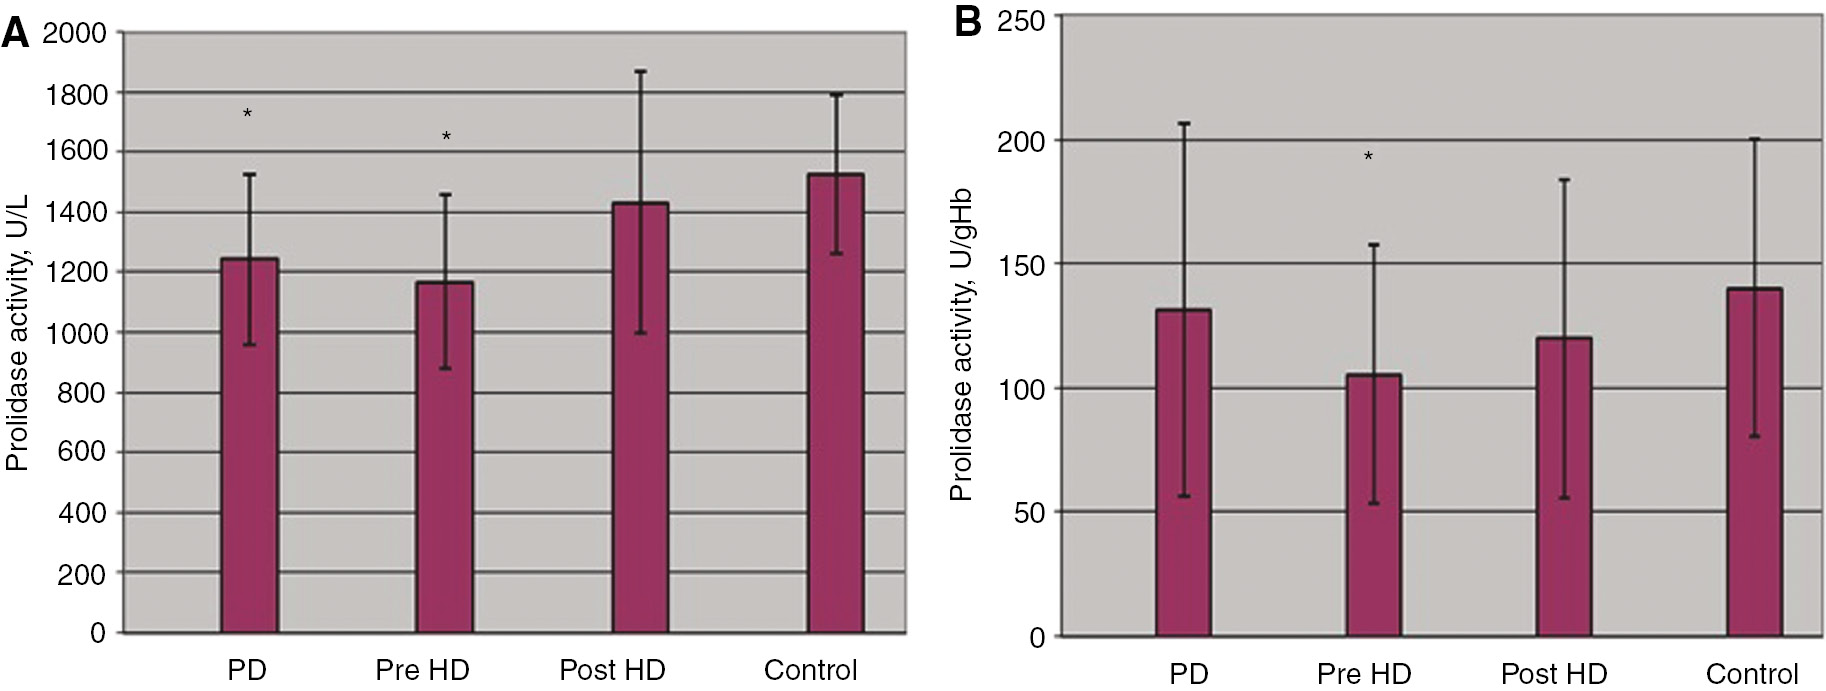
(A) Serum and (B) erythrocyte prolidase activity in patient and control groups. *p<0.05; PD, peritoneal dialysis; Pre-HD, pre-hemodialysis, Post-HD, post-hemodialysis.
When pre- and post- hemodialysis patients were compared, a significant difference was found in serum prolidase activities (p<0.05). Although the erythrocyte prolidase activity is relatively low in the pre-hemodialysis group in comparison with the post-hemodialysis group, inter-group the difference was not statistically significant (p>0.05). When prolidase activities were proportioned to total protein levels (pre-hemodialysis total protein: 66.2±8 g/L, post-hemodialysis total protein: 78.1±10.8 g/L), the difference between pre- and post-hemodialysis groups was disappeared (p>0.05) (Table 2).
In our study, when the patient and control groups were simultaneously examined, a weak correlation was found between serum prolidase activity and osteocalcin (r=−0.359; p<0.001), vitamin D (r=0.286; p<0.001) and PTH (r=0.156; p=0.048). There was no correlation between the prolidase activity and calcitonin, bAP and age (Table 3).
Peritoneal dialysis and hemodialysis patients were combined and divided into three sub-groups according to bAP levels as follows; ≤77 U/L [n=31, mean age 46±15 years, the low turnover disease group (LTBD),normal turnover bone disease (NTBD)] and ≥77 U/L [n=42, mean age 46±16.6 years, the high turnover bone disease group (HTBD)]. Among them, the prolidase activity in group with bAP ≥77 U/L was lower than that of group with bAP ≤77 U/L (p=0.049). When HTBD and NTBD/LTBD groups were compared, a significant difference was found in serum osteocalcin level (p<0.001), calcitonin level (p=0.050) (Table 4).
Correlation between markers in total control and patient groups.
| Prolidase | Osteocalsin | Calsitonin | Vit D | bAP | PTH | Age | |
|---|---|---|---|---|---|---|---|
| Prolidase | r=1.000 | r=−0.505 | r=0.039 | r=0.477 | r=−0.311 | r=−0.497 | r=0.024 |
| – | p=0.000 | p=0.667 | p=0.000 | p=0.000 | p=0.000 | p=0.791 | |
| Osteocalsin | r=−0.505 | r=1.000 | r=0.201 | r=−0.431 | r=0.607 | r=0.786 | r=−0.137 |
| p=0.000 | – | p=0.024 | p=0.000 | p=0.000 | p=0.000 | p=0.125 | |
| Calsitonin | r=0.039 | r=0.201 | r=1.000 | r=−0.007 | r=0.112 | r=0.076 | r=−0.190 |
| p=0.667 | p=0.024 | – | p=0.935 | p=0.213 | p=0.396 | p=0.034 | |
| Vit D | r=0.477 | r=−0.431 | r=−0.007 | r=1.000 | r=−0.249 | r=−0.491 | r=0.035 |
| p=0.000 | p=0.000 | p=0.935 | – | p=0.005 | p=0.000 | p=0.700 | |
| bAP | r=−0.311 | r=0.607 | r=0.112 | r=−0.249 | r=1.000 | r=0.474 | r=0.040 |
| p=0.000 | p=0.000 | p=0.213 | p=0.005 | – | p=0.000 | p=0.658 | |
| PTH | r=−0.497 | r=0.786 | r=0.076 | r=−0.491 | r=0.474 | r=1.000 | r=−0.118 |
| p=0.000 | p=0.000 | p=0.396 | p=0.000 | p=0.000 | – | p=0.187 | |
| Age | r=0.024 | r=−0.137 | r=−0.190 | r=0.035 | r=0.040 | r=−0.118 | r=1.000 |
| p=0.791 | p=0.125 | p=0.034 | p=0.700 | p=0.658 | p=0.187 | – |
The comparisons of variables between groups.
| NTBD and LTBD (bAP≤77 U/L) median (min–max) | HTBD (bAP)>77 U/L median (min–max) | p-Value | |
|---|---|---|---|
| Patient n (%) | 31 (% 42.4) | 42 (% 57.6 ) | |
| Year (x±s) | 46±15 | 46±17.6 | 0.900 |
| Sex | 19E+12K | 23E+19K | 0.848 |
| bAP (U/L) | 57 (33–77) | 139 (79–752) | <0.001 |
| Osteocalsin (ng/mL) | 43 (16–223.23) | 65 (16–260) | <0.001 |
| Calsitonin (pg/mL) | 11 (1.1–49) | 21.5 (1.2–194) | 0.050 |
| Vitamin D (ng/mL) | 29 (3–117) | 31.5 (9.1–158) | 0.055 |
| PTH (pg/mL) | 232 (23.6–1148) | 362.5 (8.2–1522) | 0.125 |
| Prolidase (U/L) | 1333.65(797.53–1817.42) | 1177.32 (115.4–1733.35) | 0.049 |
NTBD, normal bone turn-over disease; LTBD, low turn-over bone disease; HTBD, high turn-over bone disease. When LTBD and HTBD groups were compared to the NTBD group, a statistically significant difference was found (p<0.05).
Discussion
In the present study, we show that the prolidase activity of peritoneal dialysis and pre-hemodialysis groups are lower than that of the control group; and there is no difference between post-hemodialysis and control groups and that of the control group in terms of the prolidase activity, but the prolidase activity of pre-hemodialysis group is lower than that of post-hemodialysis group.
Efforts for prolonging the survival of patients with terminal stage renal failure due to various reasons via replacement therapies also increase the complications in various systems. One complication of the CRF with high morbidity is ROD [1], [2]. Reliable and non-invasive methods are required for assessing the bone metabolism in uremic patients.
The serum prolidase activity and its relationship with some biochemical markers were studied in various disorders such as postmenopausal osteoporosis, osteoarthritis, uremia, type 2 DM, nondiabetic metabolic syndrome [11]. In our study, it was examined whether plasma, erythrocyte or serum prolidase is an indicator of ROD in patients who were diagnosed as CRF and were undergone chronic hemodialysis or peritoneal dialysis. Moreover, the relations of prolidase activity with other bone indicators (osteocalcin, bone specific ALP, calcitonin), vitamin D and PTH were investigated. Additionally, the performance characteristics of the prolidase measurement method were examined in our study.
Gejyo et al. compared erythrocyte prolidase activities of pre-hemodialysis (30.3±0.2 nmol/h/gHb), post-hemodialysis (31.8±9.5 nmol/h/gHb) and uremic patients (36.5±7.8 nmol/h/gHb) with those of the control group (48.2±9.8 nmol/h/gHb) and they had found significant differences in all comparisons (p<0.001). However, they could not find a significant difference in the comparison between pre- and post-hemodialysis groups (p>0.05). They had stated that hemodialysis did not cause the improvement in decreased erythrocyte prolidase activity and low-molecule uremic toxins could not lead to rapid change in enzyme activity [12]. In our study, there was no difference between pre- and post-hemodialysis groups in terms of erytrocyte prolidase activities (p>0.05). Our results were found compatible with findings of Gejyo et al.
In our study, the serum prolidase activity in the post-hemodialysis group was higher than that of the pre-hemodialysis group and the difference between those groups was significant (p<0.05). However, disappearance of the difference when the prolidase activity was proportioned to their protein levels showed that the decrease in the prolidase activity following hemodialysis was originated from hemodilution arising from excess fluid retention and so hemodialysis procedure had no effect on the prolidase activity. There is no similar study which prolidase activity was proportioned to the protein level in the literature.
In the literature, bAP >77 U/L (20 mg/mL) is defined as HTBD whereas bAP <51 U/L is defined as LTBD [13], [14]. Considering these values in all our patient groups (n=73), the prolidase activity in patients with bAP≥77 U/L (n=42) were found low in comparison to patients with bAP <51 U/L (n=14). This finding suggests that the serum prolidase activity may have diagnostic value in determining the type of uremic bone disease in patients with CRF. No significant difference could be found between LTBD and NTBD in terms of serum prolidase activities (p>0.05). When serum prolidase activities were compared between HTBD group and NTBD group, a significant difference was found (p=0.042).
Evrenkaya et al. divided patients (n=44) into three groups according to level of bAP. Patients with bAP ≥77 U/L (n=18, Mean age 58.3±13.0) were referred as HTBD, while patients with bAP ≤51 U/L (n=14, mean age 59.0±15.9 years) were referred as LTBD and patients with bAP 51–77 U/L (n=12, mean age 51.9±18.7 years) were classified as normal turnover bone disease. The authors could not find a statistically significant difference between study groups in terms of prolidase activities (p>0.05). Moreover, they reported that the prolidase level is decreased by CRF, but it is no diagnostic importance for differential diagnosis of uremic bone disease [15]. In our opinion, the reason for poor correlation or the assessment of the prolidase activity with other bone markers is, substantial decrease of the prolidase activity in CRF. The principal determinant of prolidase decrease is CRF. In the literature, there is no other study revealing the relation of prolidase activity with other bone markers in CRF. In our study, peritoneal dialysis and hemodialysis patients are handled with DM (n=18) and without (n=55) were classified as. When the prolidase activity of DM (1218±247 U/L) with non-DM (1207±299 U/L) were compared, there was no significant difference (p=0.878). In the literature, there are few studies which are related to the effect of prolidase in bone turnover: Erbağcı et al. divided type 2 DM patients by comparing them whether having a history of osteoporosis and reported that the patient group had lower prolidase activity than the control group (p<0.001). It was suggested that the increased enzyme activity in patients with osteoporosis was resulting from increased bone resorption. Erbagci et al. reported that decreased serum prolidase activity in type II DM was resulted from decreased bone turnover rate and bone resorption [16]. The results of our study are similar to those study.
Verit et al. conducted a study involving post-menopausal osteoporotic women, post-menopausal non-osteoporotic women and pre-menopausal health women. They found that serum pyrolidase activity was lower in the women with post-menopausal osteoporosis than the group of women without post-menopausal osteoporosis and of women without pre-menopausal osteoporosis. However, there was no significant difference between groups in terms of the prolidase activity [17].
In conclusion, we believe that the prolidase activity may be an indicator of ROD in CRF and it may also be definitive in determining the type of uremic bone disease. However, in CRF, uremic toxins may generally suppress enzyme activity. On the other hand, the dialysis procedure, particularly hemodialysis, may change enzyme activity. But, in our study, there was no difference in erythrocyte prolidase activity between pre- and post-hemodialysis samples and the study showed that hemodialysis had no effect on prolidase activity when normalized to protein concentration. Therefore it is a better approach in hemodialysis patients to evaluate the prolidase activity by considering the protein concentration. Cheapness and ease-to-measure, superiority of performance measures makes the prolidase activity convenient for routine studies. However, long pre-incubation time and the presence of multiple process stages make it difficult to automatize the procedure.
Conflict of interest: There are no conflicts of interest among the authors.
References
1. Urena P, Vrenejoul MC. Circulating biochemical markers of bone remodeling in uremic patients. Kidney Int 1999;55:2141–56.10.1046/j.1523-1755.1999.00461.xSearch in Google Scholar
2. Aljama P, Cruz JM, Martin de Francisco AL. New insights in ESRD. Kidney Int 2002;80:1–27.Search in Google Scholar
3. Endo F, Tanoue A, Nakai H, Hata A, Indo Y, Titani K, et al. Primary structure and gene localization of human prolidase. J Biol Chem 1989;264:4476–81.10.1016/S0021-9258(18)83768-1Search in Google Scholar
4. Myara I, Cosson C, Moatti N, Lemonnier A. Human kidney prolidase –purification, preincubation properties and immunological reactivity. Int J Biochem 1994;26:207–14.10.1016/0020-711X(94)90147-3Search in Google Scholar
5. Kobayashi M, Shimizu S. Cobalt proteins. Eur J Biochem 1999;261:1–9.10.1046/j.1432-1327.1999.00186.xSearch in Google Scholar
6. Tanaue A, Endo F, Matsuda I. Structural organization of the human prolidase and demonstration of a partial gene deletion in a patient with prolidase deficiency. J Biol Chem 1990;26:11306–11.10.1016/S0021-9258(19)38592-8Search in Google Scholar
7. Myara I, Myara A, Mangeat M, Fabre M, Charpentier C, Lemonnier A. Plasma prolidase activity. A possible index of collagen catabolism in chronic liver disease. Clin Chem 1984;30:211–5.10.1093/clinchem/30.2.211Search in Google Scholar
8. Hui KS, Lajtha A. Prolidase activity in brain:comparison with other organs. J Neurochem 1978;30:321–7.10.1111/j.1471-4159.1978.tb06533.xSearch in Google Scholar
9. Mass DW, Henderson AR. Enzymes. In: Burtis CA, Ashwood ER, editors. Tietz tetxtbook of clinical chemistry. Philedelphia: Saunders, 1994:843.Search in Google Scholar
10. Özcan Ö, Gültepe M, İpçioğlu OM, Bolat B, Kayadibi H. Optimisation of photometric enzyme activity measurement method in assessing absolute activity of prolidase. Turk J Biochem 2007;32:12–6.Search in Google Scholar
11. Skorecki K, Green J, Brenner BM. Chronic renal failure. In: Braunwald E, Fauci AS, Kasper D, Longo DL, Hauser SL, Jameson JL, editors. Harrison principle of internal medicine. 16th ed. New York: McGraw Hill Company, 2005:1653–67.Search in Google Scholar
12. Gejyo F, Kishore BK, Arakawa M. Prolidase and prolinase activities in the erythrocytes of patients with chronic uremia. Nephron 1983;35:58–61.10.1159/000183046Search in Google Scholar
13. Ureña P, Hruby M, Ferreira A, Ang KS, de Vernejoul MC. Plasma total versus bone alkaline phosphatase as markers of bone turnover in hemodialysis patients. J Am Soc Nephrol 1996;7:506–12.10.1681/ASN.V73506Search in Google Scholar
14. Coen G, Ballanti P, Mazzaferro S, Pasquali M, Bonucci E. Procollagen type I C-terminal peptide, PTH and 1, 25 (OH)2 D3 in chronic renal failure. Bone 1993;14:415–20.10.1016/8756-3282(93)90173-8Search in Google Scholar
15. Evrenkaya TF, Atasoyu EM. The role of prolidase activity in the diagnosis of uremic bone disease. Renal Fail 2006;28:271–4.10.1080/08860220600577726Search in Google Scholar
16. Erbağcı AB, Araz M, Erbağcı A, Tarakçıoğlu M, Namıdur ES. Serum prolidase activity as a marker of osteoporosis in type 2 diabetes mellitus. Clin Biochem 2002;35:263–8.10.1016/S0009-9120(02)00305-3Search in Google Scholar
17. Verit FF, Geyikli I, Yazgan P, Celik A. Correlations of serum prolidase activity between bone turnover markers and mineral density in postmenopausal osteoporosis. Arch Gynecol Obstet 2006;274:133–7.10.1007/s00404-006-0148-9Search in Google Scholar PubMed
©2017 Walter de Gruyter GmbH, Berlin/Boston
Articles in the same Issue
- Frontmatter
- Review Article
- Automation in the clinical laboratory: integration of several analytical and intralaboratory pre- and post-analytical systems
- Research Articles
- Flow cytometric detection of endothelial progenitor cells (EPC) in acute coronary syndrome
- Evaluation of prolidase activity in uremic bone disease
- The independent relationship between hemoglobin A1c and homeostasis model assessment of insulin resistance in non-diabetic subjects
- Association of missense substitution of A49T and V89L in the SRD5A2 gene with prostate cancer in Turkish patients
- Delays in reporting critical values from clinical laboratories to responsible healthcare staff
- Re-determining the cut-off points of FIB-4 for patients monoinfected with chronic hepatitis B virus infection
- Approach to pre-analytical errors in a public health laboratory
- Serum proPSA as a marker for reducing repeated prostate biopsy numbers
- NT-proBNP levels in β-thalassemia major patients without cardiac hemosiderosis
- Comparison of high sensitive and conventional troponin assays in diagnosis of acute myocardial infarction
- Assessment of macroprolactinemia rate in a training and research hospital from Turkey
- Opinion Papers
- Evaluation of the first Turkish in vitro diagnostic symposium
- The report of the 1st Turkey in vitro diagnostic symposium results
- Venous blood gases: is it useful in COPD?
- Letter to the Editor
- How are ethical issues in the laboratory medicine held in Turkey? A perspective view through medical ethics and clinical laboratory science