Bayesian Analysis of Tuberculosis Cases in Bolgatanga Municipality, Ghana–West Africa
-
Ernest Zamanah

 and
Suleman Nasiru
and
Suleman Nasiru

Abstract
Tuberculosis (TB) represents a major threat to global health security and is currently the world most deadly infectious disease. TB is noted to affect people of all age groups and exposure to the disease has been shown to exhibit variation in the risk of infection across different factors. This study was therefore carried out to identify possible disease associations of some risk factors in relation to time until onset of TB among TB infected individuals in the Bolgatanga Municipality of the Upper East Region of Ghana. To this end, secondary data on time until onset of TB was obtained from the Bolgatanga Regional Hospital of the Upper East Region of Ghana and used for statistical analysis. In order to obtain appropriate underlying disease associations, the Bayesian approach to the modelling of survival time was employed in the statistical analyses. Thus, different parametric models including; skew normal, lognormal, shifted lognormal, exponential, Weibull and Fréchet models were fitted to the TB data within the Bayesian framework. The Weibull was the overall best fitted model. Based on the estimation results of the Bayesian Weibull regression model; individuals with no education, individuals with diabetes and males were identified as high-risk groups with shorter time frame for the onset of TB in the Bolgatanga Municipality. The study was concluded by indicating the need for Ghana Health Service to institute targeted interventions aimed at preventing and controlling the TB with special emphasis to the high-risk groups in the Bolgatanga Municipality.
1 Introduction
Tuberculosis (TB) is a communicable disease that mostly affects the lungs with mycobacterium tuberculosis, a type of bacteria being the causative agent. As an airborne disease, the bacteria are transmitted when infected people with the disease release bacteria into the air through coughing, sneezing or spitting (Kiani et al. 2021).
TB represents a major public health problem worldwide and poses a significant threat to health security. The incidence of tuberculosis has been shown to exhibit an increasing trend since 2021 with recorded cases exceeding 10 million every year. In 2023, the total number of TB recorded cases was about 10.8 million around the globe with 6.0 million cases attributed to men, 3.6 million cases being women and about 1.3 million cases attributed to children (Deku et al. 2024; World Health Organization [WHO] 2024). Globally, 1.25 million mortalities resulted from TB infections with 1.09 million deaths attributed to HIV-negative people and 161,000 deaths associated with HIV-positive people (WHO 2024). Although some level of progress has been made in the fight against TB, TB has replaced COVID-19 as the current global leading cause of death from a single infectious agent after COVID-19 held the position from 2019 to 2021 (Berida and Lindsley 2024; WHO 2024).
Currently, TB is found everywhere in the world. In 2023, the South-East Asia Region accounted for 45 % of all TB cases in the world. The second largest incidence of TB cases occurred in the African Region accounting for 24 % of all cases whilst Western Pacific Region accounted for 17 % (WHO 2024).
TB has been an old age major health related problem in Africa and Ghana in particular. In Africa, TB is noted as one of the top ten causes of death, outranking HIV/AIDS (WHO 2020). In 2021, the incidence of TB in Ghana was shown to be 136 per 100,0000 with a mortality rate of 36 per 100,000 people (WHO 2023). On annual bases, about 44,000 cases of TB are recorded in Ghana with an estimated mortality of 10,000 cases. Noted as the seventh leading cause of mortality in Ghana, the distribution of TB cases has been shown to exhibit regional variations in Ghana with Upper East Region established as one of the regions with an increased likelihood of TB infection (Iddrisu et al. 2024).
Globally, TB affects people of all age groups and exposure to the disease has been shown to exhibit variation in the likelihood of infection across different risk factors. People with disease conditions such as HIV/AIDS or diabetes that compromise the immune system are noted to be at risk of getting infected with TB (Umeta et al. 2022). Some other covariates include alcohol use, cigarette smoking and educational level among others (Umeta et al. 2022).
Considerable progress has been made in relation to the treatment and elimination of TB in Ghana (Deku et al. 2024). However, there is paucity of data in relation to assessing the age of onset of TB across different risk factors in the Bolgatanga Municipality of the Upper East Region of Ghana. Bayesian estimation procedure is a useful method in modelling the time until onset of infectious diseases (Rastegar et al. 2024). Thus, the primary objective of this study was to evaluate possible risk factors associated with the time frame until onset of TB and determine possible disease associations in the Bolgatanga Municipality of the Upper East Region of Ghana by applying the Bayesian approach.
The structure for the rest of the article is as follows: In Section 2, the materials and methods are presented whilst Section 3 outlines the results and discussions. Section 4 finally presents the conclusions and recommendations of the study.
2 Materials and Methods
2.1 Study Design
Secondary data on tuberculosis was obtained for this study through a retrospective cohort study design.
2.2 Study Area
The Bolgatanga Municipality of the Upper East Region of Ghana represented the study area of this work. As the administrative capital of the Upper East Region of Ghana, the Bolgatanga Municipality is home to the Bolgatanga Regional Hospital. The hospital serves as a referral center for all private health facilities within the Municipality and also provides healthcare services to all patients within the Municipality and beyond.
2.3 Study Population
The participants representing the study population included recorded history of tuberculosis patients from 2015 to 2024 at the Bolgatanga Regional Hospital.
2.4 Inclusion and Exclusion Criteria
The medical records of all tuberculosis cases from 2015 to 2024 were included in the study. Medical records of tuberculosis cases were however excluded from the study where information on patients age were unavailable.
2.5 Data Collection
Secondary data on tuberculosis were obtained from the Bolgatanga Regional Hospital of the Upper East Region of Ghana by reviewing the medical histories of all tuberculosis cases recorded from 2015 to 2024. The Records Department of the Bolgatanga Regional Hospital is staffed with qualified and well trained personnel. Thus, the review of the medical records was done by the staff of the Records Department of the hospital. In all, the data were obtained from the records of 343 patients infected with TB in the Bolgatanga Municipality. The time frame representing the age of the patients from birth until onset of tuberculosis was the variable of interest in the study. Other variables such as diabetes status of patients at the time of TB diagnosis, sex of patient, marital status, employment status, religion and educational level were used as independent variables in the study.
2.6 Ethical Approval
The data were provided and approved for its use by the Records Department of the Bolgatanga Regional Hospital upon written request for the data. Personal information and identification numbers of patients were excluded from the data given out for this study. This, ensured confidentiality in the use of the data that were obtained for the study.
2.7 Study Variables
2.7.1 Dependent Variable
Time until the onset of TB represented the response variable for the study. Thus, the age of patient in years from birth until onset of TB was the variable of interest.
Starting time : Starting time is the age at birth of the TB patient.
End time : is the age at which the event occurred. That is, the age of TB diagnosis.
2.7.2 Independent Variables
Sex : As a prognostic factor, sex refers to male and female categories of the patients.
Marital Status : Three categories (married, single and divorced/widowed) were defined for marital status of the patients as an independent variable.
Employment Status : Two categories (Employed and Unemployed) were defined for the employment status of the patients.
Religion : Three categories (Muslim, Christian and Traditionalist) were defined for the religion of patients.
Educational Level : Four categories (No education, Primary, Secondary and Tertiary) were defined for educational level of the patients.
Diabetes Status : For the diabetes status of the patients, two categories (Yes and No) were defined.
2.8 Statistical Analysis
2.8.1 Bayesian Inference
Consider a random sample of independently and identically distributed survival times
where
is an indicator variable.
The Bayesian approach utilizes prior distributions of the unknown parameters η of the likelihood function in the modelling process. Before the sample t j , is observed, the prior distribution gives a reflection of existing knowledge about the parameter space η. Considered as stochastic, appropriate distributions known as prior distributions are assigned to all the parameters η within the Bayesian framework (Blangiardo and Cameletti 2015).
In a posterior inference, a probability distribution known as the posterior distribution is produced by combining the likelihood function of the sample and prior distributions (Blangiardo and Cameletti 2015). Given the observed data, the posterior distribution, denoted by P(η|t j ) is the conditional distribution of the parameters. Defined as the product of the likelihood function and the prior distributions P(η), the posterior distribution is given by
Alternatively, the posterior distribution can be expressed as
with
To assess the adequacy of the Bayesian model, trace and density plots of the parameter estimates of posterior distributions were utilized through Markov Chain Monte Carlo (MCMC) procedures to determine model convergence in this study.
2.8.2 Bayesian Analysis Using Weibull Model
Consider that the distribution of the random sample of survival times
and
The survival function of the Weibull distribution is given by
In building the Weibull regression, the log link function is used to introduce covariates to the regression structure such that
where W′ is a k × 1 vector of explanatory variables and φ is a k × 1 vector of regression coefficients. That is,
Thus,
This therefore gives the likelihood function as
In building the posterior distribution, the prior distributions for the regression coefficients and shape parameter of the model are specified. In the current study, a Gaussian prior was chosen for the regression coefficients such that
By applying the Bayes theorem, the joint posterior distribution is given by
That is,
2.8.3 Bayesian Analysis Using Exponential Model
Consider that the distribution of the random sample of survival times
The CDF and survival function of the exponential distribution are given respectively by
and
Using the log link function, the exponential regression is defined such that
where W′ is a k × 1 vector of explanatory variables and φ is a k × 1 vector of regression coefficients. That is,
Thus,
This therefore gives the likelihood function as
By choosing a Gaussian prior for the regression coefficients such that
That is,
2.8.4 Bayesian Analysis Using Lognormal Model
Consider that the distribution of the random sample of independently and identically distributed survival times
and
The survival function of the lognormal distribution is given by
Using the log link function, the lognormal regression is defined such that
where W′ is a k × 1 vector of explanatory variables and φ is a k × 1 vector of regression coefficients. That is,
Thus,
This therefore gives the likelihood function as
By choosing a Gaussian prior for the regression coefficients such that
That is,
2.8.5 Bayesian Analysis Using Skew Normal Model
Consider that the distribution of the random sample of independently and identically distributed survival times
where Φ(⋅) and ϕ(⋅) represent the CDF and PDF of the standard normal distribution respectively. The CDF is
and
where T(u,v) is Owen’s T function.
The survival function of the skew normal distribution is given by
Using the log link function, the skew normal regression is defined such that
where W′ is a k × 1 vector of explanatory variables and φ is a k × 1 vector of regression coefficients. That is,
Thus,
This therefore gives the likelihood function as
By choosing a Gaussian prior for the regression coefficients such that
That is,
2.8.6 Bayesian Analysis Using Shifted Lognormal Model
Consider that the distribution of the random sample of independently and identically distributed survival times
The CDF of the shifted lognormal distribution is given by
The survival function of the shifted lognormal distribution is given by
Using the log link function, the shifted lognormal regression is defined such that
where W′ is a k × 1 vector of explanatory variables and φ is a k × 1 vector of regression coefficients. That is,
Thus,
This therefore gives the likelihood function as
By choosing a Gaussian prior for the regression coefficients such that
That is,
2.8.7 Bayesian Analysis Using Fréchet Model
Consider that the distribution of the random sample of survival times
and
The survival function of the Fréchet distribution is given by
Using the log link function, the Fréchet regression is defined such that
where W ′ is a k × 1 vector of explanatory variables and φ is a k × 1 vector of regression coefficients. That is,
Further,
Thus,
This therefore gives the likelihood function as
By choosing a Gaussian prior for the regression coefficients such that
That is,
2.9 Model Selection Criteria
To determine the model of best fit to the TB data, leave one out cross-validation (LOO-CV) criterion and the widely applicable information criterion (WAIC) were used in the study. The LOO-CV due to Vehtari et al. (2017) is a method that utilizes the log-likelihood evaluated at the posterior simulations of the parameter values to estimate pointwise out-of-sample prediction accuracy from a fitted Bayesian model. The LOO-CV is given as
where
is the LOO predictive density for data point w j given the remaining data points w -j and φ represents the parameter space of the model.
As an information-based model selection criterion, the WAIC is given by
where
3 Results and Discussions
3.1 Summary Statistics
Figure 1 presents the histogram and kernel density plots of the time until onset of TB. The results show that the ages of the patients until onset of TB are skewed to the right. That is, majority of the TB patients experienced the onset of TB at a younger age on average.
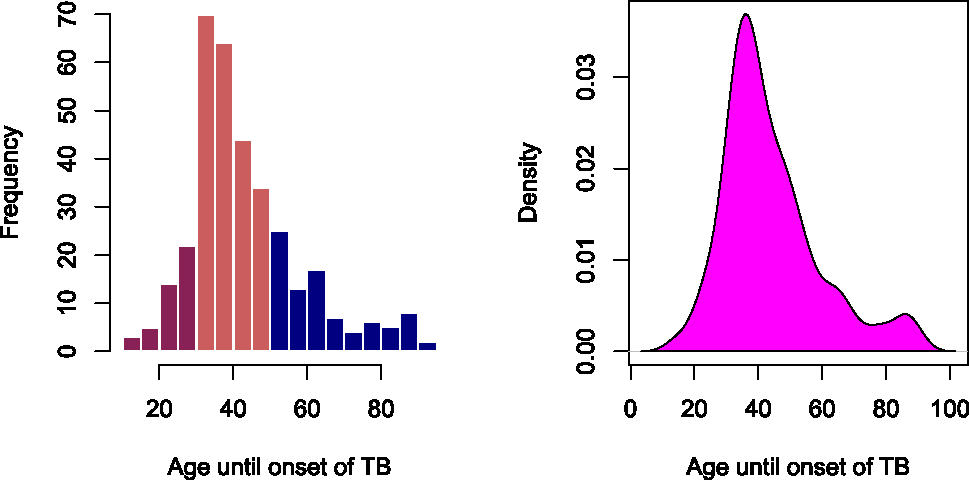
Histogram and kernel density plots of the tuberculosis data.
Table 1 shows the descriptive statistics illustrating the distribution of the patients across various categories of the predictor variables. Table 1 shows that among the different sexes, TB infections were high among males accounting for 72.3 % of all the infections. Also, majority of the patients representing 64.1 % were married followed by 30.3 % of the patients being single. Further, the section of the patients who were unemployed represented a majority of 70.0 % compared to the employed group. Across the various religions, majority of the TB infections representing 56.6 % were shown to be among Christians. Across various educational levels also, the level of TB infection was higher among those with no form of formal education accounting for 43.1 % of the infections. Finally, the descriptive statistics showed diabetes as a comorbidity among 27.4 % of the patients infected with TB.
Descriptive statistics of patients based on some predictor variables.
| Variable | Category | Frequency (%) |
|---|---|---|
| Sex | Female | 95 (27.7 %) |
| Male | 248 (72.3 %) | |
| Marital status | Divorced/Widowed | 19 (5.5 %) |
| Married | 220 (64.1 %) | |
| Single | 104 (30.3 %) | |
| Employment status | Unemployed | 103 (30.0 %) |
| Employed | 240 (70.0 %) | |
| Religion | Christian | 194 (56.6 %) |
| Muslim | 30 (8.7 %) | |
| Traditional | 119 (34.7 %) | |
| Educational level | No education | 148 (43.1 %) |
| Primary | 58 (16.9 %) | |
| Secondary | 108 (31.5 %) | |
| Tertiary | 29 (8.5 %) | |
| Diabetes status | Yes | 94 (27.4 %) |
| No | 249 (72.6 %) |
3.2 Model Selection Results
To evaluate the effects of the predictor variables on the time until onset of TB in the Bolgatanga Municipality, Bayesian parametric models were fitted to the TB data and their performances compared using the LOO-CV criterion and WAIC. Table 2 shows the accuracy measures of the fitted Bayesian regression models. The results showed the Weibull model as the best fitted model with least values of LOO-CV and WAIC.
Model accuracy results on the tuberculosis data.
| Model | LOO estimates | WAIC | |
|---|---|---|---|
| Elpd-diff | se-diff | ||
| Weibull | 0.0000 | 0.0000 | 2,643.6000 |
| Lognormal | −10.4000 | 7.5000 | 2,664.4000 |
| Shifted lognormal | −11.7000 | 8.0000 | 2,666.9000 |
| Skew normal | −31.0000 | 9.0000 | 2,705.5000 |
| Fréchet | −56.3000 | 14.4000 | 2,754.5000 |
| Exponential | −317.1000 | 12.9000 | 3,277.8000 |
-
Bolded means best based on selection criteria.
Table 3 shows the parameter estimates of the posterior distribution for the Weibull regression model. Among the predictors, the results showed sex, religion, educational level and diabetes status to be statistically significant at 95 % confidence level.
Parameter estimates of Weibull Bayesian regression on the tuberculosis data.
| Parameter | Estimates | Standard error | 95 % Credible interval | Rhat | Bulk_ESS | Tail_ESS | |
|---|---|---|---|---|---|---|---|
| Intercept | 3.86 | 0.07 | (3.74, 4.00) | 1.00 | 5,513 | 4,212 | |
| Sex | Male | −0.26 | 0.04 | (−0.33, −0.19) | 1.00 | 6,392 | 4,596 |
| Female (Ref) | |||||||
| Marital status | Married | 0.01 | 0.06 | (−0.11, 0.12) | 1.00 | 5,582 | 4,343 |
| Single | −0.09 | 0.06 | (−0.22, 0.02) | 1.00 | 5,361 | 3,992 | |
| Divorced (Ref) | |||||||
| Employment status | Unemployed | −0.04 | 0.03 | (−0.10, 0.02) | 1.00 | 6,760 | 4,359 |
| Employed (Ref) | |||||||
| Religion | Muslim | 0.02 | 0.05 | (−0.01, 0.18) | 1.00 | 7,320 | 4,139 |
| Traditional | 0.17 | 0.03 | (0.10, 0.21) | 1.00 | 7,416 | 4,609 | |
| Christian (Ref) | |||||||
| Educational level | Primary | 0.22 | 0.04 | (0.14, 0.29) | 1.00 | 6,925 | 4,878 |
| Secondary | 0.22 | 0.03 | (0.15, 0.28) | 1.00 | 6,880 | 5,101 | |
| Tertiary | 0.28 | 0.05 | (0.18, 0.38) | 1.00 | 6,976 | 4,966 | |
| None (Ref) | |||||||
| Diabetes status | Yes | −0.15 | 0.03 | (−0.21, −0.09) | 1.00 | 7,099 | 4,315 |
| No (Ref) | |||||||
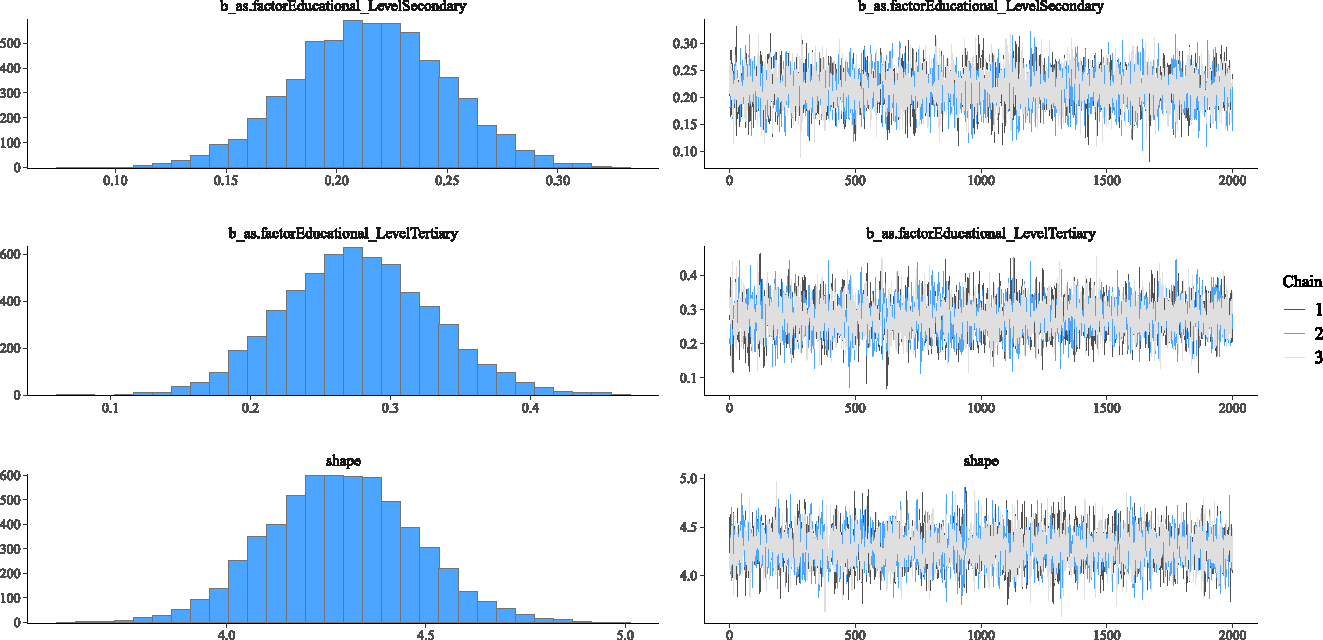
3.3 Model Diagnostic Checks
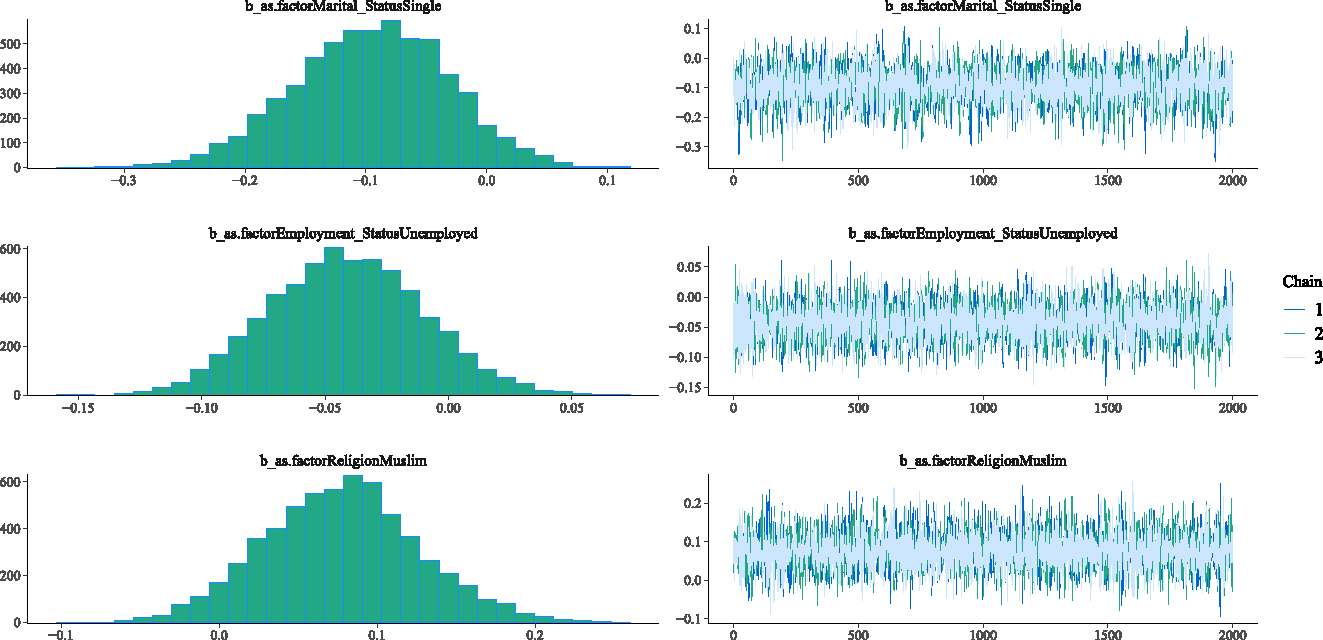
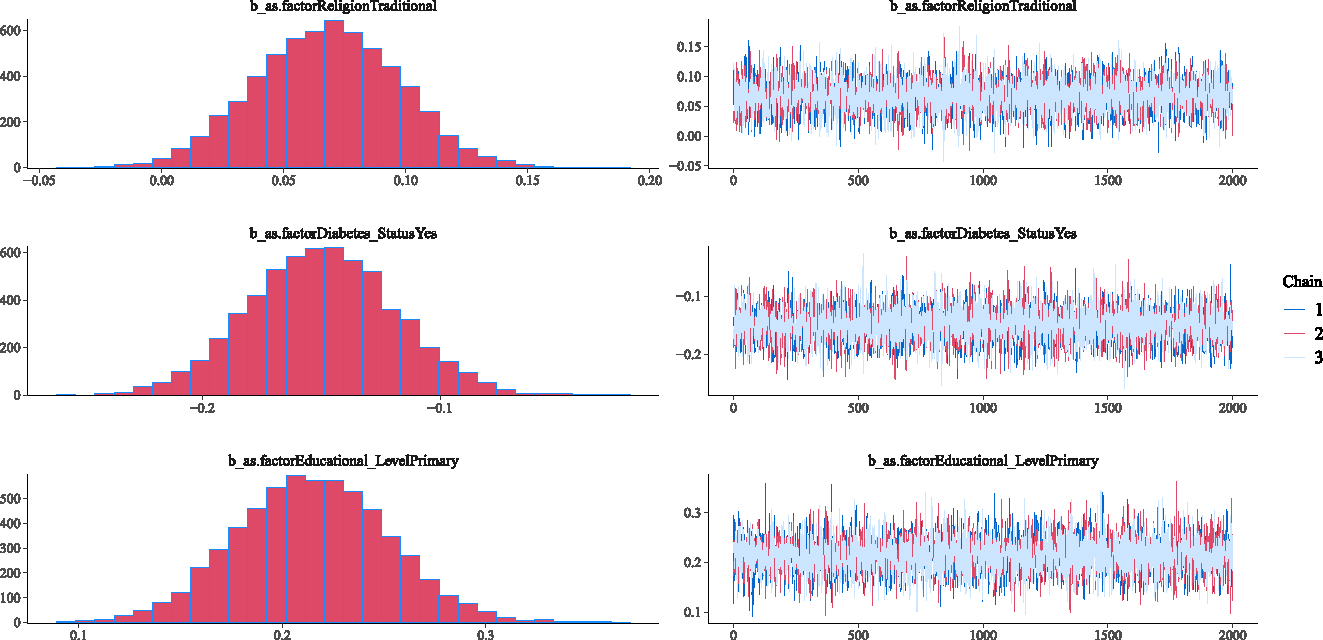
This section investigates the adequacy of the fitted Weibull Bayesian regression model to determine whether there was satisfactory model convergence. Figures 2–5 show the trace and density plots of the parameters of the fitted Weibull Bayesian regression model. The results showed an overlay of the chains illustrating a good mixing of the three chains for all the parameters. The results confirm that the Monte Carlo Markov Chain simulation converged satisfactorily to the target posterior distribution in the estimation of the parameters. The results in Table 3 also support this finding with the Rhat values being 1 for all the parameters of the model.
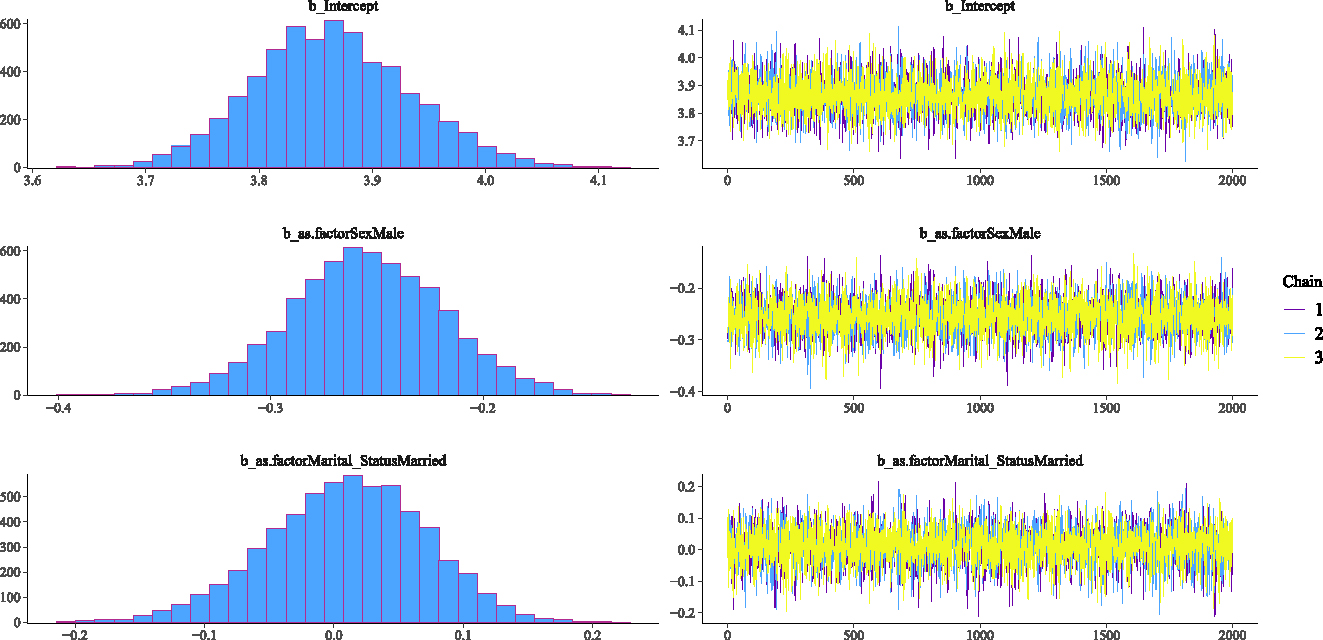
Density and Trace plot of Weibull Bayesian regression parameters.
Density and Trace plot of Weibull Bayesian regression parameters.
Density and Trace plots of some parameters for Weibull Bayesian regression parameters.
Density and Trace plot of Weibull Bayesian regression parameters.
Further, the posterior predictive plot in Figure 6 shows an overlap of the posterior and replicated distributions having the same trend. The results confirm that the posterior predictive capability of the Weibull regression model was adequate in modelling the time until onset of TB in the Bolgatanga Municipality.
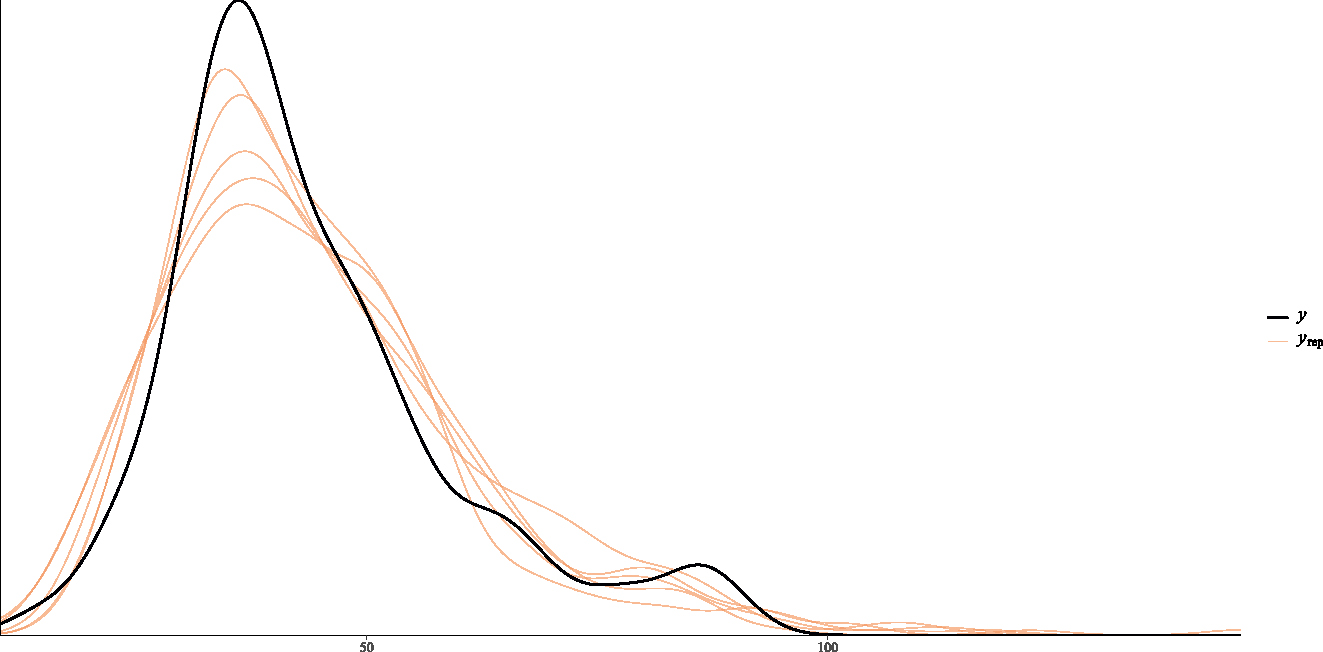
Posterior predictive plot of Weibull Bayesian regression.
3.4 Discussions
The time frame for onset of TB in the Bolgatanga Municipality was shown to be skewed to the right from the summary results of the study thereby making classical regression analysis inappropriate for application. Also, the summary results showed that 27.4 % of the patients infected with TB had diabetes as a comorbidity.
As a robust modelling approach, the Bayesian framework was utilized in modelling time until onset of TB as a response variable in this study. Varied Bayesian parametric models that were empirically evaluated included: skew normal, lognormal, shifted-lognormal, exponential, Weibull and Fréchet Bayesian regression models. The Weibull Bayesian regression model was the best performing model with least values of LOO-CV and WAIC.
The posterior estimation results of the Weibull Bayesian regression identified sex, religion, educational level and diabetes status as statistically significant prognostic factors at 95 % confidence level. However, marital status and employment status showed no statistical significance.
Thus, at the 95 % confidence level, the results illustrated a statistically significant difference in the time frame for the onset of TB between males and females. Specifically, it was empirically established that the time frame for onset of TB is shorter in males than females. This shows that men get TB at a younger age than women. Thus, males have a higher risk of getting infected with TB at a younger age than that of females in the Bolgatanga Municipality. This observation is consistent with Humayun et al. (2022) that males have a higher risk of getting infected with TB at a younger age than that of females.
Again, the findings showed a statistically significant difference in the time frame for the onset of TB between Christians and Traditionalists. The findings specifically confirmed that Traditionalists have a longer time frame for the onset of TB compared to Christians. Between Christians and Muslims however, the results showed no significant difference in the time frame for the onset of TB. The difference could be as a result of the mass gatherings associated with both Christian and Muslim worship compared to Traditional worship. This finding is consistent with the observations of other studies such as Hoang and Gautret (2018) and Yezli et al. (2023) that mass gathering, as practiced by Muslims and Christians, is associated with an increased risk of TB infection.
Across different educational levels, the findings indicated a statistically significant difference in the time frame for the onset of TB between individuals with no form of formal education and those with higher educational levels. Specifically, the results confirmed that individuals with higher educational levels (primary, secondary and tertiary) have a longer time frame for the onset of TB compared to those with no formal education. That is, individuals with lower levels of education get infected with TB at a younger age compared to individuals with higher levels of education. This finding is consistent with Medhi and Mahanta (2008) that individuals with lower levels of education get infected with TB at a younger age compared to individuals with higher levels of education.
The findings further established a statistically significant difference in the time frame for the onset of TB between individuals infected with diabetes and individuals without diabetes. Specifically, the findings confirmed that individuals infected with diabetes have a shorter time frame for the onset of TB compared to individuals without diabetes. The finding is consistent with Boadu et al. (2024) and Buasroung et al. (2022) that individuals with diabetes have a higher risk of TB infection.
4 Conclusions and Recommendations
4.1 Conclusions
The study was designed to model the time until onset of TB in the Bolgatanga Municipality of the Upper East Region of Ghana and identify possible disease associations of some risk factors. To this end, skew normal, lognormal, shifted lognormal, exponential, Weibull and Fréchet models were fitted to the TB data using the Bayesian procedure. The Weibull model was established as the best performing model in comparison with the other models. Based on the posterior estimation results of the Weibull model, sex, religion, educational level and diabetes status were established as observed characteristics that significantly influence the time frame for the onset of TB in the Bolgatanga Municipality. Specifically, it was established that males have a shorter time frame for the onset of TB compared to females. It was also established that Traditionalists have a longer time frame for the onset of TB compared to Christians. Between Christians and Muslims, no significant difference was however detected in the time frame for the onset of TB in the Bolgatanga Municipality. Across different educational levels, it was established that individuals with higher educational levels have a longer time frame for the onset of TB compared to individuals with no education. Again, it was established that individuals with diabetes have a shorter time frame for the onset of TB compared to individuals without diabetes.
4.2 Recommendations
Based on the findings of this study, it is recommended for the Ghana Health Service and other healthcare agencies within the Muncipality to institute advocacy programmes on; the need for lifestyle modifications, raising awareness about TB infections and the need for early screening and treatment. This will get the public well informed and help in the prevention of TB infections. Education on the need for lifestyle modifications can help prevent conditions such as diabetes and contribute in reducing the risk of TB infection in the Municipality. As a high risk group, it is also recommended for males to consider frequent screening for early detection and treatment of TB in the Bolgatanga Municipality.
4.3 Study Limitations
The use of secondary data limited the choice of variables in the study. Consequently, important variables such as HIV, hypertension and alcohol usage which could influence TB infection could not be captured in the current study. Nonetheless, the findings of this study are useful and have policy implications in the Bolgatanga Municipality.
Parameter estimates of Bayesian skew normal regression on the tuberculosis data.
| Parameter | Estimates | Standard error | 95 % Credible interval | Rhat | Bulk_ESS | Tail_ESS | |
|---|---|---|---|---|---|---|---|
| Intercept | 48.26 | 3.18 | (41.82, 54.36) | 1.00 | 5,926 | 4,413 | |
| Sex | Male | −4.86 | 2.08 | (−9.20, −1.10) | 1.00 | 5,104 | 4,127 |
| Female (Ref) | |||||||
| Marital status | Married | −3.18 | 2.95 | (−8.86, 2.76) | 1.00 | 4,583 | 4,431 |
| Single | −9.24 | 23.11 | (−15.17, −3.03) | 1.00 | 4,775 | 4,254 | |
| Divorced (Ref) | |||||||
| Employment status | Unemployed | −1.97 | 1.51 | (−4.92, 1.06) | 1.00 | 8,459 | 3,633 |
| Employed (Ref) | |||||||
| Religion | Muslim | 0.91 | 2.31 | (−3.73, 5.50) | 1.00 | 7,303 | 4,457 |
| Traditional | 5.21 | 1.48 | (2.31, 8.13) | 1.00 | 7,299 | 4,561 | |
| Christian (Ref) | |||||||
| Educational level | Primary | 8.00 | 1.98 | (4.09, 11.86) | 1.00 | 7,062 | 5,058 |
| Secondary | 6.57 | 1.64 | (3.46, 9.87) | 1.00 | 5,717 | 5,034 | |
| Tertiary | 11.29 | 2.53 | (6.35, 16.22) | 1.00 | 6,601 | 4,805 | |
| None (Ref) | |||||||
| Diabetes status | Yes | −5.76 | 1.54 | (−8.87, −2.78) | 1.00 | 8,111 | 4,629 |
| No (Ref) | |||||||
Parameter estimates of Bayesian lognormal regression on the tuberculosis data.
| Parameter | Estimates | Standard error | 95 % Credible interval | Rhat | Bulk_ESS | Tail_ESS | |
|---|---|---|---|---|---|---|---|
| Intercept | 3.84 | 0.08 | (3.69, 4.00) | 1.00 | 5,883 | 4,308 | |
| Sex | Male | −0.16 | 0.04 | (−0.23, −0.09) | 1.00 | 6,930 | 4,579 |
| Female (Ref) | |||||||
| Marital status | Married | −0.05 | 0.07 | (−0.19, 0.09) | 1.00 | 5,292 | 4,698 |
| Single | −0.21 | 0.07 | (−0.36, −0.07) | 1.00 | 5,170 | 4,516 | |
| Divorced (Ref) | |||||||
| Employment status | Unemployed | −0.06 | 0.04 | (−0.13, 0.01) | 1.00 | 7,516 | 4,548 |
| Employed (Ref) | |||||||
| Religion | Muslim | 0.03 | 0.05 | (−0.08, 0.13) | 1.00 | 9,238 | 4,763 |
| Traditional | 0.11 | 0.03 | (0.04, 0.18) | 1.00 | 7,812 | 4,288 | |
| Christian (Ref) | |||||||
| Educational level | Primary | 0.20 | 0.04 | (0.12, 0.29) | 1.00 | 7,861 | 5,012 |
| Secondary | 0.18 | 0.04 | (0.10, 0.25) | 1.00 | 7,332 | 4,405 | |
| Tertiary | 0.26 | 0.06 | (0.14, 0.28) | 1.00 | 7,766 | 4,266 | |
| None (Ref) | |||||||
| Diabetes status | Yes | −0.15 | 0.04 | (−0.22, −0.07) | 1.00 | 7,914 | 3,966 |
| No (Ref) | |||||||
Parameter estimates of Bayesian shifted-lognormal regression on the tuberculosis data.
| Parameter | Estimates | Standard Error | 95 % Credible Interval | Rhat | Bulk_ESS | Tail_ESS | |
|---|---|---|---|---|---|---|---|
| Intercept | 3.80 | 0.09 | (3.62, 3.97) | 1.00 | 2,832 | 2,517 | |
| Sex | Male | 0.17 | 0.04 | (−0.25, −0.09) | 1.00 | 4,457 | 3,423 |
| Female (Ref) | |||||||
| Marital status | Married | −0.05 | 0.07 | (−0.20, 0.09) | 1.00 | 3,314 | 3,185 |
| Single | −0.22 | 0.08 | (−0.38, −0.07) | 1.00 | 3,235 | 3,191 | |
| Divorced (Ref) | |||||||
| Employment status | Unemployed | −0.07 | 0.04 | (−0.15, 0.00) | 1.00 | 4,303 | 3,780 |
| Employed (Ref) | |||||||
| Religion | Muslim | 0.03 | 0.06 | (−0.09, 0.14) | 1.00 | 5,434 | 3,524 |
| Traditional | 0.12 | 0.04 | (0.05, 0.19) | 1.00 | 4,423 | 3,822 | |
| Christian (Ref) | |||||||
| Educational level | Primary | 0.21 | 0.05 | (0.12, 0.31) | 1.00 | 3,577 | 3,488 |
| Secondary | 0.18 | 0.04 | (0.11, 0.26) | 1.00 | 4,159 | 4,039 | |
| Tertiary | 0.27 | 0.06 | (0.14, 0.39) | 1.00 | 4,359 | 3,051 | |
| None (Ref) | |||||||
| Diabetes status | Yes | −0.15 | 0.04 | (−0.23, −0.08) | 1.00 | 4,166 | 3,820 |
| No (Ref) | |||||||
Parameter estimates of Bayesian exponential regression on the tuberculosis data.
| Parameter | Estimates | Standard error | 95 % Credible interval | Rhat | Bulk_ESS | Tail_ESS | |
|---|---|---|---|---|---|---|---|
| Intercept | 3.92 | 0.28 | (3.39, 4.48) | 1.00 | 5,451 | 4,711 | |
| Sex | Male | −0.20 | 0.14 | (−0.47, 0.07) | 1.00 | 7,490 | 4,901 |
| Female (Ref) | |||||||
| Marital status | Married | −0.05 | 0.25 | (−0.57, 0.43) | 1.00 | 4,842 | 4,504 |
| Single | −0.20 | 0.27 | (−0.74, 0.31) | 1.00 | 4,788 | 4,323 | |
| Divorced (Ref) | |||||||
| Employment status | Unemployed | −0.06 | 0.13 | (−0.30, 0.19) | 1.00 | 6,833 | 4,775 |
| Employed (Ref) | |||||||
| Religion | Muslim | 0.06 | 0.20 | (−0.32, 0.47) | 1.00 | 7,489 | 4,084 |
| Traditional | 0.10 | 0.12 | (−0.14, 0.33) | 1.00 | 7,684 | 4,736 | |
| Christian (Ref) | |||||||
| Educational level | Primary | 0.21 | 0.16 | (−0.10, 0.52) | 1.00 | 6,639 | 3,989 |
| Secondary | 0.19 | 0.13 | (−0.07, 0.45) | 1.00 | 7,253 | 4,681 | |
| Tertiary | 0.27 | 0.21 | (−0.13, 0.69) | 1.00 | 7,585 | 4,936 | |
| None (Ref) | |||||||
| Diabetes status | Yes | −0.15 | 0.13 | (−0.39, 0.11) | 1.00 | 7,835 | 4,484 |
| No (Ref) | |||||||
Parameter estimates of Bayesian Fréchet regression on the tuberculosis data.
| Parameter | Estimates | Standard error | 95 % Credible interval | Rhat | Bulk_ESS | Tail_ESS | |
|---|---|---|---|---|---|---|---|
| Intercept | 3.90 | 0.08 | (3.74, 4.06) | 1.00 | 5,663 | 4,698 | |
| Sex | Male | −0.02 | 0.04 | (−0.09, 0.05) | 1.00 | 7,263 | 4,795 |
| Female (Ref) | |||||||
| Marital status | Married | −0.09 | 0.07 | (−0.23, 0.06) | 1.00 | 4,887 | 4,239 |
| Single | −0.29 | 0.08 | (−0.43, −0.13) | 1.00 | 5,006 | 4,626 | |
| Divorced (Ref) | |||||||
| Employment status | Unemployed | −0.11 | 0.04 | (−0.19, −0.04) | 1.00 | 7,734 | 4,437 |
| Employed (Ref) | |||||||
| Religion | Muslim | −0.03 | 0.06 | (−0.15, 0.08) | 1.00 | 7,707 | 4,204 |
| Traditional | 0.15 | 0.04 | (0.08, 0.23) | 1.00 | 6,925 | 4,831 | |
| Christian (Ref) | |||||||
| Educational level | Primary | 0.23 | 0.05 | (0.13, 0.32) | 1.00 | 6,868 | 4,636 |
| Secondary | 0.12 | 0.04 | (0.05, 0.20) | 1.00 | 6,933 | 4,606 | |
| Tertiary | 0.29 | 0.06 | (0.16, 0.41) | 1.00 | 6,654 | 5,012 | |
| None (Ref) | |||||||
| Diabetes status | Yes | −0.11 | 0.04 | (−0.19, −0.04) | 1.00 | 7,041 | 4,219 |
| No (Ref) | |||||||
References
Aitchison, J., and J. A. C. Brown. 1969. The Lognormal Distribution. With Special Reference to Its Uses in Economics. Cambridge: Cambridge University Press.Search in Google Scholar
Azzalini, A. 1985. “A Class of Distributions Which Includes the Normal Ones.” Scandinavian Journal of Statistics 12: 171–8.Search in Google Scholar
Berida, T., and C. W. Lindsley. 2024. “Move over COVID, Tuberculosis Is Once Again the Leading Cause of Death from a Single Infectious Disease.” Journal of Medicinal Chemistry 67 (24): 21633–40. https://doi.org/10.1021/acs.jmedchem.4c02876.Search in Google Scholar
Blangiardo, M., and M. Cameletti. 2015. Spatial and Spatio-temporal Bayesian Models with R-INLA. New York: John Wiley & Sons Inc.10.1002/9781118950203Search in Google Scholar
Boadu, A. A., M. Yeboah-Manu, S. Osei-Wusu, and D. Yeboah-Manu. 2024. “Tuberculosis and Diabetes Mellitus: The Complexity of the Comorbid Interactions.” International Journal of Infectious Diseases 146: 1–8, https://doi.org/10.1016/j.ijid.2024.107140.Search in Google Scholar
Buasroung, P., T. Petnak, P. Liwtanakitpipat, and S. Kiertiburanakul. 2022. “Prevalence of Diabetes Mellitus in Patients with Tuberculosis: A Prospective Cohort Study.” International Journal of Infectious Diseases 116: 374–9, https://doi.org/10.1016/j.ijid.2022.01.047.Search in Google Scholar
Dabet, A., H. Homma, H. Homma, and F. E. Gunawan. 2018. “Effectiveness of Pre-screening Test for Safe Design of Components Fabricated with Abaca Natural Fiber.” International Journal of Mechanical Engineering and Technology 9 (13): 1207–15.Search in Google Scholar
Deku, J. G., E. Aninagyei, I. Bedzina, G. Nudo, E. Ativi, and P. Mensah, et al.. 2024. “Trends of Mycobacterium tuberculosis and Rifampicin Resistance at the Ho Teaching Hospital in Ghana.” PLoS One 19 (6): 1–13, https://doi.org/10.1371/journal.pone.0305161.Search in Google Scholar
Farhin, S., and A. A. Khan. 2022. “Bayesian Survival Analysis of Acute Encephalitis Syndrome with Censoring Mechanism Using Brms Package.” Journal of Statistics Applications & Probability 11 (3): 963–80. https://doi.org/10.18576/jsap/110319.Search in Google Scholar
Fréchet, M. 1927. “Sur la loi de Probabilité de l’écart Maximum.” Annales de la Société Polonaise de Mathematique 6: 93–116.Search in Google Scholar
Hahn, U. 2014. “The Bayesian Boom: Good Thing or Bad?” Frontiers in Psychology 5 (765): 1–12, https://doi.org/10.3389/fpsyg.2014.00765.Search in Google Scholar
Hoang, V. T., and P. Gautret. 2018. “Infectious Diseases and Mass Gatherings.” Current Infectious Disease Reports 20 (11): 1–12, https://doi.org/10.1007/s11908-018-0650-9.Search in Google Scholar
Humayun, M., J. Chirenda, W. Ye, I. Mukeredzi, H. A. Mujuru, and Z. Yang. 2022. “Effect of Gender on Clinical Presentation of Tuberculosis (TB) and Age-specific Risk of TB, and TB-Human Immunodeficiency Virus Coinfection.” Open Forum Infectious Diseases 9 (10): 1–9, https://doi.org/10.1093/ofid/ofac512.Search in Google Scholar
Iddrisu, A. K., E. Amikiya, and F. K. Bukari. 2024. “Spatio-Temporal Characteristics of Tuberculosis in Ghana.” F1000Research 11 (20): 1–30, https://doi.org/10.12688/f1000research.109053.2.Search in Google Scholar
Kiani, B., A. R. Rahmati, R. Bergquist, S. Hashtarkhani, N. Firouraghi, and N. Bagheri, et al.. 2021. “Spatio-Temporal Epidemiology of the Tuberculosis Incidence Rate in Iran 2008 to 2018.” BMC Public Health 21 (1093): 1–20, https://doi.org/10.1186/s12889-021-11157-1.Search in Google Scholar
Medhi, G. K., and J. Mahanta. 2008. “Impact of Education and Income on Pulmonary Tuberculosis (PTB) Among Adult Tea Garden Workers of Assam.” International of Infectious Diseases 12: e343, https://doi.org/10.1016/j.ijid.2008.05.914.Search in Google Scholar
Rastegar, M., E. Nazar, M. Nasehi, S. Sharafi, V. Fakoor, and M. T. Shakeri. 2024. “Bayesian Estimation of the time-varying Reproduction Number for Pulmonary Tuberculosis in Iran: A Registry-based Study from 2018 to 2022 Using New Smear-positive Cases.” Infectious Disease Modelling 9 (3): 963–74. https://doi.org/10.1016/j.idm.2024.05.003.Search in Google Scholar
Rather, N. A., and T. A. Rather. 2017. “New Generalizations of Exponential Distribution with Applications.” Journal of Probability and Statistics 2017: 1–9, https://doi.org/10.1155/2017/2106748.Search in Google Scholar
Robert, C. P., and J. M. Rousseau. 2023. “A Special Issue on Bayesian Inference: Challenges, Perspectives and Prospects.” Philosophical Transactions of the Royal Society A 381 (20220155): 1–4, https://doi.org/10.1098/rsta.2022.0155.Search in Google Scholar
Umeta, A. K., S. F. Yermosa, and A. G. Dufera. 2022. “Bayesian Parametric Modeling of Time to Tuberculosis Co-infection of HIV/AIDS Patients at Jimma Medical Center, Ethiopia.” Scientific Reports 12 (16475): 1–18, https://doi.org/10.1038/s41598-022-20872-7.Search in Google Scholar
Vehtari, A., A. Gelman, and J. Gabry. 2017. “Practical Bayesian Model Evaluation Using Leave-one-out Cross-validation and WAIC.” Statistics and Computing 27: 1413–32. https://doi.org/10.1007/s11222-016-9696-4.Search in Google Scholar
Wei, Z., S. T. B. Choy, T. Wang, and X. Zhu. 2025. “Bayesian Stochastic Frontier Models Under the Skew-normal Half-normal Settings.” Journal of Productivity Analysis 64: 81–91, https://doi.org/10.1007/s11123-025-00757-3.Search in Google Scholar
Weibull, W. 1951. “A Statistical Distribution Function of Wide Applicability.” Journal of Applied Mechanics 18: 293–7. https://doi.org/10.1115/1.4010337.Search in Google Scholar
World Health Organization. 2020. Global Tuberculosis Report 2020. Geneva: World Health Organization.Search in Google Scholar
World Health Organization. 2023. Global Tuberculosis Report 2023. Geneva: World Health Organization.Search in Google Scholar
World Health Organization. 2024. Global Tuberculosis Report 2024. Geneva: World Health Organization.Search in Google Scholar
Yezli, S., Y. Yassin, A. Mushi, F. Maashi, N. M. Abdelmalek, A. H. Awam, et al.. 2023. “Undiagnosed and Missed Active Pulmonary Tuberculosis During Mass Gatherings: A Prospective cross-sectional Study from the Hajj Pilgrimage.” European Journal of Clinical Microbiology & Infectious Diseases: Official Publication of the European Society of Clinical Microbiology 42 (6): 727–40. https://doi.org/10.1007/s10096-023-04596-8.Search in Google Scholar
Zamanah, E., S. Nasiru, and A. Luguterah. 2022. “Harmonic Mixture Weibull-G Family of Distributions: Properties, Regression and Applications to Medical Data.” Computational and Mathematical Methods. https://doi.org/10.1155/2022/2836545.Search in Google Scholar
© 2025 the author(s), published by De Gruyter, Berlin/Boston
This work is licensed under the Creative Commons Attribution 4.0 International License.
Articles in the same Issue
- Frontmatter
- Editors Note
- Editors’ Note
- Special Issue: Emotional Dynamics of Politics and Policymaking; Guest Editors: Georg Wenzelburger and Beatriz Carbone
- Bringing Emotions into the Study of Responsiveness: The Case of Protective Policies
- Emotional Reactions to Protective Policies on the Political Spectrum
- Regular Articles
- Determinants of Political Instability in ECOWAS (1991–2022)
- The Impact of International Remittances on Public Debt Sustainability in Kerala: Evidence from the FMOLS Approach
- Bayesian Analysis of Tuberculosis Cases in Bolgatanga Municipality, Ghana–West Africa