Visualizing and quantifying spatial and qualitative pain sensations
-
Shellie Ann Boudreau


Abstract
Similar to the purpose of an infographic, visualizing spatial and qualitative sensations on a body chart is a fast and digestible method for communicating complex information and experiences. Further, digitizing these body charts into an interactive medium creates unprecedented opportunities for collecting extensive data. Moreover, applying simple rule-based algorithms or more advanced machine learning approaches to these charts catapults the quantification and spatiotemporal relations of pain and qualitative pain sensations into a new field ripe for pioneering discoveries.
Introduction
For the sake of brevity, pain intensity, as an analogue, numerical or Likert score, is a noisy measure inherently influenced by personality traits, context, prior experiences, education, sex and more. However, the absence of such a score in research findings can be grounds for peer rejection or deemed unrelatable. Arguably, when someone says they are in pain, one naturally asks ‘Where?’ before asking ‘How much?’ Subsequently, if someone expresses that their pain is worsening, one naturally asks for a more detailed explanation. Thus, a change in how to measure and communicate pain has been a long time coming.
Digital body mapping
Introducing a pain drawing to map the spatial distribution of pain is not remarkably new and shares a historical timeline with the pain intensity score [1], yet the utilization of the drawing is substantially less. Perhaps this may be due to the display size on most paper-based questionnaires, the accompanying instructions, or the inability to quantify the drawings quickly and accurately. Digitization of the pain drawing at the pixel level circumvents these barriers [2], especially when combined with easy drawing tools, adequate drawing space, choice of qualitative descriptors, and anatomically enriched body charts (avatars) [3, 4], as shown in Figure 1. These methodological advances create new possibilities to fully explore the potential of mapping the spatial distribution of pain and qualitative pain sensations in experimental and clinical settings.
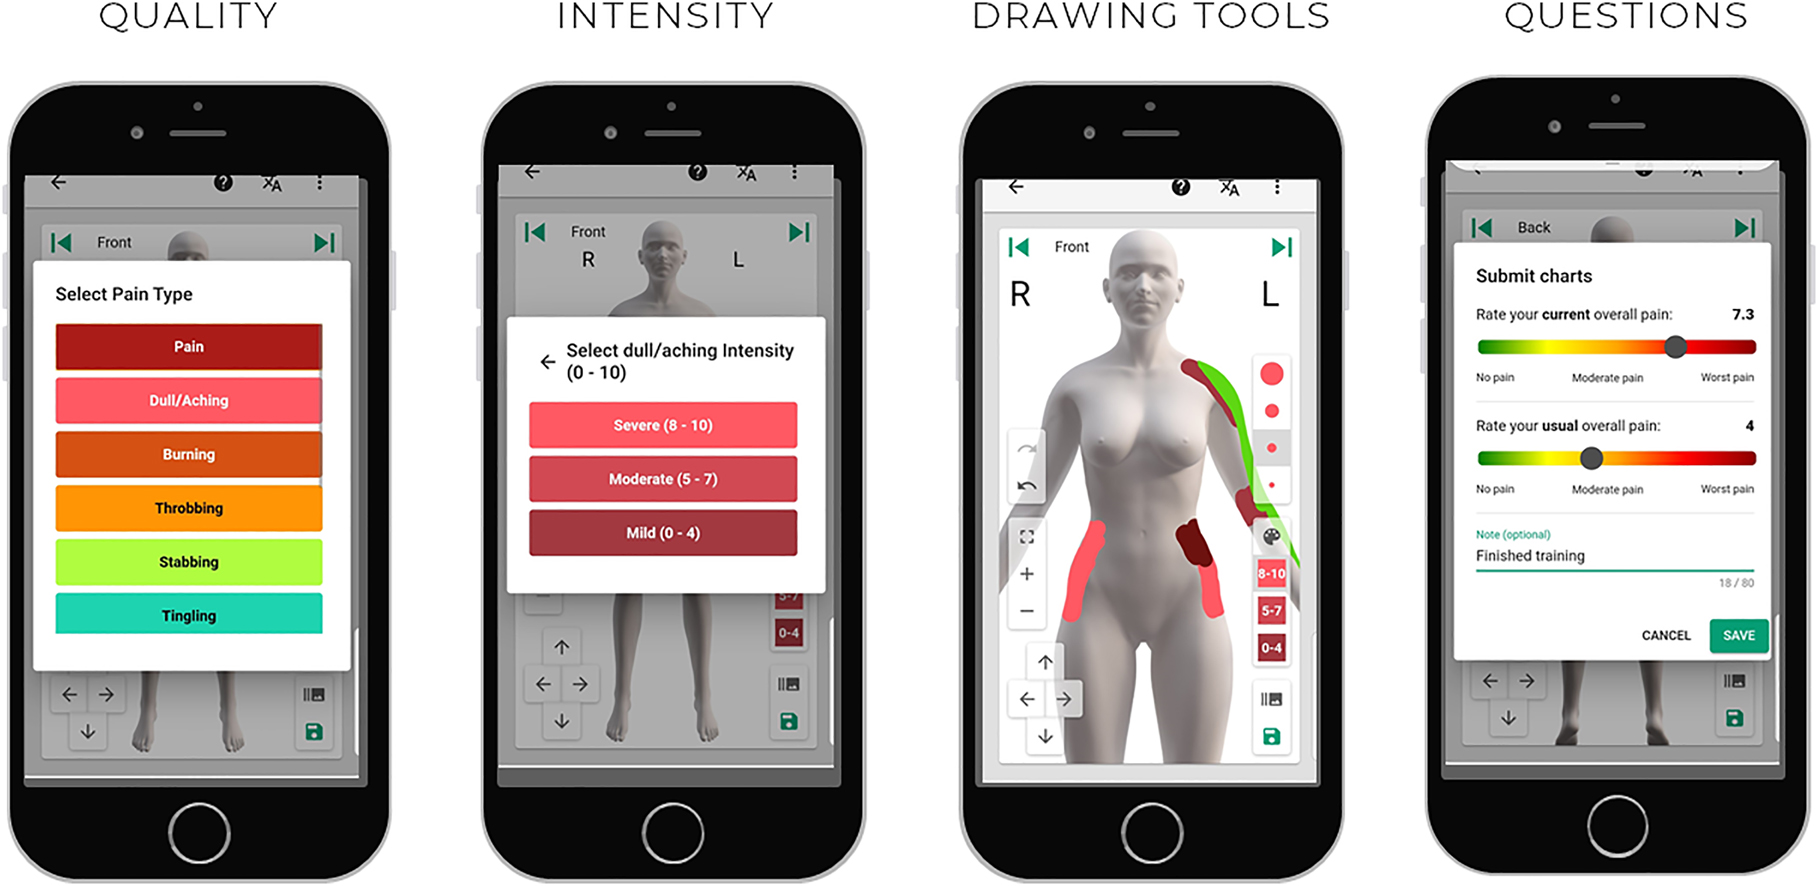
Screenshots from the Navigate Pain software (Aglance Solutions, ApS), as displayed on a mobile device, showing the option to select pain and multiple pain qualities, the intensity of each quality, drawing tools for maneuvering, zooming, and pen size. Before saving, there is an option to record additional questions, such as current and usual pain intensity on a visual analogue scale—screenshots used with permission.
One potential advantage is that the presence of pain, or any discomforting qualitative sensation, mapped on the body may be more straightforward to interpret than a change in the pain intensity. The absence of pain in a previously painful area is arguably a robust indicator of recovery. For example, patients experiencing chronic daily headaches that mapped pain in the innervation territory of the greater occipital nerve (GON) appear to benefit from a GON block when contrasted to those with pain in other (trigeminal) territories [5]. Conversely, the appearance of an additional pain site on the contralateral knee in an osteoarthritus patient or the hip in a patient with a frozen shoulder would also be of clinical relevance, regardless of the current pain intensity score.
Automatically discerning new or separate pain sites without bias are technically possible by creating simple rule-based algorithms in digital mapping solutions. However, a consensus on what constitutes a separate pain site is debatable. For example, undrawn neighbouring pixels may help to define the border of a pain site, but how many pixels would be sufficient for a clear separation and should the number be modified depending on smaller or larger body regions (knee vs. upper back)? Determining the number of pain sites can be accomplished in questionnaire-based approaches and does not necessitate sophisticated digital body mapping applications; however, the insight gained by digitizing the spatial distribution of pain is unparalleled when combined with advanced analytics [6, 7] and visualization approaches [6], [7], [8], [9].
The image stemming from digital body mapping is fitting for machine learning approaches and shows promise for revealing distinct spatial distributions of pain within patient populations when large data sets are available. Boudreau and colleagues [6], revealed three data-driven patterns of a common knee pain condition known as patellofemoral pain (PFP) by analyzing 299 digital pain drawings [6]. Although the findings may be considered pioneering, the real insight is that the approach to identifying these patterns is relatively straightforward.
Indeed, mapping the spatial distribution of pain can easily extend to qualitative pain sensations, such as burning, stabbing or numbness, as shown in patients with radiating neck and back pain [7] and athletes with longstanding groin pain [8]. The qualitative pain sensations did not differentiate between the clinical entities in these athletes, although the sample was relatively small and such studies are still in infancy. Interestingly, more than 50% of the athletes with longstanding groin pain choose qualitative descriptors when given the option rather than pain per se when creating their digital body map [8]. Including these options in future research may lead to additional benefits such as revealing the mechanisms driving the discomfort, clarifying the type of the injury (musculoskeletal vs. neuropathic), or identifying earlier warnings that may precede pain perception.
Future directions
Mapping the distribution of pain and pain qualities can improve communication between the patient and the clinician [9], especially if the patient creates the drawing [10]. Further, our earlier feasibility study demonstrated that patients quickly learn how to map their pain and pain qualities from home (without visiting the clinic) using the software application Navigate Pain (Aglance Solutions, Denmark, Figure 1) and continued to engage with the mapping tool for three months [7]. An analysis of the user behaviour and technology acceptance revealed that the distribution of pain and pain qualities frequently varied, did not always correspond with increasing or decreasing pain intensity and was viewed positively by patients as a communication tool [7]. Given that most people spend more time at work and home than in the clinic, digital body mapping creates an unprecedented opportunity to observe and collect time series data about the spatial distribution of pain from patients at their leisure while simultaneously providing a digestible method for communicating otherwise complex patient experiences.
Like paper-based equivalents, digital pain mapping demonstrates high reliability between successive drawings [4, 11, 12]; however, only a few longitudinal (digital) pain mapping studies exist [7, 13], [14], [15]. These longitudinal studies show more insight and clinical value when mapping the spatial distribution and qualitative changes within and between patient populations. With larger data sets, machine learning approaches will lend the needed muscle to identify spatiotemporal changes in distribution over time, but they will not be able to explain these changes. Thus there will be a need for metrics that reflect the spatial distribution, not only the area, and more research to discern the role of mapping qualitative pain sensations to achieve these goals.
Conclusions
Today, accelerating research within pain science as a field will heavily depend on our openness to adopt new approaches for collecting, analyzing, and visualizing more extensive data sets within populations where pain and discomfort are significant symptoms. Extraordinary progress and applications in machine learning, such as self-driving cars and facial recognition, which were once sci-fi stories in our lifetime, are emerging into reality. Thus, a repository of the spatial distribution of pain and qualitative pain sensations, collected by digital body mapping and analyzed using machine learning approaches, spanning multiple diseases and conditions is clearly within reach. What remains debatable is whether researchers within pain science will utilize the progress of other research fronts to overcome the longstanding battle of measuring pain in a manner that can lead to patient and socioeconomic benefits.
Acknowledgements
Aglance Solutions ApS (Denmark) is acknowledged for providing the screenshots and images utilized in Figure 1.
-
Research funding: SAB is part of the Center for Neuroplasticity and Pain, which is supported by the Danish National Research Foundation (DNRF121). These funding sources were not involved in the design or manuscript preparation, and no funding was received for this project.
-
Author contribution: SAB drafted and edited the manuscript.
-
Conflicts of interest: SAB is the co-developer of the software application Navigate Pain and has company holdings in Aglance Solutions ApS, which licenses a web application of Navigate Pain.
-
Ethical approval: It is not required or appropriate for the manuscript.
References
1. Shaballout, N, Neubert, T, Boudreau, S, Beissner, F. From paper to digital applications of the pain drawing: systematic review of methodological milestones. JMIR mHealth and uHealth 2019;7:e14569. https://doi.org/10.2196/14569.Search in Google Scholar PubMed PubMed Central
2. Boudreau, SA, Spence, R, Vasov, G, Egsgaard, LL. Feature Extraction APP for Pain Profiles. In: Jensen, W., Andersen, O., Akay, M., editors. Replace, Repair, Restore, Relieve – Bridging Clinical and Engineering Solutions in Neurorehabilitation. Biosystems and Biorobotics. Cham: Springer; 2014, vol 7. https://doi.org/10.1007/978-3-319-08072-7_116.Search in Google Scholar
3. Boudreau, SA, Badsberg, S, Christensen, SW, Egsgaard, LL. Digital pain drawings: assessing touch-screen technology and 3D body schemas. Clin J Pain 2016;32:139–45. https://doi.org/10.1097/ajp.0000000000000230.Search in Google Scholar PubMed
4. Egsgaard, LL, Christensen, TS, Petersen, IM, Bronnum, DS, Boudreau, SA. Do gender-specific and high-resolution three dimensional body charts facilitate the communication of pain for women? A quantitative and qualitative study. JMIR Hum Factors 2016;3:e19. https://doi.org/10.2196/humanfactors.5693.Search in Google Scholar PubMed PubMed Central
5. Baughman, D, Boudreau, SA, Powelson, EB, Ochoa, DM, Arendt-Nielsen, L, Curatolo, M. Modulation of pain areas by greater occipital nerve block in chronic daily headache. Eur J Anaesthesiol 2020;37:248–51. https://doi.org/10.1097/eja.0000000000001066.Search in Google Scholar
6. Boudreau, SA, Royo, AC, Matthews, M, Graven-Nielsen, T, Kamavuako, EN, Slabaugh, G, et al.. Distinct patterns of variation in the distribution of knee pain. Sci Rep 2018;8. https://doi.org/10.1038/s41598-018-34950-2.Search in Google Scholar PubMed PubMed Central
7. Serner, A, Reboul, G, Lichau, O, Weir, A, Heijboer, W, Vuckovic, Z, et al.. Digital body mapping of pain quality and distribution in athletes with longstanding groin pain. Sci Rep 2022;12:9789–1. https://doi.org/10.1038/s41598-022-13847-1.Search in Google Scholar PubMed PubMed Central
8. Villa, MG, Palsson, ST, Royo, AC, Bjarkam, CR, Boudreau, SA. Digital pain mapping and tracking in patients with chronic pain: longitudinal study. J Med Internet Res 2020;22:e21475. https://doi.org/10.2196/21475.Search in Google Scholar PubMed PubMed Central
9. Shaballout, N, Aloumar, A, Neubert, TA, Dusch, M, Beissner, F. Digital pain drawings can improve doctors’ understanding of acute pain patients: survey and pain drawing analysis. JMIR Mhealth Uhealth 2019;7:e11412. https://doi.org/10.2196/11412.Search in Google Scholar PubMed PubMed Central
10. Plinsinga, ML, Boudreau, SA, Coombes, BK, Mellor, R, Hayes, S, Vicenzino, B. Comparing what the clinician draws on a digital pain map to that of persons who have greater trochanteric pain syndrome. Scand J Pain 2022;22:506–14. https://doi.org/10.1515/sjpain-2021-0135.Search in Google Scholar PubMed
11. Matthews, M, Rathleff, MS, Vicenzino, B, Boudreau, SA. Capturing patient-reported area of knee pain: a concurrent validity study using digital technology in patients with patellofemoral pain. PeerJ 2018;6:e4406. https://doi.org/10.7717/peerj.4406.Search in Google Scholar PubMed PubMed Central
12. Neubert, TA, Dusch, M, Karst, M, Beissner, F. Designing a tablet-based software app for mapping bodily symptoms: usability evaluation and reproducibility analysis. JMIR Mhealth Uhealth 2018;6:e127. https://doi.org/10.2196/mhealth.8409.Search in Google Scholar PubMed PubMed Central
13. Grunnesjö, M, Bogefeldt, J, Blomberg, S, Delaney, H, Svärdsudd, K. The course of pain drawings during a 10 week treatment period in patients with acute and sub-acute low back pain. BMC Musculoskelet Disord 2006;7:65. https://doi.org/10.1186/1471-2474-7-65.Search in Google Scholar PubMed PubMed Central
14. Huang, P, Sengupta, DK. How fast pain, numbness, and paresthesia resolves after lumbar nerve root decompression: a retrospective study of patient’s self-reported computerized pain drawing. Spine 2014;39:529. https://doi.org/10.1097/BRS.0000000000000240.Search in Google Scholar PubMed
15. Ortego, G, Lluch, E, Herrero, P, Boudreau, SA, Domenech-Garcia, V. Profiling and association over time between disability and pain features in patients with chronic nonspecific neck pain: a longitudinal study. J Clin Med 2022;11. https://doi.org/10.3390/jcm11051346.Search in Google Scholar PubMed PubMed Central
© 2022 Walter de Gruyter GmbH, Berlin/Boston
Articles in the same Issue
- Frontmatter
- Articles
- Abstract for the special issue
- Short Communications
- The link between epigenetics, pain sensitivity and chronic pain
- Mapping emotions on the body
- Lessons learned – Moving on from QST sensory profiles
- Sensory testing might not be perfect – but it is the best biomarker for pain phenotypes we have right now
- Assessing pain after cancer treatment
- The distributed nociceptive system: a novel framework for understanding pain
- Visualizing and quantifying spatial and qualitative pain sensations
- Assessing the societal cost of chronic pain
- The Harald Breivik lecture 2022. Pathophysiology in persistent severe pain after groin hernia repair