Effect of autoclave process on the quality of thermoplastic composite truncated cones manufactured using automated fiber placement technique
-
Farjad Shadmehri
 ,
Xiao Cai
,
Xiao Cai

Abstract
In order to investigate the effect of autoclave process on the stiffness properties of thermoplastic composite truncated cones made by automated fiber placement technique (AFP), two short truncated cones were made out of advanced thermoplastic composite material (carbon fiber/PEEK). Then, the truncated cones were tested by impulse excitation of vibration to get experimental natural frequencies. Tensile and compression test coupons were made out of the same material using hand layup and autoclave process, and stiffness properties were characterized experimentally. Furthermore, finite element analysis was performed to extract theoretical natural frequencies using material properties obtained from coupon testing. Comparison between the natural frequencies obtained using the finite element method and experimental modal analysis was conducted. Furthermore, the two truncated cones were treated inside the autoclave, and changes in the thickness and density were measured. After autoclave treatment, experimental modal analysis was repeated to investigate the possible changes in natural frequencies. The finite element model was also updated upon the changes in thickness and density of the truncated cones, and consequently, comparison between the theoretical and experimental natural frequencies was carried out again. Also, micrographs of two truncated cones were taken before and after autoclave treatment to examine the autoclave effect on the quality of the samples.
1 Introduction
Laminated conical shells have widespread applications in general and especially in aerospace industries (e.g., helicopter tail boom, airplane fuselage and nose cone, etc.). Automated fiber placement technology (AFP) is a technique that can be used in the manufacturing of both thermoset and thermoplastic composites in which the fibers are laid on a tool surface one or multiple tows at a time. While the head of the fiber placement machine is laying the fiber tapes, heat and pressure are applied simultaneously. Heat makes the resin flow between the fibers, and pressure consolidates the materials as they are placed onto the surface of the tool. The combination of heat and pressure causes flow and consolidation [1] (Figure 1).

Automated fiber placement head (courtesy of National Research Council Canada).
In the manufacturing of the thermoplastic composite part, it is highly desirable to reach good consolidation by using fiber placement process alone and to avoid additional autoclave process to reduce the manufacturing cost. However, due to various parameters involved in the AFP process, such as torch temperature, compaction force, lay-down speed, etc., the quality of the fiber-placed part, from stiffness and/or strength point of view, may not always be as good as desired, and in this case, the part has to undergo a secondary autoclave process. Earlier studies show that the resulting laminate quality of in situ thermoplastic composites strongly depends on heat flux, lay-down speed, and consolidation pressure [2–9].
One of the reliable tools to indicate the quality of the part from the stiffness point of view is experimental modal analysis in which one can find natural frequencies and compare them with the expected ones obtained from theory.
In this study, the quality of two thermoplastic composite truncated cones (carbon fiber/PEEK) made by AFP was investigated from the stiffness point of view. Also, the effect of the autoclave postconsolidation process on the thickness, density, and natural frequencies of the truncated cones was studied. The modal analysis was done on the two truncated cones in order to find the experimental natural frequencies. Moreover, test coupons were made using hand layup and autoclave process. Material stiffness properties of these test coupons were obtained from the experiment and were used for finite element analysis. It was assumed that coupons that have undergone the autoclave process were fully consolidated. Theoretical natural frequencies obtained by finite element analysis were then compared with those obtained experimentally. Furthermore, the two truncated cones were sent to be autoclaved for postconsolidation treatment, and changes in the thickness, density, and natural frequencies were studied afterward. Updating the finite element model, based on the new thicknesses and densities for the two truncated cones, was performed, and comparison between the theoretical and the experimental natural frequencies was made again.
2 Material properties
The material used in this study was APC-2/AS4 (12K unsized fiber) unidirectional tape supplied by Cytec Engineered Materials (CEM, USA). The test matrix used to determine the basic mechanical properties of individual APC-2/AS4 lamina is shown in Table 1. These tests were selected to examine the tensile, compression, and shear stiffness properties at room temperature and ambient humidity. The unidirectional tape consisted of a 68:32-wt% mixture of carbon fiber (AS4) and polyetheretherketone (PEEK) matrix (APC-2) [10]. The typical value of the volume fraction of the fibers is 61% [10]. The melting temperature (Tm) determined by DSC analysis was at 346.1°C.
Test matrix.
| ASTM test method | Measured property | Panel ID | Number of coupons | Dimension of coupons (length/width) (mm) | Stacking sequence |
|---|---|---|---|---|---|
| D 3039-07 | Tensile modulus | PN-1 | 5 | 254/12.7 | [0]8 |
| D 3410-03 | Compressive modulus | PN-2 | 5 | 139.7/12.7 | [0]24 |
| D 5379-05 | Shear modulus | PN-3 | 5 | 76.2/19.05 | [0/90]6S |
Three test panels were fabricated individually in a laboratory-size autoclave by following the processing cycle shown in Figure 2. A cross section of the vacuum bag assembly and its use is shown schematically in Figure 3. Plies were carefully aligned to within 0.5° and tack welded in the trim area by a temperature-controlled welding station to prevent movement during assembly. In addition, a thermocouple was placed in the middle plane of the laminates to read the temperature of the part. Stacking sequences and dimensions of the panels are shown in Table 2.
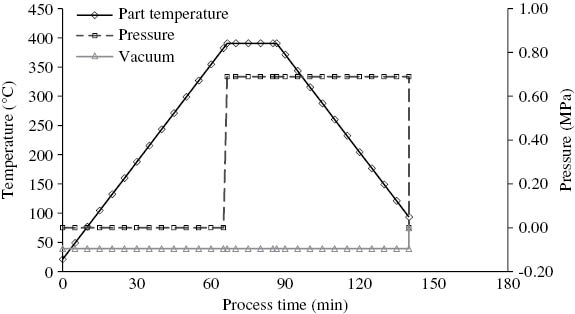
Processing cycle of APC-2/AS4.

Cross section of vacuum-bagged laminate: 1. Steel tool plate (12.7 mm). 2. Stainless steel plate (0.744 mm). 3. Bagging film (Thermalimide, Airtech) coated with release agent (Frekote® 44-NC™, Henkel). 4. Tack-welded laminate. 5. High-temperature sealant tape (SM-5160 TACKY-TAPE®, Schnee-Morehead) 6. 6 oz. plain woven fiberglass cloth. 7. Breather (Airweave®UHT 800, Airtech). 8. Vacuum valve (VAC VALVE SSHTR and AHTC 1000 QTD, Airtech).
Test panel configurations.
| Panel ID | Number of panels | Dimension of panels (length/width) (mm) | Stacking sequence |
|---|---|---|---|
| PN-1 | 1 | 304.8/152.4 | [0]8 |
| PN-2 | 1 | 190.5/152.4 | [0]24 |
| PN-3 | 1 | 127/177.8 | [0/90]6S |
In order to meet the dimensional requirements specified in the ASTM standards, test coupons, listed in Table 1, were cut from the panels using a 1/8 4FL REG EXCOARB®-diamond end mill on a numerically controlled vertical milling machine equipped with a dust collection system. The spindle speed and feed rate were set to 3056RPM and 310 mm/min, respectively.
All tests were conducted on a calibrated MTS servo-hydraulic universal testing system. When determining tensile modulus, specimens were instrumented with strain-indication transducers, which are centered about the loading axis in the gage section and mounted at 0° to the loading axis [11].
When determining the compressive modulus, specimens were instrumented with back-to-back strain indication transducers, which were centered about the loading axis in the gage section and mounted at 0° to the loading axis. An Illinois Institute of Technology Research Institute (IITRI) compression test fixture in accordance with the ASTM standard D 3410-03 [12] was used to provide stability in unnotched compression testing.
When determining shear modulus, specimens were instrumented with strain-indication transducers, which were centered about the loading axis in the gage section and mounted at +45° and -45° to the loading axis. A V-notched beam test fixture in accordance with ASTM standard D 5379M-05 was used to provide asymmetric flexure [13]. A summary of stiffness properties of APC-2/AS4 are presented in Table 3.
Stiffness properties of APC-2/AS4.
| Material type | APC-2/AS4 |
|---|---|
| Tensile modulus (Gpa) | 135.73 |
| Compressive modulus (Gpa) | 124.10 |
| Shear modulus (Gpa) | 4.70 |
3 Finite element method
In order to see the effect of material properties obtained from the autoclave process on the natural frequencies, the truncated cones were modeled using the finite element technique. Nastran/Patran, a commercial finite element software from the MSC Corporation, was employed, and “normal mode” analysis was performed to get natural frequencies and mode shapes. The truncated cones were modeled with quadrilateral element topology containing four nodes, one at each corner. Material properties were obtained from test coupons made by the autoclave process to be used in finite element analysis and are listed in Table 4. The first truncated cone having an eight-layer symmetric lamination (see Table 5) was modeled with 3240 elements, and the second one, having a 13-layer lamination, was modeled with 2916 elements.
Material properties for AS4/PEEK used in finite element analysis [10].
| E11 (GPa) | 129.9a |
| E22 (GPa) | 10.2 |
| G12=G13 (Gpa) | 4.7b |
| G23 (Gpa) | 3.3 |
| ρ (kg/m3) | See Table 6 |
| ν12 | 0.3 |
Truncated cones geometric and lay-up specifications.
| Lay-up | Truncated cone # 1 | Truncated cone # 2 |
|---|---|---|
| [90/45/0/-45]S | [90/0/45/-45/0/ 45/0/-45/0/-45/ 45/0/90] | |
| Small diameter (cm) | 33.5 | 33.7 |
| Large diameter (cm) | 35.0 | 35.1 |
| Length (cm) | 31.9 | 27.1 |
| Average thickness (mm) | 0.852 | 1.510 |
4 Experimental modal analysis
4.1 Theory
One of the most useful techniques (and probably the simplest and fastest one) to obtain the dynamic properties of the structure is based on the excitation of the structure using an impact hammer. The natural frequencies can be extracted directly from the peaks of the frequency response function (FRF) obtained by the impulse technique. The frequency response function [H(f)] is the ratio of the Fourier transforms of the system output to the system input
where V(f) and U(f) are Fourier transforms of the system output and input, respectively. However, in practice and in order to minimize the effect of noise at the output signal, the frequency response function is calculated as the ratio of the cross-spectrum between the input and output to the auto-spectrum of the input and usually indentified as H1(f)
where Guv(f)=U*(f)V(f), Guu(f)=U*(f)U(f), and U*(f) are complex conjugates of U(f).
It is worth mentioning that in the calculation of cross-spectrum, there is an intrinsic error whose magnitude is inversely proportional to the number of averages used in computation. As such, the greater the number of averages (hammer hits per FRF), the less the bias error associated with cross-spectrum calculation would be [14–16].
4.2 Samples specification and set-up configuration
Two truncated cones with geometric specifications and lay-up sequences listed in Table 5 were fabricated by a six-axis gantry-type fiber placement system equipped with the thermoplastic fiber placing head and tested using the impact hammer technique. In order to get the natural frequencies under free-free boundary condition, the truncated cones were hung by a very flexible rubber band in a horizontal position (see Figure 4). As the rubber band has a very low spring constant (K), it was expected that it would not affect the natural frequencies of the truncated cones. The impact hammer with a plastic cap was used to excite the truncated cones and output signals were captured using two small accelerometers attached to the small end of the truncated cones at a 90° circumferential space (see Figure 4). A four-channel data acquisition Bruel & Kjaer system was used, and frequency response functions (FRFs) and natural frequencies were obtained using the PULSE 13 software provided by Bruel & Kjaer. The experimental setup is shown in Figure 4.

(A) experimental setup; (B) accelerometers positions.
5 Autoclave treatment of the truncated cones
In order to reach full consolidation and to release the residual stresses accumulated in the manufacturing process using AFP, the truncated cones were post-treated in the high-temperature autoclave. The autoclave process included the following steps:
Preparation of the tool surface (cleaning and applying sealant)
Appling a layer of high-temperature release film on the tool surface
Installing and fixing the sample on the tool surface
Installing the thermocouples
Appling a layer of high-temperature release film on the sample surface
Applying a layer of high-temperature breather
Making the vacuum bagging film around the assembly using a high-temperature sealant tape
Treating the truncated cones as per the processing cycle shown in Figure 2.
The vacuum bag assembly is shown in Figure 5. After autoclave treatment, it was observed that the surface finish of both thermoplastic composite truncated cones was smoother than before (Figure 6). Also measuring the thickness of the two specimens revealed that the thickness of the truncated cone number 1 was reduced by 5.4% (0.806 mm) and truncated cone number 2 by 6% (1.419 mm). Density measurement, which is needed for calculating theoretical natural frequencies, was performed before and after autoclave treatment, and the results are shown in Table 6. As can be expected, the density was increased after posttreating the thermoplastic composite truncated cones inside the autoclave. Experimental modal analysis was repeated on the autoclave-treated truncated cones again, and the finite element model was also updated to take into account the thickness reduction and the density increase.

Autoclave treatment of the thermoplastic truncated cone made by AFP.

Surface finish of the thermoplastic truncated cone before and after autoclave treatment.
Density measurement before and after autoclave treatment.
| Before autoclave (kg/m3) | After autoclave (kg/m3) | |
|---|---|---|
| Truncated cone # 1 | 1478 | 1584 |
| Truncated cone # 2 | 1439 | 1557 |
6 Results
6.1 Experimental and finite element modal analysis results before autoclave treatment
Natural frequencies and mode shapes of two truncated cones obtained using the finite element method (through normal mode analysis) are shown in Table 7. Because of the axisymmetric shape of the truncated cones, there are two mode shapes at each natural frequency which are the same in shape but shifted circumferentially.
Theoretical natural frequencies and mode shapes of two truncated cones (before autoclave).
| Mode no. | Truncated cone # 1 (Hz) | Truncated cone # 2 (Hz) | Mode shape | Mode No. | Truncated cone # 1 (Hz) | Truncated cone # 2 (Hz) | Mode shape |
|---|---|---|---|---|---|---|---|
| f1=f2 | 26.8 | 42.4 |  | f9=f10 | 146.6 | 229.5 |  |
| f3=f4 | 32.8 | 53.6 | 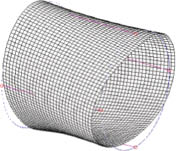 | f11=f12 | 164.1 | 256.4 |  |
| f5=f6 | 76.3 | 119.9 |  | f13=f14 | 237.3 | 370.3 |  |
| f7=f8 | 88.3 | 140.6 |  | f15=f16 | 260.7 | 402.7 |  |
In order to get the natural frequencies experimentally by using frequency response functions (FRFs), two sets of excitations were performed at the points where the accelerometers were attached to the truncated cones. First, the sample was hit at point 1 where accelerometer number 1 (see Figure 4) was attached (underneath the shell surface), and the responses were collected from two accelerometers (points 1 and 2). In the second set of excitation, the sample was hit at point 2 (the location of accelerometer number 2), and corresponding responses were captured by both accelerometers. As expected, and because of the linear behavior of the truncated cones, these two sets of excitation led to similar types of FRF graphs and, consequently, the same natural frequencies. Each set of excitation included 10 hits, and the corresponding FRFs were the average of these 10 hits to reduce the bias error associated with cross-spectrum calculation.
The magnitude of FRFs for truncated cone number 1 in which the excitation is performed at point 1 and the responses were collected from point 1 (H11) and point 2 (H21) are shown in Figures 7 and 8, respectively.

Magnitude of FRF corresponding to H11 for truncated cone # 1.

Magnitude of FRF corresponding to H21 for truncated cone # 1.
FRFs related to the modal test of the truncated cone number 2 are shown for H11 (excitation and response both at point 1) in Figure 9 and for H21 (excitation at point 1, response at point 2) in Figure 10.

Magnitude of FRF corresponding to H11 for truncated cone # 2.

Magnitude of FRF corresponding to H21 for truncated cone # 2.
Natural frequencies are the peaks of FRF graphs and are extracted from Figures 7–9. Natural frequencies are listed for the truncated cone number 1 along with theoretical results obtained from finite element analysis in Table 8. Similar results for the truncated cone number 2 are shown in Table 9.
Comparison between natural frequencies of truncated cone #1 (experiment and theory).
| Mode No. | Experimental natural freq. (Hz) | Theoretical natural freq. (Hz) | Difference (%) |
|---|---|---|---|
| f1=f2 | 26.9 | 26.8 | -0.3 |
| f3=f4 | 33 | 32.8 | -0.7 |
| f5=f6 | 76.6 | 76.3 | -0.3 |
| f7=f8 | 88.9 | 88.3 | -0.7 |
| f9=f10 | 147.6 | 146.6 | -0.7 |
| f11=f12 | 165.1 | 164.1 | -0.6 |
| f13=f14 | 241.1 | 237.3 | -1.6 |
| f15=f16 | 264.5 | 260.7 | -1.5 |
Comparison between natural frequencies of truncated cone # 2 (experiment and theory).
| Mode no. | Experimental natural freq. (Hz) | Theoretical natural freq. (Hz) | Difference (%) |
|---|---|---|---|
| f1=f2 | 41.9 | 42.4 | 1.3 |
| f3=f4 | 52.8 | 53.6 | 1.4 |
| f5=f6 | 119.5 | 119.9 | 0.4 |
| f7=f8 | 139.8 | 140.6 | 0.6 |
| f9=f10 | 228.7 | 229.5 | 0.4 |
| f11=f12 | 253.4 | 256.4 | 1.2 |
| f13=f14 | 370.9 | 370.3 | -0.2 |
| f15=f16 | 400 | 402.7 | 0.7 |
As can be seen in Tables 8 and 9, the difference between the experimental and theoretical natural frequencies is about -0.8% for truncated cone number 1 and about 0.7% for truncated cone number 2.
6.2 Experimental and finite element modal analysis results after autoclave treatment
In order to see the effect of autoclave treatment on the natural frequencies of the truncated cones, experimental modal analysis was repeated on the autoclave-treated truncated cones. The magnitude of FRFs for truncated cone number 1 and truncated cone number 2 in which the excitation was performed at point 1 and the responses were collected from point 1 (H11) are shown in Figures 11 and 12, respectively. FRF graphs before the autoclave treatment are also shown for comparison purposes. As can be seen, the peaks of the FRF graphs were shifted to the left after autoclave treatment. This means that the natural frequencies were decreased for both truncated cones after autoclave treatment.

Comparison between FRF graphs for truncated cone # 1 before and after autoclave treatment.

Comparison between FRF graphs for truncated cone # 2 before and after autoclave treatment.
The natural frequencies of truncated cone number 1 and truncated cone number 2 before and after autoclave treatment are listed in Tables 10 and 11, respectively. As can be seen from these two tables, the first eight natural frequencies of truncated cone number 1 decreased by an average of 6.6% and those of truncated cone number 2 by an average of 8.8%.
Comparison between experimental natural frequencies of truncated cone # 1 (before and after autoclave).
| Mode no. | Before autoclave freq. (Hz) | After autoclave Freq. (Hz) | Difference (%) |
|---|---|---|---|
| f1=f2 | 26.9 | 25.3 | -5.9 |
| f3=f4 | 33 | 30 | -9.1 |
| f5=f6 | 76.6 | 72.2 | -5.8 |
| f7=f8 | 88.9 | 82.3 | -7.4 |
| f9=f10 | 147.6 | 138.4 | -6.2 |
| f11=f12 | 165.1 | 155.2 | -6.0 |
| f13=f14 | 241.1 | 225.8 | -6.3 |
| f15=f16 | 264.5 | 248 | -6.2 |
Comparison between experimental natural frequencies of truncated cone # 2 (before and after autoclave).
| Mode no. | Before autoclave freq. (Hz) | After autoclave freq. (Hz) | Difference (%) |
|---|---|---|---|
| f1=f2 | 41.9 | 38.91 | -7.1 |
| f3=f4 | 52.8 | 47.19 | -10.6 |
| f5=f6 | 119.5 | 109.4 | -8.5 |
| f7=f8 | 139.8 | 125.6 | -10.2 |
| f9=f10 | 228.7 | 210.5 | -8 |
| f11=f12 | 253.4 | 230.6 | -9 |
| f13=f14 | 370.9 | 339.5 | -8.5 |
| f15=f16 | 400 | 364.5 | -8.9 |
Regarding this reduction in natural frequencies, the question arises as to what factors are responsible for this reduction. In order to answer this question, the finite element model was updated to take into account the reduction in the thickness of the truncated cones and increase in density after autoclave treatment (see section 5). The theoretical natural frequencies obtained from the updated FEM model along with the experimental ones are listed, for truncated cone number 1 and truncated cone number 2, in Tables 12 and 13, respectively. One can see from these two tables that the updated theoretical natural frequencies are in very good agreement with the experimental ones. So it can be concluded that the change in the natural frequencies after the autoclave treatment is mainly due to the change in the thickness of the truncated cones and density. Consequently, although the material moduli may increase a little bit, this increase is not significant enough to offset the effect of density and thickness changes.
Comparison between natural frequencies of truncated cone # 1 (experiment and theory after autoclave treatment).
| Mode no. | Experimental natural freq. (Hz) | Theoretical natural freq. (Hz) | Difference (%) |
|---|---|---|---|
| f1=f2 | 25.3 | 25 | -1.1 |
| f3=f4 | 30 | 30.6 | +2.1 |
| f5=f6 | 72.2 | 71.3 | -1.2 |
| f7=f8 | 82.3 | 82.6 | +0.3 |
| f9=f10 | 138.4 | 137 | -1 |
| f11=f12 | 155.2 | 153.4 | -1.1 |
| f13=f14 | 225.8 | 221.6 | -1.9 |
| f15=f16 | 248 | 243.7 | -1.8 |
Comparison between natural frequencies of truncated cone # 2 (experiment and theory after autoclave treatment).
| Mode no. | Experimental natural freq. (Hz) | Theoretical natural freq. (Hz) | Difference (%) |
|---|---|---|---|
| f1=f2 | 38.9 | 38.3 | -1.6 |
| f3=f4 | 47.2 | 48.5 | +2.6 |
| f5=f6 | 109.4 | 108.2 | -1.1 |
| f7=f8 | 125.6 | 127.1 | +1.2 |
| f9=f10 | 210.5 | 207.1 | -1.7 |
| f11=f12 | 230.6 | 231.5 | +0.4 |
| f13=f14 | 339.5 | 334 | -1.6 |
| f15=f16 | 364.5 | 363.4 | -0.3 |
7 Scanning electron microscopy
In order to have a comparison between the microstructure of the laminated truncated cones before and after autoclave treatment, the micrographs were obtained by scanning electron microscope (SEM) under the following setting: accelerating voltage=2000 V, working distance=about 10 mm. Observation was made at low magnification (×40) and higher magnification (up to ×1.5k). Figure 13 shows two sections taken from truncated cone number 1 (eight-layer truncated cone); the left one was taken before the autoclave treatment, and the right one was taken after the autoclave treatment. As can be seen, the sample that had the autoclave treatment (right photo) has a very uniform surface and seems to be flawless. In contrast, the surface of the sample that was not treated inside the autoclave shows large defects distributed all over the section. A similar trend can be seen, as shown in Figure 14, for the samples taken before and after autoclave treatment from truncated cone number 2 (13-layer truncated cone). Figures 13 and 14 are representative of the whole sample sections as similar defects can be found all over the section of the non-autoclave-treated samples.

Comparison between autoclave-treated sample (right photo) and non-autoclave-treated sample (left photo) taken from truncated cone # 1.

Comparison between autoclave-treated sample (right photo) and non-autoclave-treated sample (left photo) taken from truncated cone # 2.
Figures 15–17 focus on large defects seen in non-autoclave-treated samples under a higher magnification. As one can see from these images, the large defects are basically dry spots (empty spaces) between fibers where the resin did not flow during the manufacturing process. These defects are continuous and extended elliptical in shape rather than being separated circular spots (like conventional voids). The size of these defects is in order of few hundred micrometers, and it seems that the nature of these defects is different from small voids that are in order of 10 μm and usually can be found in autoclave-molded composite laminates.

Presence of large defects in non-autoclave-treated sample taken from truncated cone # 1.

Presence of large defects in non-autoclave-treated sample taken from truncated cone # 1.

Presence of large defects in non-autoclave-treated sample taken from truncated cone # 2.
8 Discussion
As was shown by scanning electron microscopy, the truncated cones made by AFP had many defects across their cross sections. Most of these defects disappeared after the truncated cones had autoclave treatment. The possible causes of these defects are the manufacturing process parameters and composite tape quality.
The manufacturing process parameters such as the torch temperature, the roller pressure (applied compaction force by AFP head), and the lay-down speed have direct effects on the quality of the laminate. For example, if the torch temperature is not high enough to melt down the resin thoroughly, or if the heating is not evenly distributed across the tape width and thickness, the quality of the laminate is deteriorated, and large defects are made. If the lay-down speed is fast, the heat will not have enough time to be transferred throughout the tape and to melt down the resin. The roller pressure also has a great effect on the quality of the parts. Lack of proper compaction pressure on the composite tape means the layers are not bonded adequately together and also the resin does not flow between fibers.
On the other hand, the quality of the composite tape can be another source of defects in the fiber-placed composites. Any initial defects (e.g., uneven distribution of fiber and resin in the composite tape) can lead to defects inside the laminate after being laid down by AFP. It was observed that even in the same batch of material the quality of the slit tape could vary. Also, due to the manufacturing process of the composite tape, both sides of the tape (top and bottom) are not the same in terms of surface smoothness, which in turn could lead to inconsistency in the laminate quality.
Even though there are more defects in the non-autoclave-treated samples (samples type A) compared to the autoclave-treated samples (samples type B), the frequencies of the former are higher than those of the latter. This is because type A samples also have higher thickness and lower density than those of type B samples.
However, as was shown by modal analysis in this paper, the observed defects in the non-autoclave-treated samples do not have a significant effect on the stiffness of the truncated cones. This is due to the fact that the overall stiffness of the laminate is not affected by small and internal flaws. In that sense, in non-autoclave-treated samples, although the resin did not flow properly to fully connect the fibers, the partial connection between the fibers gives the structure the overall stiffness. However, it is expected that the defects observed in the micrographs have significant effect on strength and fatigue properties of the thermoplastic composite truncated cones. Therefore, one should not rely on the stiffness-dominated properties (e.g., natural frequencies) alone to comment on the quality of the parts.
9 Conclusions
Natural frequencies of two truncated cones made by fiber placement technique (AFP) out of thermoplastic composite material (AS4/PEEK) were experimentally obtained through modal analysis. The stiffness moduli of the AS4/PEEK material were experimentally obtained using test coupons manufactured by the autoclave process. It was assumed that the resin system is fully consolidated in the autoclave process, and as a result, full stiffness moduli are attained. These properties were entered to a finite element model as inputs, and using normal mode analysis, theoretical natural frequencies were then obtained. The results show that the theoretical natural frequencies agree well with the experimental ones. This implies that the overall stiffness moduli of the truncated cones made by AFP are comparable to those of the truncated cones that had autoclave treatment.
In order to see the effect of the autoclave treatment on the natural frequencies, density and thickness of the truncated cones, the two truncated cones were treated inside the autoclave; the experimental modal analysis was repeated, and density and thickness measurements were performed. It was observed that after the autoclave treatment, the thicknesses of both truncated cones were reduced, the density increased, and furthermore, the experimental natural frequencies decreased. After updating the theoretical calculation considering the thickness reduction and density increase, it was revealed that theoretical and experimental natural frequencies were in a very good agreement. This implies that the decrease in the natural frequencies was due to the change in the geometry and density.
Micrographs were obtained by SEM from both truncated cones before and after autoclave treatment. It was observed that non-autoclave-treated samples have large defects all over their cross sections compared to the autoclave-treated ones, which has almost flawless sections. In spite of the presence of the defects, the natural frequencies of the truncated cone were not affected. So, in general, one cannot assure acceptable quality of the part based on the stiffness-dominated properties of the part (e.g., natural frequencies) alone, and evaluation of other properties (e.g., strength, void content, etc.) is necessary.
Acknowledgments
The authors of this paper would like to acknowledge the support of this research by CRIAQ (Consortium for Research and Innovation in Aerospace in Quebec), Bell Helicopter Canada, Bombardier Inc., and Dema Aerospace. Furthermore, considerable help and instrumentation support provided by Dr. S. Rakheja, faculty member of Mechanical and Industrial Engineering Department at Concordia University, are gratefully appreciated. The help and support of Dr. Daniel Rosca with operation of SEM are appreciated.
References
[1] Hoa SV. Principles of the Manufacturing of Composite Materials. DEStech Publications, Inc.: Lancaster, Pennsylvania, 2009.Search in Google Scholar
[2] Schledjewski R. Mechanical Performance of In-Situ Consolidated Thermoplastic Fiber Reinforced Materials,Proceedings of ECCM, Vol. 11. 2004.Search in Google Scholar
[3] Yousefpour A, Ghasemi Nejhad MN. J. Compos Mater. 2001, 14, 129–145.Search in Google Scholar
[4] Ghasemi Nejhad MN, Cope RD, Güçeri SI. J. Compos. Mater. 1990, 4, 29–45.Search in Google Scholar
[5] Ghasemi Nejhad MN. J. Compos. Mater. 1993, 6, 130–145.Search in Google Scholar
[6] Hojjati M, Chouinard G, Youserfpour A. Crystallization Behavior of PEKK Thermoplastic Polymer, SAMPE: Long Beach, 2006.Search in Google Scholar
[7] Cai X, Shadmehri F, Hojjati M, Chen J, Hoa S. Determination of Optimum Process Conditions for Processing AS4/APC-2 Thermoplastic Composites by Automated Fiber Placement, The Society for the Advancement of Material and Process Engineering (SAMPE) conference: Baltimore, MD, 2012.Search in Google Scholar
[8] Shadmehri F, Cai X, Hojjati M, Chen J, Hoa S. Determination of Optimal Process Parameters for Manufacturing Thermoplastic Composite Rings by Automated Fiber Placement, 26 American Society for Composites (ASC) Annual Technical Conference (the Second Joint US-Canada Conference on Composites: Montreal, Canada, 2011.Search in Google Scholar
[9] Qureshi Z, Swait T, Scaife R, El-Dessouky HM. Compos. Part B: Eng. 2014, 66, 255–267.Search in Google Scholar
[10] CYTEC Fiberite Inc, Thermoplastic Composite Materials Handbook (1999).Search in Google Scholar
[11] ASTM D3039/D3039M, Standard Test method for Tensile Properties of Polymer Matrix Composite Materials, American Society for Testing and Materials: Philadelphia, 2009.Search in Google Scholar
[12] ASTM D3410/D3410M. Standard Test method for Compressive Properties of Polymer Matrix Composite Materials with Unsupported Gage Section by Shear Loading, American Society for Testing and Materials: Philadelphia, 2009.Search in Google Scholar
[13] ASTM D5379/D5379M. Standard Test method for Shear Properties of Composite Materials by the V-Notched Beam Method, American Society for Testing and Materials: Philadelphia, 2009.Search in Google Scholar
[14] Brown DL, Allemang RJ, Halvorsen WG. J. Acoust. Soc. Am 1978, 63, 1–81.10.1121/1.2016847Search in Google Scholar
[15] Maia M, Silva M. Phil. Trans. R. Soc. Lond. A 2001, 359, 29–40.Search in Google Scholar
[16] Ewins DJ. Modal Testing: Theory, Practice and Application, Research Studies Press LTD: England, 2000.Search in Google Scholar
©2015 by De Gruyter
This article is distributed under the terms of the Creative Commons Attribution Non-Commercial License, which permits unrestricted non-commercial use, distribution, and reproduction in any medium, provided the original work is properly cited.
Articles in the same Issue
- Frontmatter
- Editorial
- Automated composites manufacturing
- Review
- Modelling the effect of gaps and overlaps in automated fibre placement (AFP)-manufactured laminates
- Original articles
- Simulation and experimental validation of gaps and bridging in the automated fiber placement process
- The effect of the percentage of steered plies on the bending-induced buckling performance of a variable stiffness composite cylinder
- Size-dependent behavior of laminates with curvilinear fibers made by automated fiber placement
- Impact of layup rate on the quality of fiber steering/cut-restart in automated fiber placement processes
- Effect of autoclave process on the quality of thermoplastic composite truncated cones manufactured using automated fiber placement technique
- Design and automated manufacturing of profiled composite driveshafts
- Novel form-flexible handling and joining tool for automated preforming